 Dajiang Meng
 Ruwei Zhang1,2
 Yunqian Lu
 Jiangnan Lin
 Lijie Wang
94% of researchers rate our articles as excellent or good
Learn more about the work of our research integrity team to safeguard the quality of each article we publish.
Find out more
ORIGINAL RESEARCH article
Front. Earth Sci., 10 April 2025
Sec. Solid Earth Geophysics
Volume 13 - 2025 | https://doi.org/10.3389/feart.2025.1582129
This article is part of the Research TopicAdvances in Petrophysics of Unconventional Oil and GasView all 10 articles
Gas hydrate saturation is a critical parameter for quantitative assessment of hydrate reservoirs. To accurately determine gas hydrate saturation, it is essential to consider various morphological occurrences of hydrates and the coexistence of hydrates with free gas. In this study, we devised a method for estimating the saturations of gas hydrate and free gas as well as the hydrate morphologies by employing the generalized effective medium model based on the constrained least squares and trust region method. Four hydrate occurrence morphologies, namely, contact-cementing, grain-coating, load-bearing, and pore-filling, were integrated into the rock physics model, with the coexistence of hydrates and free gas also being considered. We formulated the inversion as a multi-parameter constrained least squares problem and then used the trust region algorithm to find the optimal least-squares solution. The saturations of gas hydrate and free gas, along with the percentages of hydrate morphologies, were computed using the sonic logs at sites GMGS3-W11 and SH-W01-2017 in the Shenhu Area. The predicted hydrate saturation exhibited comparability to the saturation calculated from resistivity log, NMR log, and chloride data. The gas hydrate saturations predicted for these sites using the rock physics model were found to reach maximum values of 54% and 72%, respectively, while the saturation of free gas could attain up to 22%. The quantitative calculation results of hydrate morphologies reveal that in the Shenhu Area, load-bearing hydrates and pore-filling hydrates predominantly coexist, whereas contact-cementing and grain-coating hydrates are relatively fewer. Additionally, the application results indicate that the trust region algorithm demonstrates favorable global convergence.
Gas hydrate is an ice-like crystalline substance formed by gas and water under high-pressure and low-temperature conditions, which widely distributed in sediments of permafrost regions on land and deep-water basins on continental margins (Kvenvolden, 1993). Common hydrate deposits are composed of two layers: the upper layer is the gas hydrate deposit and the lower layer is the free gas deposit (Moridis et al., 2007; Lee and Collett, 2008). The presence of gas hydrate and free gas significantly affects the physical properties of the sediments (Stoll et al., 1971; Dai et al., 2004; Shankar et al., 2013). The P- and S-wave velocities of gas hydrate bearing sediments are much higher than those of pore saturated water sediments. On the contrary, the P-wave velocity of the gas-bearing sediments decreases. Therefore, there is a higher velocity difference between the gas hydrate and free gas layers. This interface is identified as bottom simulating reflector (BSR) in seismic profile (Andreassen et al., 1995; Lee and Collett, 2008). However, the coexistence of gas hydrates and free gas in the stability zone has been confirmed by recent researches (Milkov et al., 2009; Qian et al., 2018; Singhroha et al., 2019; Qin et al.,2020). The sediments with coexisting gas hydrate and free gas exhibits low P-wave velocity accompanied by the slightly high S-wave velocity. Thus, it can be seen, the hydrate layer, the free gas layer and the hydrate and gas coexistence layer can be identified according to the P- and S-wave velocities characteristics of sediments. These identification methods provide important clues for understanding the distribution of gas hydrates and free gas. In addition, the extent of change in seismic velocities depends upon the saturation of gas hydrates and free gas in the sediments. So, the saturation of hydrates and free gas can be calculated by using seismic velocities (Joshi and Ojha, 2022).
In the Shenhu Area, gas hydrates mainly occur in the pores of fine-grained clayey silt (Qian et al.,2017; Ye et al.,2020; Zhang et al., 2020). A small amount of gas hydrates is fracture filling type (Zhang et al.,2020). In the rock physics models, pore- and fracture-filled gas hydrates are simplified as isotropic and anisotropic in gas hydrate-bearing sediments, respectively (Lee and Collett, 2009; Qian et al.,2017). Wang et al. (2011) and Qian et al. (2017) treated gas hydrate as a load-bearing morphology, and calculated the saturation of isotropic and anisotropic gas hydrate-bearing sediments based on the effective medium theory and the layered medium model, respectively, by utilizing the drilling expedition logs of GMGS-1 and GMGS-2. Li et al. (2018) and Qian et al. (2018) reported the coexistence layer of gas hydrate and free gas in this area, and then the respective saturation of gas hydrate and free gas in the coexisting sediment were estimated based on rock physics model by Qin et al. (2020) and Zhan et al. (2022). Although previous studies have paid attention to the influence of gas hydrate morphology on velocity, they have not considered the complexity of gas hydrate morphology and typically assume that gas hydrate occurs in a single morphology or is distributed in a constant proportion, which obviously has shortcomings. To evaluate the saturations of hydrate and free gas more accurately, we assume that gas hydrate occurs in the pores of sediments in four morphologies (contact-cementing, grain-coating, load-bearing and pore-filling), and that free gas is also uniformly distributed in the pore space. The P-and S-wave velocities measured downhole at sites GMGS3-W11 and SH-W01-2017 in Shenhu Area were used to estimate the saturation of gas hydrate and free gas based on the rock physics model. Meanwhile, the percentage content of different gas hydrate morphologies was estimated, which is helpful to understand the influence of gas hydrate morphology on velocity and saturation.
Transforming seismic velocity to hydrate and free gas saturation using rock physics models is a common approach. There are two types of commonly used rock physics models. One is the empirical model based on the statistical relationship between velocity and saturation, such as Weighted Equation proposed by Lee et al. (1996), which is a weighting of the Wood equation (Wood et al., 1944) and the time-averaged equation, where the weighting factor W can be obtained by fitting the given data. The empirical models are simple to use, but have no physical basis and cannot reflect the intrinsic physical interaction between gas hydrate and sediment (Chand et al., 2004). The other is the first principle based rock physics modelling approaches, such as Classical Cementation Theory (Dvorkin and Nur, 1996), Effective Medium Model (Helgerud et al.,1999), Combined Self-consistent Approximation (SCA) and Differential Effective Medium (DEM) (Jakobsen et al.,2000), Modified Biot-Gassmann Equation (Lee, 2002), Modified Effective Medium Model (Sriram et al., 2014; Terry and Knapp, 2018). Using these theoretical models to calculate the relationship between velocity and saturation, we need to assume that gas hydrate is a single type of morphology. However, hydrates occur in a variety of morphologies (Pan et al., 2022a), commonly referred to as contact cementing, grain-coating, load-bearing, pore-filling, matrix-inclusion and fracture-filling (Ecker et al., 1998; Dai et al., 2004; Pan et al., 2020). And these morphologies coexist in sediments (Qian et al.,2017; Collett et al.,2019). It has been recognized that the different morphologies of gas hydrates have different impacts on sediment velocity, which will significantly affect the accuracy of saturation estimate (Yun et al., 2005; Dugarov et al., 2019; Pan et al., 2022b). Pan et al. (2020) propose a generalized effective medium model, which can account for four types of hydrate morphologies, such as contact-cementing, grain-coating, load-bearing and pore-filling separately or jointly. Sonic and density logs from the Northern Cascadia margin, Alaska’s North Slope, and the Mackenzie Delta were used to validate the generalized effective medium model, respectively (Pan et al., 2020). However, Pan et al. (2020) did not consider the coexistence of gas hydrate and free gas. In this paper, the generalized effective medium model will be further used to study the occurrence morphologies of gas hydrate in Shenhu Area of the South China Sea, and the saturation of gas hydrate and free gas will be estimated simultaneously under the coexistence of hydrate and free gas.
The inversion of hydrate saturation, free gas saturation and hydrate morphology through the employment of the rock physics model constitutes a nonlinear inversion problem, for which it is extremely difficult to obtain an analytical solution. We formulated the inversion as a multi-parameter constrained least squares inversion problem. And then the trust region algorithm was adopted to obtain the optimal solution of the least squares problem. The trust region algorithm is one of the most effective methods for solving nonlinear optimization problems and is widely applied in various fields (Conn et al., 2000; Voglis and Lagaris, 2004; Gong and Mcmechan, 2016; Pisnitchenko and Sakamori, 2021). This algorithm is particularly suitable for solving issues such as combinatorial optimization, least squares approximation, and constrained eigenvalue problems (Conn et al., 2000; Voglis and Lagaris, 2004). Many researchers have already applied the trust region algorithm to various geophysical inversion problems, such as full waveform inversion (He and Wang, 2022), high resolution magnetic field data inversion (Beiki and Pedersen, 2012), and reservoir parameter inversion (Pan et al., 2016; Lin et al., 2017; Meng et al., 2020). In this study,the hydrate saturation obtained by our inversion based on the rock physics model using the trust region algorithm is comparable to the hydrate saturation calculated from resistivity log and chloride data, which illustrates the applicability of this method.
Since 2007, multiple hydrate drilling expeditions have been implemented by the Guangzhou Marine Geological Survey in the Shenhu Area. During these expeditions, drilling operations were carried out at about 43 sites (Zhang et al., 2020). Downhole wireline logs were obtained at most of the sites. Additionally, pressure cores were collected at selected locations, thus obtaining numerous hydrate samples. Based on the assessment of chloride ion concentrations in pore water, the maximum hydrate saturation reaches 76%, with an average range between 20% and 40% (Zhang et al., 2020). The thickness of the hydrate layer varies from 10 to 80 m (Qian et al., 2018; Li et al., 2018; Wang et al.,2020). The GMGS3-W11 and SH-W01-2017 wells were drilled by Guangzhou Marine Geological Survey in 2015 and 2017 (Figure 1), respectively. Logging While Drilling (LWD) data were acquired in both sites, and coring was only carried out at site GMGS3-W11. The analysis of well log data and core samples indicates that the gas hydrate reservoir in this area is predominantly composed of fine-grained clayey silt (Figure 2), with a mean grain size ranging from 7 to 8 μm (Kang et al., 2020; Ye et al., 2020). Figures 3, 4 show the LWD logs, including caliper, gamma ray, resistivity, density, P-wave sonic velocity and S-wave sonic velocity. The gas hydrate target intervals are from 1,425 to 1,506 m at site GMGS3-W11 and from 1,476 to 1,520 m at site SH-W01-2017. The free gas target interval is at a depth of 1,520–1,575 m at site SH-W01-2017. The caliper log shows that the boreholes in the target interval is relatively uniform, ensuring the quality of LWD log data (Figures 3a, 4a). The gamma ray log is used to calculate the mineral volume fractions of rock skeleton for sites GMGS3-W11 and SH-W01-2017. And the porosity was calculated by the LWD density (Shankar et al., 2013; Qian et al., 2018).
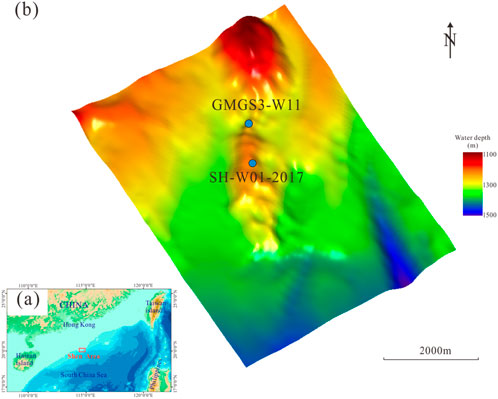
Figure 1. (a) The study area is in the Shenhu Area of the South China Sea, and (b) drilled sites GMGS3-W11 and SH-W01-2017 (blue dots) are indicated in a seafloor map by seismic interpretation.
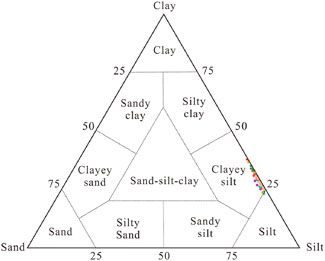
Figure 2. Lithology classification map of hydrate reservoir in Shenhu Area shows that it is clayey silt (Samples were collected from a nearby site in the same ore body, modified from Kang et al., 2020).
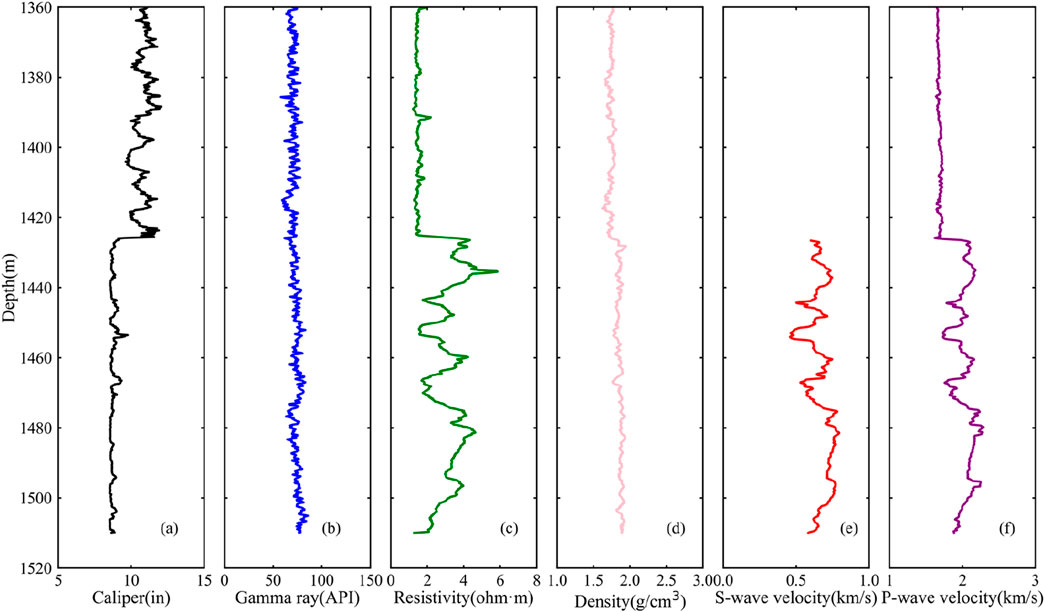
Figure 3. Downhole logs from GMGS3-W11 well: (a) caliper, (b) gamma ray, (c) resistivity, (d) density and (e) S- and (f) P-wave velocities.
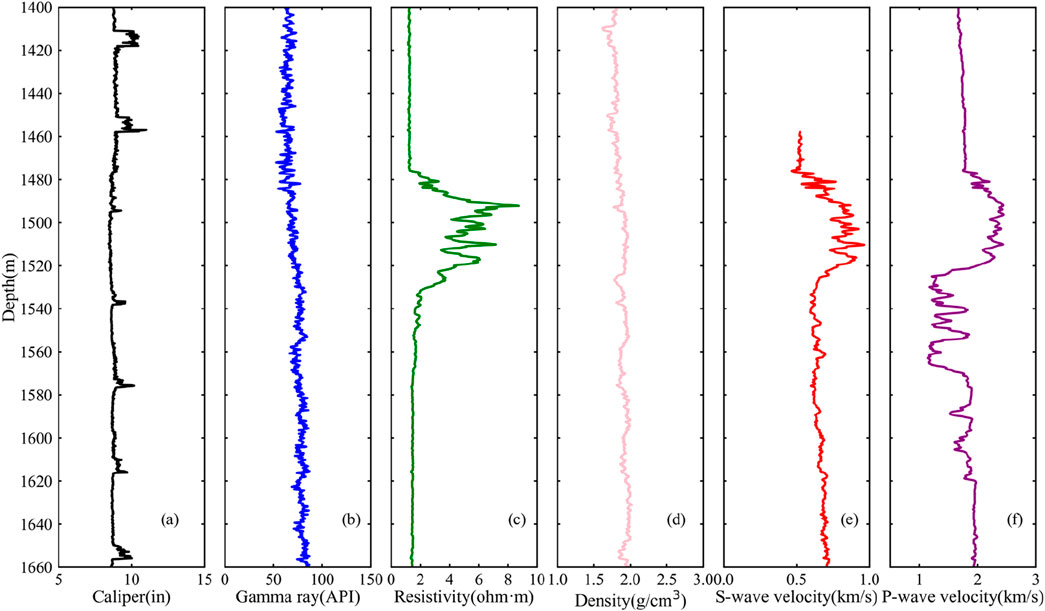
Figure 4. Downhole logs from SH-W01-2017 well: (a) caliper, (b) gamma ray, (c) resistivity, (d) density and (e) S- and (f) P-wave velocities.
The resistivity of the sediment is significantly affected by gas hydrate and free gas. Both gas hydrate and free gas significantly enhance the resistivity of sediments. Therefore, resistivity log cannot distinguish between gas hydrate and free gas, but it can only estimate the total saturation of gas hydrate and free gas. The method of estimating gas hydrate saturation using resistivity logs based on Archie’s (1942) empirical relationship has been widely used (Shankar and Riedel, 2011; Wang et al., 2011; Qian et al.,2018). Although the Archie’s equation is an empirical relationship derived from sandstone, numerous studies have shown that it can still provide useful approximations for predicting the hydrate saturation in fine-grained clayey silt (Collett and Ladd, 2000; Shankar and Riedel, 2011; Wang et al., 2011; Guo et al., 2017; Kang et al., 2020). The key lies in obtaining reasonable Archie’s empirical parameters a, m and n. Currently, the Archie’s constants are usually determined by using the cross plot between porosity and formation factor (Shankar and Riedel, 2011; Wang et al., 2011; Guo et al., 2017).
Archie’s equation (Equation 1) establishes the empirical relationship between the resistivity of saturated water sediments (R0) and that of connate water (Rw) and the equation can be expressed as:
where a and m are Archie constants. ϕ is the porosity derived from the LWD bulk density log (ρb) with ϕ = (ρs-ρb)/(ρs-ρw), where ρs is matrix density with a value of 2.65 g/cm3, and ρw is water density with a value of 1.03 g/cm3. Assuming that this resistivity anomaly is entirely caused by the occurrence of gas hydrate and free gas, the equation for estimating the saturation (Sh, Equation 2) of gas hydrate and free gas by using the resistivity anomaly in a homogeneous medium can be expressed as:
where Rt is the measured formation resistivity and n is an empirical constant. Detailed Archie’s parameters analysis can be found in Wang et al. (2011). In this study, Archie’s constant with a = 2.13, m = 1.703, and n = 1.9386 (derived from Guo et al., 2017) was adopted to calculate the hydrate and free gas saturations, which were then used as the initial values for saturation inversion from sonic velocities for the purpose of result comparison.
There are many rock physics models for calculating gas hydrate saturation based on sediments velocity (Helgerud et al., 1999; Lee, 2002; Sriram et al., 2014; Terry and Knapp, 2018). The velocities estimated by different models are strongly correlated with the occurrence morphologies of gas hydrate in the pores, as shown in Figure 5 (Dai et al., 2004; Qian et al.,2017; Pan et al.,2023). In this study, a generalized effective medium model proposed by Pan et al. (2020) is introduced to calculate the gas hydrate and free gas saturation at sites GMGS3-W11 and SH-W01-2017. Their model considers four morphologies of hydrate occurrence (Figure 5), but does not consider the coexistence of gas hydrate and free gas. To evaluate gas hydrate and free gas saturation simultaneously, the model is improved. The main improvement is the consideration of the coexistence of gas hydrates, free gas and water in the calculation of bulk modulus of pore fluid. We assume that the pore fluid consists of gas hydrates, free gas, and water and is uniformly distributed in the pores (Qian et al., 2018), and the bulk modulus Kf of the pore fluid was calculated by Reuss average (see Equation 14). In addition, when calculating the shear modulus of dry rock, a friction coefficient τ (see Equation 4) was introduced according to the studies of Duffaut et al. (2010) and Dutta et al. (2010) to improve the overestimation of shear modulus. The following is a brief introduction to the principle of the generalized effective model.
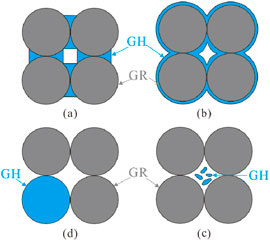
Figure 5. Four types of hydrate morphologies. (a) contact-cementing; (b) grain-coating; (c) load-bearing; (d) pore-filling.
For a dense random packing of identical spheres,the effective dry-rock bulk (Keff) and shear (Geff) modulus at critical porosity can be expressed as (Dutta et al., 2010; Langlois, 2015; Pan et al., 2020):
The parameter C is the coordination number, ϕ c is the critical porosity, vma and Gma are the Poisson ratio and shear modulus of the solid grains, respectively. The α is the pressure-dependent normalized contact-cemented radii (Equation 5; Pan et al., 2020), which can be calculated by the equation:
Where α0 is the initial normalized contact radius with
where AN = β/ΛN, AT = β/ΛT and ΛN = Mc (1-vma)/πGma, ΛT = Gc/πGma, Mc = 2Gc (1-vc)/(1-2vc). β is the classic normalized contact-cemented radius with
Based on the effective medium model of Dvorkin et al. (1999), the effective dry rock moduli at arbitrary porosity can be calculated using the modified Hashin-Shtrikman bounds. For dry rock with arbitrary porosity, its bulk modulus (Kdry) and shear modulus (Gdry) can be obtained by replacing KHM and GHM (the bulk and shear modulus of the Hertz-Mindlin contact model) with Keff and Geff respectively in the relevant equations (Equations 2, 3; Dvorkin et al., 1999).
The saturated sediments bulk (Ksat) and shear (Gsat) moduli can be calculated from Gassmann’s equation (Gassmann, 1951):
Where Kma is the bulk modulus of the solid grains and the parameter Kf is the bulk modulus of pore fluid. The elastic wave velocities can be calculated as
where ρb is the bulk density can be obtained by volumetric weighted average method.
Assume the gas hydrate saturation is Sgh, where the fraction of the load-bearing gas hydrate is flb, the fraction of pore-fluid gas hydrate is fpf, and fhc + flb + fpf = 1. The gas hydrate percentage of the matrix components is fgh = ϕ Sgh flb/(1-ϕ + ϕ Sgh flb). The moduli of the matrix are computed using Voigt-Reuss-Hill average (Hill, 1952) of hydrates and mineral components given as:
where Kh and Gh represent the bulk modulus and shear modulus of gas hydrate, respectively. fi is the volume fraction of the ith component in the solid phase. Ki and Gi are the bulk and shear moduli of the ith component, respectively. The gas hydrate fraction of the pore fluid is Sgh fpf, and assume that the gas hydrate, free gas and water are homogeneously distributed throughout the pore space, then the effective bulk modulus of the composite pore fluid is the Reuss average of the gas hydrate, free gas and water bulk moduli:
where Sg is the saturation of free gas, Kw and Kg is the bulk modulus of water and free gas, respectively. And the bulk density ρb can be expressed as:
where ρi is the bulk density of the ith constituent in the solid phase, ρgh, ρg and ρw are the bulk density of gas hydrate, free gas and water, respectively.
We should note that when gas hydrate becomes a component of the matrix, the original porosity will be reduced to ϕr = ϕ (1- Sgh flb), and ϕr will replace ϕ in the calculation of Kdry, Gdry and Ksat.
The various hydrate morphologies exert distinct influences on the elastic properties of sediment, and the saturation of gas hydrates with multiple morphologies can be anticipated by adjusting the proportions of these different morphologies to fit the observed values. In this part, we introduce the method of predicting gas hydrate saturation, free gas saturation and gas hydrate morphologies by combining P-wave and S-wave velocity based on generalized effective medium model. Figure 6 shows the workflow and required parameters. Firstly, Gamma Ray log and density log were used to calculate the mineral volume fractions (clay, quartz and calcite) of rock skeleton and porosity, respectively, which were used to calculate the bulk and shear moduli of solid phase. And the initial gas hydrate and free gas saturation can be obtained from the resistivity log with Archie’s equation (Archie, 1942). It is assumed that gas hydrates mainly occur in a combination of pore-filling, load-bearing and hybrid-cementing morphologies. The hybrid-cementing hydrates include grain-coating and contact-cementing morphologies, the proportion of which is quantified by setting a weighted cement factor (Wc = 0.2). The load-bearing gas hydrate is a component of the solid phase, which is introduced into the rock skeleton after proportional conversion, and used Hill’s average to calculate the elastic constants of the solid phase (Equations 12, 13). Since hybrid-cementing hydrates affect the stiffness of dry rock, the generalized effective medium model was used to calculate the elastic constants of dry rock. The bulk modulus of pore fluid containing pore-filled hydrates, free gas and water was calculated using the Reuss average (Equation 14). Then, the calculated moduli of solid phase, dry-rock and pore fluid are substituted into Gassmann’s equations (Equations 9, 10) to calculate the elastic moduli of saturated rock,and the P- and S-wave velocities were obtained by substituting the saturated rock moduli into Equations 11, 15. Finally, the P-wave and S-wave velocities obtained from sonic log were compared with velocities predicted based on the model.
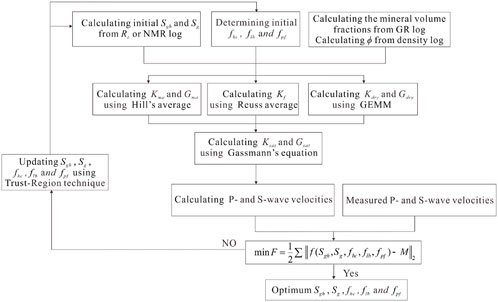
Figure 6. Computational procedure for hydrate and gas saturations and hydrate morphological determination.
The inversion of hydrate saturation, free gas saturation and hydrate morphology was formulated as a multi-parameter optimization problem by using the least square method. The objective function is as follows:
where f (Sgh,Sg,fhc,flb,fpf) is the P-wave velocity, S-wave velocity, and density predicted by the rock physics model, and M represents the observed ones. The parameters Sgh, Sg, fhc, flb, fpf and fpf need to be inverted. Due to the complexity of the rock physics model, it is difficult to obtain the analytical solution of Equation 16. We adopt the Trust-Region technique to solve Equation 16. Trust region technique delimit a disturbance region by giving a control step, and then solve the subproblems in the region to obtain the correction value. Subsequently, according to the convergence of the objective function, it decides whether to accept the disturbance or further adjust the trust region radius to continue the iteration. Supplementary Appendix SA provides the detailed computational procedures for deriving the optimal solutions of parameters Sgh, Sg, fhc, flb, fpf and fpf through the Trust-Region approach.
The parameters that need to be input when calculating the P- and S-wave velocities using the rock physics model include the mineral components of the rock matrix, the mineral moduli, porosity, initial hydrate and free gas saturations, percentages of hydrates in different occurrence morphologies, effective pressure, and some free parameters such as critical porosity, coordination number, and friction coefficient. The mineral components of the rock matrix, the porosity, and the initial saturations of hydrate and free gas were obtained respectively through the interpretation of LWD logs. The bulk modulus, shear modulus and density of sediment constituents are listed in Table 1. The free parameters within the rock physics model were set such that the critical porosity was set at 0.38, the coordination number at 8.5, and the friction coefficient at 0.5 (Dvorkin and Nur, 1996; Mavko et al., 2009; Wang et al., 2011; Terry and Knapp, 2018; Pan et al., 2022a). The approaches for determining the values of these free parameters will be further investigated in the discussion part. As for the initial values of the percentages of hydrates in different occurrence morphologies, we determined them via numerical simulation based on the core data from site GMGS3-W11.
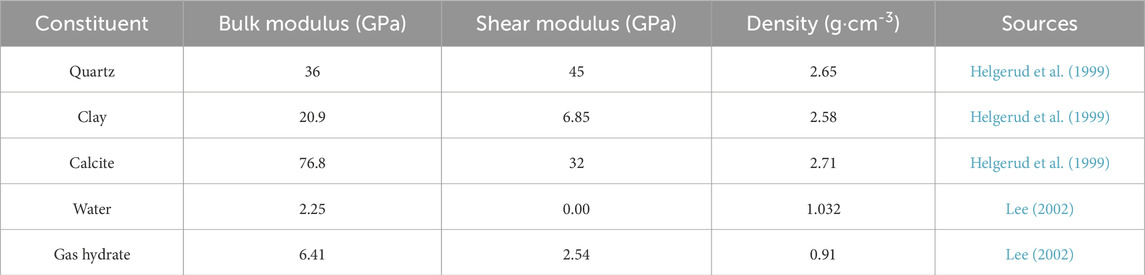
Table 1. Bulk modulus, shear modulus and density of sediment constituents.
The X-ray diffraction analysis of the core samples from site GMGS3-W11 showed that the sediment minerals were mainly composed of quartz, calcite and clay. To simplify the calculation, the average proportions of quartz, calcite, and clay were taken as 55%, 11%, and 34% respectively, which were then considered as the constituents of the rock matrix. Subsequently, we simulated the variations of four hydrate occurrence morphologies (contact-cementing, grain-coating, load-bearing and pore-filling) and the mixed occurrence morphology (hybrid-cementing: load-bearing: pore-filling = 0:0.7:0.3) with the hydrate saturation when the porosity was 0.39 (Figure 7). The blue dots in Figure 7 represent the core data, with the hydrate saturation and velocity derived from the core pore water chloride data and sonic waves at the corresponding positions. The hydrate core samples are mainly concentrated between the load-bearing and pore-filling states and show a good match with the simulation of the mixed occurrence morphology (brown curve in Figure 7). Therefore, we set the initial values of the contact-cementing hydrate fhc = 0.0, the load-bearing hydrate flb = 0.7, and the pore-filling hydrate fpf = 0.3, respectively.
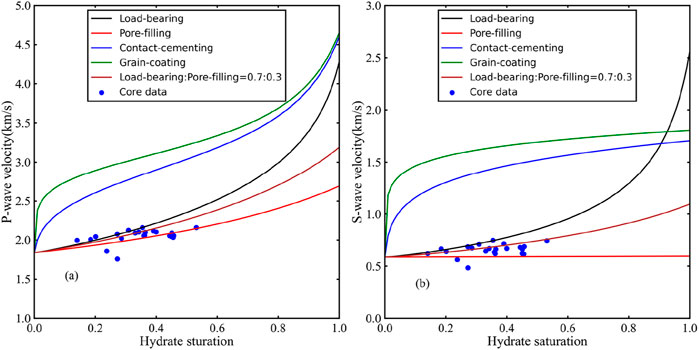
Figure 7. Variation Relationship of P-wave velocity (a) and S-wave velocity (b) with hydrate saturation in hydrate-bearing sediments of different occurrence morphologies.
Based on the above-set initial values, the generalized effective medium model was employed to generate curves of different hydrate saturations and free gas saturations for sites GMGS3-W11 and SH-W01-2017, and a comparison was made with the sonic logs (Figures 8, 9). It can be observed that the P- and S-wave curves of hydrates with zero saturation overlap with the sonic curves of the parts without hydrates and free gas, which indicates that the setting of the initial parameters is reasonable (Figures 8, 9). It can be preliminarily inferred that the hydrate saturation at site GMGS3-W11 is approximately ∼30–40% and there is no free gas (Figure 8). Similarly, at site SH-W01-2017, the hydrate saturation is approximately ∼40–60% and the free gas saturation is approximately ∼10–20% (Figure 9). Besides, at the bottom simulating reflector (BSR) of site SH-W01-2017, after the sediment contains free gas, the P-wave velocity decreases sharply (Figure 9b), while the shear wave velocity increases slightly (at 1,521–1,530 m in Figure 9c). Such velocity characteristics indicate the possible coexistence of hydrates and free gas.

Figure 8. The velocity curves of different hydrate saturations simulated based on the generalized effective medium model at site GMGS3-W11: (a) Saturation obtained from the resistivity log, (b) P-wave velocity, (c) S-wave velocity.
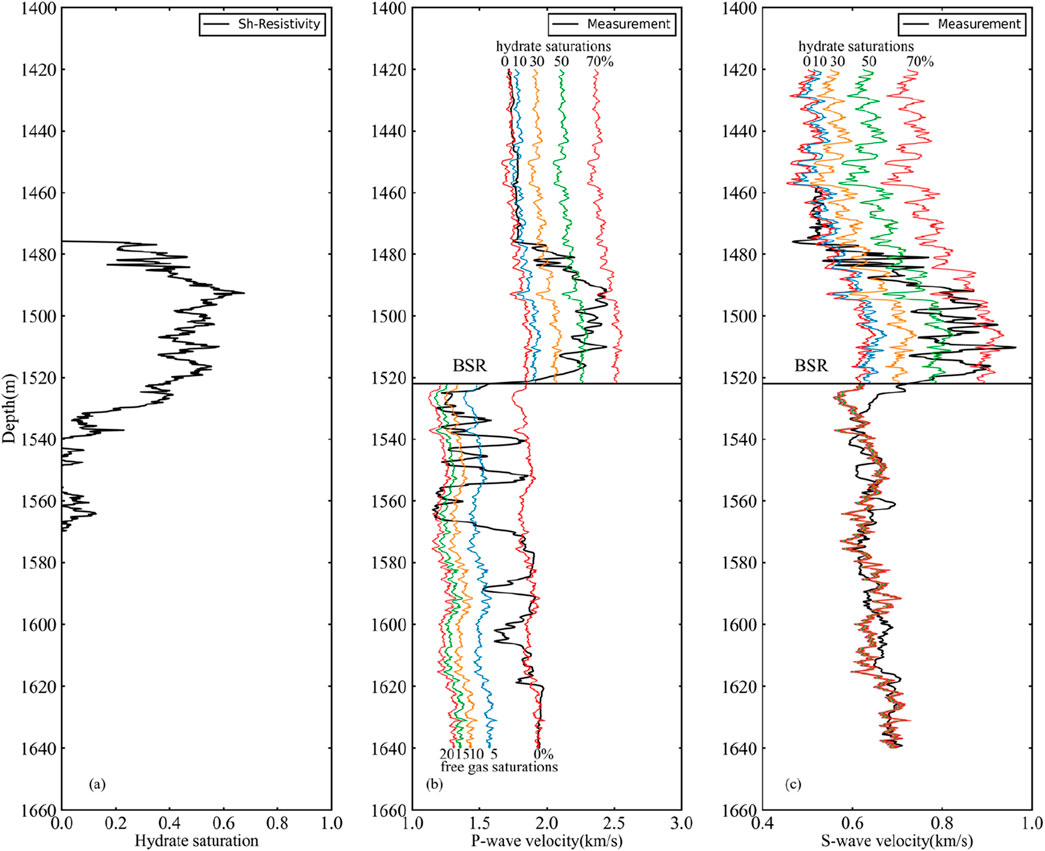
Figure 9. The velocity curves of different hydrate saturations (above BSR) and gas saturations (below BSR) simulated based on the generalized effective medium model at site SH-W01-2017: (a) Saturation obtained from the resistivity log, (b) P-wave velocity, (c) S-wave velocity.
As shown in Figures 10, 11, the hydrate saturation, free gas saturation and fractions of hybrid-cementing, load-bearing and pore-filling morphologies at sites GMGS3-W11 and SH-W01-2017 are estimated by using the generalized effective medium model with combined P- and S-wave velocities based on constrained least squares and trust region method. The velocity predicted by the generalized effective medium model is in good agreement with the measured velocity, which proves that the parameters used in the model seem to be reasonable (Figures 10a,b, 11a,b).
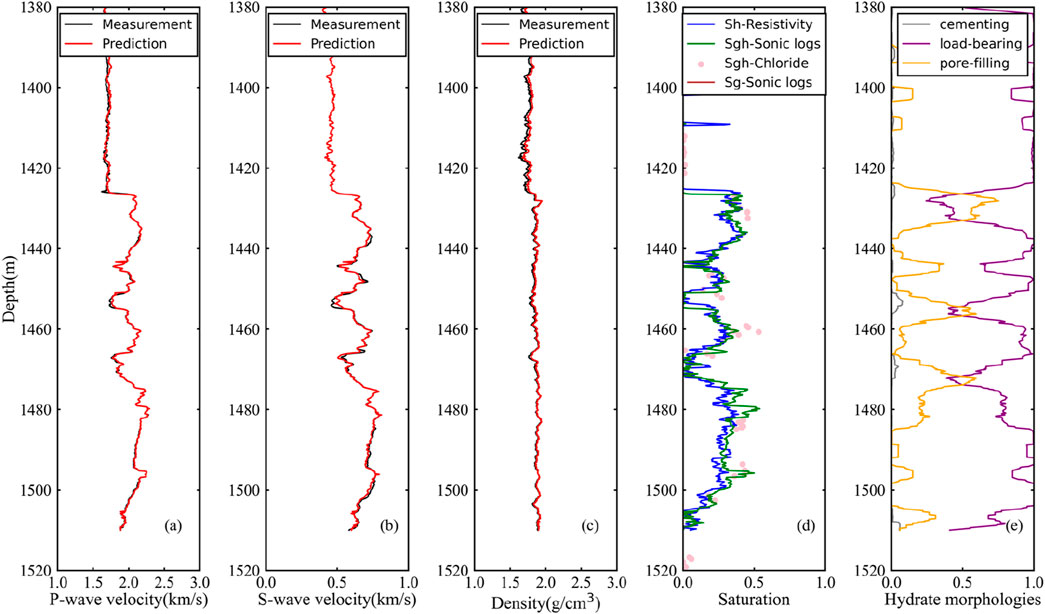
Figure 10. Inversion results at site GMGS3-W11. (a) P-wave velocity, (b) S-wave velocity, (c) Density, (d) Saturation, (e) Hydrate morphologies. The red curve denotes the predicted velocities using rock physics model and the black curve represents the measured velocities. The predicted gas hydrate saturation based on the generalized effective medium model is represented by the green curve (Sgh-Sonic logs) and the calculation of hydrate saturation from resistivity log is in blue (Sh-Resistivity). The pink dots denote the hydrate saturation calculated from the chloride data (Sgh-Chloride). The fractions of hybrid-cementing, load-bearing, and pore-filling are represented by grey, purple, and orange curves, respectively.
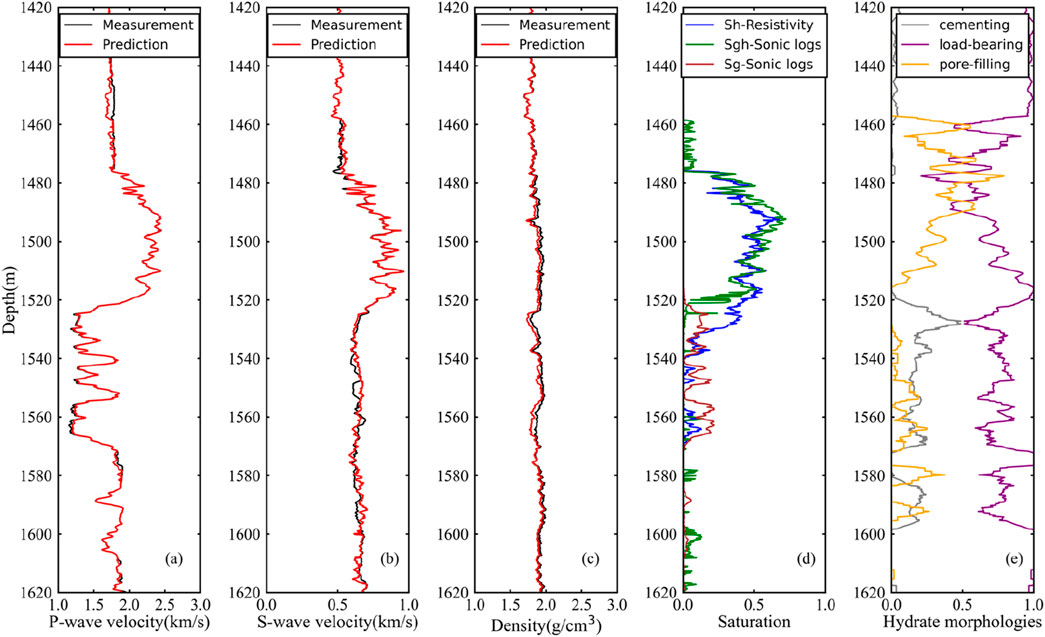
Figure 11. Inversion results at site SH-W01-2017. (a) P-wave velocity, (b) S-wave velocity, (c) Density, (d) Saturation, (e) Hydrate morphologies. The red curve denotes the predicted velocities using rock physics model and the black curve represents the measured velocities. The predicted gas hydrate saturation based on the generalized effective medium model is represented by the green curve (Sgh-Sonic logs) and the calculation of hydrate saturation from resistivity log is in blue (Sh-Resistivity). The predicted free gas saturation is denoted by the brown curve (Sg-Sonic logs). The fractions of hybrid-cementing, load-bearing, and pore-filling are represented by grey, purple, and orange curves, respectively.
In Figure 10d, the green curve is the estimated gas hydrate saturation from the P- and S-wave velocities, and the blue curve is the estimated saturation from the resistivity log. The hydrate saturation is also predicted from chloride concentration (pink dots in Figure 10d) using the equation Sh = (1 - Clpw/Clsw)/ρh (Yuan et al., 1996; Wang et al., 2011), where ρh is the density of gas hydrate, Clpw represents the concentration of chloride in the pore water of the core samples, Clsw is the in-situ baseline pore water chlorinity which is obtained by the trend of the chloride concentration of the non-aqueous layer. The average and maximum of gas hydrate saturation calculated using rock physics model, resistivity log and chloride data at site GMGS3-W11 are shown in Table 2. At the depth range of 1425–1473 m, the average estimated hydrate saturation is 23.2% with a maximum value of 45.1% at 1436 m. It is close to the saturation estimated by resistivity logs but lower than those estimated from chloride data (Figure 10c). At the depth range of 1474–1510 m, the average estimated hydrate saturation is 28.3% with a maximum value of 53.9% at 1480m, which is slightly higher than the saturation estimated by resistivity logs and chloride data (Figure 10d). In addition, no free gas was found at site GMGS3-W11.
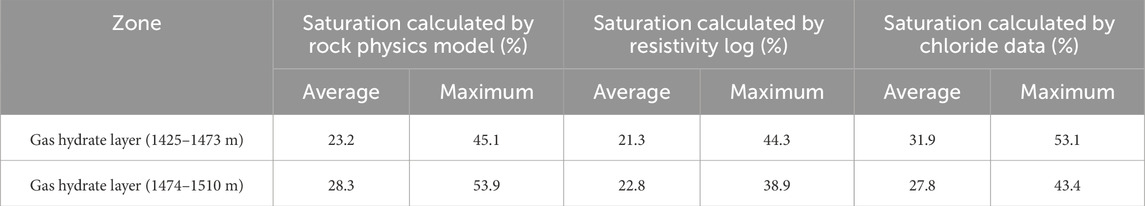
Table 2. The average and maximum of gas hydrate saturation calculated using rock physics model, resistivity log and chloride data at site GMGS3-W11.
The estimated results of hydrate and free gas saturation at site SH-W01-2017 are shown in Figure 11d. And the average and maximum saturation of gas hydrate, coexistence and free gas layers calculated by rock physics model and resistivity log are shown in Table 3. It should be noted that in the coexistence layer in Table 3, the resistivity saturation is the total saturation of gas hydrate and free gas. At the depth range of 1,476–1516 m, the hydrate saturation estimated from the P - and S - wave velocities is in good agreement with the saturation estimated from resistivity logs, while the free gas saturation is nearly zero, indicating that only hydrates are occur in this depth interval (Figure 11d). At the depth range of 1517–1530 m, the maximum hydrate saturation estimated by resistivity is ∼55.4%, which is much higher than the hydrate saturation estimated by the P - and S - wave velocities. This is because the saturation calculated by resistivity is the total saturation of hydrates and free gas. The average estimated hydrate saturation is 10.3% with a maximum of 46.1% at 1,517 m, and the average estimated free gas saturation is 10.7% with a maximum of 18.1% at 1,529 m, indicating the coexistence of hydrates and free gas in the 1,517–1,530 m depth interval. At the depth range of 1,531–1,570 m, the estimated hydrate saturation tends to zero, while the maximum free gas saturation is ∼21.9%, which is higher than the saturation estimated by resistivity, indicating that only free gas exists in this interval (Figure 11d). The main reason for the low saturation of the resistivity calculation is that the clay content of the sediments near 1,530 m is increasing. It can be seen from Figure 4b that the Gamma ray of this zone gradually increases, indicating an increase in clay content. Clay minerals such as montmorillonite and kaolinite adsorb many cations due to their own characteristics, and cation movement under the electric field will enhance the sediment conductivity and reduce the resistivity, and the saturation calculated according to Archie’s formula will be lower (Sahoo et al., 2018). This effect is more prominent in the low saturation gas layer, which is easy to lead to the underestimation of gas saturation.
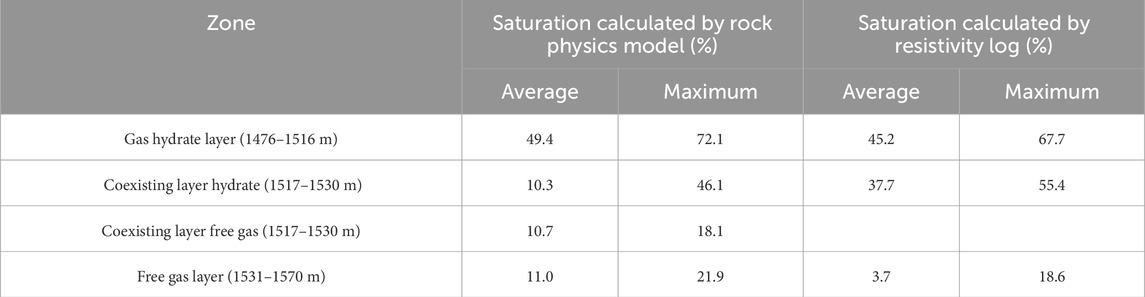
Table 3. The average and maximum saturation of gas hydrate, coexistence and free gas layers calculated by rock physics model and resistivity log at site SH-W01-2017.
Based on the above calculation results, only gas hydrates are occurred at site GMGS3-W11, with high P- and S- wave velocities and resistivity (Figure 3). At site SH-W01-2017, it can be divided into a hydrate layer (1,517–1,530 m), a coexistence layer of hydrates and free gas (1,517–1,530 m), and a free gas layer (1,531–1,570 m). In the coexistence layer, both hydrates and free gas are present, making the sediment have the characteristics of a decreased P - wave velocity, a slightly higher S - wave velocity, and high resistivity (Figure 11). The free gas layer only has a low P-wave velocity and high resistivity, with no abnormal S-wave velocity (Figure 11).
The calculation results of the volumetric fraction of hybrid-cementing, load-bearing and pore-filling morphologies at sites GMGS3-W11 and SH-W01-2017 are shown in Figures 10e, 11e. The average volume fractions of load-bearing, pore-filling, and hybrid-cementing morphologies in the hydrate layer are shown in Table 4. At site GMGS3-W11, the main morphologies of the hydrates are load-bearing and pore-filling, while the hybrid-cementing hydrates are extremely scarce, and the average volume fractions of load-bearing hydrates and pore-filling hydrates are 79% and 20% respectively (Figure 10e). At site SH-W01-2017, in the hydrate layer (1,476–1,516 m), the main morphologies of hydrates are also load-bearing and pore-filling, and their average volume fractions are 67% and 33% respectively (Figure 11e). However, a small amount of hybrid-cementing hydrate appeared in the coexistence layer (1,517–530 m), and their average volume fraction is 18% (Figure 11e). We have also found that there seemingly exists an inherent correlation between the morphologies of hydrate and saturation. At the high hydrate saturation magnitudes, load-bearing hydrates are preponderant; at the low hydrate saturation magnitudes, the proportion of pore-filling hydrates increases.
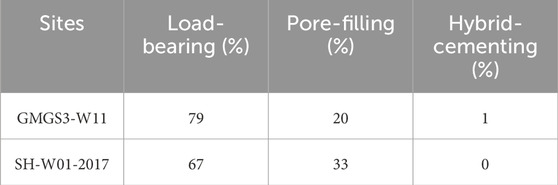
Table 4. The average volume fractions of load-bearing, pore-filling, and hybrid-cementing morphologies in the gas hydrate layer at sites GMGS3-W11 and SH-W01-2017.
The accuracy of the estimation of saturation and hydrate morphology is mainly affected by the quality of well log data, the rock physics model and the inversion algorithms. The quality of downhole logging data is closely related to borehole conditions. The well log data measured under poor borehole conditions is unreliable. The hydrate target intervals selected for this study (1,425–1,510 m at site GMGS3-W11 and 1,476–1,516 m at site SH-W01-2017) have uniform boreholes as determined by caliper logs (Figures 2a, 3a), and the well log data are reliable. However, at depths of 1,539 m and 1,578 m in the free gas target layer at site SH-W01-2017 (Figure 4a), there are undulating changes in the caliper logs, and the calculation results in this layer may be affected.
The performance of the rock physics model depends on its input parameters. The porosity and mineral components in the model are all calculated from downhole log data. In addition, there are some free parameters, including critical porosity, coordination number, and friction coefficient. The critical porosity is the boundary between consolidated rock and unconsolidated rock. Generally, the critical porosity of unconsolidated sandstone sediments is 0.36–0.4 (Nur et al., 1998; Mavko et al., 2009). The hydrate occurs in fine-grained clayey silt in Shenhu Area (Ye et al., 2020; Zhang et al., 2020), which belongs to unconsolidated sediment. The critical porosity value is determined through the cross-plot of the compressional wave modulus and porosity (Figure 12) (Nur et al., 1998). Then, the background velocity calculated by the rock physics model is compared with the measured sonic velocities. It is found that when the critical porosity is 0.38, the two velocities match well (Figures 8, 9).
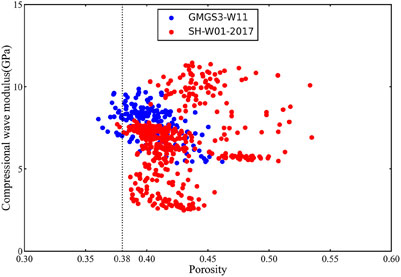
Figure 12. The cross-plot of the compressional wave modulus and porosity establishes that the critical porosity is approximately 0.38.
The coordination number is the average number of contacts between each skeleton particle and the surrounding particles, which increases with the enhancement of compaction. Current research suggests that the coordination number is a function of porosity or pressure and varies between 4 and 12 (Mavko et al., 2009). Terry and Knapp (2018) compared the functional relationship between coordination number and porosity proposed by Mavko et al. (2009) and Dutta (2009) respectively, and believed that they are not applicable at present, especially for the calculation of coordination number of high-porosity sediments without any guidance. Dutta (2009) and Zhang et al. (2013) studied the coordination number as a function of pressure, but there are significant differences in the calculated coordination numbers of the two. Indeed, by establishing a reasonable constant for the coordination number, one can achieve predictive results with acceptable levels of error, as demonstrated by Zimmer (2003). Therefore, according to the functional relationship between coordination number and porosity proposed by Mavko et al. (2009), an approximate coordination number of 8.5 can be derived by using the average porosity in the Shenhu Area.
The coefficient of friction, which reflects the particle roughness, mainly affects the sediment shear modulus. The Hertz-Mindlin model (Mindlin, 1949) assumes that the particles are infinitely rough and non-sliding, overestimating the shear modulus, resulting in a larger predicted shear wave velocity. The friction coefficient can be used to adjust the estimation results of the shear modulus and improve the accuracy of the estimated velocity. The friction coefficient is between 0 and 1. Figure 13 is a comparison of the calculated P-wave and S-wave velocities when the friction coefficients are 0, 0.5, and 1 respectively with the measured velocities. The influence of the friction coefficient on the S-wave velocity is stronger than that on the P-wave velocity. This is because the calculation equation of bulk modulus does not contain the friction coefficient (Equation 3), while the calculation equation of shear modulus contains the friction coefficient (Equation 4). Similar studies can also be seen in the research of Bachrach and Avseth (2008) and Duffaut et al. (2010). When the friction coefficient is 0, it represents perfectly smooth sphere, without considering the friction between spherical particles, so the estimated velocities is lower than the measured velocities. When the friction coefficient is 1, it represents infinitely rough sphere, the estimated velocities are higher than the measured velocities, especially the S-wave velocity is much higher than the measured ones. After giving a constant friction coefficient of 0.5, the closeness between the estimated S-wave velocity and the measured S-wave velocity is improved (Figure 13b). The calculation method and physical meaning of the friction coefficient are discussed in detail by Terry and Knapp (2018) and Duffaut et al. (2010). The method for calculating the friction coefficient in this paper is obtained by calibrating the calculated background velocity with the measured background velocity. We set the friction coefficient as a constant, which is somewhat different from Terry and Knapp (2018). Terry and Knapp (2018) believe that the friction coefficient varies with depth, however, accurately quantifying this depth-dependent friction coefficient remains a challenging task.
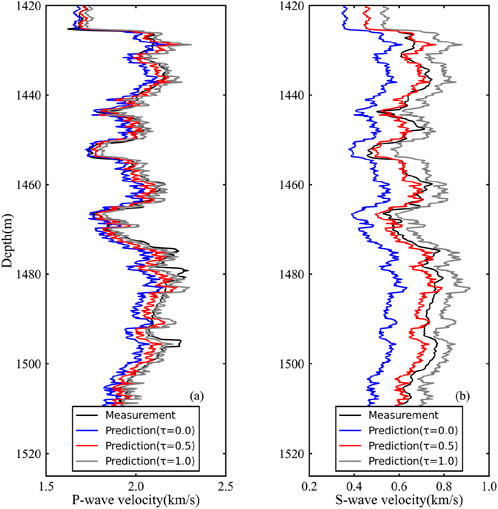
Figure 13. Modeled velocities versus well-log observations from Site GMGS3-W11: (a) P-wave velocity from log data (black), modeled P-wave velocity for τ = 0, τ = 0.5 and τ = 1, (b) S-wave velocity from log data (black), modeled P-wave velocity for τ = 0, τ = 0.5 and τ = 1.
Although determining the free parameters in the rock physics model is quite challenging, we have determined relatively accurate free parameters through empirical speculation and numerical simulations, thus alleviating the problem of multiple solutions in inversion results to a certain extent.
The results of nonlinear inversion are influenced not only by the quality of logging data and rock physics models but also by inversion algorithms. The trust region algorithm is mainly affected by the initial value and the search radius. Figure 14 shows the convergence curves of the objective function with different search radii and initial values. In the case of the same initial value, different search radii only affect the convergence speed and have a relatively small impact on the results (Figure 14a). Figure 14b shows the convergence curves of the objective function with different initial values. The black curve is the saturation interpreted from logging data as the initial solution, while the blue and green curves are the two sets of saturation randomly generated as the initial values. And the initial values of the proportions of different hydrate morphologies were kept the same. The initial error of the randomly generated initial values is larger than that of the log interpretation, and it takes a larger number of iterations to converge. The results show that although the search radii and initial values are different, the trust region algorithm can still obtain the same results after sufficient iterations. This indicates that the trust region algorithm has good global convergence.
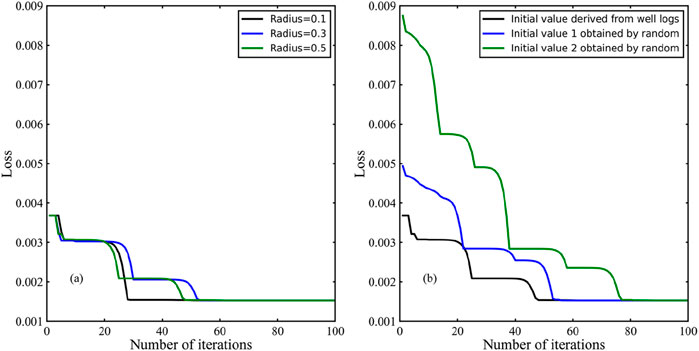
Figure 14. Convergence curves of the objective function with different search radii (a) and initial values (b).
Although inversion is inherently characterized by multiple solutions, the inversion results in accordance with the actual situation can also be obtained when the input parameters are reasonable, the logging data are of high quality and the nonlinear inversion algorithm is effective.
Hydrate morphology is very important for the method of estimating saturation from measured P- and S-wave velocities by using rock physics modeling. Usually, the method of velocity fitting is adopted to obtain hydrate morphologies with a fixed proportion or assume that hydrates are in a single morphology. In the Shenhu Area, Wang et al. (2011) and Qian et al. (2017) assumed that hydrates are in the load-bearing morphology. Qin et al. (2020) assumed that hydrates are in the load-bearing morphology and pore-filling morphology. Zhan et al. (2022) assumed that hydrates are in the contact-cementing morphology and pore-filling morphology (pore-filling hydrate: 80%, contact cementing hydrate: 20%). Inspired by the research of Pan et al. (2020), considering the case where the hydrate morphology is variable, we quantitatively invert the contents of different hydrate morphologies through the best fitting of P- and S-wave velocities. Figures 10a,b, 11a, b shows the fitting results of P-wave and S-wave velocities at sites GMGS3-W11 and SH-W01-2017 respectively. The good consistency seems to illustrate that the hydrate morphology inversion is reasonable. At sites GMGS3-W11 and SH-W01-2017, the average proportions of load-bearing hydrates are 79% and 63% respectively, and the average proportions of pore-filling hydrates are 20% and 33% respectively. This indicates that hydrates in the Shenhu Area may be mainly load-bearing hydrates. At the same time, the difference in hydrate occurrence morphologies at the two sites also indicates the heterogeneous distribution characteristics of hydrates.
In addition, hydrate morphology is related to saturation (Figures 10, 11). At low hydrate saturation, pore-filling hydrates increase. At high hydrate saturation, load-bearing hydrates are dominant. This hydrate morphological characteristic is similar to the growth process of artificial hydrate (THF hydrate) samples observed in the laboratory by Yun et al. (2005) and Kingston et al. (2008) in excess-water environment. In excess-water environment, at low hydrate saturation, hydrates nucleate in the pore space and are pore-filling, having limited influence on the shear stiffness of sediments. Until the hydrate saturation reaches 40%, it begins to interact with the grain framework, and hydrates gradually change to the load-bearing (Yun et al., 2005; Kingston et al., 2008). The microscale process of hydrates in the Shenhu Area is speculated to be possibly related to deep pyrolysis gas. The pyrolysis gas transported over long distances may more easily form an excess-water environment (Yun et al., 2005). According to the research of Zhang et al. (2020), deep and large faults and gas chimneys are developed in the Shenhu Area, which control the migration of deep pyrolysis gas to the bottom boundary of the stability zone and provide sufficient gas source conditions for the development of high-abundance natural gas hydrate reservoirs.
The saturation of hydrate-bearing sediments predicted by using the P-wave and S-wave velocities based on multi-hydrate morphology is in good agreement with the saturation predicted by resistivity log and chloride data. The average saturations of hydrate-bearing sediments calculated by the rock physics model, resistivity log, and chloride data are 32%, 29%, and 30% respectively, indicating that high-saturation hydrates are developed in the Shenhu Area. Previous researchers have also used nearby drilling wells to calculate the saturation of hydrate-bearing sediments through the chloride data, NMR logs, sonic logs, resistivity logs, and sonic logs in the Shenhu Area, as shown in Table 5. The average hydrate saturations calculated by chloride data, NMR logs and resistivity logs are close, which are 31%, 32%, and 31% respectively (Kang et al., 2020; Qin et al., 2020). Assuming that the hydrates are in the load-bearing morphology, the average hydrate saturations estimated by the effective medium model (Wang et al., 2011) and the Three-phase Biot theory (Qian et al., 2018) using sonic logs are 22% and 25% respectively, which are lower than the average saturations obtained from chloride data (Qin et al., 2020), NMR logs (Ye et al., 2020) and resistivity logs (Kang et al., 2020). However, when it is assumed that hydrates exist in multiple occurrence morphologies, including load-bearing and pore-filling morphologies (Qin et al., 2020), and pore-filling and contact cementing morphologies (Zhan et al., 2022), the average saturation calculated by the effective medium model is 28%, which is closer to the saturation calculated from other types of logging data. The reason is that hydrates in the load-bearing form, as a component of the solid phase, influence the bulk modulus and shear modulus of sediments simultaneously by reducing porosity and strengthening intergranular contact. In contrast, pore-filling hydrates only increase the bulk modulus of pore fluids, without altering the bulk and shear moduli of the sediment framework. Therefore, when all hydrates are regarded as being in the load-bearing morphology, the bulk and shear moduli will be overestimated, resulting in higher predicted P-wave and S-wave velocities and an underestimated hydrate saturation. Assuming the coexistence of multiple hydrate morphologies and considering that the hydrate morphology is variable rather than constant, the average hydrate saturation calculated by the generalized effective medium model is similar to the results obtained by core samples and resistivity logs. The rock physics model considering the coexistence of hydrates in multiple forms appears to be more suitable.
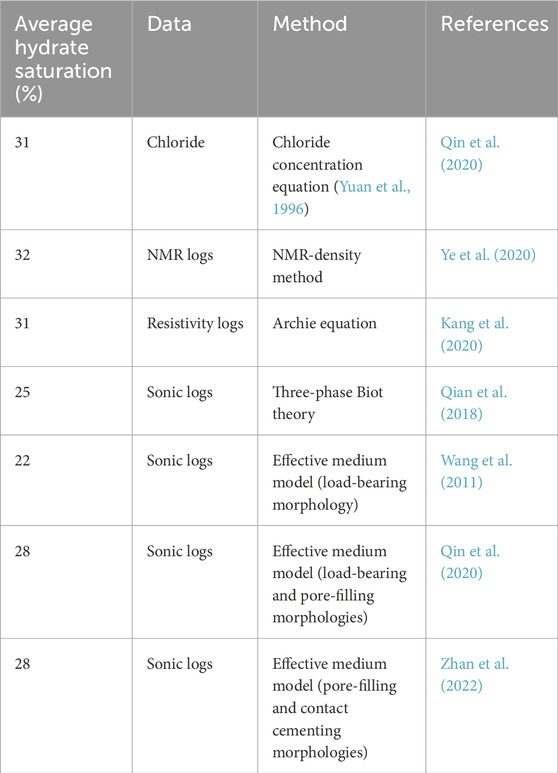
Table 5. Hydrate saturation was obtained from the chloride data, NMR logs, resistivity logs, and sonic logs in hydrate-bearing sediments in the Shenhu Area.
The average saturation of free gas in coexisting layer is 10.7% with a maximum value of 18.1% at site SH-W01-2017. Qin et al. (2020) used NMR logs and Zhan et al. (2022) used rock physics model to calculate the average saturation of free gas in coexistence layer in Shenhu Area was 13.2% and 17%, respectively. Compared with other similar fine-grained reservoir research areas, the free gas saturation is significantly higher than that of the Blake Ridge (maximum saturation 4.8%) (Collett and Ladd, 2000), the Krishna-Godavari Basin (maximum saturation of 2.2%) (Shankar et al., 2013). In fine-grained sediments, the presence of high-saturation hydrates and free gas is not common. This is because fine-grained sediments possess extremely small pore radii, leading to strong capillary forces that tend to inhibit the migration of gas and the formation of hydrates (Bai et al., 2024). Highly saturated hydrates are commonly found in coarse-grained sediments, such as the Bay of Bengal (65%–85% hydrate saturation) (Holland et al., 2019), the northern Gulf of Mexico (50%–90% hydrate saturation) (Boswell et al., 2012), the Mackenzie Delta in western Canada (hydrate saturation over 80%) (Dallimore and Collett, 2005). It is believed that the abundance of foraminifera is the key factor for the occurrence of high saturation hydrates in the fine-grained sediments of Shenhu Area. The presence of foraminifera increases the pore space of fine-grained sediments and reduces the capillary force (Wang et al., 2011; Qian et al., 2018). In addition, the fragmentation of foraminifera shells may also provide a more efficient space for gas hydrate formation (Chen et al., 2013; Li et al., 2016). The presence of foraminifera not only enhances the permeability of sediments, but also provides nucleation sites for the formation of gas hydrates, which is conducive to gas migration and hydrate accumulation (Zhang et al., 2020). Nevertheless, the presence of foraminifers is not an essential precondition for the appearance of highly saturated hydrates (Zhang et al., 2020). The matching and coupling of various geological conditions, such as close to the hydrocarbon generation center, sufficient supply of gas, multiple favorable gas migration channels, and high reservoir porosity, have promoted the formation of high-saturation hydrate reservoirs in the fine-grain sediments of Shenhu Area.
Assuming the coexistence of multiple morphologies of hydrates, the hydrate saturation and free gas saturation at sites GMGS3-W11 and SH-W01-2017 in the Shenhu Area of the South China Sea were calculated by employing the generalized effective medium model based on the least squares and trust region method. The rock physics model of the coexistence of multi-morphological hydrates can better fit the P-wave and S-wave velocities, making the predicted hydrate saturation closer to the saturation calculated by resistivity log and chloride data. The average saturation of the hydrate layer calculated based on the rock physics model is 32% with a maximum of 72%. There is a coexistence layer of hydrates and free gas at site SH-W01-2017. The coexistence layer is characterized by a reduced P-wave velocity, a slightly higher S-wave velocity and a high resistivity. The average hydrate saturation in the coexistence layer is 10% with a maximum of 46%, and the average free gas saturation is 11% with a maximum of 18%. And the results of quantitative hydrate inversion indicate that hydrates in the Shenhu Area have multiple occurrence morphologies, with load-bearing and pore-filling hydrates being predominant, and hybrid-cementing hydrates being scarce. Furthermore, the experimental results demonstrate that the solutions calculated by the trust region algorithm are rather insensitive to the search radius and initial value. Through sufficient iterations, these solutions always converge to similar results, which verifies its excellent global convergence and significant application value in scientific research and engineering calculations.
Besides the above-mentioned points, the rock physics model in this study is isotropic, overlooking the anisotropic features of gas hydrates. Additionally, the velocity attenuation caused by gas hydrates was not considered. For future studies, we’ll employ more diverse data, such as high-resolution seismic, well-logging, and core data, to explore the gas hydrate rock physics model. This will assist in devising more accurate models incorporating anisotropy and velocity attenuation and in exploring advanced inversion techniques to improve the precision of gas hydrate resource evaluations.
The original contributions presented in the study are included in the article/Supplementary Material, further inquiries can be directed to the corresponding author.
DM: Conceptualization, Data curation, Formal Analysis, Funding acquisition, Investigation, Methodology, Project administration, Resources, Software, Supervision, Validation, Visualization, Writing–original draft, Writing–review and editing. RZ: Funding acquisition, Methodology, Project administration, Writing–review and editing. YG: Writing–review and editing. BZ: Formal Analysis, Funding acquisition, Methodology, Project administration, Writing–review and editing. YL: Data curation, Investigation, Methodology, Writing–review and editing. JL: Funding acquisition, Investigation, Supervision, Writing–review and editing. LW: Investigation, Methodology, Supervision, Writing–review and editing.
The author(s) declare that financial support was received for the research and/or publication of this article. This study was financially supported by National Key R&D Program of China (No. 2024YFF0506801), Natural Gas Hydrate Resource Exploration Level II Project in Key Sea Areas of the South China Sea (DD20230064), Fine evaluation and geological design of natural gas hydrate production test target Level III Project in the South China Sea (DD20221705) and Science and Technology Program of Guangzhou, China (2024A04J3510).
The authors declare that the research was conducted in the absence of any commercial or financial relationships that could be construed as a potential conflict of interest.
The author(s) declare that no Gen AI was used in the creation of this manuscript.
All claims expressed in this article are solely those of the authors and do not necessarily represent those of their affiliated organizations, or those of the publisher, the editors and the reviewers. Any product that may be evaluated in this article, or claim that may be made by its manufacturer, is not guaranteed or endorsed by the publisher.
The Supplementary Material for this article can be found online at: https://www.frontiersin.org/articles/10.3389/feart.2025.1582129/full#supplementary-material
Andreassen, K., Hart, P. E., and Grantz, A. (1995). Seismic studies of a bottom simulating reflection related to gas hydrate beneath the continental margin of the Beaufort Sea. J. Geophys. Res. Solid Earth 100, 12659–12673. doi:10.1029/95jb00961
Archie, G. (1942). The electrical resistivity log as an aid in determining some reservoir characteristics. Trans. Aime 146 (01), 54–62. doi:10.2118/942054-G
Bachrach, R., and Avseth, P. (2008). Rock physics modeling of unconsolidated sands: accounting for nonuniform contacts and heterogeneous stress fields in the effective media approximation with applications to hydrocarbon exploration. Geophysics 23 (6), E197–E209. doi:10.1190/1.2985821
Bai, C., Su, P., Xu, X., Zhang, Y., Han, S., and Liang, J. (2024). Controlling effect of particle size on gas hydrate enrichment in fine-grained sediments. Earth Space Sci. 11. doi:10.1029/2024EA003594
Beiki, M., and Pedersen, L. B. (2012). Estimating magnetic dike parameters using a non-linear constrained inversion technique: an example from the Särna area, west central Sweden. Geophys. Prospect. 60, 526–538. doi:10.1111/j.1365-2478.2011.01010.x
Boswell, R., Collett, T. S., Frye, M., Shedd, W., Mcconnell, D. R., and Shelander, D. (2012). Subsurface gas hydrates in the northern Gulf of Mexico. Mar. Petroleum Geol. 34 (1), 4–30. doi:10.1016/j.marpetgeo.2011.10.003
Chand, S., Minshull, T. A., Gei, D., and Carcione, J. M. (2004). Elastic velocity models for gas-hydrate-bearing sediments-a comparison. Geophys. J. Int. 159, 573–590. doi:10.1111/j.1365-246x.2004.02387.x
Chen, F., Su, X., Lu, H. F., Zhou, Y., and Zhuang, C. (2013). Relations between biogenic component (Foraminifera) and 977 highly saturated gas hydrates distribution from Shenhu Area, northern South China Sea. Earth Sci. 38 (5), 907–915. (in Chinese with English abstract). doi:10.3799/dqkx.2013.089
Collett, T. S., Boswell, R., Waite, W. F., Kumar, P., Roy, S. K., Chopra, K., et al. (2019). India national gas hydrate Program expedition 02 summary of scientific results: gas hydrate systems along the eastern continental margin of India. Mar. Petroleum Geol. 108, 39–142. doi:10.1016/j.marpetgeo.2019.05.023
Collett, T. S., and Ladd, J. (2000). Detection of gas hydrate with downhole logs and assessment of gas hydrate concentrations (saturations) and gas volumes on the Blake Ridge with electrical resistivity log data. Proc. Ocean Drill. Program. Sci. Results. Ocean Drill. Program 164, 179–191. doi:10.1016/j.marpetgeo.2018.09.024
Conn, A. R., Gould, N. I. M., and Toint, P. L. (2000). Trust region methods. Philadelphia: Society for Industrial and Applied Mathematics Press.
Dai, J., Xu, H., Snyder, F., and Dutta, N. (2004). Detection and estimation of gas hydrates using rock physics and seismic inversion: examples from the northern deepwater Gulf of Mexico. Lead. Edge 23 (1), 60–66. doi:10.1190/1.1645456
Dallimore, S. R., and Collett, T. S. (2005). Scientific results from the mallik 2002 gas hydrate production research well Program, Mackenzie Delta, northwest territories, Canada. Geol. Surv. Can. Bullitin, Ott. 585, 140. doi:10.4095/220702
Duffaut, K., Landrø, M., and Sollie, R. (2010). Using Mindlin theory to model friction-dependent shear modulus in granular media. Geophysics 75, E143–E152. doi:10.1190/1.3429998
Dugarov, G. A., Duchkov, A. A., Duchkov, A. D., and Drobchik, A. N. (2019). Laboratory validation of effective acoustic velocity models for samples bearing hydrates of different type. J. Nat. Gas Sci. Eng. 63, 38–46. doi:10.1016/j.jngse.2019.01.007
Dutta, T. (2009). Integrating sequence stratigraphy and rock-physics to inter-pret seismic amplitudes and predict reservoir quality. Stanford University. Ph.D. dissertation.
Dutta, T., Mavko, G., and Mukerji, T. (2010). Improved granular medium model for unconsolidated sands using coordination number, porosity, and pressure relations. Geophysics 75, E91–E99. doi:10.1190/1.3333539
Dvorkin, J., and Nur, A. (1996). Elasticity of high-porosity sandstones: theory for two North sea datasets. Geophysics 61 (5), 1363–1370. doi:10.1190/1.1887538
Dvorkin, J., Prasad, M., Sakai, A., and Lavoie, D. (1999). Elasticity of marine sediments: rock physics modeling. Geophys. Res. Lett. 26 (12), 1781–1784. doi:10.1029/1999GL900332
Ecker, C., Dvorkin, J., and Nur, A. (1998). Sediments with gas hydrates: internal structure from seismic AVO. Geophysics 63, 1659–1669. doi:10.1190/1.1444462
Gassmann, F. (1951). Elastic waves through a packing of spheres. Geophysics 16 (4), 673–685. doi:10.1190/1.1437718
Gong, T., and Mcmechan, G. A. (2016). Target-oriented linear least squares and nonlinear, trust-region Newton inversions of plane waves using AVA and PVA data for elastic model parameters. Geophysics 81, R325–R338. doi:10.1190/geo2015-0471.1
Guo, Y., Yang, S., Liang, J., Lu, J., Lin, L., and Kuang, Z. (2017). Characteristics of high gas hydrate distribution in the Shenhu Area on the northern slope of the South China Sea. Earth Sci. Front. 24 (4), 024–031. (in Chinese with English abstract). doi:10.13745/j.esf.yx.2016-12-28
He, Q., and Wang, Y. (2022). Trust-region versus line search globalization strategies for inexact Newton method and application in full waveform inversion. J. Appl. Geophys. 201, 104639. doi:10.1016/j.jappgeo.2022.104639
Helgerud, M. B., Dvorkin, J., Nur, A., Sakai, A., and Collett, T. (1999). Elastic-wave velocity in marine sediments with gas hydrates: effective medium modeling. Geophys. Res. Lett. 26 (13), 2021–2024. doi:10.1029/1999GL900421
Hill, R. (1952). The elastic behaviour of a crystalline aggregate. Proc. Phys. Soc. Sect. A 65 (5), 349–354. doi:10.1088/0370-1298/65/5/307
Holland, M., Schultheiss, P., and Roberts, J. (2019). Gas hydrate saturation and morphology from analysis of pressure cores acquired in the Bay of Bengal during expedition NGHP-02, offshore India. Mar. Petroleum Geol. 108, 407–423. doi:10.1016/j.marpetgeo.2018.07.018
Jakobsen, M., Hudson, J. A., Minshull, T. A., and Singh, S. C. (2000). Elastic properties of hydrate-bearing sediments using effective medium theory. J. Geophys. Res. Solid Earth 105 (B1), 561–577. doi:10.1029/1999JB900190
Joshi, A. K., and Ojha, M. (2022). Estimation of porosity and gas hydrate saturation by inverting 2D seismic data using very fast simulated Annealing in the Krishna Godavari offshore basin, India. Geophys. Prospect. 70, 388–399. doi:10.1111/1365-2478.13167
Kang, D., Lu, J., Zhang, Z., Liang, J., Kuang, Z., Lu, C., et al. (2020). Fine-grained gas hydrate reservoir properties estimated from well logs and lab measurements at the Shenhu gas hydrate production test site, the northern slope of the South China Sea. Mar. Petroleum Geol. 122, 104676. doi:10.1016/j.marpetgeo.2020.104676
Kingston, E., Clayton, C. R., and Priest, J. (2008). “Gas hydrate growth morphologies and their effect on the stiffness and damping of a hydrate bearing sand,” in 6th international conference on gas hydrate (Canada: British Columbia).
Kvenvolden, K. A. (1993). Gas hydrates—geological perspective and global change. Rev. Geophys. 31 (2), 173–187. doi:10.1029/93RG00268
Langlois, V. (2015). Elastic behavior of weakly cemented contact. Int. J. Numer. Anal. Methods Geomechanics 39, 854–860. doi:10.1002/nag.2342
Lee, M. W. (2002). Modified biot-gassmann theory for calculating elastic velocities for unconsolidated and consolidated sediments. Mar. Geophys. Res. 23 (5), 403–412. doi:10.1023/b:mari.0000018195.75858.12
Lee, M. W., and Collett, T. S. (2008). Integrated analysis of well logs and seismic data to estimate gas hydrate concentrations at Keathley Canyon, Gulf of Mexico. Mar. Petroleum Geol., 25, 924, 931. doi:10.1016/j.marpetgeo.2007.09.002
Lee, M. W., and Collett, T. S. (2009). Gas hydrate saturations estimated from fractured reservoir at Site NGHP-01-10, Krishna-Godavari Basin, India. J. Geophys. Res. Solid Earth 114. doi:10.1029/2008JB006237
Lee, M. W., Hutchinson, D. R., Collett, T. S., and Dillon, W. P. (1996). Seismic velocities for hydrate-bearing sediments using weighted equation. J. Geophys. Res. Solid Earth 101, 20347–20358. doi:10.1029/96JB01886
Li, C., Hu, G., Zhang, W., Ye, Y., Liu, C., Li, Q., et al. (2016). Influence of foraminifera on formation and occurrence characteristics of natural gas hydrates in fine-grained sediments from Shenhu Area, South China Sea. Sci. China Earth Sci. 59, 2223–2230. (in Chinese with English abstract). doi:10.1007/s11430-016-5005-3
Li, J., Ye, J., Qin, X., Qiu, H., Wu, N., Lu, H., et al. (2018). The first offshore natural gas hydrate production test in South China Sea. China Geol. 1 (01), 5–16. doi:10.31035/cg2018003
Lin, T., Meng, X., and Zhang, Z. (2017). The petrophysical parameter inversion method based on constrained least squares and trust region approach. Chin. J. Geophys. in Chin. 60 (10), 3969–3983. doi:10.6038/cjg20171024
Mavko, G., Mukerji, T., and Dvorkin, J. (2009). The rock physics handbook: tools for seismic analysis of porous media. New York, NY: Cambridge University Press.
Meng, D., Wen, P., Zhang, R., Zhao, B., and Li, Y. (2020). Gas hydrate S-wave velocity prediction method basedon effective medium model. Oil Geophys. Prospect. 55 (1), 117–125. (in Chinese with English abstract). doi:10.13810/j.cnki.issn.1000-7210.2020.01.014
Mindlin, R. D. (1949). Compliance of elastic bodies in contact. J. Appl. Mech. 16 (3), 259–268. doi:10.1115/1.4009973
Moridis, G. J., Kowalsky, M. B., and Pruess, K. (2007). Depressurization-induced gas production from class 1 hydrate deposits. Spe Reserv. Eval. and Eng. 10, 458–481. doi:10.2118/97266-pa
Nur, A., Mavko, G., Dvorkin, J., and Galmudi, D. (1998). Critical porosity: a key to, relating physical properties to porosity in rocks. Lead. Edge 17, 357–362. doi:10.1190/1.1437977
Pan, H., Li, H., Chen, J., Riedel, M., Holland, M., Zhang, Y., et al. (2020). Quantification of gas hydrate saturation and morphology based on a generalized effective medium model. Mar. Petroleum Geol. 113, 104166. doi:10.1016/j.marpetgeo.2019.104166
Pan, H., Li, H., Wang, X., Cai, J., Qian, J., Howard, J. J., et al. (2022a). A unified effective medium modeling framework for quantitative characterization of hydrate reservoirs. Geophysics 87 (5), MR219–MR234. doi:10.1190/geo2021-0349.1
Pan, H., Li, H., Zhang, J., Cai, S., Gui, Z., and Du, M. (2023). Joint elastic-electrical effective medium modeling for improved hydrate quantification. Mar. Geophys. Res. 44 (2), 15. doi:10.1007/s11001-023-09524-1
Pan, H., Li, Y., Wei, C., Gui, Z., Li, X., Zhang, X., et al. (2022b). Seismic rock-physics modeling of the complex-morphology hydrate reservoirs and applications. Chin. J. Geophys. 65 (12), 4858–4873. doi:10.6038/cjg2022Q0185
Pan, K., Tang, J., Du, H., and Cai, Z. (2016). Trust region inversion algorithm of high-resolution array lateral logging in axisymmetric formation. Chin. J. Geophys. in Chin. 59 (8), 3110–3120. doi:10.6038/cjg20160833
Pisnitchenko, F., and Sakamori, M. (2021). Efficient spreading strategy for global solution search using a trust-region optimization method: an application to the common-reflection-surface stacking problem. Geophysics 86, R723–R734. doi:10.1190/geo2020-0041.1
Qian, J., Wang, X., Collett, T. S., Dong, D., Guo, Y., Su, P., et al. (2017). Gas hydrate accumulation and saturations estimated from effective medium theory in the eastern Pearl River Mouth Basin, South China Sea. Interpretation 5, SM33–SM48. doi:10.1190/int-2016-0217.1
Qian, J., Wang, X., Collett, T. S., Guo, Y., Kang, D., and Jin, J. (2018). Downhole log evidence for the coexistence of structure II gas hydrate and free gas below the bottom simulating reflector in the South China Sea. Mar. Petroleum Geol. 98, 662–674. doi:10.1016/j.marpetgeo.2018.09.024
Qin, X., Lu, J., Lu, H., Qiu, H., Liang, J., Kang, D., et al. (2020). Coexistence of natural gas hydrate, free gas and water in the gas hydrate system in the Shenhu Area, South China Sea. China Geol. 3 (02), 210–220. doi:10.31035/cg2020038
Sahoo, S. K., Marín-Moreno, H., North, L. J., Falcon-Suarez, I., Madhusudhan, B. N., Best, A. I., et al. (2018). Presence and consequences of coexisting methane gas with hydrate under two phase water-hydrate stability conditions. J. Geophys. Res. Solid Earth 123, 3377–3390. doi:10.1029/2018JB015598
Shankar, U., Gupta, D. K., Bhowmick, D., and Sain, K. (2013). Gas hydrate and free gas saturations using rock physics modelling at site NGHP-01-05 and 07 in the Krishna–Godavari Basin, eastern Indian margin. J. Petroleum Sci. Eng. 106, 62–70. doi:10.1016/j.petrol.2013.04.004
Shankar, U., and Riedel, M. (2011). Gas hydrate saturation in the Krishna–Godavari basin from P-wave velocity and electrical resistivity logs. Mar. Petroleum Geol. 28, 1768–1778. doi:10.1016/j.marpetgeo.2010.09.008
Singhroha, S., Chand, S., and Bünz, S. (2019). Constraints on gas hydrate distribution and morphology in vestnesa ridge, western svalbard margin, using multicomponent ocean-bottom seismic data. J. Geophys. Res. Solid Earth 124 (5), 4343–4364. doi:10.1029/2018jb016574
Sriram, G., Dewangan, P., and Ramprasad, T. (2014). Modified effective medium model for gas hydrate bearing, clay-dominated sediments in the Krishna–Godavari Basin. Mar. Petroleum Geol. 58, 321–330. doi:10.1016/j.marpetgeo.2014.01.005
Stoll, R. D., Ewing, J., and Bryan, G. M. (1971). Anomalous wave velocities in sediments containing gas hydrates. J. Geophys. Res. 76, 2090–2094. doi:10.1029/jb076i008p02090
Terry, D. A., and Knapp, C. C. (2018). A unified effective medium model for gas hydrates in sediments. Geophysics 83, MR317–MR332. doi:10.1190/geo2017-0513.1
Voglis, C., and Lagaris, I. E. (2004). A rectangular trust region dogleg approach for unconstrained and bound constrained nonlinear optimization. Corfu, Greece: Wseas International Conference on Applied Mathematics.
Wang, X., Hutchinson, D. R., Wu, S., Yang, S., and Guo, Y. (2011). Elevated gas hydrate saturation within silt and silty clay sediments in the Shenhu Area, South China Sea. J. Geophys. Res. 116, B05102. doi:10.1029/2010JB007944
Wang, X., Liu, B., Jin, J., Lu, J., Zhou, J., Qian, J., et al. (2020). Increasing the accuracy of estimated porosity and saturation for gas hydrate reservoir by integrating geostatistical inversion and lithofacies constraints. Mar. Petroleum Geol. 115, 104298. doi:10.1016/j.marpetgeo.2020.104298
Wood, W. T., Stoffa, P. L., and Shipley, T. H. (1994). Quantitative detection of methane hydrate through high-resolution seismic velocity analysis. J. Geophys. Res. Solid Earth 99, 9681–9695. doi:10.1029/94jb00238
Ye, J., Qin, X., Xie, W., Lu, H., Ma, B., Qiu, H., et al. (2020). The second natural gas hydrate production test in the South China Sea. China Geol. 3 (02), 197–209. doi:10.31035/cg2020043
Yuan, T., Hyndman, R. D., Spence, G. D., and Desmons, B. (1996). Seismic velocity increase and deep-sea gas hydrate concentration above a bottom-simulating reflector on the northern Cascadia continental slope. J. Geophys. Res. Solid Earth 101 (B6), 13655–13671. doi:10.1029/96jb00102
Yun, T. S., Francisca, F. M., Santamarina, J. C., and Ruppel, C. (2005). Compressional and shear wave velocities in uncemented sediment containing gas hydrate. Geophys. Res. Lett. 32. doi:10.1029/2005GL022607
Zhan, L., Kang, D., Lu, H., and Lu, J. (2022). Characterization of coexistence of gas hydrate and free gas using sonic logging data in the Shenhu Area, South China Sea. J. Nat. Gas Sci. Eng. 101, 104540. doi:10.1016/j.jngse.2022.104540
Zhang, W., Liang, J., Wei, J., Lu, J., Su, P., Lin, L., et al. (2020). Geological and geophysical features of and controls on occurrence and accumulation of gas hydrates in the first offshore gas-hydrate production test region in the Shenhu Area, Northern South China Sea. Mar. Petroleum Geol. 114, 104191. doi:10.1016/j.marpetgeo.2019.104191
Zhang, Z., Han, D., and Mcconnell, D. R. (2013). Characterization of elastic properties of near-surface and subsurface deepwater hydrate-bearing sediments. Geophysics 78 (3), D169–D179. doi:10.1190/geo2012-0385.1
Keywords: rock physics, gas hydrate saturation, hydrate morphology, trust region, least squares
Citation: Meng D, Zhang R, Gu Y, Zhang B, Lu Y, Lin J and Wang L (2025) Estimation of gas hydrate and free gas saturation using the rock physics model based on constrained least squares and trust region method in the Shenhu Area, South China Sea. Front. Earth Sci. 13:1582129. doi: 10.3389/feart.2025.1582129
Received: 24 February 2025; Accepted: 20 March 2025;
Published: 10 April 2025.
Edited by:
Xin Sun, Sinopec Matrix Co., LTD., ChinaReviewed by:
Haojie Pan, Yangtze University, ChinaCopyright © 2025 Meng, Zhang, Gu, Zhang, Lu, Lin and Wang. This is an open-access article distributed under the terms of the Creative Commons Attribution License (CC BY). The use, distribution or reproduction in other forums is permitted, provided the original author(s) and the copyright owner(s) are credited and that the original publication in this journal is cited, in accordance with accepted academic practice. No use, distribution or reproduction is permitted which does not comply with these terms.
*Correspondence: Dajiang Meng, ZGFqaWFuZzYyM0AxNjMuY29t
Disclaimer: All claims expressed in this article are solely those of the authors and do not necessarily represent those of their affiliated organizations, or those of the publisher, the editors and the reviewers. Any product that may be evaluated in this article or claim that may be made by its manufacturer is not guaranteed or endorsed by the publisher.
Research integrity at Frontiers
Learn more about the work of our research integrity team to safeguard the quality of each article we publish.