
94% of researchers rate our articles as excellent or good
Learn more about the work of our research integrity team to safeguard the quality of each article we publish.
Find out more
ORIGINAL RESEARCH article
Front. Earth Sci., 01 April 2025
Sec. Geochemistry
Volume 13 - 2025 | https://doi.org/10.3389/feart.2025.1578863
 Xiaotao Zhang1
 Xuemin Xu1*Bin Shen1Zhichao Xu1Jiajia Yang1Jing Qin1Caizhi Hu1Shizhen Li2
 Taotao Cao3Yanran Huang3
 Tao Tian4
Shale pore structure and gas resource evaluation are greatly influenced by the development and evolution of organic matter (OM) pores, which are controlled by the process of hydrocarbon generation. In this paper, hydrocarbon gas generation and OM pore evolution were investigated on a low mature Dalong Formation shale (Ro = 0.78%, TOC = 10.40%) by the high-temperature high-pressure simulation experiments. Results indicated that hydrocarbon gas production rate show a slight increase when Ro < 2.0% and then a rapid increase when Ro > 2.0%. BET surface area and pore volume of the simulated samples increase significantly with the increases of conversion of TOC, thermal maturation level and hydrocarbon production rate, suggesting that the hydrocarbon gas generation process controls the development of OM pores. With increased Ro value, OM pores are primarily developed in amorphous kerogen and solid bitumen at wet gas generation stage and dry gas generation stage, respectively. The BET surface area and pore volume normalized to TOC can be comparable to that of naturally evolved pure kerogen of Niutitang Formations at high maturity stage. After Soxhlet extraction, BET surface area and pore volume generally have significant increase, particularly at main oil generation (Ro = 1.32%) and wet gas generation stages (Ro = 1.83%), due to that the nanometer-sized OM pores are exposed after extraction. Accordingly, an integrated model of OM pore evolution in organic-rich shale was established, and OM pore evolution can be divided into three stages: initial development stage, rapid development stage and slightly destruction stage. The three stages correspond respectively to the three stages of hydrocarbon generation: liquid hydrocarbon to wet gas generation stage, dry gas generation stage, and gas depletion stage. This study further indicates that shale with extremely high maturation degree still has better OM pore development and shale gas potential.
Shale gas has been a focus in the current research due to the depletion of conventional oil and gas in the last few decades (Hao et al., 2013; Soeder, 2018; Li et al., 2022). Unlike conventional oil and gas, shale gas stores directly in the internal pore space of shale without or less being transported (Afagwu et al., 2022; Feng et al., 2023). Hence, it is crucial to investigate shale pore structure variations as well as its evolution features (Gao et al., 2020; Cao et al., 2021). Shale pores can be classified into micropore (pore diameter <2 nm), mesopore (pore diameter between 2 and 50 nm) and macropore (pore diameter >50 nm) in terms of the classification of International Union of Pure and Applied Chemistry (IUPAC) scheme (Sing et al., 1985). Many scholars have widely investigated shale reservoir pores qualitatively and quantitatively by various techniques, such as low pressure N2 gas adsorption (N2GA), low-pressure CO2 gas adsorption (CO2GA), scanning electron microscopy (SEM), mercury injection capillary pressure (MICP) and nuclear magnetic resonance (NMR) (Li et al., 2019a; Cao et al., 2020; Cao et al., 2023). Thestudies have improved the understanding of shale pore types, geometric topological structures, evolutionary process and gas occurrence states in shale gas reservoirs (Jarvie et al., 2007; Chukwuma et al., 2018; Xu et al., 2021; Hu et al., 2022).
Research findings suggest that organic matter (OM) pores are the most important pore type in shale pore system (Zhao et al., 2017; Nie et al., 2018; Li et al., 2019b; Borjigin et al., 2021), which directly control shale porosity, gas content and hydraulic properties of shale gas reservoirs (Song et al., 2016; Sheng et al., 2020). Shale has experienced complex diagenetic process in its natural state, and the thermal evolution process with maturity is the main factor that controls hydrocarbon generation and shale pore development (Fishman et al., 2012; Valenza et al., 2013; Wu et al., 2015; Millken and Curtis, 2016). Previous studies investigated drilled shales with various maturation levels in the southern Sichuan Basin and indicated that OM pores gradually increase with increasing Ro value of 0.5%–1.7%, but decrease when Ro is below 0.5% or above 1.8% (Hu et al., 2023). Thermal maturity are regarded to play a crucial role in OM pore development (Hu et al., 2017). Maturity-related secondary processes such as hydrocarbon generation, cracking, and formation of solid bitumen, exert unique influences on the development of OM porosity (Lis et al., 2025). For the OM-rich Upper New Albany shale, Mastalerz et al. (2013) suggested that maturity exerted the dominated control on the development of porosity, masking the effects of compositional differences. In recent years, more and more scholars also have paid attention to shale pore evolution process and its relevant mechanism, and made great progresses. Studies indicated that not all OM components in shale formation develop pores. For example, OM pores are well developed in Woodford shale, Barnett shale and Longmaxi shale but undeveloped in Haynesville shale and Kimmeridge shale (Curtis et al., 2012a; Ko et al., 2018; Nie et al., 2019). Therefore, some researchers suggested that OM pores are controlled firstly by original kerogen type, which results in significant differences in OM pore development between marine and transitional shales (Jiang et al., 2017; Xi et al., 2018). OM pores have been widely detected in high-mature to over-mature marine shales and are considered to be the main contributor to total porosity (Curtis et al., 2012a; Löhr et al., 2015). These OM pores generally have widths of several nanometers to several micrometers, and therefore provide most storage space for adsorbed gas and free gas (Cao et al., 2022; Zhao et al., 2025). However, transitional shale of Taiyuan Formation-Shanxi Formation shale in Qinshui Basin have shown high total organic carbon (TOC) content, but the development of OM pores varies significantly (Liu et al., 2022). Therefore, it is crucial to investigate the characteristics of macerals and their respective OM pore development, as relying solely on maturity can not always yield conclusive results (Zhang et al., 2025). Recently, most of the researches have been focused on static pore characteristics of natural evolved shales, and it can not.trace the development of shale pores in geological history. Moreover, the experimental analysis of naturally matured shales is inevitably influenced by the heterogeneity of shale component and may not totally obtain the underlying mechanisms of shale pore evolution (Bernard et al., 2012; Milliken et al., 2013; Ko et al., 2018).
To avoid the impact of shale heterogeneity, scholars used thermal simulated experiments on immature to low-maturity shale sample to obtain a series of samples with different Ro values, and then carried out gas adsorption, MICP and SEM tests to investigate dynamic characterization of shale pores and summarized the controlling factors of shale pore development (Guo et al., 2017; Ko et al., 2018; Song et al., 2020; Wang et al., 2020; Wang and Guo, 2021; Hu et al., 2023). Shale pore evolution was considered to be primarily controlled by the hydrocarbon generation and clay mineral transformation (Wang and Guo, 2019; Song et al., 2021). Mastalerz et al. (2013) pointed out that OM porosity development corresponds to the hydrocarbon generation, with shale having higher porosity at early stage (Ro < 1.0%) and late stage (Ro > 1.4%) of hydrocarbon generation, and lower porosity when Ro = 1.0–1.4% due to the infilling of liquid hydrocarbon. Total porosity in the Posidonia shale exhibits a decreasing trend and then an increasing trend with increased thermal maturation, with the minimum value at Ro = 0.85% (Han et al., 2017). Cao et al. (2021) revealed that there are two opportune development periods with corresponding Ro values of 1.11%–1.53% and 2.5%–2.9%, respectively, for shale pore development, which corresponds to the late oil generation stage and the cracking peak of liquid hydrocarbon to gas, respectively. Peng et al. (2019) carried out pyrolysis experiments and determined the limited Ro value for favorable and target areas of shale gas exploration. Wang et al. (2020) and Cao et al. (2021) pointed out that OM pores can be destructed when Ro values at extremely high maturity stage, specifically Ro > 3.5%, due to the graphitization of OM. However, the stepwise changes of OM pores at various maturation stages, as well as the influence of hydrocarbon generation process on pore structure, remain unclear.
According to previous studies, scholars focused mainly in the division of hydrocarbon generation stage, the qualitative research in shale pore structure with variations in thermal maturities, and the establishment of shale pore evolution model. However, variations in shale microstructure throughout hydrocarbon generation process, particularly pore structure heterogeneity to the hydrocarbon generation stages and products, are still poorly understood. Hence, a shale with lower maturity of Upper Permian Dalong Formation from the northwestern Sichuan Basin was collected in this study. Subsequently, a semi-closed pyrolysis experimental instrument was adopted to simulate hydrocarbon generation process, and 11 simulated samples under different temperature points (300–650°C) were obtained, representing different thermal maturation levels. Rock pyrolysis analysis, total organic carbon (TOC) content and whole rock reflectance (Rb) analysis were conducted to examine organic geochemistry of the original and thermally simulated samples. Additionally, N2GA and FE-SEM experiments were performed to investigate pore structure characteristics of simulated samples and their extracted samples. The purposes of this study were designed to be: 1) the purpose of hydrocarbon gas generation; 2) the feature and evolution of shale pores during hydrocarbon gas production; 3) to establish a general model of OM pores for the marine shale of Dalong Formation.
The studied sample was collected from the Changjianggou section in Shangsi town, Guangyuan city, Sichuan Basin. The studied area is located in the northwestern Sichuan Bain, the upper Yangtze Platform (Figures 1A, B). Dalong Formation is primarily composed of silty shale, gray-black shale, and black siliceous shale (Figure 1C), which is deemed to be formed in deep-water anoxic environment (Wei et al., 2018). Previous studies have demonstrated that the Dalong shales have a high TOC content, with δ13Corg values of −28.5‰ to −25.2‰ and Ro value of 0.6%–3.5% (Xia et al., 2010). Specific information of the studied sample is shown in Table 1. The sample is characterized by a high TOC content of 10.40%, Ro value of 0.78%, S1 value of 0.12 mg/g, S2 value of 41.03 mg/g, and δ13Corg value of −27.48‰. These characteristics indicate that the Dalong shale is characterized by type II1 kerogen and has high hydrocarbon gas generation potential.
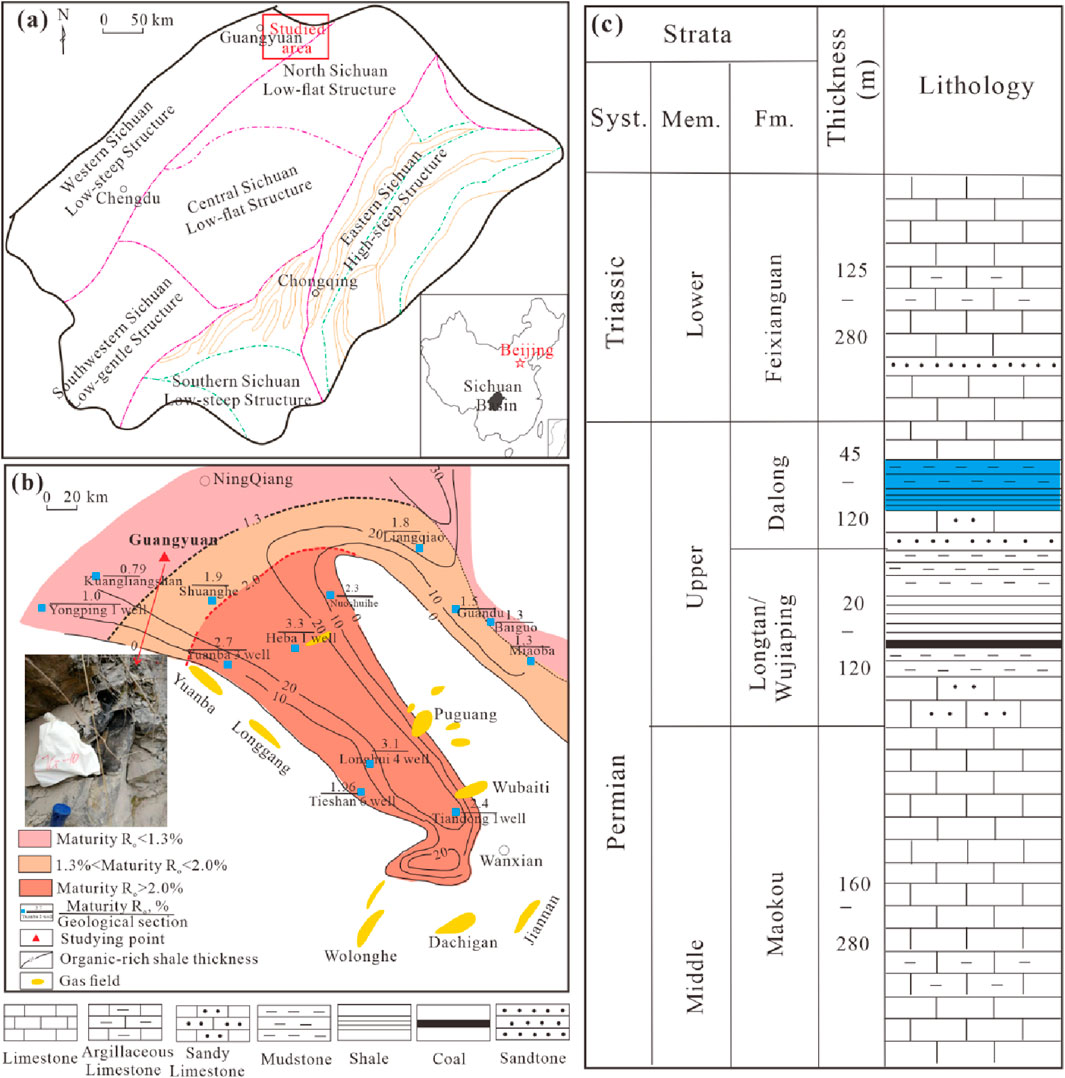
Figure 1. Shale sampling location of Dalong Formation in Sichuan Basin. (a) Geographical location and studied area, (b) sampling site, and (c) lithological column (modified after Cao et al., 2021).

Table 1. Basic geochemical data of the original shale of Dalong Formation.
In order to better understand the evolution mechanism of shale hydrocarbon generation and expulsion, hydrocarbon production rate and variations in organic geochemical parameters, as well as the evolution process of shale pores, thermal simulation experiments were performed constrained by geological conditions of Lower Cambrian Niutitang Formation in ZD1 well (Zhai et al., 2020; Zhang et al., 2021; Figure 2), which is located in the Wulingshan area, southern China and has indicated significant shale gas content (Li et al., 2017). The thermal simulation experiments were performed by a semi-open experimental system in a thermos-compression hydrocarbon generation and expulsion instrument, which was jointly developed by National Research Center for Geoanalysis, Chinese Academy of Geological Science and Nantong Huaxing Petrolum Instrument Co., LTD. Accordingly, 11 temperature points were designed for simulation experiments: 300°C, 325°C, 350°C, 400°C, 425°C, 450°C, 500°C, 550°C, 590°C and 650 °C at a heating rate of 2 °C/min (Table 2). Each temperature setting was maintained for 72 h, and then the sample cell was waited to cool naturally, and hydrocarbon gas yield was collected in terms of Su et al. (2020).
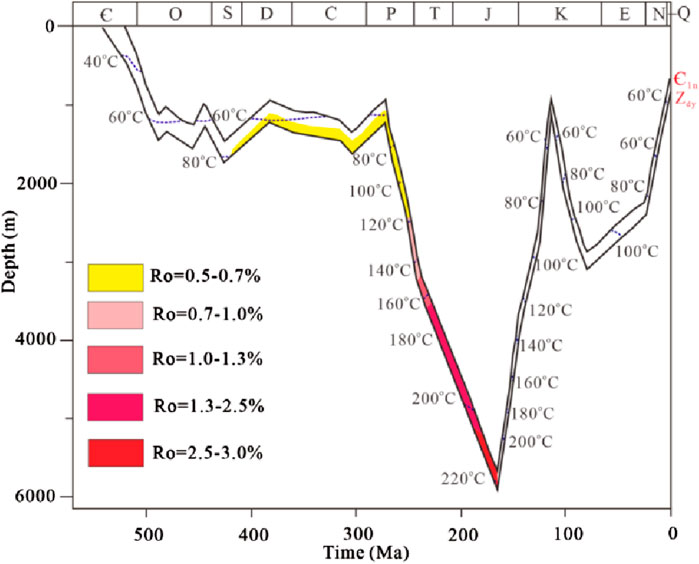
Figure 2. The thermal simulated temperature designed for this study was determined with reference to the thermal burial history of ZD1 well (modified from Zhai et al., 2020).
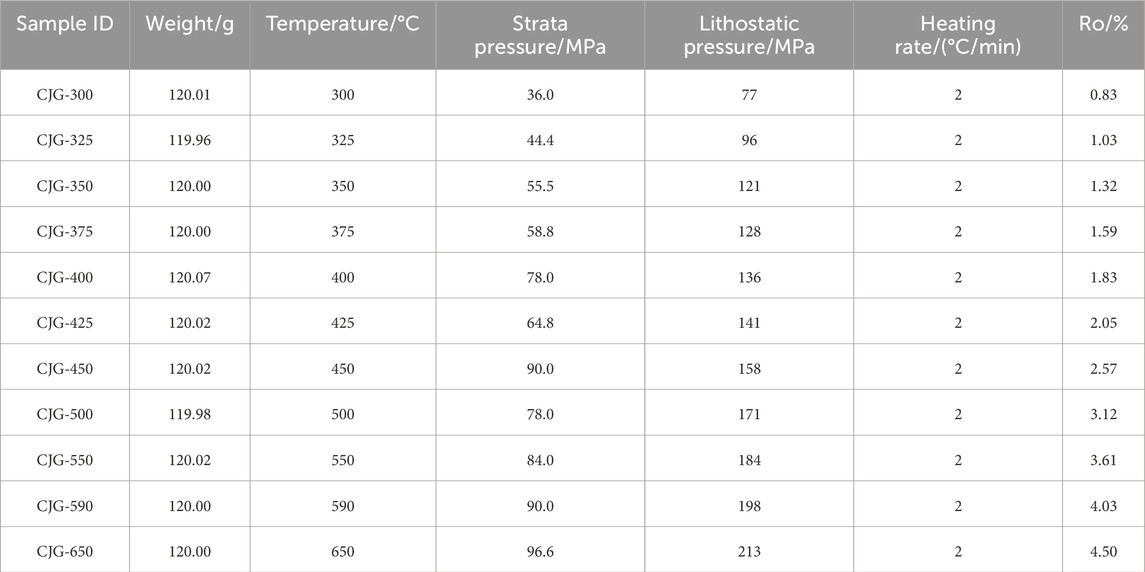
Table 2. Simulation temperature-pressure conditions and yields of hydrocarbon gas products.
Pyrolysis measurement was performed by a Rock-Eval 6 apparatus in terms of industry standards of GB/T18602-2012. Sample with 100 mg was ground to 100–200 μm and heated to 600 C using helium gas as the carrier gas, to acquire geochemistry parameters, i.e., maximum cracking temperature Tmax, free hydrocarbon S1 and cracking hydrocarbon S2, as described by Lafargue et al. (1998). Original and simulated samples were crushed to 150 μm and subsequently analyzed by a LECO CS-344 instrument to obtain the TOC content. Due to lack of vitrinite grain in the studied samples, we firstly measured the Rb value using a MSP-200 microphotometer instrument, and then Ro value was calculated by the formula of Ro = 0.336 + 0.6569Rb proposed by Feng and Chen (1988). This is also the most commonly used formula and approach to obtain the Ro value of marine shale samples.
In this study, only pyrolysis gas production was measured, including hydrocarbon gas and nonhydrocarbon gas. The amount of gas production was gathered and analyzed in terms of pre-designed scheme, and then measured by the Agilent 6890 N gas chromatography (GC) instrument with an HP-5 ms (5%-phenyl-methylpolysiloxane) fused silica capillary column (30 m × 0.25 mm × 0.25 μm). The oven was firstly heated to 50 C for 1 min, subsequently increased to 100 C at 20 C/min, and then to 315 C at 3 C/min, and finally maintained at 315 C for 16 min. The temperature of the injector and ion source were 300 C and 250°C, respectively, with a split mode. Helium gas was used as the carrier gas at a constant flow rate of 1.0 mL/min. The scan range was from 50 to 550 amu in full scan and multiple ion detector mode at 70 eV. The original and simulated samples were extracted. Firstly, the powder residues were dried under vacumm at 40 C for 3–4 h. And then, the dired residues were transferred to a pre-extracted cellulose thimble and Soxhlet extracted with 200 mL dichloromethane: methanol (9:1 vol/vol) for 72 h, in order to comparatively study the influence of extractable OM on pore structure.
N2GA measurement was performed on a Micromeritics ASAP 2460 surface area and pore volume instrument on shale samples before and after Soxhlet extraction to characterize pore surface area and volume. Prior to the test, the samples were powered to less than 80 μm. Then, samples with weight of 0.3–0.5 g were degassed at 110 C in a vacuum for 12 h to remove water substances and gaseous impurities. These treated samples were conducted exposure to liquid nitrogen (−196 C) and a series of precisely controlled gas pressures. The Brunuer-Emmett-Teller (BET) theory and the Braett-Joyner-Halenda (BJH) theory were adopted to determine surface area and pore volume, respectively (Brunauer et al., 1938; Barrett et al., 1951).
FE-SEM observations can obtain a visual depiction of pore morphology, size, type and location of shale. Minerals, pores, and OMs can also be identified from one another by their different gray scales. Simulated samples and extracted samples were firstly mechanically polished by ion milling with an accelerating voltage of 1–5 kV, and subsequently they were coated with layer of C (99.99% purity) approximately 5 nm thick. The treated samples were performed FE-SEM experiments using a ZEISS GEMINI’2 FE-SEM instrument, with an Energy Dispersive Spectroscopy (EDS) that was used for elemental analysis.
The organic geochemical characteristics of all shale samples are displayed in Figure 3 and Tables 1, 3. According to the experimental results, the original samples displayed a high TOC content (TOC = 10.40%) and a low maturity level (Ro = 0.78%).
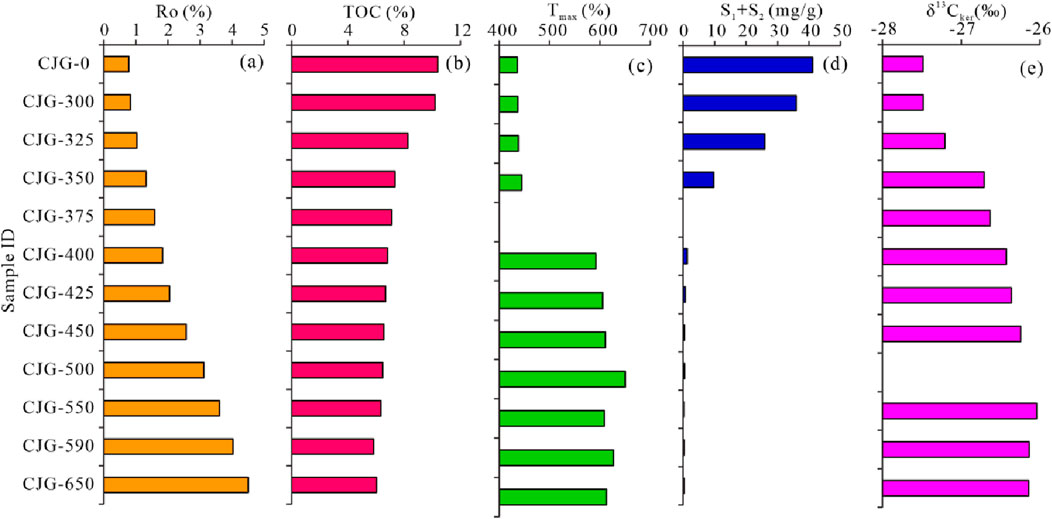
Figure 3. Organic geochemical parameters of original sample and simulated samples under different simulation temperatures. (a) Ro value; (b) TOC; (c) Tmax; (d) S1 + S2; (e) δ13Cker.
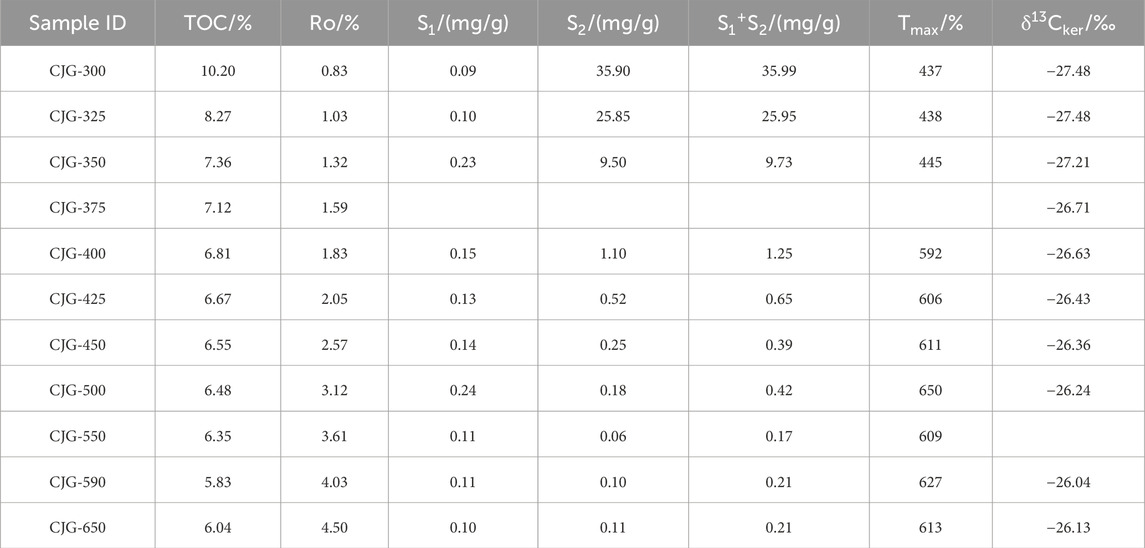
Table 3. Organic geochemical parameters of simulated samples under different pyrolysis temperatures.
In terms of the formula proposed by Feng and Chen (1988), Ro value of the samples after pyrolysis was calculated from the Rb value measured by a MSP-200 microphotometer instrument. According to the Ro value of the simulated samples listed in Table 3, the thermal evolution of the Dalong Formation shale can be divided into three stages according to thermal evolution degree in Figure 3. (1) Low maturity-mature stage: the measured Ro values are 0.78%–1.03%, corresponding to thermal simulation temperatures ranging from unheated to 325°C; (2) High maturity stage: the Ro values are within 1.32%–1.83%, corresponding to thermal simulation temperatures of 350–400°C; (3) Over-maturity stage: the Ro values are greater than 2.05%, corresponding to thermal simulation temperatures of 425–650°C.
As the temperature increases, the TOC content of the samples display a gradually decreasing trend, which decreases from 10.40% for original sample to 5.83% for sample CJG-590 at temperature 590°C (Figures 3B, 4A). Overall, the conversion of TOC during simulation temperature occurs mainly at Ro value < 1.83%, probably due to that abundant OM converts into liquid hydrocarbon at this stage. When simulation temperature is higher than 400°C, the corresponding Ro value is higher than 1.83%, and at this stage, kerogen begins to crack into hydrocarbon gas, and the decreasing degree of TOC becomes slow.
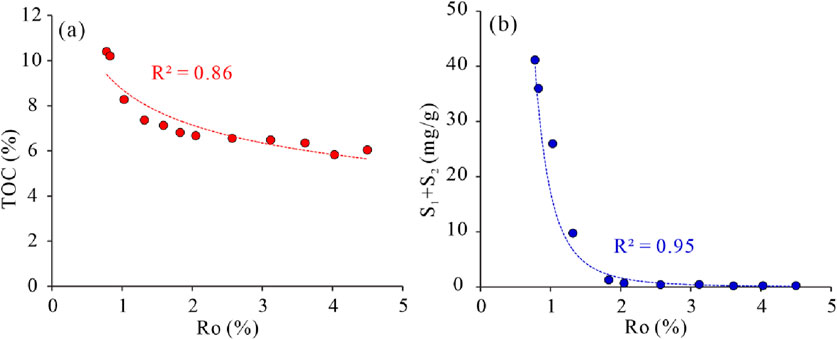
Figure 4. Variations in TOC content (a) and S1+S2 value (b) for the original and simulated samples.
Tmax value and S1+S2 value also display significant variations with increased thermal maturation evolution (Figures 3C, D). Tmax value displays a slight increase when Ro value rises from 0.78% to 1.32%, and then increase rapidly to an extremely high value (590–650°C) (Figure 3C). Tmax value is invalid when source rock enters high to over-maturity stages (Guo et al., 2019), and the Tmax value is not used to calculate Ro value in this study. The value of S1+S2 show a drastically decrease with increased thermal maturation level (Figure 4B). At low maturity stage, the S1+S2 value show a slight decrease, decreasing from 41.15 mg/g to 25.95 mg/g. However, it decreases rapidly when entering high to over-maturity stage, decreasing from 9.50 mg/g to 1.25 mg/g at high maturity stage and from 0.52 mg/g to less than 0.10 mg/g at over-mature stage (Figure 3D).
Carbon isotope of kerogen changes slightly with increased Ro value. As seen in Figure 3E, δ13Cker value generally becomes lighter for samples varying from low-maturity stage to over-maturity stage for the Dalong Formation shale due to the enhancement of aromatization, but they are still within the type II1 kerogen range.
Gas generation products and their changes with increasing thermal maturation level are displayed in Table 4 and Figure 5. The amount of total gas and retained gas show a slowly increasing trend when Ro value is less than 2.0%, subsequently they have a significant increase with Ro>2.0% (Figure 5A). Thus it can be seen that the retention efficiency of generated gas varies from 57.59% to 72.54%, suggesting that most of generated gas was retained within shale pores. Normalized to TOC, the total gas production rate and hydrocarbon gas rate also display similar increasing trends in Figure 5B with total gas production in Figure 5A. Total gas production rate varies from 35.34 to 671.43 mL/gTOC, and hydrocarbon gas production rate ranges from 7.52 to 434.94 mL/gTOC. The proportion of hydrocarbon gas rate in total gas rate varies from 21.29% to 67.00%, and it shows a gradually increase and then a general decrease with increased Ro value. Non-hydrocarbon gas rate also show a slow increasing trend at Ro < 2.0% and a rapid increase when Ro > 2.0% except for Ro = 4.5%.
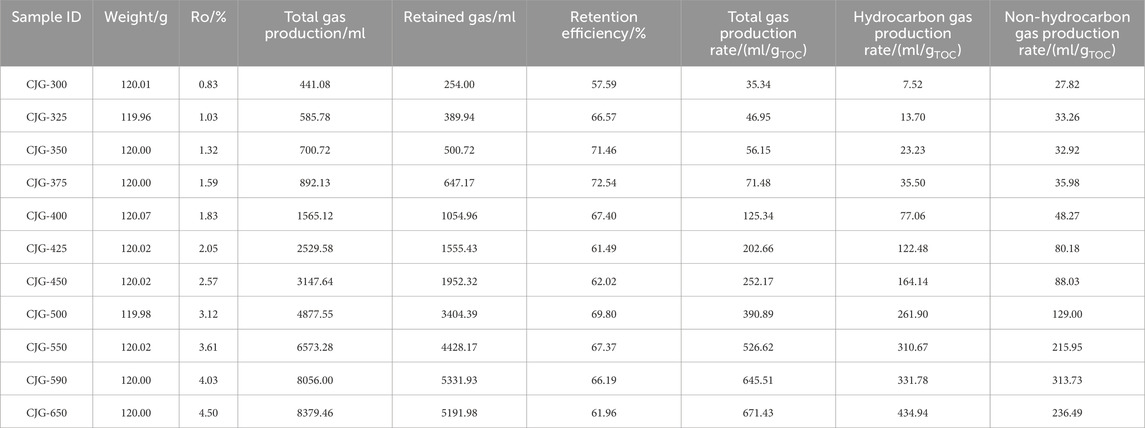
Table 4. Gas production characteristics of the Dalong Formation shale under different pyrolysis temperatures.
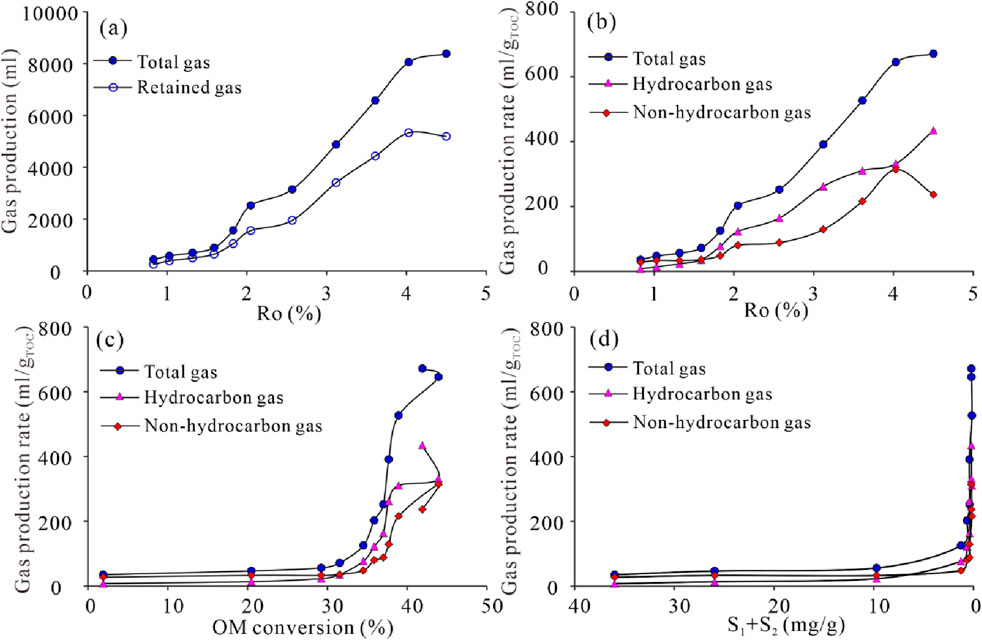
Figure 5. Gas production characteristics with increased thermal evolution degree (a, b), and their correlations with OM conversion (c) and S1+S2 value (d).
The generation of gas production is the function of thermal maturation evolution and the conversion of OM. As OM conversion is below 30%, total gas rate, hydrocarbon rate and non-hydrocarbon rate are all limited, due to that the conversion of OM mainly produces liquid hydrocarbon at this stage. When OM conversion is higher than 30% at high-to over-mature stage, gas production rate can increase rapidly (Figure 5C). The influence of S1+S2 value on gas production is similar to that of OM conversion (Figure 5D). This indicates that OM and S1+S2 are firstly converted into liquid hydrocarbon, and only when shale sample enters high-to over-mature stage, liquid hydrocarbon and kerogen can produce gas in large quantities.
To visually understand OM pore evolution with increased thermal evolution degree, high-resolution FE-SEM observations were conducted on the five simulated samples and representative FE-SEM images were selected for analysis. As shown in Figure 6, OM pores display different characteristics at different thermal maturation levels. Shale samples with Ro value of 0.83%–1.32% have experienced the whole oil generation period, and they generally develop several OM cracks with larger sizes (Figures 6A–C), which are caused by the shrinkage of OM grains (Zhang et al., 2019). OM pores are hardly visible, probably due to that liquid hydrocarbons fill and occupy OM pores (Cao et al., 2021). Overall, the shale samples demonstrate a relatively low degree of pore development. Shale samples with Ro value of 1.32%–2.57% are within the main hydrocarbon gas generation stage, and they develop a large amount of nanometer-sized spongy pores, particularly the pores with diameters of 2–10 nm (Figures 6D–F). However, OM pores developed at Ro = 1.83% and 2.57% are different, due to different forms of OM. OM pores are primarily developed within amorphous kerogen due to that kerogen cracks into hydrocarbons at Ro value = 1.83%, and those mainly developed within solid bitumen due to that liquid hydrocarbon cracks into gas at Ro = 2.57% (Cao et al., 2020). These OM pores in solid bitumen are better developed than those in amorphous kerogen, and they are well connected with each other and contribute significantly to shale porosity. Shale samples with extremely high Ro value of 3.12% remain natural gas generation capacity, and therefore small-sized OM pores continue to be formed (Cao et al., 2021) and meanwhile more nearby small-sized OM pores are merged into large-sized pores (Figures 6G–I). OM pores are displayed heterogeneously among different OM particles at the same maturation level. OM pores are well developed in dispersed solid bitumen (Figure 6G), while blocky amorphous OM grain does not contain numerous internal pores (Figure 6H). This is consistent with the results of Loucks and Reed (2014) and Cao et al. (2020), who divided OM pores into three forms, as in situ amorphous kerogen-related pores, solid bitumen-related pores and biotic structure OM related pores. Moreover, it also can be seen that compressional deformation of OM pores occurs at Ro = 3.12% (Figure 6G), probably due to great lithostatic pressure and insufficient gas supply at this stage (Borjigin et al., 2021).
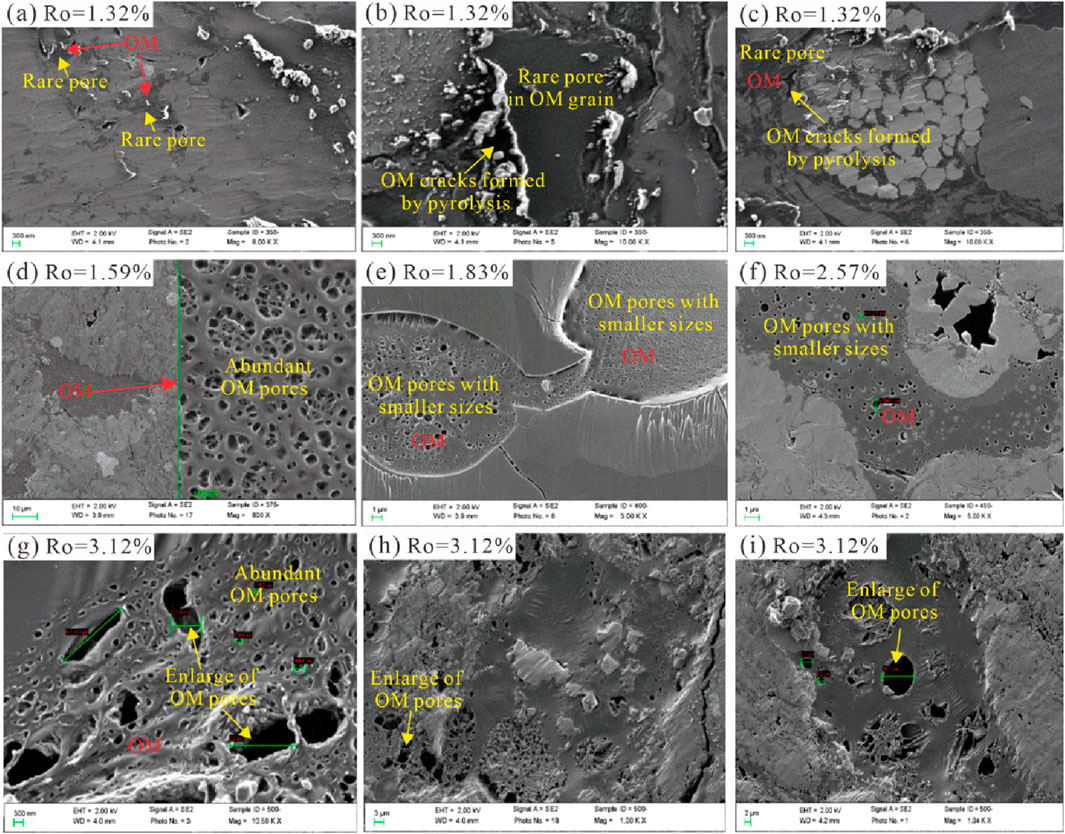
Figure 6. FE-SEM images showing OM pore development characteristics of the simulated samples with different Ro values. (a–c) sample with Ro = 1.32% after thermal simulation at 350°C; (d) sample with Ro = 1.59% after thermal simulation at 375°C; (e) sample with Ro = 1.83% after thermal simulation at 400°C; (f) sample with Ro = 2.57% after thermal simulation at 450°C; (g–i) sample with Ro = 3.12% after thermal simulation at 500°C.
Table 5 shows the pore structure characteristics, mainly BET surface area and pore volume, of all five simulated and extracted samples. The original shale sample of Dalong Formation investigated by Hu et al. (2023) has BET surface area of 0.31 m2/g and pore volume of 0.0012 cm3/g. After thermal simulation, the BET surface area and pore volume significantly increase with pyrolysis temperature. The BET surface area of the simulated samples increases from 2.05 m2/g to 12.74 m2/g as Ro values increase from 1.32% to 3.61%, and then decreases to 9.85 m2/g at Ro = 4.50%. The pore volume generally increases from 0.013 cm3/g to 0.30 cm3/g with increased Ro of 1.32%–4.50%. After Soxhlet extraction, the BET surface area and pore volume generally increase. For the original Dalong shale, the BET surface area and pore volume are 0.91 m2/g and 0.0083 cm3/g after extraction, respectively (Hu et al., 2023). The extracted samples have BET surface area of 6.92–15.90 m2/g and pore volume of 0.14–0.33 cm3/g with the increase of Ro, which is not totally consistent with the simulated samples. This also indicates that liquid hydrocarbon has important role in pore structure parameters, especially at the main stage of oil generation and the early stage of gas generation.
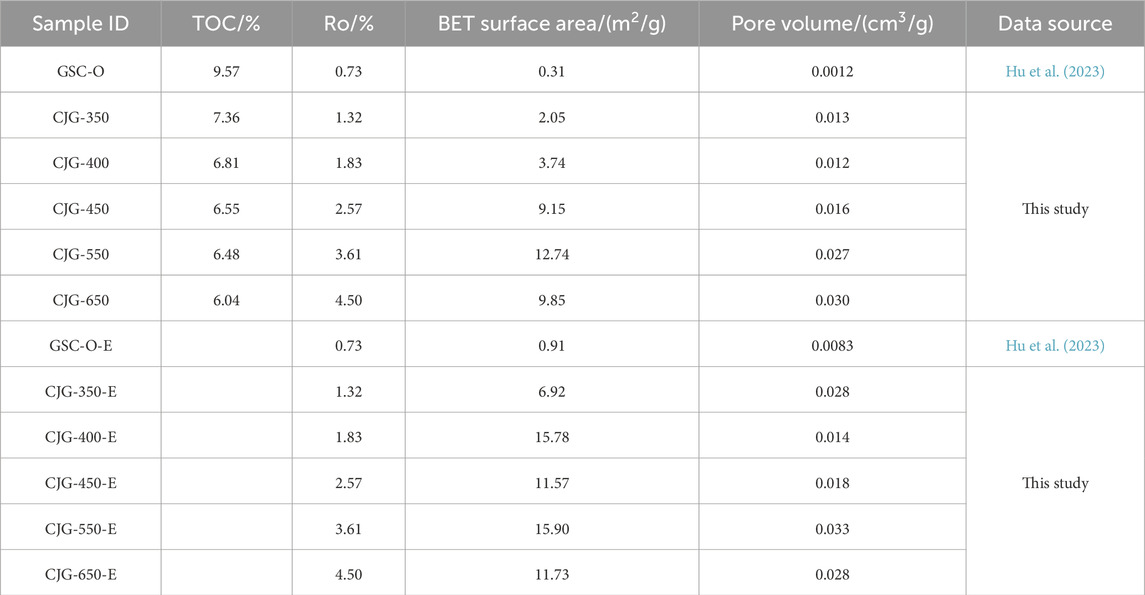
Table 5. Pore structure parameters of the simulated and extracted samples.
Figure 7 shows the N2 adsorption curve of all samples before and after Soxhlet extraction. For the original sample, N2 adsorption curve does not close in the low-pressure part, indicating that shale pores are not developed. Both the original and the extracted samples display very low N2 adsorption amounts (Figure 7A), suggesting poorly developed pores, which is consistent with the FE-SEM observations. However, after thermal simulation, distinct hysteresis loop is observed in each sample group (Figures 7B–F), suggesting the presence of capillary condensation within the pore structure as well as demonstrating the development of numerous pores in the shale. In terms of the classification criteria by IUPAC for isotherms (Thommes et al., 2015), the N2 adsorption-desorption loop of each temperature point can be defined as Type H3 and the isotherm can be classified as Type IV. The combination of Type IV isotherm and Type H3 hysteresis loop suggests that mesopores (diameters of 2–50 nm) are dominated in the sample. It is important to state that the isotherms of the samples undergo changes after reaching 550°C, indicating that with the increasing temperature and pressure, the compaction effects on the rock intensify, and the pore types can be undergoing alterations. Additionally, the influence of extractable OM on N2 adsorption and desorption occurs mainly at 350–400°C. After Soxhlet extraction, N2 adsorption amounts increases significantly, suggesting that extractable OM occupies a large amount of pore space at 350–400°C and the extraction can significantly increase the adsorption capacity at these temperature points.
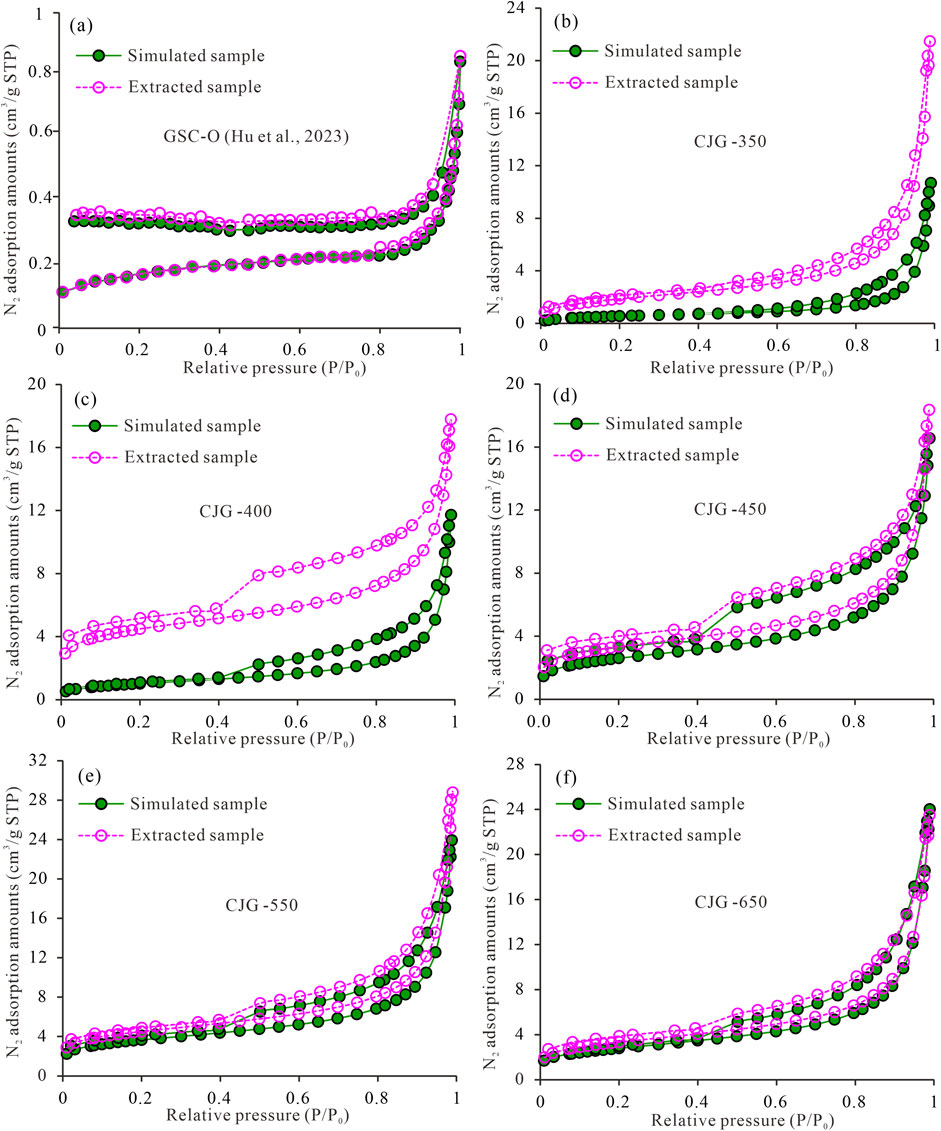
Figure 7. N2 adsorption and desorption isotherms of samples before and after Soxhlet extraction.(a) CSO-O; (b) CJG-350; (c) CJG-400; (d) CJG-450; (e) CJG-550; (f) CJG-650.
TOC content has been considered to be the main factor that controls nanometer-scale pore development in unconventional shale gas reservoir (Curtis et al., 2012a; Curtis et al., 2012b; Milliken et al., 2013), and TOC content generally exhibits positive correlations with shale pore structure parameters (Milliken et al., 2013). As shown in Figure 6, OM pores are seldom in the samples treated with low pyrolysis temperature, but samples treated with high pyrolysis temperatures display a large number of nanometer-sized OM pores. This result suggests that numerous OM pores are developed during thermal simulation process, due to that OMs had been converted into oil and gas accompanied with the reduction of OM volume. Jarvie et al. (2007) concluded that shale microporosities were created by OM decomposition, and deemed that shale porosity could increase 4.9% when 35% of the OM was converted. Bousige et al. (2016) found that specific surface area of shale shows a linearly increasing trend with increased thermal maturation level, because newly generated nanometer-sized pores are formed from the macromolecular structure of OMs. Figure 8 displays the correlations of TOC conversion rate during thermal simulation with BET surface area and pore volume. Exponential positive correlations are displayed between TOC conversion rate and BET surface area as well as pore volume, with correlation coefficients of 0.93 and 0.97, respectively (Figures 8A, B). This suggests that nanometer-sized pores are developed in a rapidly growing way not a general growth rate with the decrease of OM.
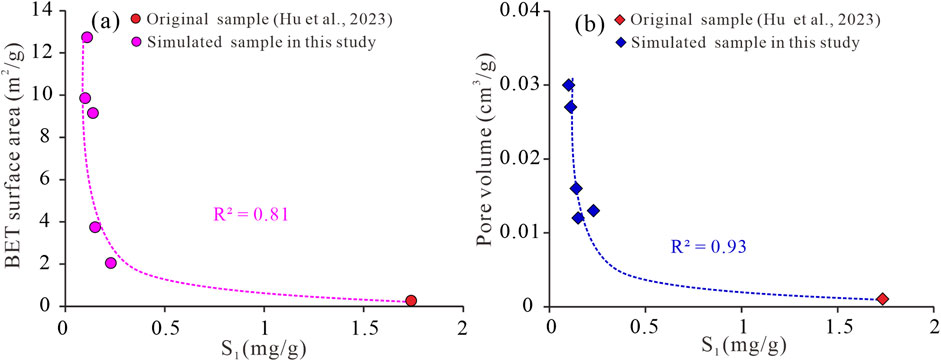
Figure 8. Crossplots of S1content with (a) BET surface area, and (b) pore volume.
To our knowledge, shale pores are primarily composed with OM pores and mineral-related pores. OM pores are primarily controlled by thermal maturation level, and the development of mineral-related pores is more complicated (Ko et al., 2016). Therefore, shale pore evolution responding to thermal maturation changes during the process of thermal simulation experiments refers mainly to OM pore evolution. BET surface area and pore volume normalized to TOC can better reflect OM-hosted pore development characteristics. BET surface area normalized to TOC ranges between 3.23 m2/gTOC and 200.55 m2/gTOC, and pore volume normalized to TOC ranges from 0.01 to 0.50 cm3/gTOC. After the normalized to TOC, both BET surface area and pore volume show a rapid increase. Particularly, BET surface area normalized to TOC and pore volume normalized to TOC both display exponential correlations with TOC conversion rate, with correlation coefficients of 0.94 and 0.98, respectively (Figures 8C, D), better than the correlations of TOC conversion rate with BET surface area and pore volume. This further indicates that the newly generated nanometer-sized pores are mainly OM-related pores, which is well consistent with previous studies (Valenza et al., 2013; Cao et al., 2021).
Previous studies illustrated that asphaltene and liquid hydrocarbon (extractable OM) produced by the thermal degradation of OM can fill the pores and lead to the decrease of pore volume and surface area (Lin et al., 2014; Pommer and Milliken, 2015). In the early stage of oil window, a great deal of extractable OM is generated and quickly occupies shale pores, which significantly reduces the pore volume. With further evolution, extractable OM would be cracked into hydrocarbon gas and therefore extractable OM with minor amount can slightly decrease pore volume (Wang et al., 2022). Wu et al. (2015) regarded that extractable OM existed in thermally simulated shale samples across from 350°C to 500 C in the form of veinlet and droplet shapes and exhibited significant influence on OM pore development. And after extraction, new pores are appear inside OMs and surrounding minerals, which results in the significant increase of specific surface area (Guo et al., 2018; Wu et al., 2019).
Pyrolytic parameter S1 represents the free hydrocarbon in source rock, and it is generally equal to the value of extractable OM. The simulated samples have low S1 value, significantly lower than the original sample. Extractable OM often composes a significant portion of OM in the organic-rich shale with low maturation level, and hence it can have an obvious effect on shale pore evolution (Ko et al., 2016; Guo et al., 2018). The correlations of S1 value with BET surface area and pore volume for the original and simulated samples are shown in Figure 9, which suggest that extractable OM has a negative influence on surface area and pore volume of the studied samples. Extractable OM is considered to have various degrees of influence on shale pores, particularly it preferentially infills and occupies in the pores with smaller diameters (Li et al., 2016). Although the extractable OM is low in simulated samples, it can also fill and block a great deal of nanometer-sized pores and significantly reduce pore surface area and volume.
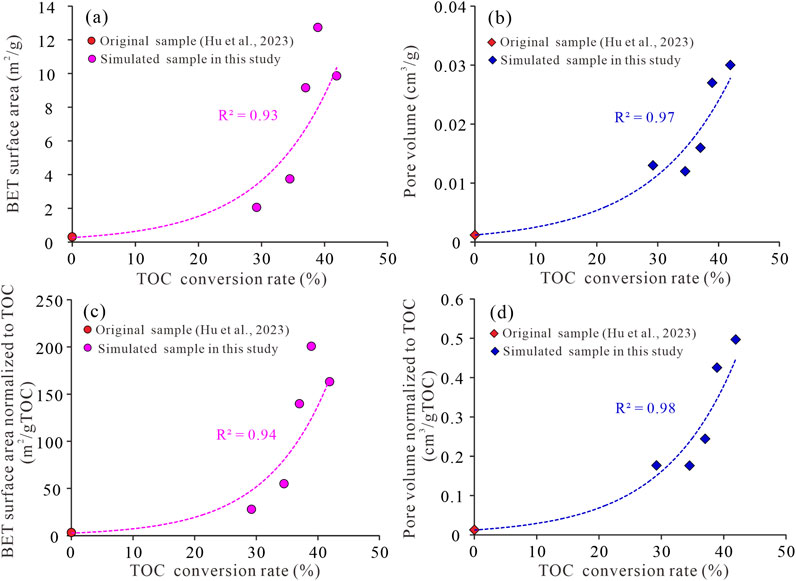
Figure 9. Crossplots of TOC conversion rate with (a) BET surface area, (b) pore volume, (c) BET surface normalized to TOC, and (d) pore volume normalized to TOC.
To deep reveal the influence of extractable OM on surface area and volume of shale pore, N2GA measurements were also implemented to the extracted samples. The original shale of Dalong Formation is characterized as oil-prone kerogen type (type II1 kerogen), and extractable OM can be largely generated and block shale pores. The BET surface area and pore volume of the simulated and extracted samples are shown in Figure 10. All extracted samples show higher surface areas and pore volumes than the simulated samples except CJG-650 with Ro = 4.50%, suggesting that abundant extractable OM is retained in the simulated samples. The surface area and pore volume of the original sample GSC-O increase slightly after extraction, indicating that nanometer-sized pores are not well-developed at this stage. At main oil generation stage, OM pores have been developed and also occupied by extractable OM in sample CJG-350. After extraction, the surface area can increase 237.48% for the extracted samples compared with the corresponding simulated sample. At wet gas generation stage, shale is considered to generate mainly wet gas and light oil, and the surface area can increase 321.49% for the sample CJG-400 after extraction, which also suggests that extractable OM exhibits significant role in shale pore structure at this stage. However, at dry gas generation stage, BET surface area increases slightly after extraction for samples CJG-450, CJG-550 and CJG-650. Variations in pore volume for the samples before and after extraction are not totally consistent with BET surface area. It even has a slightly decrease at extremely high maturity after extraction for sample CJG-650 with Ro = 4.50%.Overall, the maximum increase in pore volume occurs in sample CJG-350, and pore volume still has slightly increase after extraction for sample CJG-400, CJG-450 and CJG-500, indicating that extractable OM fills primarily in pores with smaller sizes.
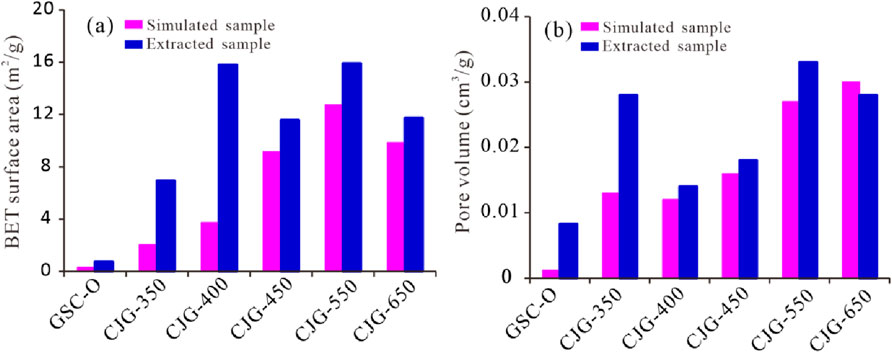
Figure 10. Comparisons of BET surface area (a) and pore volume (b) in the simulated and extracted samples. Sample GSC-O were cited by Hu et al. (2023).
As illustrated above, the influence of extractable OM on pore evolution mainly occurs at oil generation stage and wet gas generation stage. The reasons can be concluded to be: 1) at oil generation stage (Ro = 1.32%), oil generation is generally completed and gas generation just begins, and a large amount of extractable OM is retained in the pores, which results in a large increase in pore volume and a slight increase in surface area after extraction; 2) at wet gas generation stage (Ro = 1.83%), a large amount of nanometer-sized OM pores are developed, and the nanometer-sized pores are exposed after extraction, which results in a large increase in BET surface area but limited increase in pore volume; and 3) at dry gas generation stage, most extractable OM has been converted into dry gas and the increase in BET surface area and pore volume is not obvious, even some pores can be destructed during extraction process at extremely high maturity stage.
Pore evolution in unconventional gas/oil reservoirs with simulated temperatures has been studied by many scholars in the last few years (Curtis et al., 2012a; Mastalerz et al., 2013). The response of OM pore evolution to Ro value has been investigated by multiple techniques such as CO2GA, N2GA, FE-SEM and NMR methods (Kuila et al., 2014; Cui et al., 2019). For natural Dalong shales, there is a positive correlation between surface area and TOC content at a high thermal maturation level, but no significant correlation at a low maturity stage (Cao et al., 2021). This suggests that thermal maturation level determines shale pore development. Previous studies have concluded shale pore evolution with increased Ro value less than 3.5% (Ko et al., 2018; Cao et al., 2021), and pore characteristics are not clear when Ro value exceeds 4.0%, which restricts the exploration of shale gas with extremely high maturity.
To further reveal the evolution of shale pores with thermal maturities across from low maturity to extremely high maturity, the Dalong shale sample was subjected to simulation experiments and five points were obtained to conduct N2GA measurement, covering oil generation stage (Ro = 1.32%), wet gas generation stage (Ro = 1.83%), dry gas generation stage (Ro = 2.57%–3.61%) and gas depletion stage (Ro = 4.50%). As shown in Figure 11, BET surface area and pore volume show a slight increase at the oil generation stage, due to that OM pores are initially generated at this period. When entering wet gas generation, OM pores begin to be developed in large amounts but they are generally blocked by extractable OMs, therefore the BET surface area slightly increases and pore volume slightly decreases. When sample enters dry gas stage, OM pores are better developed and contribute significantly to shale porosity, which is favorable for shale gas generation and enrichment. Exploration practice also indicates that the Ro value of the Wufeng-Longmaxi Formation shale reservoir that has been commercial production ranges from 2.21% to 2.74% in Fuling shale gas field (Borjigin et al., 2017) and 2.17%–3.21% averaged 2.84% in Weiyuan shale gas field (Xiang et al., 2023). However, when Ro is at 4.50%, hydrocarbon generation potential is exhausted, and carbonization occurs for the OMs. It results in that nanometer-sized pores are destructed, leading to the decrease in BET surface area, but pore volume slightly increases due to the merge of nanometer-sized pores into large-sized pores.
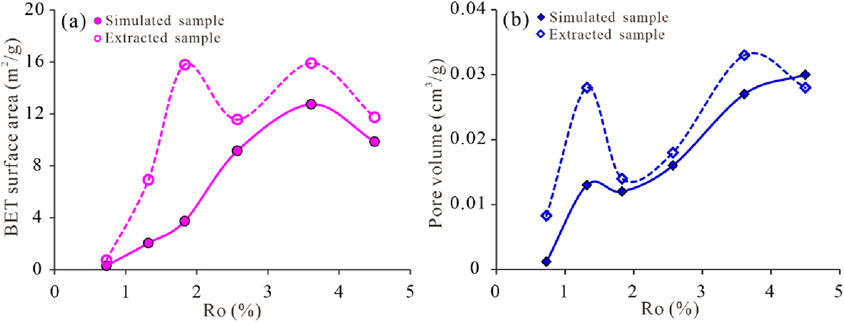
Figure 11. Comparison of BET surface area (a) and pore volume (b) variations in the simulated and extracted samples with increased Ro value. Sample with Ro = 0.73% was referred to Hu et al. (2023).
The BET surface area and pore volume normalized to TOC were also compared to those of pure kerogen samples from different strata in Figure 12. The BET surface area normalized to TOC show a rapid increase from 3.24 to 200.55 m2/gTOC with Ro range of 0.73%–3.61%, and then it drops to 163.13 m2/gTOC when Ro value decreases to 4.50% (Figure 12A). The BET surface area of simulated sample at a low Ro value (0.73%–1.32%) is consistent with the low-mature Dalong Formation kerogen with Tmax value of 439–440°C, and that of simulated samples at extremely high Ro value (Ro = 4.50%) can be compared with kerogen of Niutitang Formation with Tmax value of 506 C. The highest BET surface area normalized to TOC for the simulated sample is lower than that of kerogen samples of Longmaxi Formation with Tmax value of 602 C and 606°C, probably due to that the Longmaxi Formation kerogen is type I kerogen and the Dalong Formation is characterized as type II1 kerogen. Pore volume normalized to TOC for the studied samples ranges from 0.01 to 0.50 cm3/gTOC, and it shows a gradually increase as Ro is below 2.57% and a rapid increase as Ro of 3.61%–4.50%, which is higher than that of pure kerogens compared with the BET surface area. This is probably due to that internal structure of shale has been destroyed and it significantly increases shale porosity compared with natural shale samples (Hu et al., 2023).
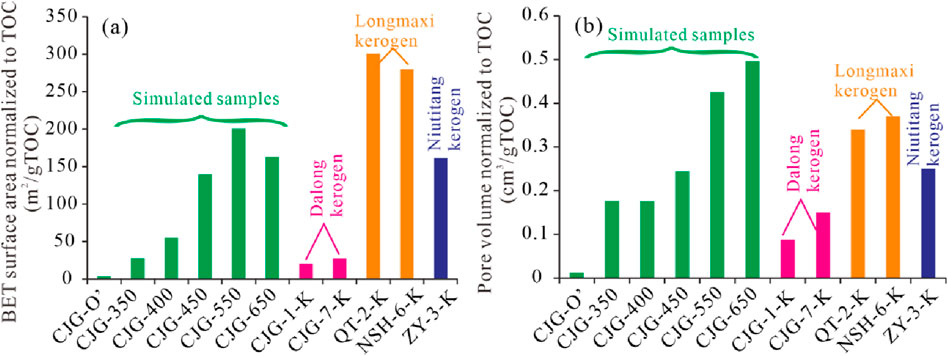
Figure 12. Comparison of BET surface area normalized to TOC (a) and pore volume normalized to TOC (b) for thermal simulated samples with naturally evolved shales. CJG-O′ is the original Dalong shale from Hu et al. (2023), CJC-1-K and CJG-7-K are kerogen samples of Dalong Formation, QT-2-K and NSH-6-K are kerogen samples of Longmaxi Formation and ZY-3-K is kerogen sample of Niutitang Foramtion (Cao et al., 2015).
As a type II1 kerogen oil-prone source rock, the first consideration is how large volumes of gas can be formed, and the second is how gas can be stored (Jarvie et al., 2007). There are three distinct stages of hydrocarbon gas generation within shale: (1) the decomposition of kerogen to gas and bitumen; (2) the decomposition of bitumen to oil and gas; and (3) the decomposition of oil to gas and a carbon-rich coke or pyrobitumen residue. The three hydrocarbon gas generation processes can promote OM pore development, and therefore the correlation between hydrocarbon gas production and pore structure is significantly meaningful to source-storage of shale gas.
Gaseous hydrocarbon generation originating from kerogen pyrolysis and liquid hydrocarbon cracking can generate high pore pressures in shale, which is conducive to the development of shale pores. Therefore, there are good positive correlations of gaseous hydrocarbon production with micropore volume, mesopore volume and macropore volume, with correlation coefficients of 0.8991, 0.8524 and 0.5466, respectively (Wang and Guo, 2021). In this study, BET surface area of the simulated samples increases exponentially with the yield of hydrocarbon gas (Figure 13A), indicating that the process of hydrocarbon gas generation can generate nanometer-sized pores that can exponentially increase shale pore surface area. Unlike surface area, a linearly positive correlation is between hydrocarbon gas production and pore volume (Figure 13B), suggesting that the development of pores are primarily controlled by the space releasing of hydrocarbon cracking. The BET surface area normalized to TOC and pore volume normalized to TOC were also plotted with hydrocarbon gas production (Figures 13C, D), and the correlations became better, with correlation coefficients of 0.87 and 0.97, respectively. This suggests that the generated pores during hydrocarbon gas generation process are primarily OM pores.
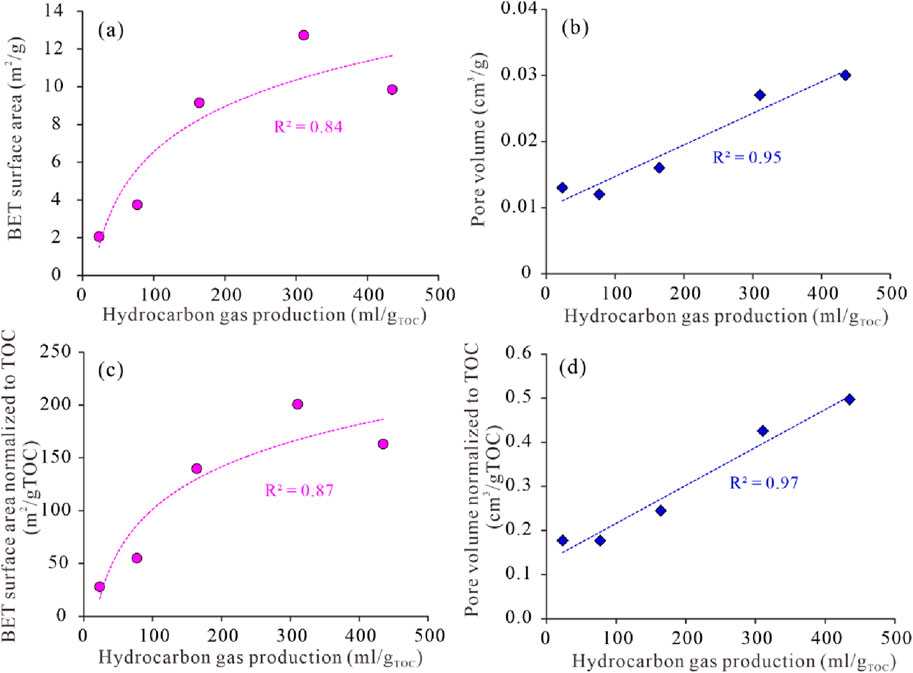
Figure 13. Crossplots of hydrocarbon gas production with (a) BET surface area, (b) pore volume, (c) BET surface normalized to TOC, and (d) pore volume normalized to TOC.
The evolution pattern of OM pores in shale can be inferred by reasonably in terms of variations in BET surface area and pore volume with increased Ro values. Previous studies have indicated that OM pores dominate the internal pore space of shale, and volumes of micropores and mesopores are also controlled by OM content (Milliken et al., 2013; Zhang et al., 2018). Cao et al. (2021) and Hu et al. (2023) investigated pore development with increased temperatures (300–550°C) for the Dalong shale, and established OM pore evolution model with Ro value below 3.50%. In terms of previous studies and the finding in this study, OM pore evolution model was roughly established in Figure 14. It can be divided into three stages: initial development stage, rapid development stage, and slightly destruction stage.

Figure 14. OM pore evolution model of Dalong Formation shale.
The initial development stage refers to room temperature to 400°C, with Ro value of 0.73%–1.83%, corresponding to the low maturity to high mature stage. As the temperature of 350°C, corresponding to Ro = 1.32%, OM undergoes pyrolysis, leading to the gradual development of cracks along the edges of OMs and few OM pores. When the two types of pores reach a sufficient size, they can interconnect each other and form large-scale OM micro-cracks. These pores typically have diameters larger than 50 nm, even micrometer size. When temperature is 400°C, corresponding to Ro of 1.83%, OM pores occur mainly within amorphous kerogen that cracks to hydrocarbon gas. OM pores are generally have smaller sizes and are not well connected with each other. Therefore, it is worth noting that although a significant number of micropores and mesopores have developed naturally within amorphous kerogen at high mature stage, and therefore provide a certain amount of surface area and pore volume.
The rapid development stage of OM pores refers to the temperature range of 450–550°C, with Ro value of 2.57%–3.61%, corresponding to over-mature stage. At 450°C, the BET surface area and pore volume of the simulated samples increase rapidly, especially OM pores are well developed in solid bitumen grains which are formed due to the liquid hydrocarbon cracks to hydrocarbon gas. At 450°C, corresponding to Ro = 2.57%, a great number of OM pores are formed, with pore diameters spanning from several nanometers to hundreds of nanometers. And at 550°C, corresponding to Ro = 3.61%, two phenomena occur within OMs. On the one hand, numerous newly generated sponge-like pores are developed within OMs, and on the other hand, larger sizes of pores are formed by merging nearby smaller sized pores. At this stage, OM pores are well-connected and form a complex pore network system. This indicates that OMs at metamorphic stage still have abundant pores when Ro is higher than 3.50%, which is of vital importance for shale gas exploration in over-mature shale gas reservoirs.
The slightly destruction stage of OM pores refers to the temperature range of 650°C, corresponding to Ro = 4.50% and extremely high mature stage, the BET surface area slightly decreases and pore volume still increases. During this stage, shale pore volume increased slowly compared to the previous stage, and nanometer-sized pores (micropores and mesopores) decrease to some extent. BET surface area decreases due to that graphization of OM which results in OM pores merged into larger-sized pores, and these large-sized pores can continue to contribute pore volume. Therefore, at this stage, pore evolution refers mainly to the decrease of OM micropores and mesopores and the increase of larger-sized pores. As stated by previous studies, OM micropores and mesopores are the main occurrence space for adsorbed gas and most free gas, and therefore, it indicates that OM pores at extremely high maturity stage are still well-developed and have great potential for shale gas exploration, which can guide the deep shale gas exploration in southern Sichuan Basin of China.
In this study, we systematically investigated the variations in hydrocarbon gas generation and OM pore evolution of the Dalong Formation shale in northwestern Sichuan Basin, China, by a series of semi-closed pyrolysis experiments. The analyses for gas products were used to explore the potential of hydrocarbon generation, and FE-SEM and N2GA measurements were conducted to understand OM pore variations. According to the above discussions, the primarily conclusions are summarized as follows.
(1) The amount of total gas and hydrocarbon gas show a slow increasing trend when Ro < 2.0% and subsequently a significant increase when Ro > 2.0% except for Ro = 4.5%. The retention efficiency of generation gas varies from 57.59% to 72.54%, suggesting that most generated gas is retained within shale layer.
(2) The development and evolution of OM pores is a function of hydrocarbon gas generation. Hydrocarbon gas rate has an exponential correlation with BET surface area, and a linear correlation with pore volume. During pyrolysis experiments, shale pores are created due to OM decomposed to hydrocarbons, and OM pores are primarily existed in amorphous kerogen and solid bitumen at wet gas generation stage and dry gas generation stage, respectively. Therefore, BET surface area and pore volume display significant correlations with OM conversion rate.
(3) Extracted samples generally have higher BET surface area and pore volume, particularly at main oil generation and wet gas generation stages, due to that the abundant OM pores are exposed after extraction. However, at dry gas generation stage, BET surface area and pore volume are slightly increased, suggesting that most extractable OM has been converted into dry gas.
(4) OM pore evolution model was established and divided into three stages: initial development stage, rapid development stage and slightly destruction stage, which correspond respectively to liquid hydrocarbon and wet gas generation stage, dry gas generation stage and gas depletion stage, respectively. This study indicates that OM pores are still well-developed at extremely high maturity stage and have great potential for deep shale gas exploration.
The original contributions presented in the study are included in the article/supplementary material, further inquiries can be directed to the corresponding author.
XZ: Funding acquisition, Investigation, Methodology, Writing–original draft. XX: Conceptualization, Writing–original draft, Funding acquisition. BS: Data curation, Resources, Writing–review and editing. ZX: Investigation, Methodology, Writing–review and editing. JY: Visualization, Writing–review and editing. JQ: Visualization, Writing–review and editing. CH: Writing–review and editing. SL: Writing–review and editing, Visualization. TC: Writing–review and editing, Funding acquisition. YH: Writing–review and editing. TT: Funding acquisition, Writing–review and editing.
The author(s) declare that financial support was received for the research and/or publication of this article. This study was supported by Geological Investigation and Evaluation of Shale Gas in Complex Structural Areas of the Middle Yangtze plate (DD20240288) of China Geological Survey, the National Natural Science Foundation of China (Grant Nos 41702159 and 42472208), and Shaanxi Province 2023 Innovation Capability Support Plan (2023KJXX-122).
Author TT was employed by Shaanxi Coal Geology Group Co., Ltd.
The remaining authors declare that the research was conducted in the absence of any commercial or financial relationships that could be construed as a potential conflict of interest.
The author(s) declare that no Generative AI was used in the creation of this manuscript.
All claims expressed in this article are solely those of the authors and do not necessarily represent those of their affiliated organizations, or those of the publisher, the editors and the reviewers. Any product that may be evaluated in this article, or claim that may be made by its manufacturer, is not guaranteed or endorsed by the publisher.
Afagwu, C., Mahmoud, M. A., and Shirish Patil, S. A. (2022). Multiscale storage and transport modeling in unconventional shale gas: a review. J. Pet. Sci. Eng. 208, 109518. doi:10.1016/j.petrol.2021.109518
Barrett, E. P., Joyner, L. G., and Halenda, P. P. (1951). The determination of pore volume and area distributions in porous substances. I. Computations from nitrogen isotherms. J. Am. Chem. Soc. 73, 373–380. doi:10.1021/ja01145a126
Bernard, S., Wirth, R., Schreiber, A., Schulz, H. M., and Horsfield, B. (2012). Formation of nanoporous pyrobitumen residues during maturation of the Barnett shale (fort worth basin). Int. J. Coal Geol. 103, 3–11. doi:10.1016/j.coal.2012.04.010
Borjigin, T., Lu, L., Yu, L., Zhang, W., Pan, A., Shen, B., et al. (2021). Formation, preservation and connectivity control of organic pores in shale. Pet. explor. Dev. 48, 798–812. doi:10.1016/s1876-3804(21)60067-8
Borjigin, T., Shen, B., Yu, L., Yang, Y., Zhang, W., Tao, C., et al. (2017). Mechanisms of shale gas generation and accumulation in the ordovician Wufeng-Longmaxi Formation, Sichuan Basin, SW China. Pet. explor. Dev. 44, 69–78. doi:10.1016/s1876-3804(17)30009-5
Bousige, C., Ghimbeu, C. M., Vix-Guterl, M., Pomerantz, A. E., Suleimenova, A., Vaughan, G., et al. (2016). Realistic molecular model of kerogen’s nanostructure. Nat. Mat. 15, 576–582. doi:10.1038/nmat4541
Brunauer, S., Emmett, P. H., and Teller, E. (1938). Adsorption of gases in multimolecular layers. J. Am. Chem. Soc. 60, 309–319. doi:10.1021/ja01269a023
Cao, T., Deng, M., Cao, Q., Huang, Y., Yu, Y., and Cao, X. (2021). Pore formation and evolution of organic-rich shale during the entire hydrocarbon generation process: examination of artificially and naturally matured samples. J. Nat. Gas. Sci. Eng. 93, 104020. doi:10.1016/j.jngse.2021.104020
Cao, T., Deng, M., Pan, A., Wang, Q., Cao, Q., Liu, H., et al. (2023). Characteristics of in situ desorption gas and their relations to shale components: a case study of the Wufeng-Longmaxi shales in eastern Sichuan Basin, China. Lithosphere 1, 8015444. doi:10.2113/2023/8015444
Cao, T., Liu, H., Pan, A., Fu, Y., Deng, M., Cao, Q., et al. (2022). Pore evolution in siliceous shales and its influence on shale gas-bearing capacity in eastern Sichuan-western Hubei, China. J. Pet. Sci. Eng. 208, 109597. doi:10.1016/j.petrol.2021.109597
Cao, T., Song, Z., Wang, S., and Xia, J. (2015). A comparative study of the specific surface area and pore structure of different shales and their kerogens. Sci. China Earth Sci. 58, 510–522. doi:10.1007/s11430-014-5021-2
Cao, T., Xu, H., Liu, G., Deng, M., Cao, Q., and Yu, Y. (2020). Factors influencing microstructure and porosity in shales of the Wufeng-Longmaxi formations in northwestern Guizhou, China. J. Pet. Sci. Eng. 191, 107181. doi:10.1016/j.petrol.2020.107181
Chukwuma, K., Bordy, E. M., and Coetzer, A. (2018). Evolution of porosity and pore geometry in the Permian Whitehill Formation of South Africa-A FE-SEM image analysis study. Mar. Pet. Geol. 91, 262–278. doi:10.1016/j.marpetgeo.2017.12.026
Cui, H., Liang, F., Ma, C., Zhong, N., Sha, Y., and Ma, W. (2019). Pore evolution characteristics of Chinese marine shale in the thermal simulation experiment and the enlightenment for gas shale evaluation in South China. Geosci. J. 23, 595–602. doi:10.1007/s12303-018-0066-4
Curtis, M. E., Cardott, B. J., Sondergeld, C. H., and Rai, C. S. (2012a). Development of organic porosity in the Woodford shale with increasing thermal maturity. Int. J. Coal Geol. 103, 26–31. doi:10.1016/j.coal.2012.08.004
Curtis, M. E., Sondergeld, C. H., Ambrose, R. J., and Rai, C. S. (2012b). Microstructural investigation of gas shales in two and three dimensions using nanometer-scale resolution imaging. AAPG Bull. 96, 665–677. doi:10.1306/08151110188
Feng, G., and Chen, S. (1988). Relationship between the reflectance of bitumen and vitrinite in rock. Nat. Gas. Ind. 8, 20–24.
Feng, Y., Xiao, X., Wang, E., Gao, P., Lu, C., and Li, G. (2023). Gas storage in shale pore system: a review of the mechanism, control and assessment. Pet. Sci. 20, 2605–2636. doi:10.1016/j.petsci.2023.05.012
Fishman, N. S., Hackley, P. C., Lowers, H. A., Hill, R. J., Egenhoff, S. O., Eberl, D. D., et al. (2012). The nature of porosity in organic-rich mudstones of the upper Jurassic Kimmeridge clay formation, north sea, offshore United Kingdom. Int. J. Coal Geol. 103, 32–50. doi:10.1016/j.coal.2012.07.012
Gao, Z., Fan, Y., Xuan, Q., and Zheng, G. (2020). A review of shale pore structure evolution characteristics with increasing thermal maturities. Adv. Geo-Energy Res. 4, 247–259. doi:10.46690/ager.2020.03.03
Guo, H., He, R., Jia, W., Peng, P., Lei, Y., Luo, X., et al. (2018). Pore characteristics of lacustrine shale within the oil window in the upper triassic yanchang formation, southeastern ordos basin, China. China. Mar. Pet. Geol. 91, 279–296. doi:10.1016/j.marpetgeo.2018.01.013
Guo, H., Jia, W., Peng, P., Zeng, J., and He, R. (2017). Evolution of organic matter and nanometer-scale pores in an artificially matured shale undergoing two distinct types of pyrolysis: a study of the Yanchang Shale with Type II kerogen. Org. Geochem. 105, 56–66. doi:10.1016/j.orggeochem.2017.01.004
Guo, Q., Mi, J., Wang, J., Li, J., Li, Y., and Zhi, Y. (2019). An improved hydrocarbon generation model of source rocks and key parameter templates. China Pet. Explor. 24, 661–669. doi:10.3969/j.issn.1672—7703.2019.05.012
Han, Y., Horsfield, B., Wirth, R., Mahlstedt, N., and Bernard, S. (2017). Oil retention and porosity evolution in organic-rich shales. AAPG Bull. 101, 807–827. doi:10.1306/09221616069
Hao, F., Zou, H., and Li, Y. (2013). Mechanisms of shale gas storage: implications for shale gas exploration in China. AAPG Bull. 97, 1325–1346. doi:10.1306/02141312091
Hu, C., Tan, J., Lyu, Q., Feng, G., Shi, J., Wang, K., et al. (2022). Variations of shale’s pore characteristics and hydraulic properties after long-term imbibition in hydraulic fracturing fluids. Geophys. Geo-Energy Geo-Resour. 8, 183. doi:10.1007/s40948-022-00480-5
Hu, C., Tan, J., Lyu, Q., and Zhang, Y. (2023). Evolution of organic pores in Permian low maturity shales from the Dalong Formation in the Sichuan Basin: insights from a thermal simulation experiment. Gas. Sci. Eng. 121, 205166. doi:10.1016/j.jgsce.2023.205166
Hu, H., Hao, F., Lin, J., Lu, Y., Ma, Y., and Li, Q. (2017). Organic matter-hosted pore system in the Wufeng-Longmaxi (O3w-S1l) shale, Jiaoshiba area, eastern Sichuan Basin, China. Int. J. Coal Geol. 173, 40–50. doi:10.1016/j.coal.2017.02.004
Jarvie, D., Hill, R., Ruble, T., and Pollastro, R. (2007). Unconventional shale-gas systems: the Mississippian Barnett shale of north-central Texas as one model for thermogenic shale-gas assessment. AAPG Bull. 91, 475–499. doi:10.1306/12190606068
Jiang, S., Tang, X., Cai, D., Xue, G., He, Z., Long, S., et al. (2017). Comparison of marine, transitional, and lacustrine shales: a case study from the Sichuan Basin in China. J. Pet. Sci. Eng. 150, 334–347. doi:10.1016/j.petrol.2016.12.014
Ko, L. T., Loucks, R. G., Zhang, T. W., Ruppel, S. C., and Shao, D. Y. (2016). Pore and pore network evolution of Upper Cretaceous Boquillas (Eagle Ford-equivalent) mudrocks: results from gold tube pyrolysis experiments. AAPG Bull. 100, 1693–1722. doi:10.1306/04151615092
Ko, L. T., Ruppel, S. C., Loucks, R. G., Hackley, P. C., Zhang, T. W., and Shao, D. Y. (2018). Pore-types and pore-network evolution in Upper Devonian-Lower Mississippian Woodford and Mississippian Barnett mudstones: insights from laboratory thermal maturation and organic petrology. Int. J. Coal Geol. 190, 3–28. doi:10.1016/j.coal.2017.10.001
Kuila, U., McCarty, D. K., Derkowski, A., Fischer, T. B., Topόr, T., and Prasad, M. (2014). Nano-scale texture and porosity of organic matter and clay minerals in organic-rich mudrocks. Fuel 135, 359–373. doi:10.1016/j.fuel.2014.06.036
Lafargue, E., Marquis, F., and Piloot, D. (1998). Rock-eval 6 applications in hydrocarbon exploration, production and soil contamination studies. Oil and Gas Sci. Technology-Revue de l’s Inst. Francais du Pétrol 53, 421–437. doi:10.2516/ogst:1998036
Li, F., Wang, M., Liu, S., and Hao, Y. (2019b). Pore characteristics and influencing factors of different types of shales. Mar. Pet. Geol. 102, 391–401. doi:10.1016/j.marpetgeo.2018.11.034
Li, H., Song, T., Chen, K., Lin, T., Jin, C., Meng, F., et al. (2017). The discovery of shale gas from Sinica Formation at ZD-2 well in western Hubei. Chin. Geol. 44, 812–813. doi:10.12029/gc20200113
Li, J., Lu, S., Jiang, C., Wang, M., Chen, Z., Chen, G., et al. (2019a). Characterization of shale pore size distribution by NMR considering the influence of shale skeleton signals. Energy fuels. 33, 6361–6372. doi:10.1021/acs.energyfuels.9b01317
Li, J., Zhou, S., Li, Y., Ma, Y., Yang, Y., and Li, C. (2016). Effect of organic matter on pore structure of mature lacustrine organic-rich shale: a case study of the Triassic Yanchang shale, Ordos Basin, China. Fuel 185, 421–431. doi:10.1016/j.fuel.2016.07.100
Li, S., Zhou, Z., Nie, H., Zhang, L., Song, T., Liu, W., et al. (2022). Distribution characteristics, exploration and development, geological theories research progress and exploration directions of shale gas in China. China Geol. 5, 110–135. doi:10.31035/cg2021069
Lin, W., Mastalerz, M., Schimmelmann, A., and Chen, Y. (2014). Influence of Soxhlet-extractable bitumen and oil on porosity in thermally maturing organic-rich shales. Int. J. Coal Geol. 132, 38–50. doi:10.1016/j.coal.2014.08.003
Lis, G. P., Topór, T., and Mastalerz, M. (2025). Organic matter content and its role in shale porosity development with maturity: insights from Baltic Basin Silurian shales. Int. J. Coal Geol. 301, 104713. doi:10.1016/j.coal.2025.104713
Liu, B., Mastalerz, M., and Schieber, J. (2022). SEM petrography of dispersed organic matter in black shales: a review. Earth-Sci. Rev. 224, 103874. doi:10.1016/j.earscirev.2021.103874
Löhr, S. C., Baruch, E. T., Hall, P. A., and Kennedy, M. J. (2015). Is organic pore development in gas shales influenced by the primarily porosity and structure of thermally immature organic matter? Org. Geochem. 87, 119–132. doi:10.1016/j.orggeochem.2015.07.010
Loucks, R. G., and Reed, R. M. (2014). Scanning-electron-microscopy petrographic evidence for distinguishing organic-matter pores associated with depositional organic matter versus migrated matter in mudrocks. GCSGS J. 3, 51–60.
Mastalerz, M., Schimmelmann, A., Drobniak, A., and Chen, Y. Y. (2013). Porosity of Devonian and Mississippian New Albany shale across a maturation gradient: insights from organic petrology, gas adsorption, and mercury intrusion. AAPG Bull. 97, 1621–1643. doi:10.1306/04011312194
Milliken, K. L., and Curtis, M. E. (2016). Imaging pores in sedimentary rocks: Foundation of porosity prediction. Mar. Pet. Geol. 73, 590–608. doi:10.1016/j.marpetgeo.2016.03.020
Milliken, K. L., Rudnicki, M., Awwiller, D. N., and Zhang, T. (2013). Organic matter-hosted pore system, marcellus formation (Devonian), Pennsylvania. AAPG Bull. 97, 177–200. doi:10.1306/07231212048
Nie, H., Jin, J., and Zhang, J. (2018). Characteristics of three organic matter pore types in the Wufeng-Longmaxi shale of the Sichuan Basin, southwest China. Sci. Rep. 8, 7014. doi:10.1038/s41598-018-25104-5
Nie, H., Jin, Z., Sun, C., He, Z., Liu, G., and Liu, Q. (2019). Organic matter types of the Wufeng and Longmaxi Formations in the Sichuan Basin, south China: implications for the formation of organic matter pores. Energy fuels. 33, 8076–8100. doi:10.1021/acs.energyfuels.9b01453
Peng, Y., Guo, S., Zhai, G., Shi, D., and Chen, R. (2019). Determination of critical parameters for evaluating coal measure shale gas in China. Mar. Pet. Geol. 109, 732–739. doi:10.1016/j.marpetgeo.2019.06.017
Pommer, M., and Milliken, K. (2015). Pore types and pore-size distributions across thermal maturity, Eagle Ford Formation, southern Texas. Aapg. Bull. 99, 1713–1744. doi:10.1306/03051514151
Sheng, G., Su, Y., Zhao, H., and Liu, J. (2020). A unified apparent porosity/permeability model of organic porous media: coupling complex pore structure and multimigration mechanism. Adv. Geo-Energy Res. 4, 115–125. doi:10.26804/ager.2020.02.01
Sing, K. S. W., Everett, D. H., Haul, P. A. W., Moscou, L., Pierotti, R. A., Rouquérol, J., et al. (1985). Reporting physisorption data for gas/solid systems with special reference to the determination of surface area and porosity (Recommendations 1984). Pure Appl. Chem. 57, 603–619. doi:10.1351/pac198557040603
Soeder, D. J. (2018). The successful development of gas and oil resources from shales in North America. J. Pet. Sci. Eng. 163, 399–420. doi:10.1016/j.petrol.2017.12.084
Song, D., Tuo, J., Wu, C., Zhang, M., and Su, L. (2020). Comparison of pore evolution for a Mesoproterozoic marine shale and a Triassic terrestrial mudstone during artificial maturation experiments. J. Nat. Gas. Sci. Eng. 75, 103153. doi:10.1016/j.jngse.2020.103153
Song, D., Wang, X., Tuo, J., Wu, C., Zhang, M., Su, L., et al. (2021). A comprehensive study on the impacts of rock fabric on hydrocarbon generation and pore structure evolution of shale under semi-confined condition. Mar. Pet. Geol. 124, 104830. doi:10.1016/j.marpetgeo.2020.104830
Song, W., Yao, J., Li, Y., Sun, H., Zhang, L., Yang, Y., et al. (2016). Apparent gas permeability in an organic-rich shale reservoir. Fuel 181, 973–984. doi:10.1016/j.fuel.2016.05.011
Su, L., Zhang, D., Zeng, L., Liu, X., Yang, X., Zheng, J., et al. (2020). Experimental study of the influences of pressure on generation and expulsion of hydrocarbons: a case study from mudstone source rocks and its geological application in the Tarim Basin. J. Pet. Sci. Eng. 189, 107021. doi:10.1016/j.petrol.2020.107021
Thommes, M., Kaneko, K., Neimark, A. V., Olivier, J. P., Rodriguez-Reinose, F., Rouquerol, J., et al. (2015). Physisorption of gases, with special reference to the evaluation of surface area and pore size distribution (IUPAC Technical Report). Pure Appl. Chem. 87, 1051–1069. doi:10.1515/pac-2014-1117
Valenza, J. J., Drenzek, N., Marques, F., Pagels, M., and Mastalerz, M. (2013). Geochemical controls on shale microstructure. Geology 41, 611–614. doi:10.1130/g33639.1
Wang, F., and Guo, S. (2019). Influential factors and model of shale pore evolution: a case study of a continental shale from the Ordos Basin. Mar. Pet. Geol. 67, 144–153. doi:10.1016/j.marpetgeo.2018.12.045
Wang, J., and Guo, S. (2021). Study on the relationship between hydrocarbon generation and pore evolution in continental shale from the Ordos Basin, China. Pet. Sci. 18, 1305–1322. doi:10.1016/j.petsci.2021.01.002
Wang, X., Jiang, Z., Jiang, S., Chang, J., Li, X., Wang, X., et al. (2020). Pore evolution and formation mechanism of organic-rich shales in the whole process of hydrocarbon generation: study of artificial and natural shale samples. Energy fuels. 34, 332–347. doi:10.1021/acs.energyfuels.9b03789
Wang, X., Liang, Q., Gao, C., Xue, P., Yin, J., and Hao, S. (2022). Hydrocarbon accumulation model influenced by “three elements” (source-storage-preservation) in lacustrine shale reservoir-A case study of Chang 7 shale in Yan’an area, Ordos Basin. Front. Earth Sci. 10, 1012607. doi:10.3389/feart.2022.1012607
Wei, Z., Wang, Y., Wang, G., Sun, Z., and Xu, L. (2018). Pore characterization of organic-rich late permian da-long Formation shale in the Sichuan Basin, southwestern China. Fuel 211, 507–516. doi:10.1016/j.fuel.2017.09.068
Wu, S., Yang, Z., Zhai, X., Cui, J., Bai, L., Pan, S., et al. (2019). An experimental study of organic matter, minerals and porosity evolution in shales within high-temperature and high-pressure constraints. Mar. Pet. Geol. 102, 377–390. doi:10.1016/j.marpetgeo.2018.12.014
Wu, S., Zhu, R., Cui, J., Bai, B., Zhang, X., Xu, J., et al. (2015). Characteristics of lacustrine shale porosity evolution, triassic chang 7 member, ordos basin, NW China. Pet. explor. Dev. 42, 185–195. doi:10.1016/s1876-3804(15)30005-7
Xi, Z., Tang, S., Wang, J., Yang, G., and Li, L. (2018). Formation and development of pore structure in marine-continental transitional shale from northern China across a maturation gradient: insights from gas adsorption and mercury intrusion. Int. J. Coal Geol. 200, 87–102. doi:10.1016/j.coal.2018.10.005
Xia, M., Wen, L., Wang, Y., Hong, H., Fan, Y., and Wen, Y. (2010). High quality source rocks in trough facies of upper permian Dalong Formation, Sichuan Basin. Pet. explor. Dev. 37, 654–662. doi:10.1016/s1876-3804(11)60002-5
Xiang, K., Shi, H., Wang, X., Zhao, Y., Dong, X., Pang, Q., et al. (2023). Reservoir characteristics and main controlling factors of gas content of deep shale gas in Southern Sichuan Basin. J. Northeast Petroleum Univ. 47, 44–55. doi:10.3069/j.issn.2095-4107.2023.03.005
Xu, L., Yang, K., Zhang, L., Jiang, Z., and Li, X. (2021). Organic-induced nanoscale pore structure and adsorption capacity variability during artificial thermal maturation: pyrolysis study of the Mesoproterozoic Xiamaling marine shale from Zhangjiakou, Hebei, China. J. Pet. Sci. Eng. 202, 108502. doi:10.1016/j.petrol.2021.108502
Zhai, G., Wang, Y., Liu, G., Lu, Y., He, S., Zhou, Z., et al. (2020). Accumulation model of the Sinian-Cambrian shale gas in western Hubei province, China. J. Geomechanics 26, 696–713. doi:10.12090/j.issn.1006-6616.2020.26.05.058
Zhang, J., Li, X., Xie, Z., Li, J., Zhang, X., Sun, K., et al. (2018). Characterization of microscopic pore types and structures in marine shale: examples from the Upper Permian Dalong formation, Northern Sichuan Basin, South China. J. Nat. Gas. Sci. Eng. 59, 326–342. doi:10.1016/j.jngse.2018.09.012
Zhang, K., Xi, Z., Zhang, S., Tang, S., Lv, J., Nie, H., et al. (2025). Characteristics of organic matter types and organic matter pore development in marine-continental transitional shale. Geol. J. 2025, 1–9. doi:10.1002/gj.5160
Zhang, S., Liu, H., Wang, M., Liu, X., Liu, H., Bao, Y., et al. (2019). Shale pore characteristics of Shahejie Formation: implication for pore evolution of shale oil reservoirs in Dongying sag, north China. Pet. Res. 4, 113–124. doi:10.1016/j.ptlrs.2019.01.002
Zhang, X., Shen, B., Yang, J., Sun, W., and Hou, D. (2021). Evolution characteristics of maturity-related sterane and terpane biomarker parameters during hydrothermal experiments in a semi-open system under geological constraint. J. Pet. Sci. Eng. 201, 108412. doi:10.1016/j.petrol.2021.108412
Zhao, J., Jin, Z., Jin, Z., Hu, Q., Hu, Z., Du, W., et al. (2017). Mineral types and organic matters of the Ordovician-Silurian Wufeng and Longmaxi shale in the Sichuan Basin, China: implications for pore systems, diagenetic pathways, and reservoir quality in fine-grained sedimentary rocks. Mar. Pet. Geol. 86, 655–674. doi:10.1016/j.marpetgeo.2017.06.031
Keywords: thermal simulation experiment, hydrocarbon gas generation process, organic matter pore evolution, low pressure N2 gas adsorption measurement, Dalong Formation shale
Citation: Zhang X, Xu X, Shen B, Xu Z, Yang J, Qin J, Hu C, Li S, Cao T, Huang Y and Tian T (2025) Hydrocarbon gas generation characteristics of organic-rich shale and its influence on organic matter pore formation and evolution—a case study of pyrolysis experiment on the Dalong Formation shale. Front. Earth Sci. 13:1578863. doi: 10.3389/feart.2025.1578863
Received: 18 February 2025; Accepted: 07 March 2025;
Published: 01 April 2025.
Edited by:
Calin Baciu, Babeș-Bolyai University, RomaniaReviewed by:
Enran Liu, China University of Petroleum, ChinaCopyright © 2025 Zhang, Xu, Shen, Xu, Yang, Qin, Hu, Li, Cao, Huang and Tian. This is an open-access article distributed under the terms of the Creative Commons Attribution License (CC BY). The use, distribution or reproduction in other forums is permitted, provided the original author(s) and the copyright owner(s) are credited and that the original publication in this journal is cited, in accordance with accepted academic practice. No use, distribution or reproduction is permitted which does not comply with these terms.
*Correspondence: Xuemin Xu, eHV4dWVtaW5AbWFpbC5jZ3MuZ292LmNu
Disclaimer: All claims expressed in this article are solely those of the authors and do not necessarily represent those of their affiliated organizations, or those of the publisher, the editors and the reviewers. Any product that may be evaluated in this article or claim that may be made by its manufacturer is not guaranteed or endorsed by the publisher.
Research integrity at Frontiers
Learn more about the work of our research integrity team to safeguard the quality of each article we publish.