
94% of researchers rate our articles as excellent or good
Learn more about the work of our research integrity team to safeguard the quality of each article we publish.
Find out more
ORIGINAL RESEARCH article
Front. Earth Sci., 11 March 2025
Sec. Geohazards and Georisks
Volume 13 - 2025 | https://doi.org/10.3389/feart.2025.1566556
This article is part of the Research TopicAdvanced Materials and Technologies for Sustainable Development of Underground ResourcesView all 43 articles
 Xiaofei Gong1,2
 Yong Liu1,2Qiang Li1,2Yingjian Ma3Minglei Zhai1*
 Dan Ma1,2*Zhenhua Li1*Jianjun Hou4Rui Qiao5,6Jiexiang Li1Haiyan Yang7Limin Fan2
The fault rocks exhibit low strength, high deformability, and high porosity, making them prone to connecting with the coal seam floor and forming water-conducting channels under the influence of mining activities and aquifer water pressure. Investigating the water inrush mechanism in fault rocks beneath coal seam floors is crucial for ensuring the safety and efficiency of coal mining operations involving fault structures. A test was conducted on the seepage-creep coupling of fault rocks under various stresses, water pressures, and cementation strengths. Based on this, a spatial and temporal evolution model for the seepage-creep coupling characteristics of faulted rocks was developed. The results reveal that the evolution of volumetric strain, flow velocity, porosity, and permeability in the fault rocks can be divided into two stages: the creep compression stage and the expansion damage stage. During the creep compression stage, the samples exhibit more pronounced creep deformation, transitioning into the expansion damage stage earlier under conditions of increased axial pressure, reduced confining pressure, elevated water pressure, and decreased cementation strength. The simulation results align closely with the experimental data. From the creep compression stage to the expansion damage stage, the seepage-creep characteristics evolve gradually at first, followed by a distinct turning point upon entering the expansion stage. This turning point is marked by a rapid increase in volume, along with a sharp rise in flow velocity, porosity, and permeability. Spatially, the seepage-creep characteristics exhibit a non-uniform change from the inlet to the outlet, with expansion damage characteristics first appearing at the outlet. This research provides a theoretical basis for safe and efficient coal mining in fault-affected areas.
Water inrush frequently occurs during the coal mining process, often triggered by complex hydrogeological conditions and mining disturbances (Wu et al., 2011; Ma et al., 2022b). Water inrush at the coal seam floor is a primary form of water disaster in mines, particularly in coal seams with fault structures (Qian et al., 2018; Li et al., 2019b; Zuo et al., 2022; Duan et al., 2024). Fault rocks are characterized by low strength, high deformability, and high porosity (Sun et al., 2019; Ma et al., 2021; Yu et al., 2022). Stress disturbance from the advancing working face, combined with the water pressure (WP) from the aquifer, makes water-conducting channels more likely to intersect with the coal seam floor, thereby triggering water inrush disaster (Figure 1). Therefore, to ensure the safe and efficient extraction of coal from fault-affected areas, it is essential to investigate the seepage-creep coupling characteristics and further elucidate the mechanism behind water inrush in fault rocks beneath the coal seam floor.
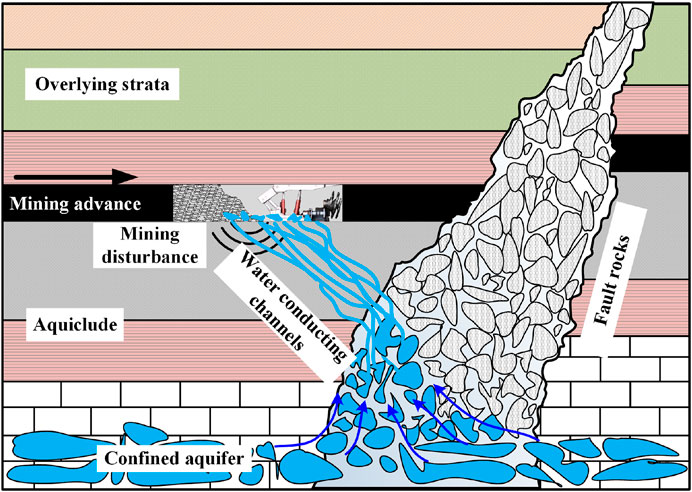
Figure 1. Schematic diagram of water inrush in fault rocks beneath the coal seam floor.
The water inrush mechanism of faults at the coal seam floor has been extensively studied by numerous scholars using laboratory tests, numerical simulations, and other methods (Ma et al., 2020; Nemati et al., 2021; Hou et al., 2024). Zhou et al. (2018) developed a typical water inrush model for faults and analyzed the stress concentration at the fault tip using finite element and fracture mechanics methods. They found that lower WP can lead to fault shear compression and rupture, triggering water inrush, while higher WP is more likely to cause shear rupture at the fault tip, also resulting in water inrush. Du et al. (2021) constructed a coupled stress-seepage theoretical model and employed the finite difference method to simulate water inrush under the combined influence of high stress and WP. Their results showed that fault water inrush during mining evolved from stress stabilization to concentration and, ultimately, stress release. Liu et al. (2017) developed a conceptual engineering geology model based on specific coal mine geological conditions. They investigated the formation of the conductive rise height of pressurized water along the fault fracture zone and proposed a time-dependent water inrush mechanism for fault rocks beneath the coal seam floor. Li et al. (2022) assessed the risk of water inrush under the coal seam floor using the vulnerability index method, describing fracture structure development with fractal dimensions, and identifying key factors controlling water inrush. While scholars predominantly focus on the mechanical and seepage characteristics of fault rocks and inrush fracture development (Wu J. et al., 2023; Wu R. et al., 2023), there remains insufficient exploration of the seepage-creep coupling behavior of fault rocks under mining disturbances and aquifer pressure. Additionally, the expansion damage characteristics of rocks during the later stages of creep are often overlooked.
Fault rocks in practical scenarios are influenced by stress disturbance caused by the advancing working face and the WP of the aquifer, leading to complex seepage and creep behavior (Brantut et al., 2013; Wang et al., 2021; Hou et al., 2023; Ma et al., 2023; Wu et al., 2024). This disturbance compromises the stability of the rock, making water inrush disasters more likely. To mitigate this phenomenon, scholars have conducted extensive research on the seepage and creep characteristics of fault rocks (Li et al., 2021; Wang and Cai, 2022; Wu et al., 2025). Regarding seepage characteristics, Liu et al. (2021) studied the seepage behavior of fractured sandstone, gangue, and tuff using the axial displacement control method. They presented relationships between the pore WP gradient and seepage velocity of colluvial rock samples under various axial pressure (AP) levels and explored how changes in porosity affect seepage. Yu et al. (2016) examined the effects of rock characteristics, AP, grain size distribution, and loading method on the seepage properties of saturated fractured rock using the MTS816.03 test system and a seepage testing apparatus. Ma et al. (2022c) developed a water-rock-sand three-phase flow model to simulate the evolution of hydraulic characteristics in fault rocks during water-sand inrush. Their results indicated that, as seepage progressed, rock particles at the outlet were the first to flow out. With increasing porosity and permeability, the water-sand outflow rate accelerated, ultimately leading to water inrush. Pang et al. (2022) investigated the seepage characteristics of fractured sandstone under triaxial stress using a self-developed test system and established a relationship between effective stress and seepage velocity that was well-matched with the Forchheimer equation. In terms of rock creep characteristics, Mansouri and Ajalloeian (2018) studied the mechanical properties of salt rock at different loading rates through uniaxial creep compression tests. Their findings showed that axial peak stress, axial peak strain, and elastic modulus increased with the loading rate. Zhang et al. (2021) conducted triaxial cyclic loading and unloading creep tests on granite and proposed a nonlinear elastic-plastic creep model incorporating multiple deformation components. However, most of the studies mentioned have only explored the damage mechanisms of fault rocks in terms of either seepage or creep (Wu et al., 2019; Wu et al., 2020; Yan et al., 2020; Zhou et al., 2020). In actual engineering practice, fault rocks are often subjected to the combined effects of both processes. Therefore, it is essential to study the water inrush characteristics of fault rocks under the coupled influence of seepage-creep.
In summary, significant progress has been made in studying the seepage and creep characteristics of rock masses influenced by factors such as WP, particle size, water content, and ground stress. However, the coupled seepage-creep behavior of fault rocks beneath coal seam floors remains underexplored. Specifically, the mechanism driving the expansion and damage of fault rock masses in the later stages of creep is not well understood.
In this study, we conducted tests on the coupled seepage-creep behavior of fault rocks under varying stress conditions, water pressure, and cementation strengths. A model was developed for the spatio-temporal evolution of seepage-creep coupling in faulted rocks. The study reveals the evolution patterns of these characteristics within the rock mass of the fault zone. These findings provide a theoretical foundation for the safe and efficient mining of coal in faulted areas.
Fault rocks exhibit characteristics such as low strength, high deformability, and high porosity (Li et al., 2019b), which make it challenging to collect in situ samples. To obtain samples with mechanical properties similar to those of fault rocks, a geotechnical method was used for preparation. Studies have shown that the mechanical and hydraulic properties of weakly cemented rock bodies can be accurately modeled using samples created by mixing sand, cement, gypsum, and water (Huang et al., 2019; Li et al., 2019a). Therefore, in this study, the samples were primarily composed of rock particles, cement, gypsum, and water, with the cementation strength (CS) varied by adjusting the ratio of cement to lime. The rock particles were sourced from the Kekegai Coal Mine in Yulin City, Shaanxi Province, China. Laboratory tests indicated that the natural density of the rock was 2.532 × 10³ kg/m3. The rock was initially crushed into particles smaller than 15 mm using a crusher, and five particle size groups (0–3 mm, 3–6 mm, 6–9 mm, 9–12 mm, and 12–15 mm) were screened using a high-frequency vibrating screen. The rock particles of different sizes were then uniformly mixed according to the Fuller equation (Fuller and Thompson, 1907):
where
Table 1 presents the specific parameters of the fault rock samples. Each sample had a cylindrical shape with a diameter of 70 mm and a height of 140 mm. The total mass of rock particles was 750 g. According to Equation 1, the masses of the individual rock sample groups were 335.41 g, 138.93 g, 106.61 g, 89.87 g, and 79.18 g, respectively. The total mass of cement in each sample was 250 g, with the cement-to-gypsum weight ratios being 3:1 (high CS), 1:1 (medium CS), and 1:3 (low CS) (Ma et al., 2021; Wu et al., 2022).
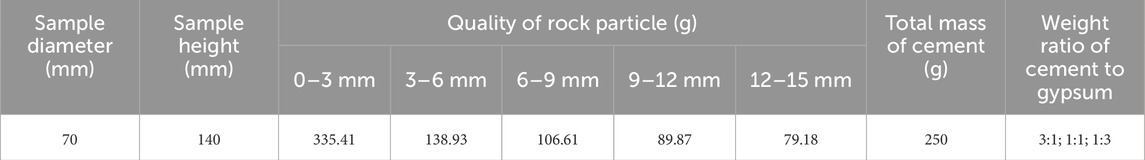
Table 1. Sample parameters of fault rock mass.
Figure 2 illustrates the test system used to study seepage-creep coupling characteristics of fault rock. The system consists primarily of a simulation chamber, an AP control system, a confining pressure (CP) control system, a WP control system, an auxiliary system, and a data acquisition system.
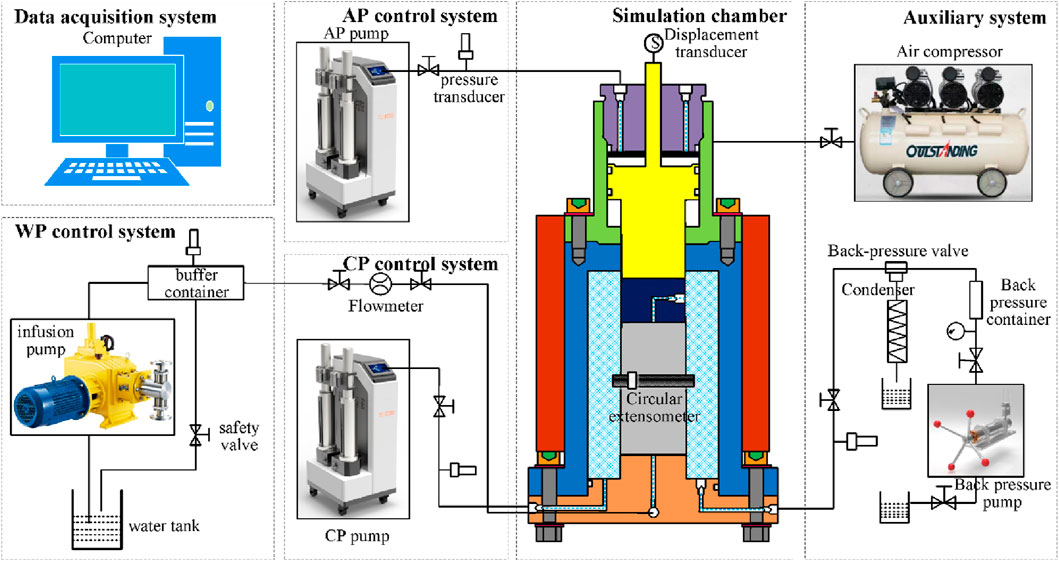
Figure 2. The test system for studying the seepage-creep coupling characteristics of fault rocks includes the following parameters: AP (axial pressure), CP (Confining pressure), and WP (Water pressure).
The experimental setup included a simulation chamber designed to load samples, capable of withstanding a maximum pressure of 20 MPa and a temperature of 150°C. The internal sample dimensions are Φ70 × 140 mm.
The AP control system, comprising an AP pump, consisting of an AP pump, pressure sensor, displacement sensor, and auxiliary pipelines, applied and monitored the AP, recorded its magnitude, and tracked the axial deformation of the samples. The AP pump operates within a pressure range of 0–50 MPa and includes an overpressure shutdown feature. The pressure sensor has a range of 0–50 MPa with an accuracy of 0.001 MPa, while the displacement sensor has a range of 0–20 mm with an accuracy of 0.01 mm.
The CP control system includes a CP pump, pressure sensor, safety valves, and auxiliary pipelines. The CP pump operates within a pressure range of 0–20 MPa, with all other parameters and functions identical to those of the AP control system.
The WP control system comprises a water injection pump, storage tank, flow meter, buffer container, safety valve, and auxiliary pipelines. The pump’s flow rate is regulated by a frequency converter, with the flow rate adjustable between 200 and 2000 mL/min. The water injection pressure ranges from 0 to 10 MPa, and the working flow rate is between 0 and 120 L/h. The maximum capacity of the water storage tank is 100 L. A turbine flowmeter monitors the flow rate throughout the test, with a range of 0–50 mL/min, and a maximum water pressure capacity of 10 MPa.
The auxiliary system played a critical role in ensuring the smooth and efficient execution of the test. The data acquisition system, which integrates multiple sensors, software for information gathering, and high-performance computing, processed the collected data to generate reports on various parameters, including AP, CP, and flow rates.
The seepage creep behavior of fault rocks beneath the coal seam floor is influenced by stress disturbances and seepage pressure, presenting a complex dynamic (Kang et al., 2023). To accurately replicate the water inrush process, the test focused on evaluating the effects of AP, CP, WP, and CS on the coupled rock seepage and creep characteristics. The test was conducted at ambient temperature using water as the working fluid, with three samples prepared for each group to minimize experimental errors. Details of the specific test plan are provided in Table 2.
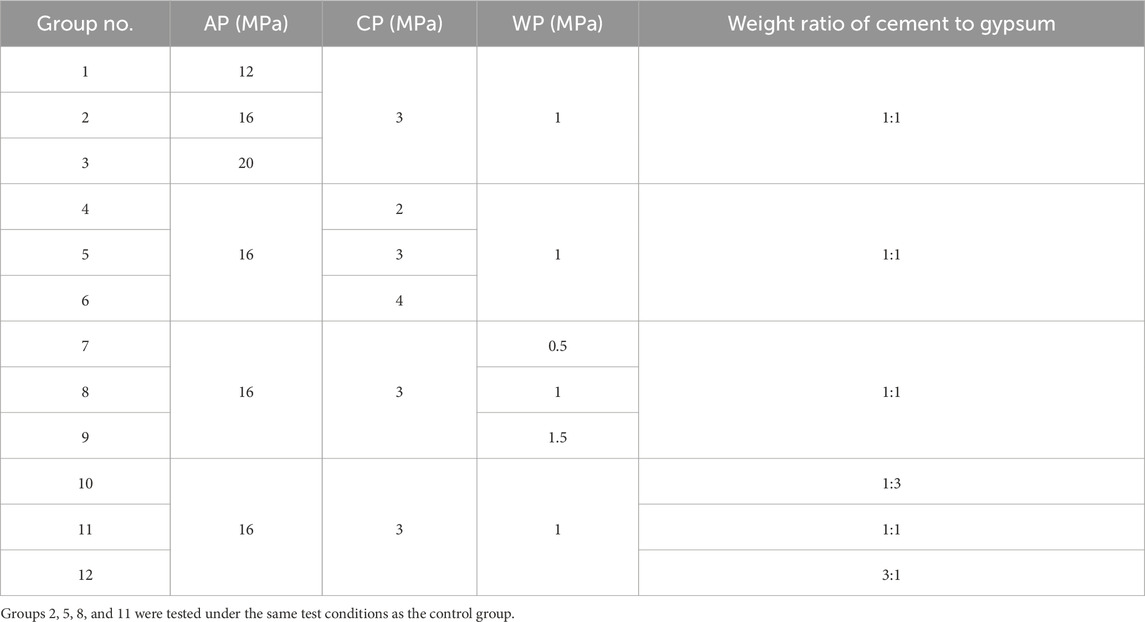
Table 2. Test plan of seepage-creep coupling characteristics of fault rocks.
Groups 1, 2, and 3 were conducted under the same CP, WP, and bonding strength. AP was varied as a parameter to analyze its influence on the seepage-creep coupling characteristics of fault rocks. As shown in Table 2, the APs for these samples were set to 12 MPa, 16 MPa, and 20 MPa, with a CP of 3 MPa, a WP of 1 MPa, and a cement-to-gypsum weight ratio of 1:1.
Groups 4, 5, and 6 were conducted under the same AP, WP, and CS conditions. CP was varied to assess its impact on the seepage-creep coupling characteristics. As shown in Table 2, the CPs for these samples were set to 0.5 MPa, 1 MPa, and 1.5 MPa, with an AP of 16 MPa, a WP of 1 MPa, and a cement-to-gypsum weight ratio of 1:1.
Groups 7, 8, and 9 were conducted under the same AP, CP, and CS conditions. WP was varied to evaluate its influence on the seepage-creep coupling characteristics. As shown in Table 2, the WPs for these samples were set to 0.5 MPa, 1 MPa, and 1.5 MPa, with an AP of 16 MPa, a CP of 3 MPa, and a cement-to-gypsum weight ratio of 1:1.
Groups 10, 11, and 12 were conducted under the same AP, CP, and WP, and the influence of surrounding rock strength on the seepage-creep coupling characteristics was analyzed by varying the CS. As shown in Table 2, the cement-to-gypsum weight ratios for these samples were set to 1:3, 1:1, and 3:1, with an AP of 16 MPa, a CP of 3 MPa, and a WP of 1 MPa.
The specific test steps are as follows:
(1) Test preparation: The samples were carefully prepared and polished with sandpaper to achieve the smoothest, flattest surface possible. The selected specimen was then inserted into the simulation chamber, with filter plates placed at both the top and bottom. After sealing, the “flange up” knob was engaged to gently raise the lower flange. The necessary pipelines were connected, and the chamber was securely sealed with bolts. Before starting the test, the system was activated to verify the operational status of all components.
(2) Stress loading: The AP pump was activated, and the samples were preloaded with 0.1 MPa of AP to stabilize the specimens in the simulation chamber. The CP pump was then initiated, loading both AP and CP to the predetermined value as outlined in the test plan, ensuring stability.
(3) WP loading: Once the AP and CP reached the desired values, the WP pump was activated to load the WP to the set value specified in the test plan, maintaining stability.
(4) Data recording and processing: After completing these steps, parameters such as axial displacement, annular displacement, and flow rate were recorded using the data acquisition system, and the initial data report was compiled.
(5) Post-test treatment: The WP, CP, and AP pumps were sequentially deactivated to stop pressure application. The air compressor was then activated to aerate the simulation chamber, and the fluid was evacuated to normalize the pressure. The securing bolts were removed, the “flange down” button was engaged, and the simulation chamber was opened to extract the specimen for photographic documentation. Finally, both the test system and chamber were thoroughly cleaned.
In this work, the initial time of the seepage-creep coupling test is denoted as
where
The volumetric strain of the samples at time
The seepage flow velocity at each time during the test, as recorded by the data collection system, can be used to calculate the seepage velocity of the fluid at time
where
Porosity is a key parameter used to characterize the development of the pore structure in fault rocks, directly influencing the seepage-creep coupling behavior of these rocks (Ma et al., 2022a). The porosity of the samples at the initial time can be calculated by the following definition:
where
Due to the direct impact of volumetric strain on porosity evolution during the deformation of fault rocks, if the skeletal volume of the rock mass remains constant and all volume deformation results from changes in pore volume, the deformation amount is denoted as
The porosity of the deformed sample is given by:
By substituting Equations 6, 7 into Equation 8, the relationship between volume strain and porosity change is obtained:
Substituting Equation 4 into Equation 7 yields the porosity of the samples at time
The seepage behavior of fault rocks can be described by Darcy’s law (Gao et al., 2022; Gao et al., 2023):
where
where
Figure 3 illustrates the evolution of seepage-creep coupling characteristics in the samples under varying APs. This evolution is divided into two distinct stages: the creep compaction stage and the expansion failure stage.
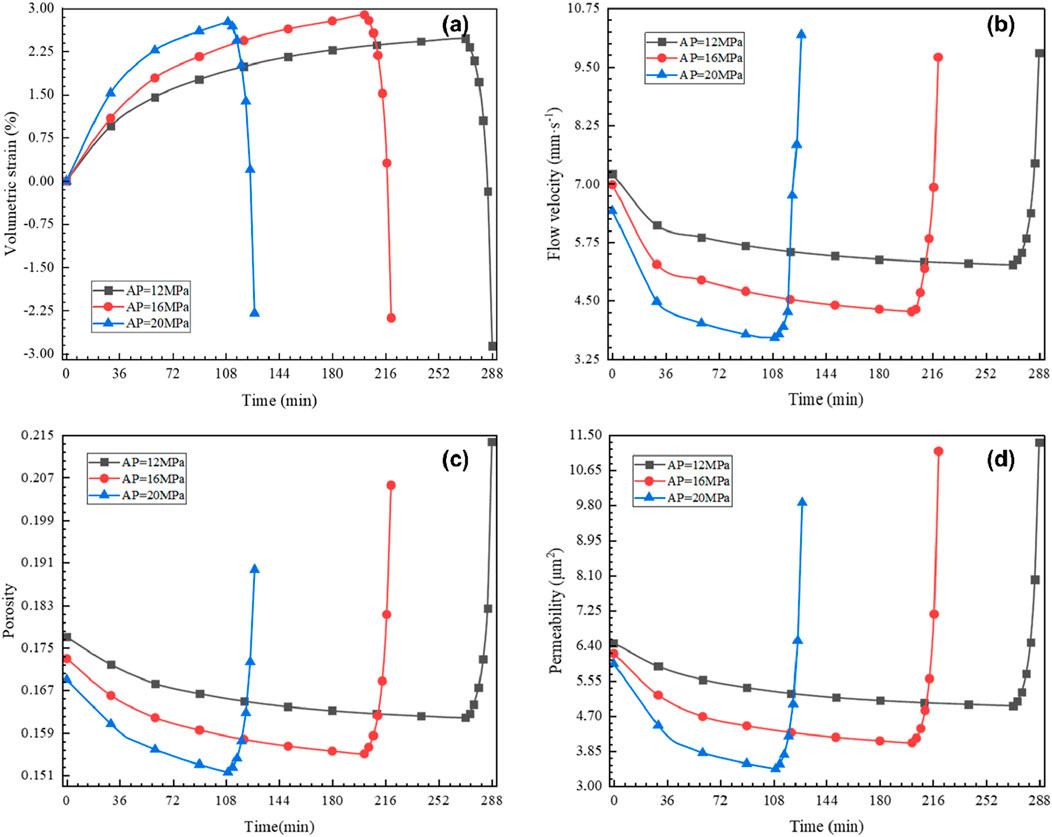
Figure 3. Variation in seepage-creep coupling characteristics of fault rocks under different Aps: (A) Volumetric strain, (B) Flow velocity, (C) Porosity, and (D) Permeability.
In the creep compaction stage, the bulk modulus of the samples gradually increases, while the flow velocity, porosity, and permeability decrease concurrently. This trend suggests that the volumetric expansion, induced by pore pressure, is overshadowed by compaction due to triaxial stress, which reduces the internal pore structure and constricts the seepage pathways. As the effects of pore pressure and triaxial stress on the volumetric strain of the rocks converge, the rate of change in hydraulic parameters slows down during this stage.
In the expansion failure stage, a rapid change in both mechanical and hydraulic parameters signifies the irreversible deformation of the rock samples. The internal pore structure progressively widens, forming an interconnected network of cracks, and the seepage pathways significantly expand. This stage is accompanied by an increased likelihood of water inrush, due to the swift changes in hydraulic parameters and extensive deformation of the surrounding rock mass over a short period.
Figure 3A shows the volumetric strain (Equations 2–4) evolution of the samples under different APs. Taking compression deformation as positive, the volumetric strain initially increases and then decreases rapidly with time. Higher APs lead to a faster increase in volumetric strain and earlier dilatation failure. This is due to the compaction effect of AP on the internal pore structure, which contrasts with the effect of pore pressure on the expansion of the internal pore structure. Both the compression of volume and the variation rate of this compression are marginal, delaying the occurrence of expansion damage. As AP increases, the volumetric strain rate of the rocks after dilatation becomes more pronounced, indicating more severe rock failure.
Figure 3B shows the evolution of flow velocity under different APs. Initially, the fluid velocity decreases with increasing AP, as a result of a higher degree of compaction and lower permeability at the initial moment. The velocity decreases initially and then increases rapidly over time. The larger the AP, the faster the velocity decreases in the compaction stage and the earlier it increases. This is because the decrease in porosity caused by AP is greater than the increase in porosity due to pore pressure, leading to a downward trend in fluid velocity during this stage. In samples with smaller APs, less volume compaction occurs, resulting in a lower likelihood of rock dilatation failure. Consequently, the rise in flow velocity is delayed, and the variation is smaller.
The porosity evolution (Equation 10) of each sample under different APs is presented in Figure 3C. The porosity of the samples initially decreases and then increases rapidly as time progresses. Higher APs cause a greater initial decrease in porosity and earlier occurrence of the increase. Under the same pore WP, the compaction volume of the samples increases with axial stress, leading to earlier crack formation and more severe damage. With lower APs, compaction deformation is small, and the flow is inhibited by the pore WP, resulting in more modest changes in flow velocity. The turning point of the flow velocity is thus delayed.
The variation in permeability (Equation 12) under different APs is shown in Figure 3D. The changes in permeability follow a similar trend to those in porosity. The variation in permeability is more pronounced and the time of increase is earlier with higher APs. This is because the volume compaction is stronger and the inhibitory effect of pore pressure is weaker under higher APs. Conversely, at lower APs, the inhibitory effect of pore pressure is more significant, leading to gentler changes in permeability and a delayed increase during the creep compaction stage.
The variation in volumetric strain for each sample under different CPs is shown in Figure 4A. Initially, the volumetric strain of all the samples increases, followed by a rapid decrease over time. Under high CP, the variation in volumetric strain stabilizes, and the turning point occurs later. In contrast, when the CP is low, the variation amplitude of volumetric strain is larger, and the downward trend occurs earlier. Due to the inhibition effect of CP on volumetric deformation, the deformation decreases, and the onset of expansion damage is delayed as CP increases.
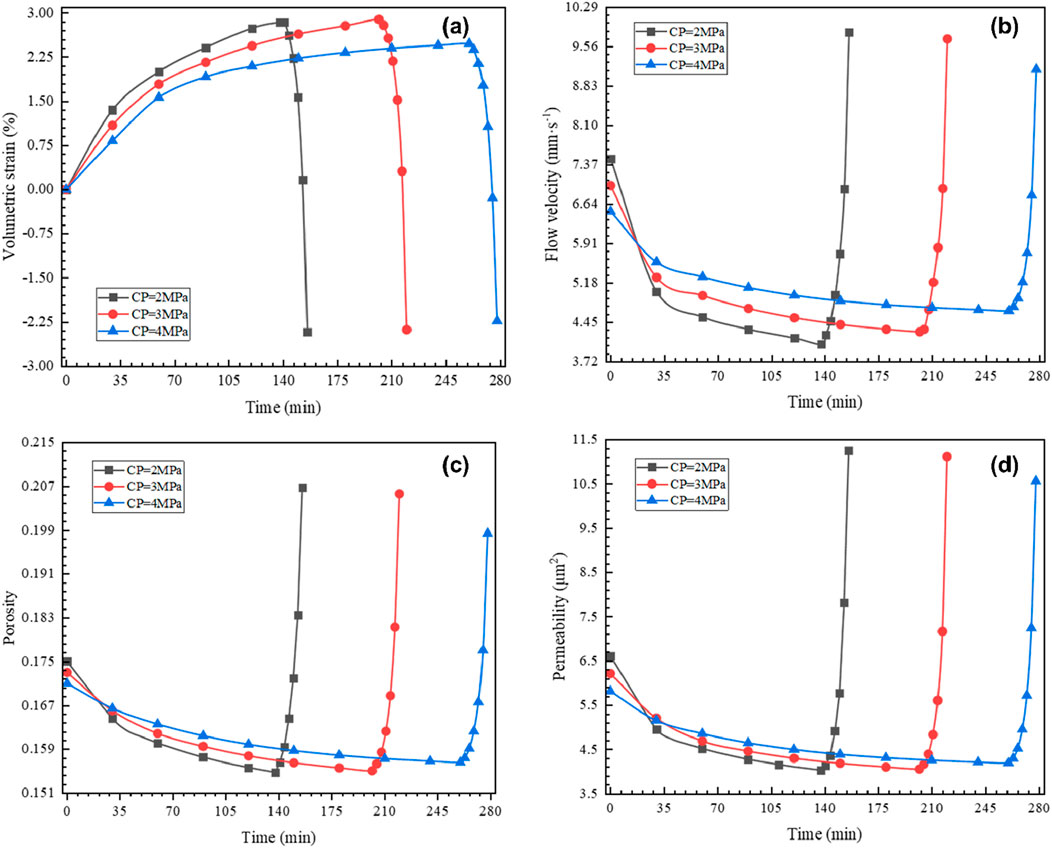
Figure 4. Variation in seepage-creep coupling characteristics of fault rocks under different CPs: (A) Volumetric strain, (B) Flow velocity, (C) Porosity, and (D) Permeability.
The evolution of flow velocity for each sample under different CPs is shown in Figure 4B. Over time, the flow velocity initially decreases slightly, then stabilizes, and finally increases significantly. The suppressive effect of higher CP on volumetric strain results in slower changes to the internal pore structure, with the sample’s porosity remaining relatively constant. Consequently, the onset of rock expansion damage is delayed. When CP is low, the suppressive effect weakens, leading to greater volume deformation and earlier onset of creep damage.
Figure 4C illustrates the porosity evolution for each sample under different CPs. The changes in porosity follow a similar trend across all samples, initially decreasing before rising rapidly with time. In samples subjected to higher surrounding pressures, porosity changes more gradually, and the increase in porosity occurs later. This is due to the inhibitory effect of CP on sample deformation, which protects the sample, making it less likely to expand or experience damage.
Figure 4D presents the variation in permeability for each sample under different CPs. The permeability change is more gradual, and the rise occurs later with higher CPs. Conversely, when CP is low, the permeability change is more pronounced, and the upward trend appears earlier. This behavior is also attributed to the protective effect of CP on sample deformation.
The variation in volumetric strain for each sample under different WPs is shown in Figure 5A. It can be observed that the volumetric strain of the fault rocks generally increases for most of the test duration, followed by a rapid expansion. As WP increases, the onset of rock expansion is slightly delayed. However, by the end of the test, the volumetric strain is greater under high WP, due to the larger pore pressure generated within the samples. This pore pressure resists deformation caused by the applied triaxial stresses, thus delaying the occurrence of expansion damage. Once dilatation occurs, the degree of damage to the rock samples increases with higher WP, and the growth rate of penetrating cracks accelerates, resulting in a larger volumetric strain.
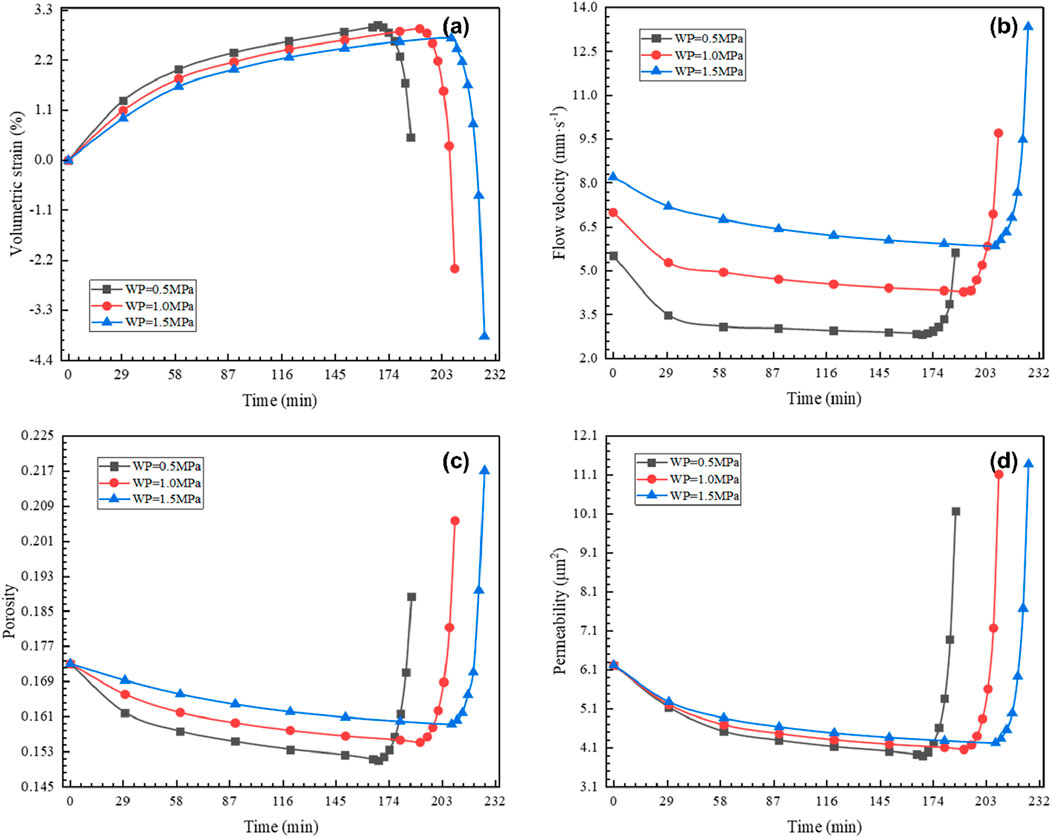
Figure 5. Variation in seepage-creep coupling characteristics of fault rocks under different WPs: (A) Volumetric strain, (B) Flow velocity, (C) Porosity, and (D) Permeability.
Figure 5B presents the change in flow velocity during the tests under different WPs. The initial fluid velocity increases with WP. The velocity first decreases to a steady state before undergoing a large increase, which aligns with the observations in the previous section. Notably, during the creep compression stage, the decline in flow velocity is slower with higher WP. Although the delay in rock expansion is gradual and slight, the flow velocity remains higher overall and increases more sharply during the expansion damage stage. This suggests a higher likelihood and risk of water inrush hazards.
Figure 5C shows the variation in porosity during the test under different WPs. In the creep compression stage, the rate of porosity decline is slower with higher WP, and the onset of porosity increase is delayed. This can be attributed to the higher pore pressure associated with increased WP, which enhances the compressive stress response in the samples. However, once rock dilatation occurs, the rate of porosity increase accelerates with higher WP, indicating that higher WP induces more intense rock damage, leading to the rapid formation of additional pore structures inside the samples.
The permeability evolution under different WPs is shown in Figure 5D. The permeability of the samples initially decreases to a stable state, then increases sharply, which is consistent with the porosity variation. However, the permeability changes are similar across different WPs, as higher internal fluid velocities under larger pressures result in less variation in permeability.
Figure 6A illustrates the variation in volumetric strain for samples with different CSs. It is evident that, as CS decreases, the samples experience greater volumetric deformation during the compressive creep stage, and the rocks become more prone to expansion. Strongly cemented samples exhibit smaller volume changes due to the stronger inter-particle bonding. In contrast, samples with low CS have weaker cementation forces, making the rocks more susceptible to volumetric deformation, resulting in a larger magnitude of change and earlier rock expansion failure.
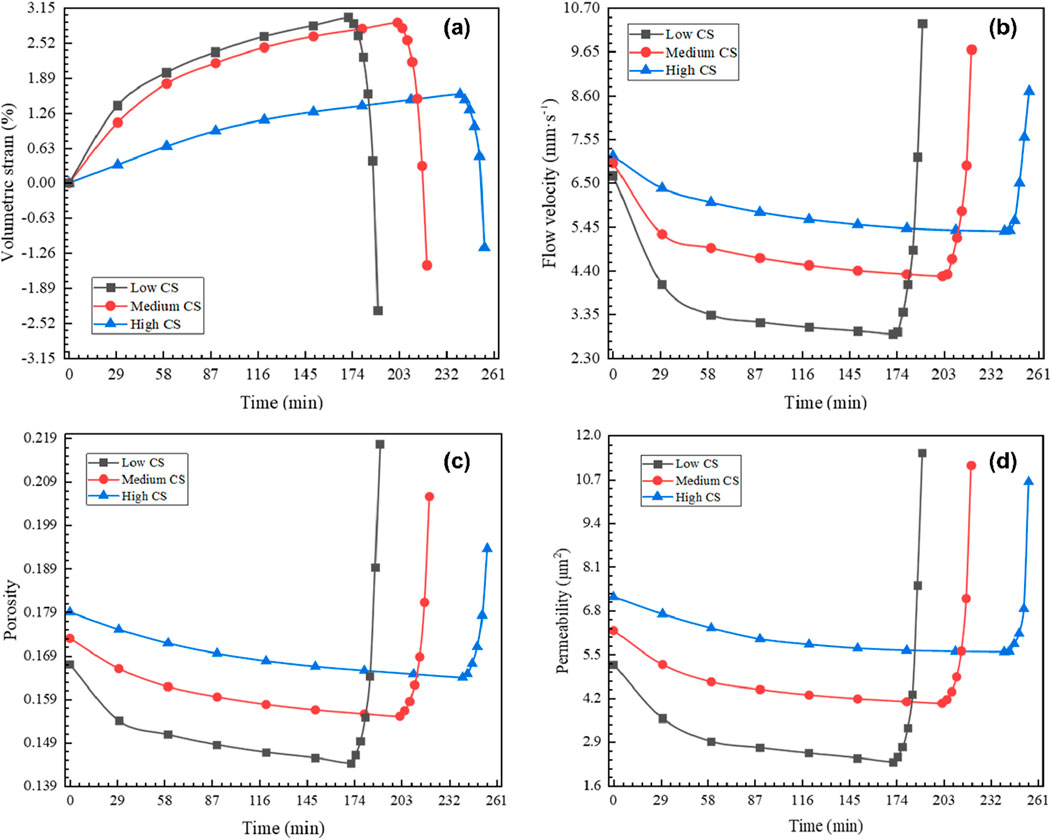
Figure 6. Variation in seepage-creep coupling characteristics of fault rocks under different CSs: (A) Volumetric strain, (B) Flow velocity, (C) Porosity, and (D) Permeability.
The variation in flow velocity for samples with different CSs is shown in Figure 6B. For samples with strong cementation, the velocity fluctuations are smaller, and the sudden increase in fluid speed is delayed. This is due to the strong cementation, which impedes the displacement of internal rock particles. Additionally, the gypsum absorbs water and swells, reducing the pore volume and leading to a higher initial flow velocity in the samples with higher cementing strength.
Figure 6C presents the variation in porosity for samples with different CSs. It can be observed that initial porosity increases with higher cementing strength, influenced by the type of cementing material used in the tests. As the test progresses, the porosity increases significantly earlier in the lower cementing strength samples, indicating the formation of penetration fractures and expansion damage. In contrast, higher cementing strength samples, with more cement content, are less prone to internal particle displacement, resulting in later onset of expansion damage.
Figure 6D shows the variation in permeability for samples with different CSs. The time required for samples to undergo expansion damage increases with higher cementing strength. This is due to the stronger forces between particles in higher CS samples, which make the rock particles more resistant to displacement under the combined effects of seepage and stress.
To further investigate the evolution of the seepage-creep coupling characteristics of fault rocks, it is essential to establish a seepage-creep coupling model based on the actual characteristics of the fault beneath the coal seam floor during a water inrush disaster.
The following assumptions are made to simplify the analytical process:
(1) It is assumed that there is no migration of rock particles during seepage and that fluid flows in one direction, following Darcy’s law.
(2) It is assumed that the internal porosity of the weakly cemented rock mass represents the effective porosity, meaning the internal pores are interconnected with the external environment and are filled with water during seepage.
(3) It is assumed that the fault rocks are homogeneous, continuous, and isotropic.
In this context, the creep strain during the creep compression stage is derived from the Kelvin model under triaxial compression (Ren et al., 2022), and its vector form can be expressed as:
where
By substituting Equation 13 into Equation 4, the formula for the volumetric strain of rock under triaxial stress can be derived as follows:
where
Considering the characteristics of rock expansion damage, a damage coefficient quantifies the degree of rock expansion is introduced (Li et al., 2024):
where
According to Tan (1983), the following constitutive equation describes the rock expansion phenomenon:
where
By substituting the expression
To simplify the calculation, let
where
The eigenstructure equations for the expansion damage stage can be obtained by combining Equation 15 through Equation 18:
For loose rock masses, considering the effect of pore water pressure on the total stress, the stress field control equation can be expressed as (Ma et al., 2023):
where
Assuming the fluid percolation process follows Darcy’s law, the governing equation for the percolation field is:
Additionally, auxiliary equations are required to close the system of control equations. By taking the first-order derivative of Equation 9 concerning time, the porosity evolution equation for the water inrush process in fault rocks is obtained:
The permeability of a rock mass is closely related to its porosity, and this relationship is often described by the Carman-Kozeny equation:
By coupling Equations 14, 19–23, the set of coupled control equations for the seepage-creep behavior of fault rocks can be obtained as:
The model was solved using COMSOL Multiphysics software. Considering the actual stress state of the fault rock samples in the seepage-creep coupling tests, and the uniform axisymmetric cylinder samples, a rectangular numerical model was established with a height of 140 mm and a width of 35 mm.
The model material was the grains of the fault rocks whose Talbot index is 0.5. The boundary conditions are shown in Figure 7A. Nine measurement points were set at 6 mm, 22 mm, 38 mm, 54 mm, 70 mm, 86 mm, 102 mm, 118 mm, and 134 mm of the samples respectively, as shown in Figure 7B.
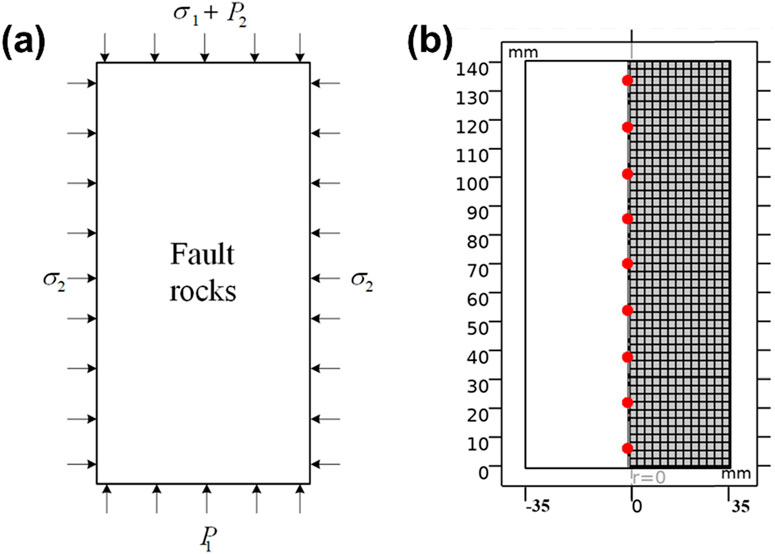
Figure 7. Coupled seepage-creep model for fault rocks (A) Boundary conditions, (B) Mesh generation.
The relevant parameters of the model can be determined through uniaxial compression tests, creep deformation tests, and hydraulic seepage mechanics tests, as outlined in Table 3.
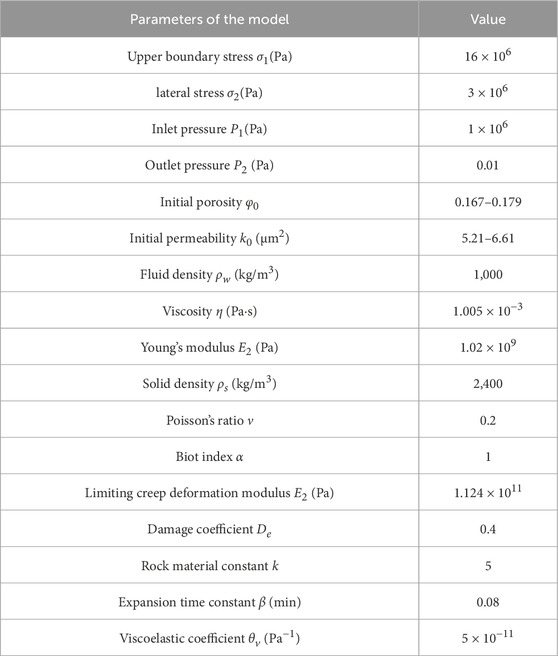
Table 3. Model parameter.
Before conducting the simulation, it is essential to validate the model to ensure its reliability, using porosity as the validation variable. The calculated values of the coupled numerical model for seepage and creep of fault rocks are compared with experimental values, and the results, along with errors, are analyzed.
From the model’s calculation results, the function
The absolute percentage error (APE) is used to quantify the error between the test value and the calculated porosity at time
The overall porosity error in the coupled seepage-creep test for the fault rocks is measured by the mean absolute percentage error (MAPE):
Figures 8, 9 display the comparative results between simulations and tests for porosity under varying AP, CP, WP, and CS conditions, along with the corresponding MAPE values (Equations 25–27). The trend in porosity changes mirrors the test results, showing a gradual decrease followed by a rapid increase over time under different influencing factors. A detailed analysis of porosity calculation accuracy across various conditions reveals that CS has the most significant impact on model precision. Specifically, the MAPE value of the model at higher CS levels is only 0.63%, compared to 2.46% at lower CS levels. This discrepancy is likely due to reduced creep deformation and minimal porosity changes in samples with stronger cementation. The consistency in MAPE values across other factors indicates the model’s stable performance.
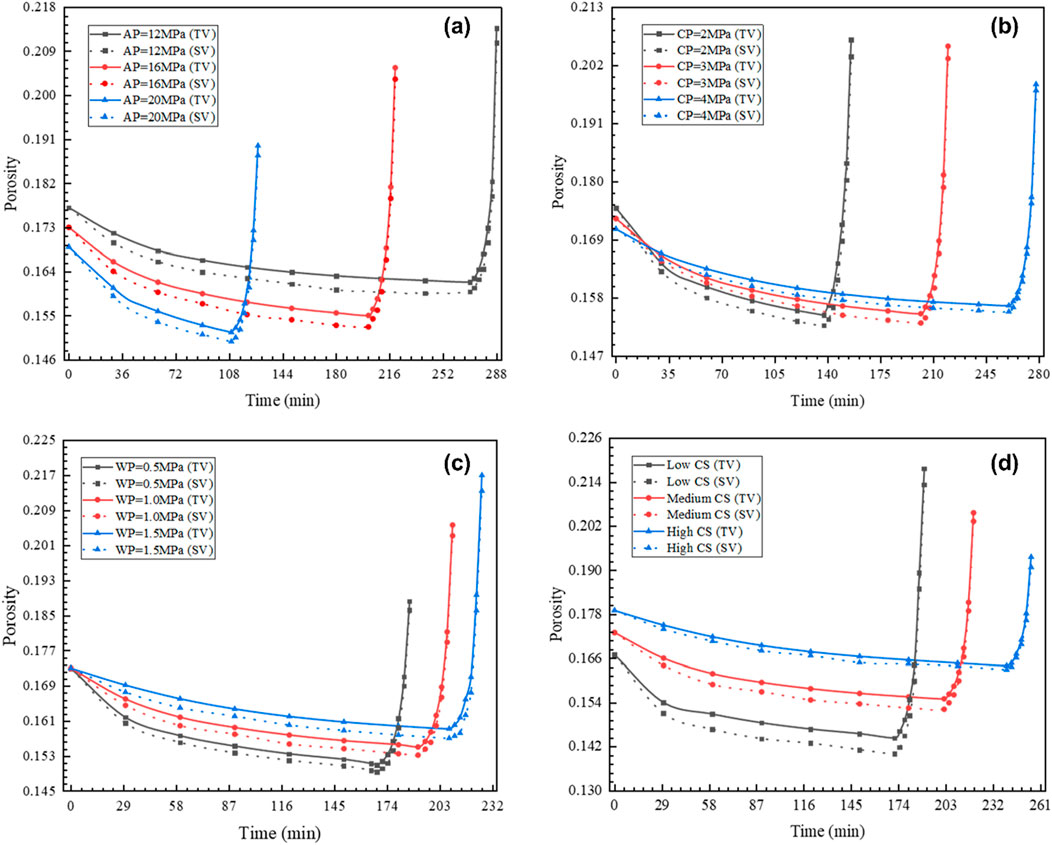
Figure 8. Comparison and error analysis of porosity test results versus simulation results: (A) Different APs, (B) Different CPs, (C) Different WPs, (D) Different CSs. (TV: Test value, SV: Simulation value).
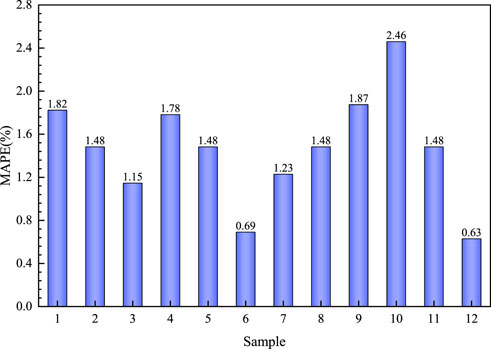
Figure 9. Comparison of the MAPE values of porosity in different samples.
Comparing the simulated and tested values for different samples, the MAPE value decreases as AP, CP, and CS increase, while WP decreases. This trend can be attributed to the higher uncertainty in creep calculations caused by high-velocity seepage. In the cases with slower fluid flow velocity in the samples, the model’s accuracy is higher. Throughout the simulation, all MAPE values remain below 3%, indicating that the coupled seepage-creep model has good accuracy and can effectively reflect the variation patterns of hydraulic characteristic parameters in real-world projects.
After verifying the model’s reliability, the spatio-temporal evolution of volumetric strain, velocity, porosity, and permeability in fault rocks is obtained.
Figure 10 illustrates the spatio-temporal evolution of volumetric strain in faulted rock samples. During the compaction stage, volumetric strain at each location steadily increases, stabilizing at 2.95%. Locations closer to the sample’s entrance experience a smaller reduction in volumetric strain, which is attributed to increased porosity from pore water pressure (WP), while compression (CP) reduces porosity. Subsequently, volumetric strain sharply decreases, reaching a minimum of −2.42%, with expansion being more pronounced near the outlet. This is linked to lower pore WP at the outlet, leading to higher effective stress within the rocks. As a result, it is deduced that penetration cracks first develop at the outlet, exhibiting a distinct expansion characteristic.
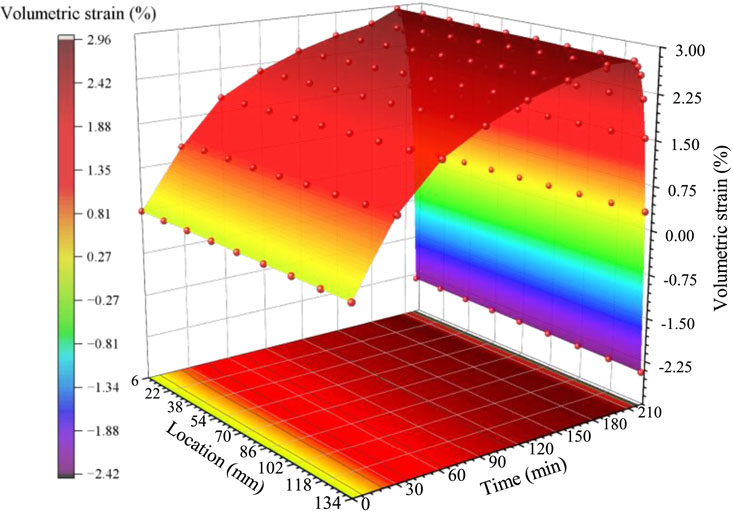
Figure 10. Spatio-temporal evolution of volumetric strain in seepage-creep coupling models.
Figure 11 shows the spatio-temporal evolution of flow velocity in the samples during the simulation. Initially, flow velocity decreases and stabilizes within the first 30 min. Locations near the sample’s inlet exhibit higher flow velocities due to stronger fluid influence and reduced volumetric strain, which results from the combined effects of pore WP and triaxial stress. Around 201 min, flow velocity increases sharply, driven by the reduced impact of pore WP on flow speed and the increasing influence of applied pressure (AP). This increase is linked to the expansion of original pore spaces into perforation fractures under AP loading, causing sample expansion and deformation, which enhances fluid velocity. Furthermore, the development of additional water-conducting channels under the seepage-stress effect significantly boosts fluid velocity, especially near the outlet, where the rate of increase is more pronounced.
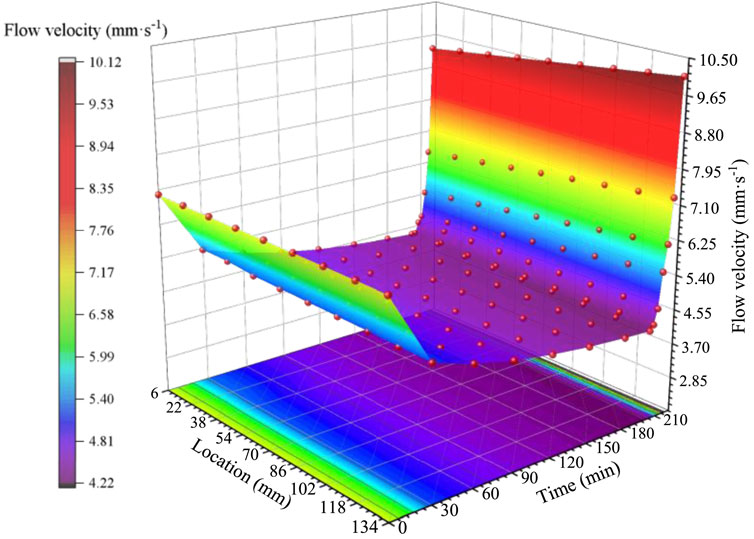
Figure 11. Spatio-temporal evolution of flow velocity in seepage-creep coupling models.
Figure 12 illustrates the spatio-temporal evolution of porosity. Initially, the observed decrease in porosity indicates that compressive deformation, driven by the coupling of stress and seepage, reduces the sample’s inherent tectonic porosity. This trend suggests that, during the compaction deformation stage of fault rocks in the coal floor, the increase in porosity due to pore water pressure (WP) is consistently outweighed by the decrease caused by triaxial stress, leading to an overall decline in porosity. Proximity to the fluid inlet is associated with higher porosity, a result of increased pore WP in these regions. After 60 min, porosity stabilizes, reflecting an equilibrium between the porosity increase from pore WP and the decrease due to triaxial stress. At approximately 201.72 min, a sharp increase in porosity is observed, attributed to damage and the formation of penetrating cracks under triaxial stress, which significantly elevates porosity levels. This effect is more pronounced near the outlet, where the rocks exhibit greater damage.
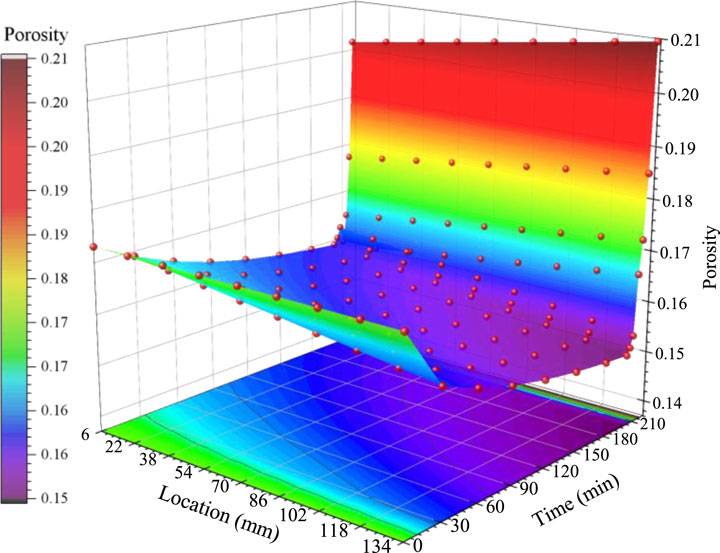
Figure 12. Spatio-temporal evolution of porosity in seepage-creep coupling models.
Figure 13 depicts the spatio-temporal evolution of permeability during the simulation. Initially, permeability at each location decreases, followed by a rapid increase, mirroring the trend observed for porosity. Notably, during compression and deformation, permeability is higher near the fluid inlet and lower near the fluid outlet in deeper fault rocks, reflecting changes in structural pore dynamics induced by pore WP. During the expansion deformation stage, internal damage leading to the formation of penetrating cracks significantly enhances permeability. Moreover, permeability at the fluid outlet is higher than at the inlet during this stage, indicating that dilatational failure in the fault rock samples preferentially occurs at the outlet under triaxial stress.
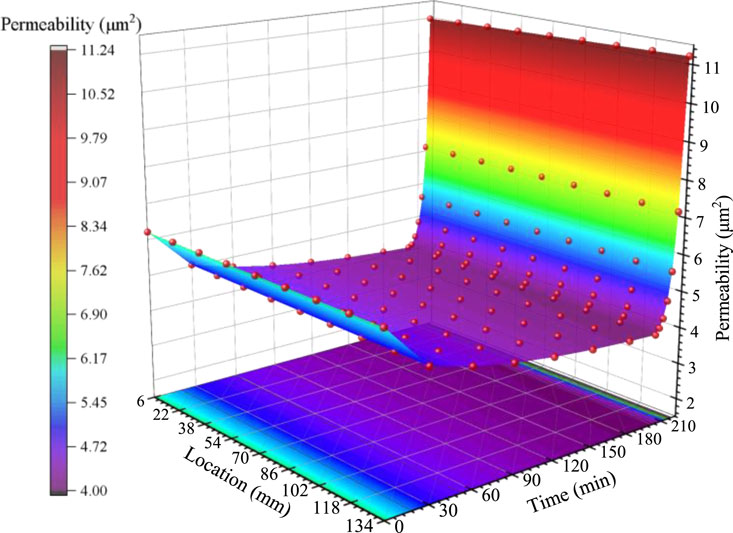
Figure 13. Spatio-temporal evolution of permeability in seepage-creep coupling models.
To better understand the evolution of seepage-creep coupling characteristics in fault rocks and to uncover the mechanism behind water inrush hazards in coal mines, the self-designed seepage-creep coupling test system for fault rocks was used to conduct experiments under various conditions. The evolution of these seepage-creep coupling characteristics during water inrush was examined, and the reliability of the results was validated through simulation. The main conclusions are as follows:
(1) The water inrush process in fault rocks under the influence of seepage-creep coupling occurs in two stages. In the creep compression stage, triaxial stress predominantly controls the internal pore compression and expansion damage of the samples. In the expansion damage stage, irreversible deformation and the formation of penetrating cracks occur due to the combined effects of pore water pressure (WP) and triaxial stress.
(2) A comparison of test results under different influencing factors reveals that the creep-compression effect intensifies as the applied pressure and WP increase, and as the coal porosity and coal strength decrease. In samples exhibiting significant creep-compression phenomena, substantial irreversible damage to the skeletal structure leads to an earlier onset of the expansion damage stage, making water inrush events more likely.
(3) The temporal and spatial evolution of the coupled seepage-creep characteristics in fault rocks was obtained using a validated numerical model. From the creep compression stage to the expansion damage stage, the evolution of these characteristics initially changes gradually, followed by a distinct turning point at the onset of expansion. This turning point is marked by a rapid increase in volume, as well as sharp rises in flow velocity, porosity, and permeability. Spatially, the seepage-creep characteristics exhibit a non-uniform trend from the inlet to the outlet.
The original contributions presented in the study are included in the article/supplementary material, further inquiries can be directed to the corresponding authors.
XG: Conceptualization, Formal Analysis, Methodology, Writing–original draft. YL: Formal Analysis, Software, Writing–original draft. QL: Funding acquisition, Validation, Writing–review and editing. YM: Software, Writing–review and editing. MZ: Writing–review and editing, Data curation, Formal analysis, Investigation. DM: Funding acquisition, Project administration, Supervision, Writing–review and editing. ZL: Funding acquisition, Project administration, Supervision, Validation, Writing–review and editing. JH: Validation, Writing–review and editing. RQ: Validation, Writing–review and editing. JL: Methodology, Writing–review and editing. HY: Validation, Writing–review and editing. LF: Project administration, Writing–review and editing.
The author(s) declare that financial support was received for the research, authorship, and/or publication of this article. This research was funded by the National Natural Science Foundation of China (Grant Nos U23B2091, 52304104, U24B2041, and 52174073), the National Key R&D Program of China (Grant No. 2022YFC2905600), the Program for the Scientific and Technological Innovation Team in Universities of Henan Province (Grant No. 23IRTSTHN005).
Author YM was employed by CCTEG Xi’an Research Institute (Group) Co., Ltd. Author JH was employed by Xinzheng Coal Electricity Zhengzhou Coal Industry Group. Author RQ was employed by Jiaozuo Coal Group Co., Ltd and Jiaozuo Shenlong Hydrogeological Engineering Co., Ltd.
The remaining authors declare that the research was conducted in the absence of any commercial or financial relationships that could be construed as a potential conflict of interest.
The author(s) declare that no Generative AI was used in the creation of this manuscript.
All claims expressed in this article are solely those of the authors and do not necessarily represent those of their affiliated organizations, or those of the publisher, the editors and the reviewers. Any product that may be evaluated in this article, or claim that may be made by its manufacturer, is not guaranteed or endorsed by the publisher.
Brantut, N., Heap, M. J., Meredith, P. G., and Baud, P. (2013). Time-dependent cracking and brittle creep in crustal rocks: a review. J. Struct. Geol. 52 (0), 17–43. doi:10.1016/j.jsg.2013.03.007
Du, Y., Liu, W., Meng, X., Pang, L., and Han, M. (2021). Effect of crack propagation on mining-induced delayer water inrush hazard of hidden fault. Geofluids 2021, 1–12. doi:10.1155/2021/6557578
Duan, H., Ma, D., Zou, L., Xie, S., and Liu, Y. (2024). Co-exploitation of coal and geothermal energy through water-conducting structures: improving extraction efficiency of geothermal well. Renew. Energy 228, 120666. doi:10.1016/j.renene.2024.120666
Fuller, W. B., and Thompson, S. E. (1907). The laws of proportioning concrete. Trans. Am. Soc. Civ. Eng. 59 (2), 67–143. doi:10.1061/taceat.0001979
Gao, X., Zhang, Y., Cheng, Y., Yu, Z., Hu, Z., and Huang, Y. (2023). Heat extraction performance of fractured geothermal reservoirs considering aperture variability. Energy 269, 126806. doi:10.1016/j.energy.2023.126806
Gao, X., Zhang, Y., Cheng, Y., Yu, Z., and Huang, Y. (2022). Impact of fractures with multi-scale aperture variability on production observations of geothermal reservoir units. J. Hydrol. 615, 128693. doi:10.1016/j.jhydrol.2022.128693
Hou, W., Ma, D., Liu, X., and Zhang, J. (2024). Experimental study on hydraulic and mechanical properties of fault rock under the thermal-hydraulic-mechanical coupling. Geothermics 119, 102975. doi:10.1016/j.geothermics.2024.102975
Hou, W. T., Ma, D., Li, Q., Zhang, J., Liu, Y., and Zhou, C. (2023). Mechanical and hydraulic properties of fault rocks under multi-stage cyclic loading and unloading. Int. J. Coal Sci. Techn. 10 (1), 54–20. doi:10.1007/s40789-023-00618-0
Huang, Z., Zeng, W., Wu, Y., Li, S., and Zhao, K. (2019). Experimental investigation of fracture propagation and inrush characteristics in tunnel construction. Nat. Hazards 97 (1), 193–210. doi:10.1007/s11069-019-03634-z
Kang, H., Gao, F., Xu, G., and Ren, H. (2023). Mechanical behaviors of coal measures and ground control technologies for China’s deep coal mines -A review. J. Rock Mech. Geotech. 15 (1), 37–65. doi:10.1016/j.jrmge.2022.11.004
Li, A., Deng, H., Zhang, H., Jiang, M., Liu, H., Xiao, Y., et al. (2021). Developing a two-step improved damage creep constitutive model based on soft rock saturation-loss cycle triaxial creep test. Nat. Hazards 108 (2), 2265–2281. doi:10.1007/s11069-021-04779-6
Li, R.-P., Zheng, L., Xie, J., Lin, J.-Y., and Qiu, Q. (2022). Risk assessment of water inrush from coal floor based on Karst fractal-vulnerability index method. Math. Probl. Eng. 2022, 1–12. doi:10.1155/2022/2124231
Li, S., Gao, C., Zhou, Z., Li, L., Wang, M., Yuan, Y., et al. (2019a). Analysis on the precursor information of water inrush in Karst tunnels: a true triaxial model test study. Rock Mech. Rock. Eng. 52 (2), 373–384. doi:10.1007/s00603-018-1582-2
Li, S., Wu, J., Xu, Z., and Yang, W. (2019b). Mechanics criterion of water inrush from the coal floor under influence of fault and its engineering application. Int. J. Geomech. 19 (5), 4019022. doi:10.1061/(asce)gm.1943-5622.0001387
Li, T., Chen, C., Peng, F., Ma, C., Li, M., and Wang, Y. (2024). Creep damage constitutive model of rock based on the mechanisms of crack-initiated damage and extended damage. Undergr. Space 18, 295–313. doi:10.1016/j.undsp.2023.12.008
Liu, S., Liu, W., and Yin, D. (2017). Numerical simulation of the lagging water inrush process from insidious fault in coal seam floor. Geotech. Geol. Eng. 35 (3), 1013–1021. doi:10.1007/s10706-016-0156-x
Liu, Y., Li, S., Li, W., Luo, Z., Wu, L., and Xu, Z. (2021). Permeability characteristics of water-sand seepage in fracture by experiment. Adv. Civ. Eng. 2021. doi:10.1155/2021/7199627
Ma, D., Duan, H., and Zhang, J. (2022a). Solid grain migration on hydraulic properties of fault rocks in underground mining tunnel: radial seepage experiments and verification of permeability prediction. Tunn. Undergr. Sp. Tech. 126 (0), 104525. doi:10.1016/j.tust.2022.104525
Ma, D., Duan, H., Zhang, J., and Bai, H. (2022b). A state-of-the-art review on rock seepage mechanism of water inrush disaster in coal mines. Int. J. Coal Sci. Techn. 9 (1), 50–28. doi:10.1007/s40789-022-00525-w
Ma, D., Duan, H., Zhang, J., Liu, X., and Li, Z. (2022c). Numerical simulation of water–silt inrush hazard of fault rock: a three-phase flow model. Rock Mech. Rock. Eng. 55 (8), 5163–5182. doi:10.1007/s00603-022-02878-9
Ma, D., Kong, S., Li, Z., Zhang, Q., Wang, Z., and Zhou, Z. (2021). Effect of wetting-drying cycle on hydraulic and mechanical properties of cemented paste backfill of the recycled solid wastes. Chemosphere 282 (0), 131163. doi:10.1016/j.chemosphere.2021.131163
Ma, D., Li, Q., Cai, K.-c., Zhang, J.-x., Li, Z.-h., Hou, W.-t., et al. (2023). Understanding water inrush hazard of weak geological structure in deep mine engineering: a seepage-induced erosion model considering tortuosity. J. Cent. South Univ. 30 (2), 517–529. doi:10.1007/s11771-023-5261-4
Ma, K., Sun, X., Tang, C. a., Wang, S., Yuan, F., Peng, Y., et al. (2020). An early warning method for water inrush in Dongjiahe coal mine based on microseismic moment tensor. J. Cent. South Univ. 27 (10), 3133–3148. doi:10.1007/s11771-020-4534-4
Mansouri, H., and Ajalloeian, R. (2018). Mechanical behavior of salt rock under uniaxial compression and creep tests. Int. J. Rock Mech. Min. 110 (0), 19–27. doi:10.1016/j.ijrmms.2018.07.006
Nemati, S. F., Moghadas, N. H., Lashkaripour, G. R., and Sadeghi, H. (2021). Identification of hidden faults using determining velocity structure profile by spatial autocorrelation method in the west of Mashhad plain(Northeast of Iran). J. Mt. Sci-Engl 18 (12), 3261–3274. doi:10.1007/s11629-020-6511-7
Pang, M.-k., Zhang, T.-j., Li, Y., and Song, S. (2022). Experimental investigation of water-gas mixed seepage parameters characteristics in broken coal medium. Energy Rep. 8, 281–289. doi:10.1016/j.egyr.2021.11.222
Qian, Z., Huang, Z., and Song, J. (2018). A case study of water inrush incident through fault zone in China and the corresponding treatment measures. Arab. J. Geosci. 11 (14), 381. doi:10.1007/s12517-018-3727-8
Ren, X., Xin, Y., Jia, B., Gao, K., Li, X., and Wang, Y. (2022). Large stress-gradient creep tests and model establishment for red sandstone treated at high temperatures. Energies 15 (7786), 7786. doi:10.3390/en15207786
Sun, W., Xue, Y., Li, T., and Liu, W. (2019). Multi-field coupling of water inrush channel formation in a deep mine with a buried fault. Mine Water Environ. 38 (3), 528–535. doi:10.1007/s10230-019-00616-2
Tan, T. (1983). “Time-dependent dilatancy prior to rock failure and earthquakes,” in 5th ISRM Congress. (Melbourne, Australia).
Wang, M., and Cai, M. (2022). Modeling of time-dependent deformation of jointed rock mass. Rock Mech. Rock. Eng. 55 (4), 2049–2070. doi:10.1007/s00603-021-02750-2
Wang, Z., Gu, L., Zhang, Q., and Jang, B.-A. (2021). Influence of initial stress and deformation states on the shear creep behavior of rock discontinuities with different joint roughness coefficients. Rock Mech. Rock. Eng. 54 (11), 5923–5936. doi:10.1007/s00603-021-02633-6
Wu, F., Chen, J., and Zou, Q. (2019). A nonlinear creep damage model for salt rock. Int. J. Damage Mech. 28 (5), 758–771. doi:10.1177/1056789518792649
Wu, J., Jing, H., Gao, Y., Meng, Q., Yin, Q., and Du, Y. (2022). Effects of carbon nanotube dosage and aggregate size distribution on mechanical property and microstructure of cemented rockfill. Cem. Concr. Comp. 127 (0), 104408. doi:10.1016/j.cemconcomp.2022.104408
Wu, J., Jing, H., Yin, Q., Yu, L., Meng, B., and Li, S. (2020). Strength prediction model considering material, ultrasonic and stress of cemented waste rock backfill for recycling gangue. J. Clean. Prod. 276 (0), 123189. (Article). doi:10.1016/j.jclepro.2020.123189
Wu, J., Wong, H. S., Yin, Q., and Ma, D. (2023a). Effects of aggregate strength and mass fraction on mesoscopic fracture characteristics of cemented rockfill from gangue as recycled aggregate. Compos. Struct. 311, 116851. doi:10.1016/j.compstruct.2023.116851
Wu, J., Wong, H. S., Zhang, H., Yin, Q., Jing, H., and Ma, D. (2024). Improvement of cemented rockfill by premixing low-alkalinity activator and fly ash for recycling gangue and partially replacing cement. Cem. Concr. Comp. 145 (0), 105345. doi:10.1016/j.cemconcomp.2023.105345
Wu, J., Yang, S., Williamson, M., Wong, H. S., Bhudia, T., Pu, H., et al. (2025). Microscopic mechanism of cellulose nanofibers modified cemented gangue backfill materials. Adv. Compos. Hybrid Ma. 8, 177. doi:10.1007/s42114-025-01270-9
Wu, Q., Liu, Y., Liu, D., and Zhou, W. (2011). Prediction of floor water inrush: the application of GIS-based AHP vulnerable index method to Donghuantuo coal mine, China. Rock Mech. Rock. Eng. 44 (5), 591–600. doi:10.1007/s00603-011-0146-5
Wu, R., Selvadurai, P. A., Li, Y., Sun, Y., Leith, K., and Loew, S. (2023b). Laboratory acousto-mechanical study into moisture-induced changes of elastic properties in intact granite. Int. J. Rock Mech. Min. 170, 105511. doi:10.1016/j.ijrmms.2023.105511
Yan, B., Guo, Q., Ren, F., and Cai, M. (2020). Modified Nishihara model and experimental verification of deep rock mass under the water-rock interaction. Int. J. Rock Mech. Min. 128 (0), 104250. doi:10.1016/j.ijrmms.2020.104250
Yu, B., Zhanqing, C., Qile, D., and Luzhen, W. (2016). Non-Darcy flow seepage characteristics of saturated broken rocks under compression with lateral constraint. Int. J. Min. Sci. Techno. 26 (6), 1145–1151. doi:10.1016/j.ijmst.2016.09.025
Yu, R., Liu, L., Zha, H., and Li, N. (2022). Microseismic precursors of coal mine water inrush characterized by different waveforms manifest as dry to wet fracturing. Int. J. Env. Res. Pub. He. 19 (21), 14291. doi:10.3390/ijerph192114291
Zhang, T.-j., Pang, M.-k., Ji, X., and Pan, H.-y. (2021). Dynamic response of a non-darcian seepage system in the broken coal of a Karst collapse pillar. Mine Water Environ. 40 (3), 713–721. doi:10.1007/s10230-021-00760-8
Zhou, C., Yu, L., You, F., Liu, Z., Liang, Y., and Zhang, L. (2020). Coupled seepage and stress model and experiment verification for creep behavior of soft rock. Int. J. Geomech. 20 (9), 0. doi:10.1061/(asce)gm.1943-5622.0001774
Zhou, Q., Herrera, J., and Hidalgo, A. (2018). The numerical analysis of fault-induced mine water inrush using the extended finite element method and fracture mechanics. Mine Water Environ. 37 (1), 185–195. doi:10.1007/s10230-017-0461-5
Keywords: fault rocks, seepage-creep coupling, creep compression, expansion damage, water inrush
Citation: Gong X, Liu Y, Li Q, Ma Y, Zhai M, Ma D, Li Z, Hou J, Qiao R, Li J, Yang H and Fan L (2025) Experimental and numerical study on seepage-creep coupling characteristics of fault rocks. Front. Earth Sci. 13:1566556. doi: 10.3389/feart.2025.1566556
Received: 25 January 2025; Accepted: 18 February 2025;
Published: 11 March 2025.
Edited by:
Manoj Khandelwal, Federation University Australia, AustraliaReviewed by:
Gaobo Zhao, West Virginia University, United StatesCopyright © 2025 Gong, Liu, Li, Ma, Zhai, Ma, Li, Hou, Qiao, Li, Yang and Fan. This is an open-access article distributed under the terms of the Creative Commons Attribution License (CC BY). The use, distribution or reproduction in other forums is permitted, provided the original author(s) and the copyright owner(s) are credited and that the original publication in this journal is cited, in accordance with accepted academic practice. No use, distribution or reproduction is permitted which does not comply with these terms.
*Correspondence: Minglei Zhai, bWluZ2x6Y3VtdEAxMjYuY29t; Dan Ma, ZGFuLm1hQGN1bXQuZWR1LmNu; Zhenhua Li, bGl6aEBocHUuZWR1LmNu
Disclaimer: All claims expressed in this article are solely those of the authors and do not necessarily represent those of their affiliated organizations, or those of the publisher, the editors and the reviewers. Any product that may be evaluated in this article or claim that may be made by its manufacturer is not guaranteed or endorsed by the publisher.
Research integrity at Frontiers
Learn more about the work of our research integrity team to safeguard the quality of each article we publish.