
94% of researchers rate our articles as excellent or good
Learn more about the work of our research integrity team to safeguard the quality of each article we publish.
Find out more
ORIGINAL RESEARCH article
Front. Earth Sci. , 26 March 2025
Sec. Economic Geology
Volume 13 - 2025 | https://doi.org/10.3389/feart.2025.1561760
This article is part of the Research Topic Shale Oil Micro-Migration and Its Effect on Shale Oil Differential Enrichment View all 7 articles
 Liping Zhao1*
 Hongjian Zhu2
Introduction: Fractures are crucial to the development of shale oil and gas because they operate as a seepage pathway. The key to ensuring effective development is the fractures strong connection. Therefore, it is of great significance to carry out experimental research on the development of shale fractures.
Methods: This research thoroughly assesses the quantitative features of shale fractures using a number of criteria by combining the indoor uniaxial compression test with 3D CT reconstruction.
Results and discussion: The findings indicate that the bedding angle has a significant impact on the distribution characteristics of shale fractures and that its quantitative features cannot be well described by a single metric. The volume weight of many fractures can be used to determine the new fracture angle and complexity coefficient, which more accurately reflect the actual fracture distribution given the complexity of fracture growth under 3D reconstruction. The connectivity examination also shows that the axial shear and radial tensile mixed fractures have higher connection than the single shear fracture, suggesting that the radial tensile fracture may lead to a higher overall connectedness. The parameters (fracture rate, fracture complexity coefficient, connectivity) used in this paper have a good correlation with the fractal dimension correlation coefficient R2 > 0.7, which indicates that these parameters are suitable parameters for quantitative characterization of shale fracture distribution characteristics. The influence mechanism of bedding angle on shale fractures is also suggested based on experimental results and earlier research. This mechanism is that the bedding angle will alter the effect of principal stress on interlayer micro-pores, micro-fractures, and cementation of bedding planes, leading to a significant anisotropy of fracture morphology created by macroscopic fracture.
China has enormous development potential and abundant shale oil/gas resources. It is primarily found in the Songliao, Ordos, Sichuan, and Bohai Bay basins. The main development strata of shale oil/gas are Yanchang, Qingshankou, Fengcheng, Lucaogou, Wufeng-Longmaxi, and Qiongzhusi Formation (Hu et al., 2021). However, the development of shale is confronted with numerous challenges because of its significant heterogeneity and poor seepage qualities (Zhao et al., 2019; Zhang et al., 2021; He Q. et al., 2021; Hu et al., 2024a). These difficulties make the reservoir reconstruction process an indispensable and important project for the shale oil/gas development process. Therefore, it is particularly crucial to research the mechanical properties of shale reservoirs and the development law of fracture networks to enhance the impact of reservoir rebuilding and the effectiveness of shale oil/gas utilization (Hu et al., 2025).
At present, the most widely utilized monitoring techniques in the rock field are electron microscope scanning, CT scanning, and acoustic emission (Wang F. et al., 2023; Dai et al., 2024; Xu et al., 2024; Qian et al., 2024; Zhu et al., 2024; Hu et al., 2024b). CT scanning is one of these non-destructive monitoring techniques that is useful for tracking the formation of rock fissures. Therefore, the most widely used research technique in the field of rock failure characteristics is the combination of CT scanning with contemporary image technology. The mechanical characteristics and micro-fracture process of shale have been revealed by numerous domestic and international researchers through the combination of mechanical testing and other monitoring methods. Shale mechanical properties and fracture initiation behavior are correlated with its bedding angle, by findings of Liu et al. (2021) from an indoor uniaxial compression test of shale with varying bedding angles. Numerous investigations have also been conducted on uniaxial compression trials using shale samples that have been cored at various angles (Jie et al., 2021; Zhai et al., 2022; Zhang et al., 2023; Wu et al., 2023). It is discovered that the Longmaxi shale shows significant micro-heterogeneity and macro-mechanical anisotropy under the impact of bedding planes when combined with field emission scanning electron microscopy, atomic force microscopy observation investigations, and wave velocity tests. In addition, many scholars have further studied and observed the morphology and internal structure of fractures through CT scanning technology. Zhang et al. (2022) studied the effects of bedding characteristics and horizontal stress differences on fracture propagation and fracture network morphology by acoustic emission and CT scanning techniques. He et al. (2017) used microscope and X-ray CT scanner to observe the initiation, propagation and closure process of shale fractures in hydraulic fracturing. To create a three-dimensional (3D) model, some researchers used finite element calculations, CT scanning technologies, and indoor mechanical testing on shale (Wu et al., 2024; Wang Y. B. et al., 2023; Hu et al., 2023; He X. et al., 2021). The mechanical characteristics and microscopic failure process of shale, as well as the temporal and spatial evolution of shale micro-fractures, were examined from the viewpoint of various beddings and mineral composition. Through 3D reconstruction and visualization of internal fracture CT scanning image technology, Wang F. et al. (2023) and He Q. et al. (2021) analyzed the fracture distribution characteristics under different conditions, and provided an effective method for quantitative characterization of shale fractures. The above research has carried out a lot of research on the mechanical characteristics and micro-failure mechanism of shale and achieved many results. Nonetheless, the aforementioned research virtually remains in the visualization research by utilizing CT scanning and 3D reconstruction technologies. The quantitative characterization of fractures is currently lacking, and few research have looked closely at the pertinent quantitative features of macro-fractures. Therefore, the author will further investigate the quantitative characterization of shale macro fractures, which is conducive to providing reference value for the transformation process of shale oil/gas reservoirs.
The research selects outcrop rock samples from the Silurian Longmaxi Formation to perform uniaxial compression tests of shale with varying bedding angles (β = 0°, 45°, 60°, and 90°) to more thoroughly examine the complexity, morphology, and distribution characteristics of fractures from a macro perspective. The internal fractures of the samples are observed and the necessary quantitative data is produced when combined with CT scanning and 3D reconstruction technologies. Multiple quantitative parameters (3D fractal dimension, fracture rate, redefined complexity coefficient and connectivity) are used to comprehensively characterize the fracture-related characteristics and propose the influence mechanism of different bedding angles on shale fracture morphology (axial shear fracture and radial tensile fracture).
The shale is created in the outcrop shale of the Silurian Longmaxi Formation, and the samples come from various bedding angles (β). The bedding angle β is taken to be 0°, 45°, 60°, and 90°, and the sample is a conventional Φ50 × 100 mm cylindrical sample. Three shale samples are taken at each bedding angle. Consequently, a total of twelve samples are gathered. The sample core diagram is displayed in Figure 1A.
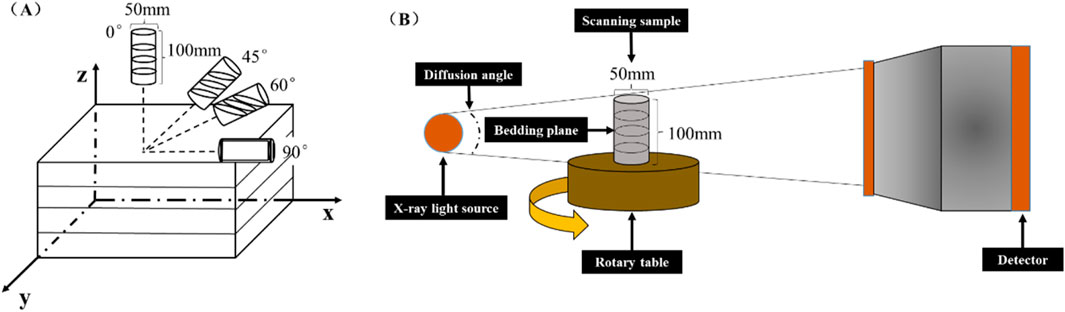
Figure 1. Sample and mechanical instrument. (A): Shale sample coring schematic diagram; (B): The diagram of CT scanning instrument.
This uniaxial compression test is carried out on the test machine TAW-2000 developed by Changchun Chaoyang Test Instrument Co., Ltd., using constant speed displacement control, loading rate is 0.3 mm/s. The maximum load of the instrument reaches 2000KN, and the deformation range of the sample can be measured: the axial deformation is 0–10 mm, and the radial deformation is 0 ∼ 5 mm. The test accuracy can reach ±1%, which can well meet the requirements of this mechanical test. The CT scanning experiment was completed by GE Phoenix V | tome |X S240CT testing equipment developed by Youer Hongxin South China Testing Company. Its resolution can reach 1um and can withstand a maximum sample weight of 10kg, as shown in Figure 1B.
Shale samples with comparatively full preservation following mechanical testing were chosen to increase the accuracy of 3D reconstruction. The rubber ring serves as reinforcement, and the falling fragments are secured with a tiny bit of adhesive to guarantee that the shale samples may successfully complete the CT scanning experiment following the experiment. A preliminary screening of the integrity of the shale after the reinforcement treatment after all the mechanical experiments was observed by the human eye. The samples after preliminary screening were weighed to compare the weight difference before and after the mechanical test, and the samples with a difference range of less than 10% were selected. Millimeter-level CT scanning studies were conducted on a single shale sample chosen for each of the following bedding angles: 0°, 45°, 60°, and 90°. The CT scan yielded 400 slices of data for each sample. Using various software modules, Avizo can reconstruct these slices in three dimensions, allowing for the display of shale fractures in three dimensions and the acquisition of data required for quantitative parameter calculation.
The 3D reconstruction uses Avizo software, and uses its “Interactive Threshoiding” module to perform threshold segmentation on the main fractures, and then enhances the fracture structure display through the “Compute Ambient Occlusion” module. The tiny fractures are accurately extracted and identified to further ensure the continuity of the fractures and reduce the error. In addition, the accuracy of the 3D reconstructed fracture model is observed by the “Volume Rendering” module, and whether some of the small independent parts are noise points is analyzed. “Removing small spots” sets the range value (200–500) of noise point removal. A portion of the model body will be eliminated if the range is too large, and a lot of interference noise points will show up in the model if the range is too tiny. An excessive amount of noise in the model will make it rougher and cause a significant inaccuracy in the fractal dimension estimate. To guarantee the accuracy of the three-dimensional reconstruction model, it must be regularly monitored and modified. The whole process is shown in Figure 2.

Figure 2. 3D reconstruction process diagram. (i) represents the gray part is shale matrix (ii) represents that the blue part is shale fracture (iii) represents the complete shale model.
The concept of fractal was first proposed by Mandelbrot (1984). It is fractal geometry, which mainly studies the quantitative description of extremely irregular and seemingly disordered complex structures in nature. The most important measure of fractal geometry is fractal dimension. At present, there are many calculation methods of fractal dimension, and the box-counting dimension method based on capacity dimension is widely used in the calculation of fractal dimension in various fields because of its intuitive and convenient calculation. Therefore, this paper also uses box-counting dimension to calculate the fractal dimension of fractures. The box-counting method was previously used by researchers to determine the fractal dimensions of rock fractures (Wilson, 2001; Li et al., 2018; Walsh and Watterson, 1993). These researches are essentially derived from computations on two-dimensional planes. The research uses the operation module of Avizo software and the counting concept of the box dimension technique to calculate the 3D fractal dimension of the shale fracture model based on the 3D reconstruction of the model. The physical definition of fractal dimension states that 3D fractal dimension is more accurate in representing the intricacy of shale fractures in three dimensions, which is more consistent with reality. The box-counting dimension calculation formula is as follows:
Where, D is the 3D fractal dimension; F is the cube covering the fracture; δk is the characteristic size of the cube; Nδk is the number of cubes covering the whole fracture.
The 3D box counting process assumes that a cube box with a side length of δk covers the entire fracture image, calculates the number of cube boxes required to cover the entire fracture, and changes the side length of the cube box several times to obtain a series of δk and corresponding Nδk data. In the double logarithmic coordinates, the slope of Nδk and δk is the fractal dimension (Sui et al., 2016) (Figure 3).
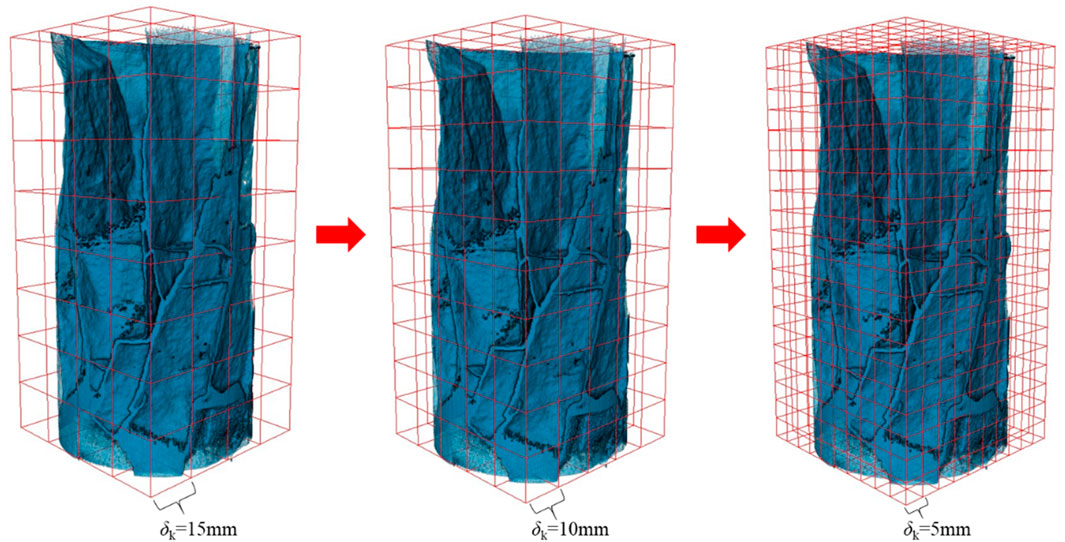
Figure 3. 3D box-counting dimension process diagram.
The fracture networks formed inside shale with varying bedding angles under axial load are significantly diverse (Figure 4). When β = 0°, the sample forms more than two primary shear fractures that run through it, and numerous radial fractures surround the shear fractures. The distribution is more complicated when looking at the entire fracture network. When β = 45°, it is evident that the sample has nearly no radial fractures formed along the bedding plane and numerous major shear fractures along the bedding plane direction. The distribution of fractures in the sample is simple when β = 60°; essentially no secondary fractures exist, and only one shear fracture has formed along the bedding plane direction. Numerous shear main fractures form in the direction of the bedding plane in the sample when β = 90°. The major fissures are surrounded by a few smaller ones as well. The fracture distribution almost occupies the whole sample, and the distribution state is complex. The 3D fractal dimensions calculated by Avizo (Formula 1) are: 2.279, 2.235, 2.133, and 2.198. According to the physical meaning of fractal dimension, the greater the fractal dimension, the higher the degree of self-similarity of the fracture, the more complex the fracture distribution, the greater the energy required for fracture, and the higher the strength of the sample. The fractal dimension of shale samples with β = 60° is therefore the smallest, and the fracture morphology is comparatively simple, as can be seen from the fluctuation of the 3D fractal size with the bedding angle (Figure 5A). The bedding plane will preferentially experience a large-angle shear slip to generate a macroscopic failure, which lowers the strength of the entire sample, when the axial load and the bedding plane form a large angle, as demonstrated by earlier research (Zhai et al., 2022; Zhu et al., 2025). The bedding plane is perpendicular to the axial force when β = 0°, and the strength of the entire sample is not significantly impacted by the bedding plane weakening. The sample is therefore stronger at this bedding angle, which also means that a larger load is required to cause it to rupture. This leads to rise to the most severe rupture and the formation of a complex fracture network.
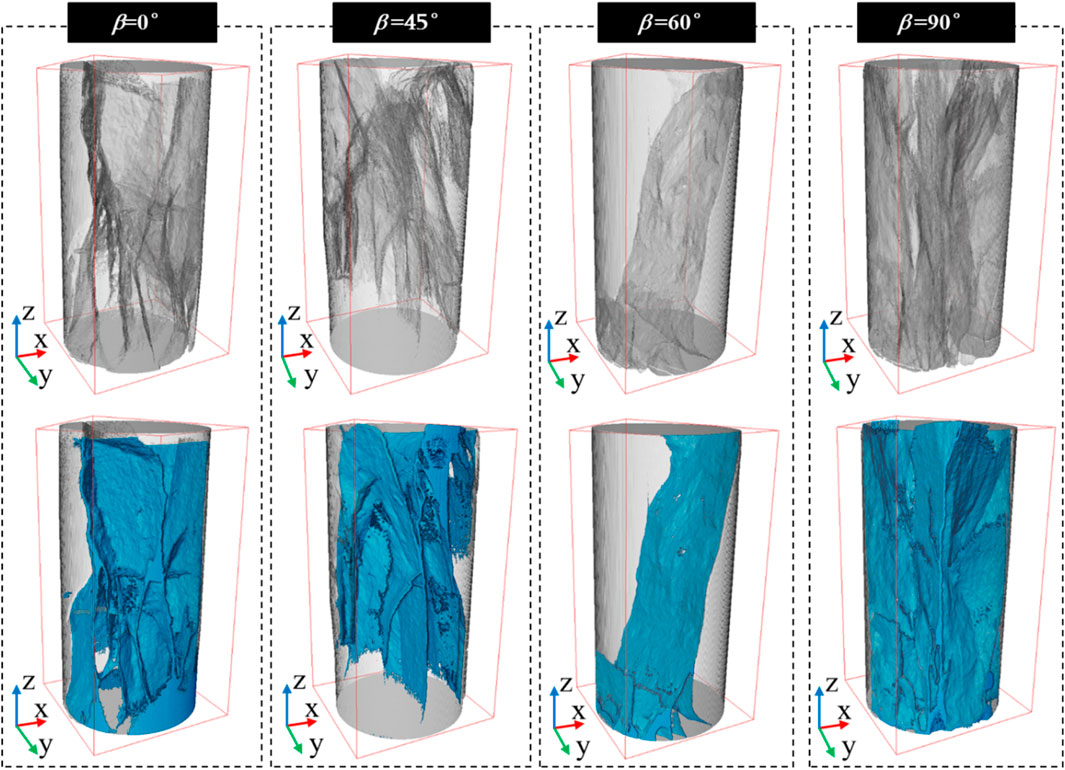
Figure 4. 3D reconstruction of shale fractures with different bedding angles under uniaxial compression. The gray part is shale matrix, and the blue part is shale fracture.
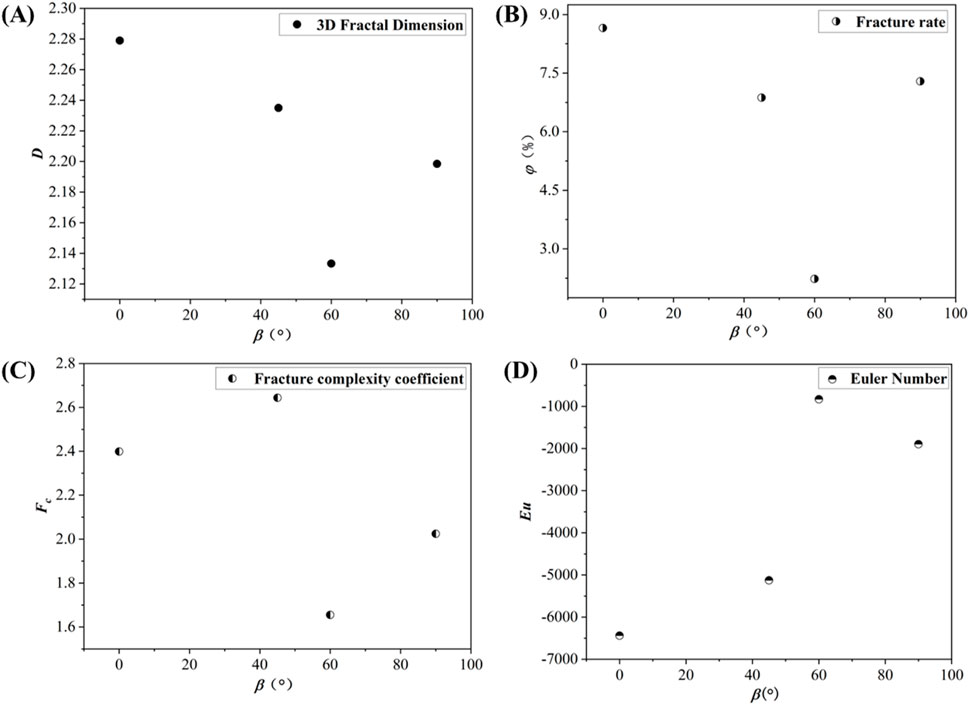
Figure 5. The relationship between parameters and β. (A): Fractal dimension and β relationship (B): Fracture rate and β relationship (C): Fracture complexity coefficient and β relationship (D): Euler number and β relationship.
The present research may determine the volume of the fracture model and the overall volume of the sample using “Labor Analysis” module of Avizo to more precisely describe the distribution features of shale fractures under axial load. Thus, we may acquire fresh quantitative data on fracture rate (Table 1) based on the definition of fracture rate, which is the ratio of fracture volume to total volume of the sample (Wang et al., 2021). The fracture rate calculation formula is as follows:
Where, Vf is the fracture volume, mm3; Vs is the total volume of the sample, mm3.

Table 1. Fracture rate calculation results.
Shale samples with varying bedding angles show significantly variable fracture volume changes in Table 1. The sample has the biggest internal fracture volume when β = 0°. In comparison to β = 0°, which results in a reduction of 20.782%, the fracture volume is reduced by 3527.362 mm3 when β = 45°. The fracture volume drops to a minimum of 4308.980 mm3 at β = 60°.It is reduced by 9136.818 mm3 and 67.953% as compared to β = 45°. However, the fracture volume increased by 228.698%, or 9854.570 mm3, at β = 90°. The fracture volume reduction rate is highest at β = 60°, and the fracture space volume, which represents the entire sample volume, is lowest when the bedding plane and the axial load form a large angle (60° > β > 45°). This indicates that the bedding angle has the strongest effect on the formation of the fracture network in this range. The fracture volume also increases significantly when β rises from 60° to 90°, suggesting that the detrimental influence of bedding angle on shale fracture volume lessens.
Concurrently, the fracture rate calculated according to Formula 2 also shows the same rule (Figure 5B). The sample fracture rate reaches its maximum value of 8.655% when β = 0°. Large shear fractures that are nearly perpendicular to the bedding plane are visible inside the sample at the bedding angle, along with radial tensile fractures that have developed along the bedding plane. This is in addition to the difference between the fracture 3D reconstruction model at this bedding angle and the fracture 3D reconstruction model at other angles. The fracture rate is 6.871% for β = 45°. The shale fracture rate at this angle is 1.784% lower than for β = 0°, suggesting that the shale is less damaged. However, the fracture rate reaches the lowest value of 2.231% at β = 60°. This demonstrates that the weakening effect of the bedding plane has the greatest influence on the overall strength of the sample when the axial load and the bedding plane form a large angle, which reduces the overall damage degree of the sample and produces the smallest fracture space. When β = 90°, the fracture rate increased by 5.060% compared with β = 60°, reaching 7.291%. The change rule of fracture rate is almost consistent with the change rule of fractal dimension. Both show that when β and principal stress form a certain angle (0° > β > 90°), the overall strength of shale will be weakened, resulting in more severe damage to form a more complex fracture network. The results of earlier research also support these findings. Zhang et al. (2022) used acoustic emission technology and the calculation and fracture classification method based on JCMS-III b5706 to calculate the acoustic emission parameters of fractured samples, and obtained RA and AF values to monitor the fracture initiation and damage process inside the shale. This was proved by them. They obtained that the proportion of shear fractures was much higher than other angles when β = 60°. Zhai et al. (2022) also used acoustic emission technology to explore the influence of the total number of AE events and the proportion of shear sources (one of the types of acoustic emission sources, the proportion of shear sources can be regarded as an index that can reflect the influence of layer orientation on the fracturing mechanism) on the development of fractures. The results show that as the bedding angle increases, the proportion of shear sources and the total AE number show the same ‘V-shaped’ distribution trend. The difference in the proportion of shear sources indicates that when 30° > β > 90°, the existence of bedding planes promotes the development of shear fractures.
The intricacy of fractures cannot be adequately described by the fractal dimension alone, according to numerous earlier research (Zhang et al., 2022; He Q. et al., 2021; Tian et al., 2024). Therefore, it is necessary to combine fractal features and more quantitative data. Among them, the fracture complexity coefficient is a more intuitive and accurate description of the fracture complexity among many parameters. Its calculation formula is as follows:
Where, Fc is the coefficient of rock fracture complexity; D is the fractal dimension; α is the fracture angle of rock.
According to Formula 3, the fracture angle of rock is an important parameter to determine the complexity coefficient of fracture. According to previous studies (Zhen and Li, 2021), most of them use a major fracture as the basis for measuring the rupture angle. However, according to the model after 3D reconstruction of fractures, there is more than one main fracture in the sample, usually multiple main fractures intersect and the fracture angle varies greatly. Thus, to more accurately calculate the fracture angle value based on the 3D reconstruction model, we divided each sample fracture into several main fractures using “Extract Subvolume” module of Avizo, calculate the fracture angle for each main fracture, and then determine the volume weight of each main fracture to define a new fracture angle α*, as indicated in Table 2. The primary differentiation is based on the fracture volume size (less than 10% of the fracture has minimal impact on the overall computation and does not significantly divide, according to the maximum shale fracture volume. The fracture is less than 1,000 mm3 and is ignored), the fracture angle difference (the reference fracture is the first main fracture divided, and the quotient of the fracture angle difference between the two main fractures and the fracture angle of the reference main fracture is larger than 10%). Figure 6 displays the division findings. The division findings show that the minimum fracture angle difference between the main cracks is 16.679%, and the minimum volume of the divided main cracks is 1,006.200 mm3. The division results satisfy the requirements. Since there is only one major shear fracture in the sample at β = 60°, no unnecessary division is made. The calculation formula is as follows:
Where, α* is the newly defined fracture angle;
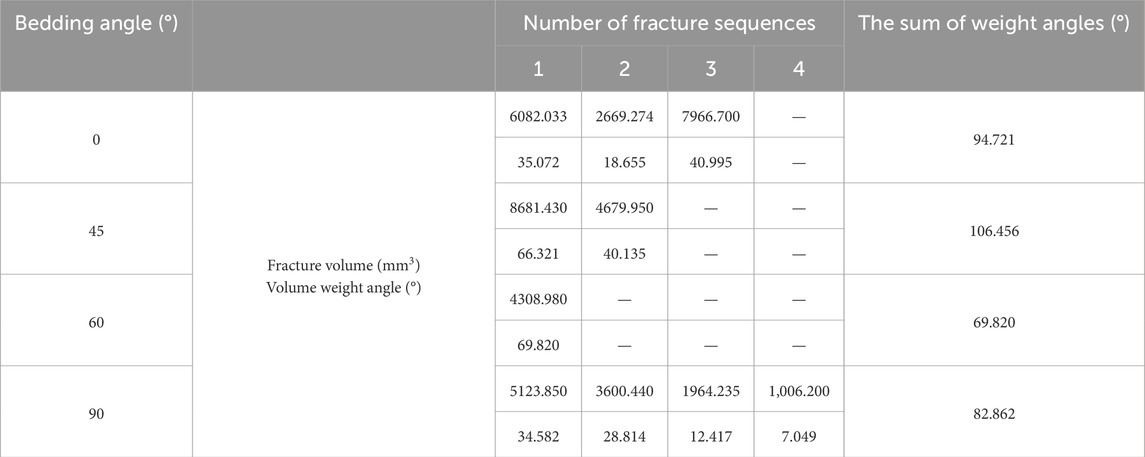
Table 2. Fracture angle of sample.
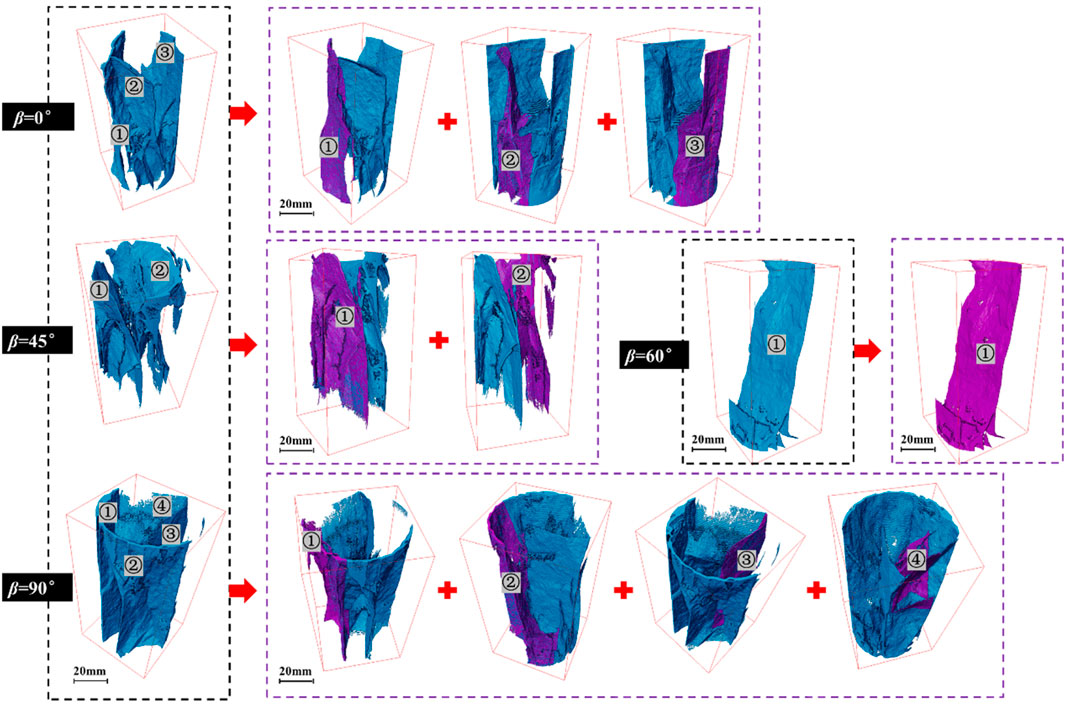
Figure 6. Diagram of fracture division. The blue part of the black box is the complete shale fracture model, and the purple part of the shale fracture model in the purple box is the divided main fracture.
Table 2 demonstrates that the change of fracture angle is almost consistent with the change of fractal dimension. When β = 60°, the fracture angle of the sample is closest to the bedding angle. This indicates that the fracture develops along the bedding plane, which is consistent with the visual observation results of the 3D reconstructed fracture model. The research conducted by Zhai et al. (2022) also shows similar findings. They found that the bedding plane mostly controls sample failure in the cases of β = 60° and 90° by numerical simulation of shale. Additionally, the failure is characterized by preferred shear generation along the bedding plane and the least number of fractures overall when β = 60°.
According to Formulas 3, 4, the complexity coefficient can be calculated, as shown in Figure 5C. The fracture complexity coefficient shows a downward trend with the increase of β. When β is large (90° > β > 60°), the fracture complexity coefficient is significantly lower than that when β is small. From this parameter, we can intuitively see the complex situation of fractures. Although the volume of fractures accounts for the largest proportion when β = 0°, its rupture angle is smaller than that of samples with β = 45°. The relationship between the fracture complexity coefficient and β is not entirely consistent with the change rule of fractal dimension, and when the fractal dimension is used to evaluate it, the fracture fractal dimension of the sample with β = 0° is greater than that of the sample with β = 45°. The fact that the fracture distribution features cannot be accurately described by fractal dimension alone is further demonstrated by this. Furthermore, it is evident from the fracture complexity coefficient calculation principle that fracture angle and fractal dimension have a major influence on the coefficient’s value. Shale has fractal dimensions of 2.279, 2.235, 2.133, and 2.198 at various bedding angles. The difference between fractal dimensions is basically within 0.1. Therefore, the key factor to determine the fracture complexity coefficient is the fracture angle. According to the physical meaning of fractal dimension, its main representation is the effectiveness of complex objects occupying space, and it cannot effectively characterize the fracture angle caused by shale fracture. The occurrence of fracture angle depends largely on the strength of shale, and the existence of bedding plane makes the strength of shale in this area low, and fracture will occur preferentially under external load. This also shows that the fracture network generated by shale under external load is complex, and its regularity still has the value of further research.
The fracture network of shale is important for its development of oil and gas, which can provide an effective flow channel for shale oil and gas flow (Li et al., 2024). Therefore, the connectivity of shale fractures largely determines the efficiency of its development. The Euler number is used to quantitatively describe the fracture connectivity in accordance with the earlier characterization of rock and coal fractures. The 3D complex pore and fracture connectivity in porous materials is indicated by this metric (Wang et al., 2021). Therefore, the Euler number is also used in this paper to describe the fracture connectivity of shale samples. The “Euler 3D” module in Avizo can be used to determine the Euler number of the 3D fracture model. The following are the primary principles of calculation:
Where, β0 is the number of isolated fractures; β1 is the number of connecting fractures; β2 is the number of closed fractures. According to this principle, when the number of connecting fractures is greater than the number of isolated and closed fractures, the Euler number is negative. Therefore, this demonstrates that the size of the fracture connection is determined by the positive and negative Euler numbers. Additionally, when the Euler number is positive, the more the absolute value of the positive number, the worse the connectivity; conversely, the higher the absolute value of the negative number, the better the fracture connection.
The Euler number calculated according to Formula 5 shows that when β = 0°, the Euler number is the smallest (Figure 5D). This indicates that the fracture network has the highest connectivity, and the more connected the network, the more favorable it is for the development of shale oil and gas. The Euler number rises dramatically at β = 60° and is significantly greater than that of samples with β = 0° and β = 45°, suggesting that its connectedness is significantly lower than those of the first two. When β = 60°, the fracture inside the sample is single, according to the research of the 3D rebuilt fracture model. The major shear fracture passes across the entire sample, but the connectivity is quite weak, making it difficult for gas and oil to flow freely. For the production of shale oil and gas. In addition, the difference between the sample fractures at this bedding angle and the first two is that there are almost no radial tensile fractures. It can be reasonably speculated that radial fractures and connectivity are inextricably linked, and the first two with radial fractures have better connectivity. Therefore, it is speculated that radial fractures will increase the connectivity of fractures.
We ossify the 3D model of fractures using the Avizo software’s “Auto Skeleton” module to confirm the connection between radial fractures and connections. As seen in Figure 7, we may derive a few positive correlations that help to explain connectedness and radial fractures. The trace line density in the figure can reflect the connectivity of the region. The more connected the area is, the higher the trace line density is. Furthermore, the trace thickness is determined by its color depth; the deeper the color, the thicker the trace. The interior fractures of the sample are typically accompanied by radial fractures when β is small (0° > β > 45°). These radial fissures have a reddish tint and a trace density that is noticeably higher than in other places. The interior fractures of the sample with β = 60° only have massive shear fractures, and the trace line density of the entire fracture is significantly lower than that of the other three angles. Additionally, the trace line and the center of the fracture nearly vanished, while the entire hue turned dark blue. This indicates that the connectivity of the large shear fractures formed by the sample is poor, while the connectivity of the fractures with radial fractures is significantly higher than that of the sample. The borders of the fracture are reddish in hue and have a comparatively high trace density. The reason for this is that the loading technique involves applying an axial load upward from the instrument base, which will result in more severe fracture at both ends of the sample and introduce some flaws into the quantitative characterization of the fracture. Therefore, when examining the fracture, the mistake at both ends should be somewhat disregarded.
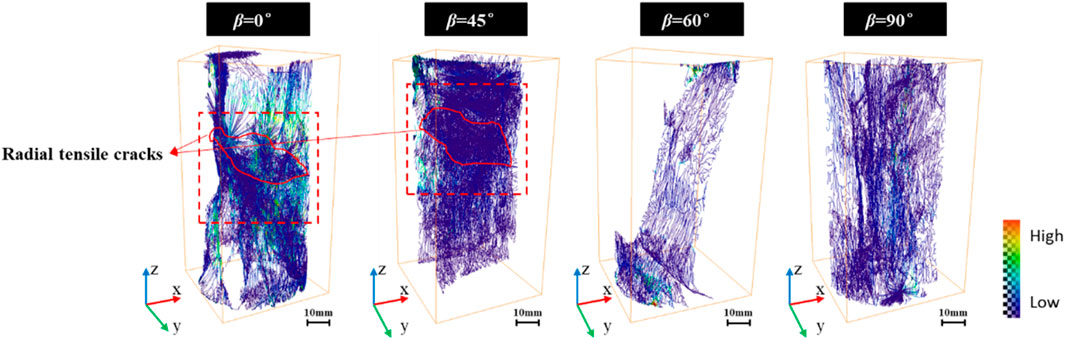
Figure 7. Fracture 3D model ossification.
Quantitative assessment of fractures in shale numerous studies have included multiple parameters for analysis in earlier research (Xu et al., 2024; Wang F. et al., 2023; He X. et al., 2021). However, the application of the parameters should also be taken into account. The majority of studies in the field of quantitative characterization of rock fractures acknowledge the universal characteristic known as fractal dimension (Vogel and Roth, 2001; Wang Y. B. et al., 2023; He Q. et al., 2021; Fu et al., 2020; Gao et al., 2024). Therefore, the other three characterization parameters are linearly fitted with fractal dimension in this research. Their correlation with fractal dimension is also analyzed, and their usefulness to shale fracture characterization is discussed.
The relationship between fracture rate, complexity coefficient and fractal dimension show a linear positive correlation, while Euler number and fractal dimension show a linear negative correlation (Figure 8). The three parameters have a good correlation with the fractal dimension, and their accuracy and applicability for the quantitative characterization of shale fractures are both good, as evidenced by the fact that their correlation ratio is greater than 0.7. Among them, the correlation between fracture complexity coefficient and fractal dimension is the lowest. Combined with the relationship between fracture complexity coefficient and bedding angle, it can be observed that the fracture complexity coefficient has a higher value when β = 45°. The fracture angle is greater than that of other samples, and the main reason for this phenomenon is that the complex situation of shear and tensile failure in the form of failure is mixed, and the fracture angle is quite different. Therefore, from the perspective of fracture angle, its complexity is the highest, which leads to the increase of the complexity coefficient of the whole fracture. It demonstrates unequivocally that a single measure cannot be used to evaluate shale fractures. Multiple perspectives should be used to evaluate the distribution and complexity of fractures, as their properties cannot be adequately described by a single parameter. Furthermore, the three fitting results show that when β = 60°, the fracture rate and complexity coefficient of the fracture show the minimum value, and the connectivity is the worst. The similarity between the three also shows that the three parameters are consistent with the accuracy of the expression of shale failure characteristics and have good applicability and accuracy.

Figure 8. Correlation between parameters and fractal dimension. (A): The fitting relationship between fracture rate and fractal dimension; (B): The fitting relationship between fracture complexity coefficient and fractal dimension; (C): The fitting relationship between Euler number and fractal dimension.
Furthermore, the analysis compares all the characteristics with the 3D model (Table 3), making it evident how the key values change as the bedding angle increases. As the bedding angle increases, Table 3 shows that the fractal dimension, fracture rate, and complexity coefficient nearly all exhibit a “V”-shaped change, with the change trend being constant and high at both ends and low in the middle. The Euler number, which describes the fracture connectivity, exhibits a “Λ” type change with low ends and a high middle because of its positive and negative characteristics. According to the previous analysis, the change of Euler number with bedding angle is consistent with the meaning of other parameters. It is evident that the shale bedding angle exhibits good uniformity and has a substantial impact on the cracks that the shale produces when subjected to external loads. This provides a more comprehensive reference for the influence of different bedding angles of shale on various parameters of shale fractures under external load.
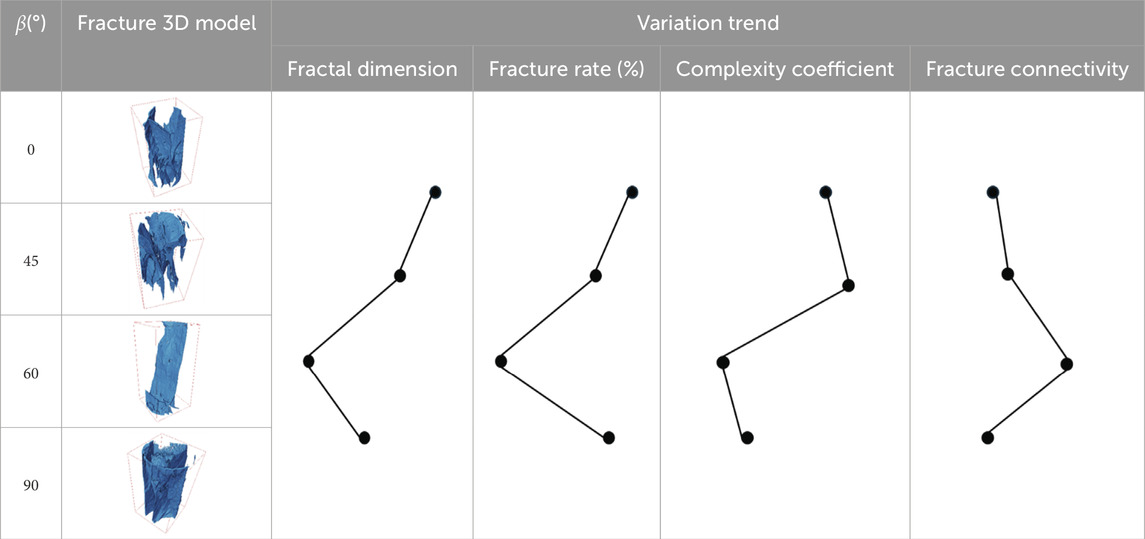
Table 3. The variation trend of various parameters of shale with different bedding angles.
The influence theory of a corresponding reasonable bedding angle on the fracture of shale samples under uniaxial compression can be proposed based on the fracture model that was reconstructed using CT, the results of fracture characterization by multiple parameters, and some findings from earlier studies (Chen et al., 2024; Sarout et al., 2007; Zhu et al., 2021; Wang et al., 2024). Chen et al. (2024) and Sarout et al. (2007) found that many micro-pores and micro-fractures were developed in shale matrix by means of scanning electron microscopy and other detection methods, and micro-pores and micro-fractures were especially developed in directional bedding. The distribution of micro-pores and micro-cracks in the bedding plane is complex and changeable. Usually, micro-cracks are mixed with micro-pores, resulting in large differences in the mechanical properties of the bedding plane and weak strength (Figure 9). Therefore, the interlayer weakening effect between the bedding planes will have a strong anisotropic effect on the properties of shale samples.
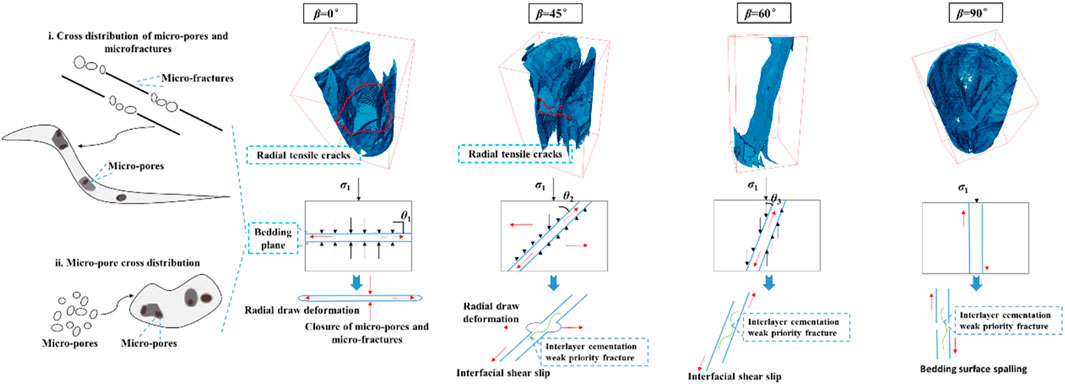
Figure 9. The influence of bedding plane on fracture morphology is shown in the figure. The blue parallel line represents the bedding plane; the black arrow represents the principal stress; the red arrow represents the deformation direction; the green line represents the cementation failure.
The interlayer effect is eliminated when β = 0° (Figure 9), since the angle (θ1) between the bedding plane and the principal stress is 90°. The principal stress will also cause some micro-pores and micro-fractures between the bedding planes to close. The bedding plane will enlarge radially as the primary stress increases, eventually breaking and resulting in radial tensile failure. Meanwhile, a significant number of tensile fractures will form along the major stress path. The primary stress and the bedding plane form a wide angle when β = 45° and θ2 = 45°. The bedding plane is affected by the principal stress in two ways: first, shear slip will happen as a result of the bedding plane’s poor cementation and the ongoing formation of some micro-fractures and micro-pores; However, the bedding plane will also experience some degree of radial tensile failure, leading to some smaller radial tensile fractures, because of the sizable radial tensile effect caused by the comparatively large primary stress angle. Nevertheless, the weak cementation of the bedding plane, interlayer micro-pores, and micro-fractures have the biggest impact when β exceeds 60°, θ3 = 30°. This results in shear slip, which creates macroscopic damage and lessens the likelihood of fractures in the sample’s remaining sections by causing the parallel plane of the bedding plane to conform to the direction of the bedding angle, which is approximately consistent with the direction of the major stress. When β = 90°, the direction of the principal stress is parallel to the direction of the bedding plane, and the principal stress directly acts on the cementation of the bedding plane. The micro-pores and micro-fractures in this area are rapidly developed and connected, resulting in the fracture of the cementation. Therefore, it can be observed that the fractures of the samples at this bedding angle are almost developed along the bedding plane and the direction of principal stress.
The present study used uniaxial compression experiments and CT scanning in conjunction with 3D reconstruction technologies to examine the distribution characteristics of shale fractures. When combined with other factors, including fractal dimension, fractures are quantitatively characterized and analyzed, and the following findings are obtained:
(1) The development of shale fractures has strong anisotropy with the change of bedding angle, and a single parameter cannot accurately characterize its distribution characteristics. The fracture development under 3D reconstruction is complex, and the new fracture angle and complexity coefficient calculated by using the volume weight of multiple fractures can more truly reflect the actual fracture distribution. Furthermore, the morphology of shale fractures is a mixed fracture of axial shear and radial tensile when the bedding angle is modest. In other words, radial tensile fractures may improve the total connectedness of mixed fractures, which is significantly more than that of single shear fractures.
(2) Fracture rate, complexity coefficient, Euler number and fractal dimension are strongly correlated. The above parameters are suitable parameters for quantitative characterization of shale fracture distribution characteristics, which provide more reference indicators for quantitative characterization of shale fractures.
(3) The bedding angle makes the angle between the bedding plane and the principal stress change, which leads to the change of the effect of the principal stress on the interlayer micro-pores, micro-fractures and cementation of the bedding plane, resulting in a large anisotropy of the fracture morphology formed by the macroscopic fracture.
The raw data supporting the conclusions of this article will be made available by the authors, without undue reservation.
LZ: Formal Analysis, Investigation, Methodology, Writing – original draft, Writing – review and editing. HZ: Formal Analysis, Funding acquisition, Investigation, Methodology, Writing – original draft, Writing – review and editing.
The author(s) declare that no financial support was received for the research, authorship, and/or publication of this article. This research was financially supported by National Natural Science Foundation of China (grant numbers: 42102186), Hebei Natural Science Foundation (grant number: D2023203008), and Science Research Project of Hebei Education Department (BJK2022018).
Author LZ was employed by Shanxi CBM Exploration and Development Branch of PetroChina Huabei Oilfield Company.
The remaining author declares that the research was conducted in the absence of any commercial or financial relationships that could be construed as a potential conflict of interest.
The author(s) declare that no Gen AI was used in the creation of this manuscript.
All claims expressed in this article are solely those of the authors and do not necessarily represent those of their affiliated organizations, or those of the publisher, the editors and the reviewers. Any product that may be evaluated in this article, or claim that may be made by its manufacturer, is not guaranteed or endorsed by the publisher.
Chen, M. L., Guo, H. G., Dong, Z., Meng, Z. J., and Wu, Y. C. (2024). Damage process and failure mode of stratified shale under uniaxial load. J. Chongqing Univ. 47 (08), 152–166. doi:10.11835/j.issn.1000-582X.2024.263
Dai, H. Y., Liu, J. F., Lin, H., and Ma, C. (2024). Mechanical properties and acoustic emission evolution of layered shale under triaxial compression. Sci. Technol. Eng. 24 (24), 10419–10428. doi:10.12404/j.issn.1671-1815.2310184
Fu, Y., Chen, X., and Feng, Z. L. (2020). Characteristics of coal-rock fractures based on CT scanning and its influence on failure modes. J. China Coal Soc. 45 (02), 568–578. doi:10.13225/j.cnki.jccs.2019.0480
Gao, M., Yang, M. P., Lu, Y. J., Levin, V. A., He, P., and Zhu, H. (2024). Mechanical characterization of uniaxial compression associated with lamination angles in shale. Adv. Geo-Energy Res. 13 (01), 56–68. doi:10.46690/ager.2024.07.07
He, J. M., Lin, C., Li, X., Zhang, Y. X., and Chen, Y. (2017). Initiation, propagation, closure and morphology of hydraulic fractures in sandstone cores. Fuel 208, 65–70. doi:10.1016/j.fuel.2017.06.080
He, Q., Li, F. X., Shi, A. P., He, B., Chen, J., Xie, L. Z., et al. (2021a). Fractal characterization of complex hydraulic fracture networks of oil shale via 3D CT reconstruction. Petroleum Geol. Recovery Effic. 28 (05), 116–123. doi:10.13673/j.cnki.cn37-1359/te.2021.05.014
He, X., Li, W. G., Dang, L. R., Huang, S., Wang, X. D., Zhang, C. L., et al. (2021b). Key technological challenges and research directions of deep shale gas development. Nat. Gas. Ind. 41 (01), 118–124. doi:10.3787/j.issn.1000-0976.2021.01.010
Hu, J. M., Xiao, Z. S., Ni, H., and Liu, X. F. (2023). Construction of multi-mineral digital rocks for upscaling the numerical simulation of tight rock physical properties. Adv. Geo-Energy Res. 9 (01), 68–70. doi:10.46690/ager.2023.07.07
Hu, T., Jiang, F., Pang, X., Liu, Y., Wu, G., Zhou, G., et al. (2024a). Identification and evaluation of shale oil micro-migration and its petroleum geological significance. Petroleum Explor. Dev. 51 (01), 127–140. doi:10.1016/s1876-3804(24)60010-8
Hu, T., Jiang, Z., Zhang, Q., Pan, Y., Yuan, M., and Li, M. (2025). Shale oil micro-migration characterization: key methods and outlook. Adv. Geo-Energy Res. 15 (01), 5–12. doi:10.46690/ager.2025.01.02
Hu, T., Liu, Y., Jiang, F., Pang, X., Wang, Q., Guo, Z., et al. (2024b). A novel method for quantifying hydrocarbon micromigration in heterogeneous shale and the controlling mechanism. Energy 288, 129712. doi:10.1016/j.energy.2023.129712
Hu, T., Pang, X., Jiang, F., Wang, Q., Liu, X., Wang, Z., et al. (2021). Movable oil content evaluation of lacustrine organic-rich shales: methods and a novel quantitative evaluation model. Earth-Science Rev. 214, 103545. doi:10.1016/j.earscirev.2021.103545
Jie, J. Y., Lu, H. Z., Chen, L., Jin, X. P., Wang, D., Fu, G. Q., et al. (2021). Micro scopic heterogeneity and mechanical anisotropy of the laminated shale in Longmaxi Formation. Bull. Geol. Sci. Technol. 40 (03), 67–77. doi:10.19509/j.cnki.dzkq.2021.0302
Li, J., Zhang, X., Gong, J. Z., Tang, J. T., Ren, Z. Y., Li, G., et al. (2018). Signal-noise identification of magnetotelluric signals using fractal-entropy and clustering algorithm for targeted de-noising. World Sci. 26 (02), 1840011. doi:10.1142/s0218348x1840011x
Li, Y., He, J. H., Deng, H. C., Li, R. X., Li, C., Cao, F., et al. (2024). Analysis of connectivity characterization and mechanical effectiveness of natural fracture in deep shale reservoirs: a case research of the Wufeng- Longmaxi formations in the Dingshan-Dongxi area,southeastern margin of Sichuan Basin. Nat. Gas. Geosci. 35 (02), 230–244. doi:10.11764/j.issn.1672-1926.2023.09.019
Liu, Y., Chen, C. R., Ma, T. S., Zhu, G. S., Peng, N., and Zhang, X. (2021). Experimental investigation on the initiation of hydraulic fractures from a simulated wellbore in laminated shale. Lithosphere 2021 (04), 4152918. doi:10.2113/2021/4152918
Qian, J. A., Jiang, Y. Q., Luo, T. T., Yang, Y. X., Fu, Y. H., Chen, W. M., et al. (2024). Microscopic pore and fracture evolution characteristics and influencing factors during imbibition process of shale reservoirs: a case research of the first section of the first member of Longmaxi Formation, western Chongqing area, Sichuan Basin. Petroleum Geol. and Exp. 46 (06), 1336–1348. doi:10.11781/sysydz2024061336
Sarout, J., Molez, L., Guéguen, Y., and Hoteit, N. (2007). Shale dynamic properties and anisotropy under triaxial loading: experimental and theoretical investigations. Phys. Chem. Earth, Parts A/B/C. 32 (8-14), 896–906. doi:10.1016/j.pce.2006.01.007
Sui, L. L., Ju, Y., Yang, Y. M., Yang, Y., and Li, A. S. (2016). A quantification method for shale fracability based on analytic hierarchy process. Energy 115 (01), 637–645. doi:10.1016/j.energy.2016.09.035
Tian, G., Wang, L. C., Zhen, K., and Tang, W. (2024). Research on acoustic emission of the fractal characteristics of the stratified shale under uniaxial compression. Soil Eng. Found. 38 (03), 562–566. Available online at: http://tgjc.whrsm.ac.cn/CN/Y2024/V38/I3/562
Vogel, H. K., and Roth, K. (2001). Quantitative morphology and network representation of soil pore structure. Adv. Water Resour. 24 (3-4), 233–242. doi:10.1016/s0309-1708(00)00055-5
Walsh, J. J., and Watterson, J. (1993). Fractal analysis of fracture patterns using the standard box-counting technique: valid and invalid methodologies. J. Struct. Geol. 15 (12), 1509–1512. doi:10.1016/0191-8141(93)90010-8
Wang, D. K., Zeng, F. C., Wei, J. P., Zhang, H. T., Wu, Y., and Wei, Q. (2021). Quantitative analysis of fracture dynamic evolution in coal subjected to uniaxial and triaxial compression loads based on industrial CT and fractal theory. J. Petroleum Sci. Eng. 196, 108051. doi:10.1016/j.petrol.2020.108051
Wang, F., Wu, X., Duan, C. W., Han, X., and Zhang, Y. H. (2023a). CT scan-based quantitative characterization and fracability evaluation of fractures in shale reservoirs. Prog. Geophys. 38 (05), 2147–2159. doi:10.6038/pg2023GG0625
Wang, R., Liu, Y., Li, Z., Wang, D., Wang, G., Lai, F., et al. (2024). Microscopic pore structure characteristics and controlling factors of marine shale: a case study of Lower Cambrian shales in the Southeastern Guizhou, Upper Yangtze Platform, South China. Front. Earth Sci. 12, 1368326. doi:10.3389/feart.2024.1368326
Wang, Y. B., Liu, Y., Zou, Z. H., Bao, Q. Z., Zhang, F., and Zong, Z. (2023b). Recent advances in theory and technology of oil and gas geophysics. Adv. Geo-Energy Res. 9 (01), 1–4. doi:10.46690/ager.2023.07.01
Wilson, T. H. (2001). Scale transitions in fracture and active fault networks. Math. Geol. 33, 591–661. doi:10.1023/A:1011096828971
Wu, L., Hou, Z. M., Xie, Y. C., Luo, Z. F., Xiong, Y., Cheng, L., et al. (2023). Fracture initiation and propagation of supercritical carbon dioxide fracturing in calcite-rich shale: a coupled thermal-hydraulic-mechanical-chemical simulation. Int. J. Rock Mech. Min. Sci. 167, 105389. doi:10.1016/j.ijrmms.2023.105389
Wu, Z. H., Meng, X. R., Lan, B. F., Liu, J. S., Gong, L., Yang, Y. H., et al. (2024). Mechanical behavior of calcite vein-bearing shale of the Niutitang Formation in Fenggang area, northern Guizhou based on CT tests. Earth Sci. Front. 31 (05), 117–129. doi:10.13745/j.esf.sf.2024.6.15
Xu, R., Li, X. M., Zhang, Y., Xu, X. B., Wang, Y. R., Sun, L. T., et al. (2024). Research on the overall and weak plane deformation characteristics of shale based on CT scan analysis. J. Green Sci. Technol. 26 (18), 238–244+251. doi:10.16663/j.cnki.lskj.2024.18.021
Zhai, M. Y., Xue, L., Bu, F. H., Yang, B. C., Huang, X. L., Liang, N., et al. (2022). Effects of bedding planes on progressive failure of shales under uniaxial compression: insights from acoustic emission characteristics. Theor. Appl. Fract. Mech. 119, 103343. doi:10.1016/j.tafmec.2022.103343
Zhang, J. C., Tao, J., Li, Z., Wang, X. W., Li, X. Q., Jiang, S. L., et al. (2021). Prospect of deep shale gas resources in China. Nat. Gas. Ind. 41 (01), 15–28. doi:10.3787/j.issn.1000-0976.2021.01.002
Zhang, X., Li, X. S., Liu, Y. H., Liu, W., Li, Q. H., and Li, L. (2022). Experimental study on crack propagation and failure mode of fissured shale under uniaxial compression. Theor. Appl. Fract. Mech. 121, 103512. doi:10.1016/j.tafmec.2022.103512
Zhao, Q., Yang, S., Wang, H. Y., Jiang, X. C., Liu, D. X., Sun, Q. P., et al. (2019). China's shale gas development and its prospects. Environ. Impact Assess. 41 (01), 6–10. doi:10.14068/j.ceia.2019.01.002
Zhen, T. H., and Li, J. G. (2021). Research on mechanical properties and crack evolution law of rocks with different fracture angles. Coal Sci. Technol. 49 (S02), 93–97. Available online at: https://link.cnki.net/urlid/11.2402.td.20220325.1118.009
Zhu, H., Huang, C., Ju, Y., Bu, H., Li, X., Yang, M., et al. (2021). Multi-scale multidimensional characterization of clay-hosted pore networks of shale using FIBSEM, TEM, and X-ray micro-tomography: implications for methane storage and migration. Appl. Clay Sci. 213, 106239. doi:10.1016/j.clay.2021.106239
Zhu, H., Ju, Y., Lu, Y., Yang, M., Feng, H., Qiao, P., et al. (2025). Natural evidence of organic nanostructure transformation of shale during bedding-parallel slip. GSA Bull. doi:10.1130/B37712.1
Keywords: shale, uniaxial compression, CT scanning, fractal theory, fracture
Citation: Zhao L and Zhu H (2025) Experimental study on fractures quantitative characterization of shale during uniaxial compression. Front. Earth Sci. 13:1561760. doi: 10.3389/feart.2025.1561760
Received: 16 January 2025; Accepted: 10 March 2025;
Published: 26 March 2025.
Edited by:
Tao Hu, China University of Petroleum, Beijing, ChinaReviewed by:
Fuhua Shang, Inner Mongolia University of Technology, ChinaCopyright © 2025 Zhao and Zhu. This is an open-access article distributed under the terms of the Creative Commons Attribution License (CC BY). The use, distribution or reproduction in other forums is permitted, provided the original author(s) and the copyright owner(s) are credited and that the original publication in this journal is cited, in accordance with accepted academic practice. No use, distribution or reproduction is permitted which does not comply with these terms.
*Correspondence: Liping Zhao, dzEzOTMzOTI0Nzk1XzJAMTYzLmNvbQ==
Disclaimer: All claims expressed in this article are solely those of the authors and do not necessarily represent those of their affiliated organizations, or those of the publisher, the editors and the reviewers. Any product that may be evaluated in this article or claim that may be made by its manufacturer is not guaranteed or endorsed by the publisher.
Research integrity at Frontiers
Learn more about the work of our research integrity team to safeguard the quality of each article we publish.