 Yaoyao Shangguan1,2
 Hu Zhao1,2*
 Zhengzhong Zhang2*Erwen Xu1Dong Lv1Yanxia Wang1Xingpeng Zhao1Na Wei1Gang Chen1Jianhai Liu1Xingyu Wei2Zhiwen Gao3Mengde Liu4
- 1Academy of Water Resource Conservation Forests of Qilian Mountains in Gansu Province, Zhangye, China
- 2College of Forestry Gansu Agricultural University, Lanzhou, China
- 3Environmental Bridge (Shanghai) Environmental Technology Company Limited, Shanghai, China
- 4Western C Sink Trading Asset Management (Gansu) Company Limited, Zhangye, China
Forest plantations play a critical role in mitigating climate change, with their carbon storage and sequestration capacity significantly influenced by planting patterns. This study focuses on Picea crassifolia plantations in the shallow mountainous region of the Qilian Mountains, aiming to investigate the effects of five planting patterns (pure forests, mixed forests, and uneven-aged forests) on vegetation and soil organic carbon (SOC) dynamics. The research provides a scientific basis for optimizing forest management strategies in arid and semi-arid regions. Fifteen sample plots were established in the Qilian Mountains, Gansu Province, covering five planting patterns: pure forests with 1.5 × 1.5 m (P1.5) and 2 × 2 m (P2) spacing, uneven-aged pure forests (PX), mixed forests of P. crassifolia and Pinus sylvestris var. mongholica (PC), and mixed forests of P. crassifolia, P. sylvestris, and Caragana korshinskii (PPC). Vegetation biomass (tree height, DBH, crown width) and soil samples (0 – 80 cm depth) were collected. Carbon content was determined using the potassium dichromate oxidation method, and carbon stocks were estimated using national biomass models. Statistical analyses (one-way ANOVA) and membership function evaluation were applied to assess carbon sink potential. Results showed that: 1. Planting spacing: The 2 × 2 m pure forest (P2) exhibited higher vegetation-layer carbon storage (10 t·ha−1) compared to the 1.5 × 1.5 m pure forest (P1.5, 5 t·ha−1). 2. Age heterogeneity: The uneven-aged pure forest (PX) showed the highest vegetation-layer carbon storage (6.61 t·ha−1), but its total carbon stock (106.98 t·ha−1) was slightly lower than P2 (111.08 t·ha−1) due to P2’s superior SOC content in deeper soil layers (13.64 g·kg−1 at 60–80 cm). 3. Pure vs. mixed forests: Pure forests (P2) outperformed mixed forests (PC, PPC) in total carbon storage, driven by soil-layer contributions (>95% of total stocks). The 2 × 2 m pure forest (P2) demonstrated optimal carbon sequestration potential in the Qilian Mountains, with soil carbon dominance highlighting the importance of deep-layer SOC accumulation. While uneven-aged forests (PX) showed strong vegetation carbon storage, long-term carbon sinks require integrated soil management. These findings provide critical insights for arid-region plantation configurations. Future studies should combine remote sensing for dynamic carbon monitoring and explore diversified mixed-species systems to enhance ecosystem stability.
1 Introduction
Forest plantations play a critical role in mitigating climate change by sequestering carbon dioxide (CO2) and adjusting the balance of surface water and heat (Brovkin et al., 2009; Zhang J. et al., 2021). In recent years, as global warming intensifies, countries worldwide have taken measures to reduce carbon dioxide (CO2) emissions and offset emissions by increasing carbon sinks. The Chinese government has also announced a plan to achieve carbon (C) peaking by 2030 and C neutrality by 2060 (Cheng et al., 2024). Forest carbon sinks not only absorb CO2 from the atmosphere through photosynthesis but also store carbon over the long term through the accumulation of soil organic carbon (SOC) (Pan et al., 2011). Furthermore, planted forests are recognized as one of the most ecologically efficient, cost-effective, feasible, and impactful measures to enhance carbon sinks (Liu et al., 2023). Consequently, optimizing forest management strategies, especially by improving carbon sequestration capacity through appropriate planting patterns, has become a hot topic in current research.
Globally, the relationship between plantations and soil carbon has been extensively studied. Research shows that the carbon storage and sequestration capacity of plantations are significantly influenced by tree species composition, stand structure, and planting patterns (Waring et al., 2020; Liu et al., 2023). However, many unresolved questions remain regarding the effects of different planting patterns on carbon sequestration, especially under the ecological conditions of arid and semi-arid regions. For example, there is no consensus on the differences in carbon sequestration capacity between pure forest and mixed forests. Pure forest, defined as plantations consisting of a single tree species, and mixed plantations, which include multiple species, are the two main types of afforestation or reforestation (Yu et al., 2023). Most planted forests consist of a single species. Keenan et al. (2015) reported that, compared to pure forest, mixed forests are more stable (Liu et al., 2018). The C sequestration capacity of pure and mixed forests is controversial. Alvaro Redondo-Brenes showed that mixed stands of Vochysia guatemalensis, Jacaranda copaia, Tabebuia amazonia, Homalium alchorneoides, and Dipteryx panamensis are superior to pure stands in terms of C sequestration (Redondo-Brenes and Montagnini, 2006). In contrast, Berger et al. concluded that the total C stocks in pure Norway spruce (Picea abies) forests are significantly higher than those in mixed forests (Berger et al., 2002). The difference in carbon sequestration capacity between pure forest and mixed forests stems from the biological characteristics of tree species themselves, the heterogeneity of ecosystem structure and function, as well as the differences in growth cycle characteristics and stability. SOC is an important component of carbon storage in terrestrial ecosystems (Zeng et al., 2024). SOC storage is affected by detrital inputs to soil (Fornara andTilma, 2008). One perspective suggests that mixed stands have an advantage over pure stands. This is because mixed forests provide a wider range of organic inputs, root secretions, and litter, creating a more diverse resource environment for soil microorganisms, which in turn favors SOC storage (Wang et al., 2013; Hao et al., 2022; Singh et al., 2024). In contrast, another perspective argues that increased competition among tree species may reduce soil organic matter (SOM) inputs to mixed plantations, which is detrimental to SOC sequestration (Manson et al., 2013).
Additionally, planting spacing is a factor influencing the carbon sequestration capacity of plantations. Truax et al. (2018) demonstrated that carbon stocks in the total biomass of 10-year-old hybrid poplars significantly increased as planting density rose from 500 trees per hectare to 1,111 trees per hectare. This highlights the potential of higher planting densities to enhance short-term carbon storage in certain species. However, the relationship between planting density and carbon sequestration is not universally consistent. For instance, Bai and Ding (2024) found that the carbon sink capacity of fast-growing Pinus massoniana plantations declined with increased planting density, suggesting that optimal density may vary depending on species and site conditions. Age is also a factor influencing carbon sequestration in planted forests. Pregitzer and Euskirchen (2004) found that the carbon storage capacity of forests increases with age, particularly in mature forests, where carbon storage is significantly higher than in younger stands. However, research on the carbon sequestration potential of young Picea crassifolia forests remains limited. These contrasting findings underscore the importance of tailoring planting spacing strategies to specific tree species and ecological contexts to maximize carbon sequestration potential.
The Qilian Mountains are located in the arid regions of Northwest China (Wu et al., 2024), and as one of the most important ecological security barriers in China, it plays a crucial role in biodiversity conservation, water supply, C sequestration and desert edge stabilization (Yang et al., 2018). The shallow mountain zones, characterized by their transitional ecosystems between arid plains and high-altitude forests, are especially vulnerable to climate change and human activities. Picea crassifolia is a dominant tree species in the Qilian Mountains accounting for 79.6% of the total forest area (Gao et al., 2018). It plays an important role in sheltering wind, trapping sand, conserving water, and regulating local climate (Du et al., 2022). China’s existing planted forest area and potential future afforestation area are mainly located in the arid regions of Northwest China (Zhang Z. et al., 2021). Rodríguez-Loinaz et al. (2013) concluded that replacing existing plantations of exotic species with native species afforestation has the greatest potential to boost C sequestration.
Picea crassifolia exhibits significant spatial variations in stoichiometry across the eastern, central, and western regions of the Qilian Mountains (Liu et al., 2016), which is closely related to environmental factors such as climate, soil and topography in different regions. Previous studies on Qinghai spruce have primarily focused on its ecosystem structure and function (Wang et al., 2016; Liu et al., 2021; Wan et al., 2022) as well as population dynamics (Wang et al.,. 2016; Wang et al.,. 2020). However, within the ecological environment of the Qilian Mountains, the optimal planting configuration for maximizing carbon sequestration remains to be explored. To address this question, we investigated the total organic C content of different planting patterns of P. crassifolia plantations. The following questions were proposed to be addressed: (1) Does a larger plant spacing (2 × 2 m) correspond to a stronger C sink capacity in a pure forest plantation pattern? (2) Under the condition of the same plant spacing, does the planting pattern of different age of spruce plantations show a stronger C sink capacity than the same age of forest? (3) By the same plant spacing, is the C sink capacity of pure forest more pronounced than that of mixed forests? This study is not only dedicated to providing a scientific basis for optimizing forest management strategies in the Qilian Mountains and theoretical support for achieving carbon neutrality goals, but also contributes to the global efforts in climate change mitigation.
2 Materials and methods
2.1 Overview of the study zone
The study area, located in Minle County, Zhangye City, Gansu Province (100°43′3.09″E, 38°26′10.86″N) (Figure 1), is characterized by a semi-arid climate with an average annual temperature of 3.2°C and precipitation of 350 mm. The average annual temperature was 3.2°C, ranging from 0°C to 7.6°C. The annual frost-free period lasted for 118 days, while the total annual sunshine hours amounted to 2,966.3 h. The annual precipitation in the region is approximately 350 mm, while the total evaporation throughout the year reaches 1,638 mm. (Climatic data were sourced from the Minle County Meteorological Station.) The study area, located in the shallow mountainous region of the Qilian Mountains, was previously characterized by sparse vegetation and limited tree cover due to historical grazing and minor agricultural activities. The afforestation plots involved in this study originally lacked tree cover, supporting only herbaceous plant communities. Given the absence of pre-existing forest, afforestation was chosen to establish new forest plantations in this region. The study area is characterized by low vegetation cover and a limited variety of plant species. The primary afforestation species include P. crassifolia and Pinus sylvestris var. mongholica Litv., with shrubs consisting of Caragana korshinskii Kom. and herbaceous plants represented by Agropyron cristatum (L.) Gaertn. Utilizing high-quality seedlings sourced from the Longqu Seed Garden in Zhangye, Gansu. Sample plots were surveyed in May to evaluate growth status and carbon sequestration capacity, avoiding the influence of seasonal precipitation on soil carbon dynamics. The study plots were established in the eastern section of the Qilian Mountains' low-altitude region, characterized by a typical temperate continental semi-arid alpine climate (mean annual temperature 0°C–4°C, annual precipitation 250–350 mm) and Haplic Cambisols soil type, ensuring ecological representativeness. Picea crassifolia was selected as the primary study species due to its dominant role in the regional forest ecosystem and its significant contribution to carbon sequestration. Comparative analysis revealed that the ecological conditions of the selected plots are highly comparable to those in the central and western sections of the Qilian Mountains, particularly in terms of the accumulated temperature above 10°C (1,200°C–1,500°C·d), which meets the thermal threshold requirements of the region (Yang et al.,. 2018).
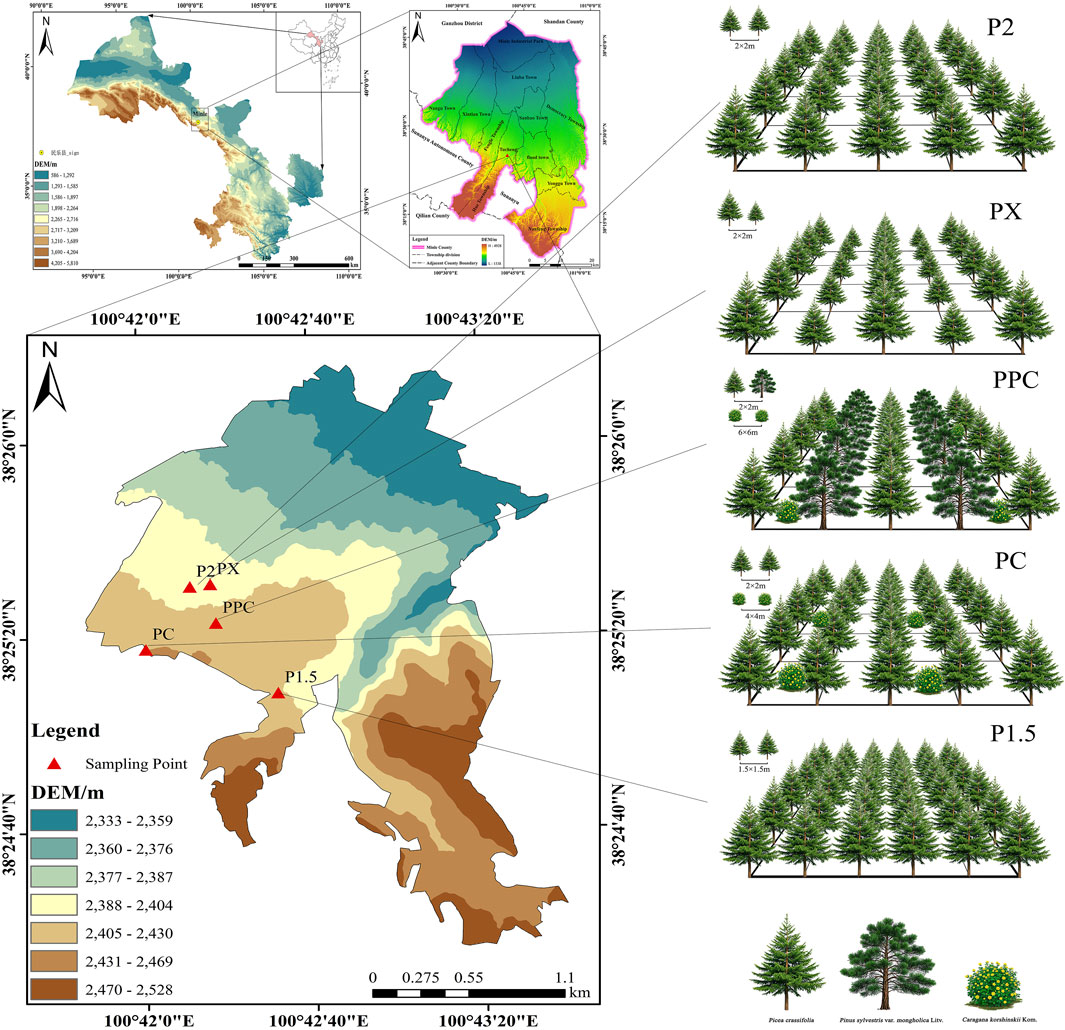
Figure 1. Overview of the experimental zone and schematic diagram of five planting patter.
2.2 Sample plot survey and vegetation biomass measurement
2.2.1 Specific methods for vegetation biomass measurement
The five planting patterns investigated include: (1) P1.5: pure forest with a planting spacing of 1.5 × 1.5 m; (2) P2: pure forest with a planting spacing of 2 × 2 m; (3) PX: pure forest with a planting spacing of 2 × 2 m but with trees of mixed ages (15 and 20 years); (4) PC: mixed forest with P. crassifolia and Pinus sylvestris var. mongholica; (5) PPC: mixed forest with P. crassifolia, P. sylvestris var. mongholica, and C. korshinskii. (Table 1). For each planting pattern, three repeated quadrats were set, each with a volume of 10 m × 10 m, and the spacing between adjacent quadrats was at least 20 m, for a total of 15 quadrats. Tree and shrub measurements were conducted using standard methods: tree height was measured with a 3 m standard measuring pole to the nearest 0.1 m; diameter at breast height (DBH) was measured at 1.3 m above ground level using a diameter tape to the nearest 0.1 cm; basal diameter (BD) was measured at 0.3 m above ground level using a vernier caliper to the nearest 0.01 mm; and crown width (CW) was determined by measuring the north-south and east-west diameters using a 5 m tape measure and calculating the arithmetic mean to the nearest 0.1 m. Additionally, three 1 m × 1 m herbaceous sample plots were randomly selected within each sample plot, and all herbaceous plants in these plots were collected.
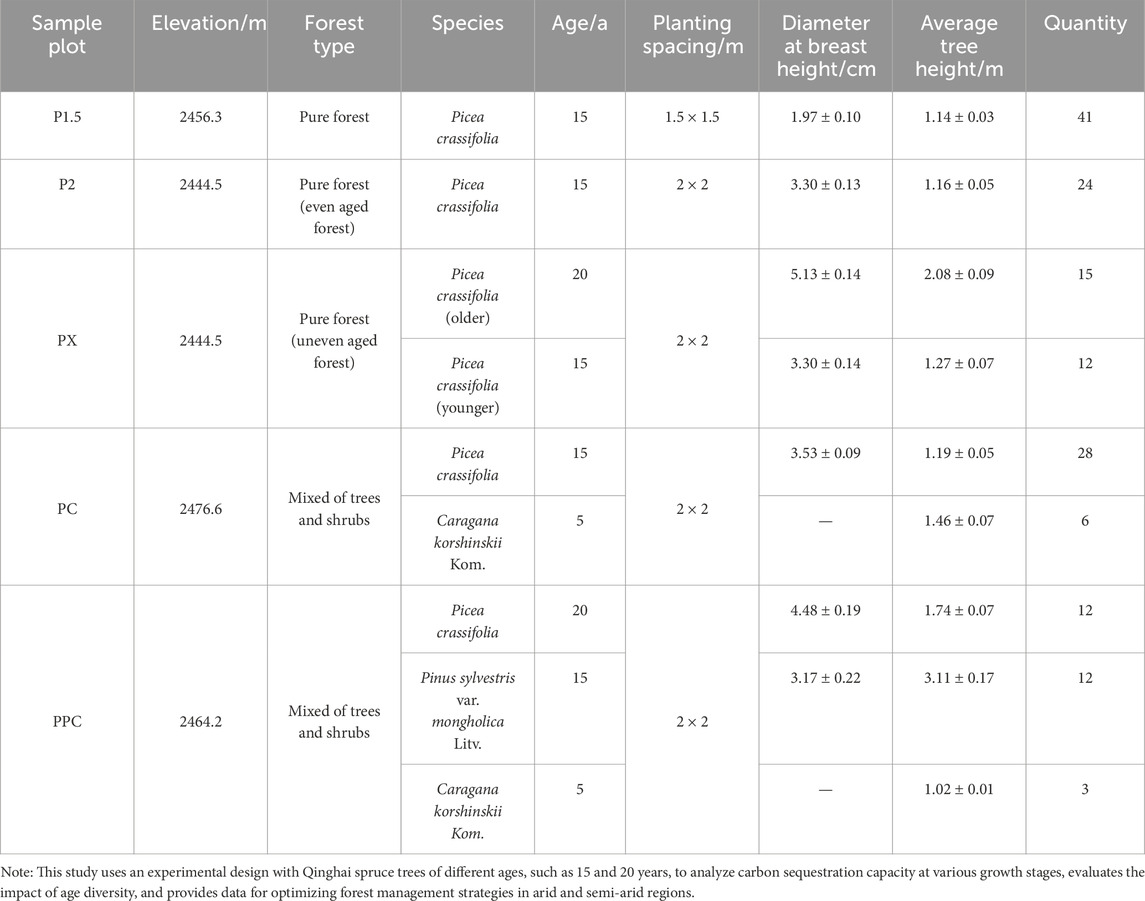
Table 1. Environmental factors and stand status of sample plots.
In each plot, three representative trees and shrubs were randomly selected for sampling. Branches were divided into three size groups (large, medium, and small), with 3-5 branches collected from each group. Leaves and bark were separated from these branches. A 10 cm section of stem was cut from below the new parts and the corresponding bark was collected. A 15 cm section of root was cut near the main trunk. Samples (branches, leaves, stem wood, bark, and roots) from each plant were mixed together. These mixed samples were put into plastic bags, labeled, and recorded for tracking. In the lab, all plant samples were heated at 105°C for 30 min to stop enzyme activity and prevent decay. Then, they were dried in an oven at 85°C until they reached a constant weight. The dried samples were ground into a fine powder. A 5 g portion of each powder was sifted through a 2 mm sieve to prepare for carbon content testing. Soil sampling was conducted using a diagonal method to select three sampling points, where a pit of 1 × 1 × 1 m3 was excavated to create a soil profile. A 100 cm3 soil ring sampler was employed for stratified sampling within this soil profile, specifically at depths of 0–20 cm, 20–40 cm, 40–60 cm, and 60–80 cm. Three soil sample plots were collected from each stratum, and all collected sample plots were placed in sealed bags. The soil sample plots were then brought back to the laboratory, dried at 105°C until a constant weight was achieved, and passed through a 2 mm sieve to remove gravel, roots, and other debris, in order to determine soil moisture content and average organic carbon density. The organic carbon content of the plant layer (trees, shrubs, and herbs) and soil was measured using the potassium dichromate oxidation method (Zhai et al., 2024). In addition, all samples were measured in parallel three times to improve the accuracy and reliability of the data. The average of three parallel measurements was taken as the final carbon content of the sample.
Since the forest area was protected and full harvesting for biomass determination was not permissible, the flux biomass method was employed for estimation. The biomass of P. crassifolia and P. sylvestris var. mongholica Litv. was calculated according to the national standard of the People’s Republic of China, GB/T 43648-2024, which outlined the standing tree biomass modeling of major tree species using C measurement parameters. For C. korshinskii Kom., the biomass was estimated using the model developed by Zhao et al. (2023).
In the Formula 1, MA, M1, M2, M3, M4, MB, and MY represent the aboveground, stem, bark, branch, leaf, underground, and total plant biomass of P. crassifolia (kg). DY refers to the diameter at breast height (cm) and HY represents the height of the tree (m). The variables g1, g2, and g3 indicate the ratios of bark, branch, and leaf biomass of P. crassifolia to its stem biomass, as well as the ratio of the total bark, branch, and leaf biomass of the plant to its stem biomass.
In the Formula 2, MC, M5, M6, M7, M8, MD, and MZ represent the aboveground, stem, bark, branch, leaf, underground, and total biomass (kg) of the P. sylvestris var. mongholica Litv.; DY denotes the diameter at breast height (cm), and HY indicates the tree height (m); g4, g5, and g6 refer to the biomass ratios of the bark, branches, and leaves of the P. sylvestris var. mongholica Litv. relative to the stem biomass.
In the Formula 3, WN represents the biomass of the C. korshinskii Kom., V denotes the plant volume (m3), H indicates the height of the plant (m), D refers to the crown diameter (m), while D1 and D2 represent the north-south and east-west crown diameters (m), respectively. CA signifies the crown area (m2).
2.2.2 Determination of organic C in vegetation layer and soil layer
Calculation formula for C stocks in the arbor layer:
In the Equation 4, CD represents the C stock in the tree layer (t·hm-2); BS, BB, BL, and BR denote the biomass per unit area of the stem, branches, leaves, and roots, respectively (t·hm-2); CFS, CFB, CFL, and CFR indicate the C content percentages of the stem, branches, leaves, and roots (%).
Formulas for calculating C content in shrub and herb layers:
In the Equation 5, Where C signifies the organic C stock (t·hm-2); B represents the total biomass (t·hm-2); and CF denotes the C content percentage (%).
Formulas for calculating SOC stock in soillayers:
In the Equation 6, TSOC stands for the total soil organic carbon storage in the soil layer (t·hm-2). Hi is the thickness of the i-th soil layer (cm); Bi is the average bulk density of the i-th soil layer (g·cm-3); Oi is the average organic C density of the i-th soil layer (g·kg-1); and n represents the number of soil layers.
2.3 Data statistics and analysis
The basic data collected during the study were systematically organized and pre-processed using Microsoft Excel (version 2019), which facilitated initial data cleaning, sorting, and preliminary calculations. Statistical analyses were performed using SPSS 25.0, with one-way ANOVA (Analysis of Variance) applied to assess significant differences among treatment groups. Data visualization was carried out using Origin 2021, which enabled the creation of high-quality graphs, including bar charts and percentage chart, with customized formatting to enhance clarity and presentation. All statistical results were reported as mean ± standard deviation (SD).
The membership function method was used to comprehensively evaluate the carbon sink potential of the five planting modes. The calculation formula of the membership function method is as follows:
In the Equation 7 μ(Xij) is the membership function value of growth index j of treatment group i; Xij is the measured value of ij index, and XmaxXmin are the maximum and minimum values of the index. In this study, i is the index coefficient of principal component composite index of age, spacing, DBH, height, BDH, Vegetation and Total Carbon Storage for five different planting modes (P1.5, P2, PX, PC and PPC). J is the index coefficient of principal component composite index of age, spacing, DBH, height, BDH, Vegetation and Total Carbon Storage.
3 Results
3.1 Vegetation and SOC in different planting patterns
According to Table 2, the average C content in the tree layer of P. crassifolia and P. sylvestris var. mongholica Litv. from 367.69 to 468.02 g‧kg-1 and from 409.31 to 473.09 g‧kg-1, respectively. For P. crassifolia, the average C content in each organ is ranked as follows: leaf > stem > branch > bark > root, with values of 445.60, 442.09, 439.45, 410.83, and 385.18 g‧kg-1. For P. sylvestris var. mongholica Litv., the average C content in each organ is 409.31, 473.09, 454.52, 434.83, and 414.94 g‧kg-1. The shrub layer shows similar values, indicating that the average C contents are 409.31, 473.09, 454.52, 434.83, and 414.94 g‧kg-1. Notably, the average C content of the grass layer showed no significant difference across the five sample plots, with a mean value of 402.51 g‧kg-1.
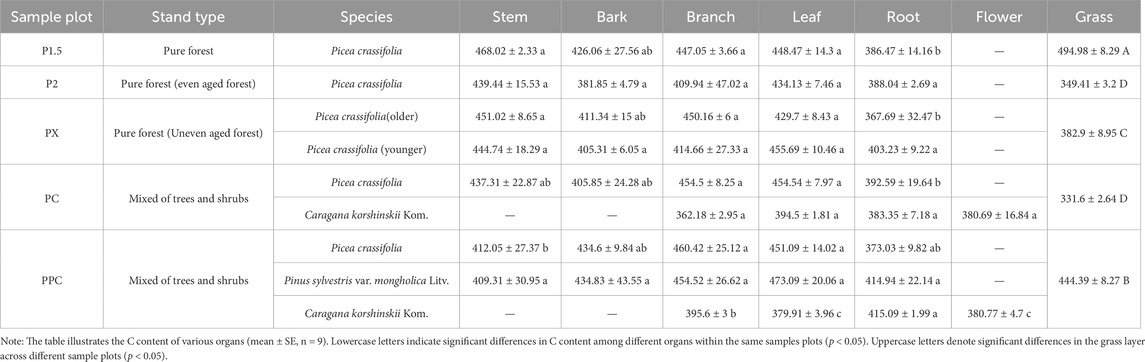
Table 2. C content of each component in plant layer of different plantation types (g·kg-1).
In sites P2 and PPC, the soil organic carbon (SOC) content in the 20–40 cm layer is significantly lower than in other layers, measured 7.60 g‧kg-1 and 8.22 g‧kg-1 (Figure 2), indicating potential differences in carbon sequestration potential. This 20–40 cm layer consistently has the lowest organic C content across all sample plots, with values of 7.596 g‧kg-1 in P1.5, 7.45 g‧kg-1 in P2, and 9.50 g‧kg-1 in PX and PC. In PPC, there is a noticeable decreasing trend in SOC content with increasing depth. In the 0–20 cm and 20–40 cm soil layers, P2 and PC exhibit relatively high organic C contents. Conversely, the 40–60 cm soil layer shows the highest concentration in PC at 11.58 g‧kg-1, while PPC has a significantly lower value of only 8.54 g‧kg-1. For the 60–80 cm soil layer, P2 and PC again show significantly higher organic C contents, measured 13.64 and 12.57 g‧kg-1, respectively.
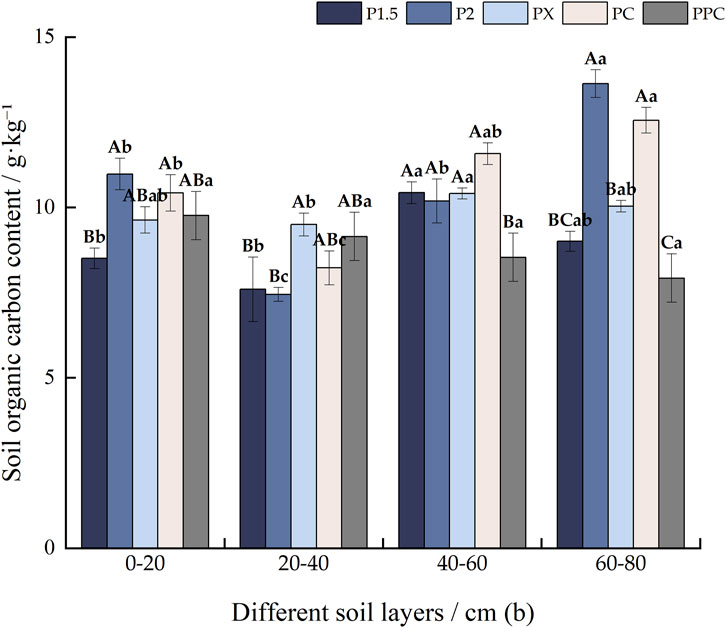
Figure 2. Soil organic C content of different cultivation types (g‧kg−1). Note: Lowercase letters denote intra-layer differences within the same soil layer, while uppercase letters indicate inter-layer differences between different soil layers (p < 0 0.05). (±SE) (n = 9).
3.2 Vegetation layer biomass in different planting patterns
The total biomass of the tree layer varied significantly among planting patterns, with P2 (2 × 2 m pure forest) exhibiting the highest biomass (11.38 t hm−2), followed by PX (age-heterogeneous mixed forest) and P1.5 (1.5 × 1.5 m pure forest) (Table 3). This was much higher than the combined biomass of the shrub and herb layers. The leaf and root biomass accumulation of P. crassifolia was significantly greater than that of P. sylvestris var. mongholica Litv.; however, the stem biomass accumulation of P. sylvestris var. mongholica Litv. was notably higher than that of P. crassifolia. The biomass of the shrub layer was the second highest (Table 4), following the tree layer. In contrast, the herb layer showed Limited growth, with biomass ranging only from 0.01 to 0.02 t‧hm-2. Overall, the ranking of biomass among the plots was as follows: PX > PC > PPC > P2 > P1.5.
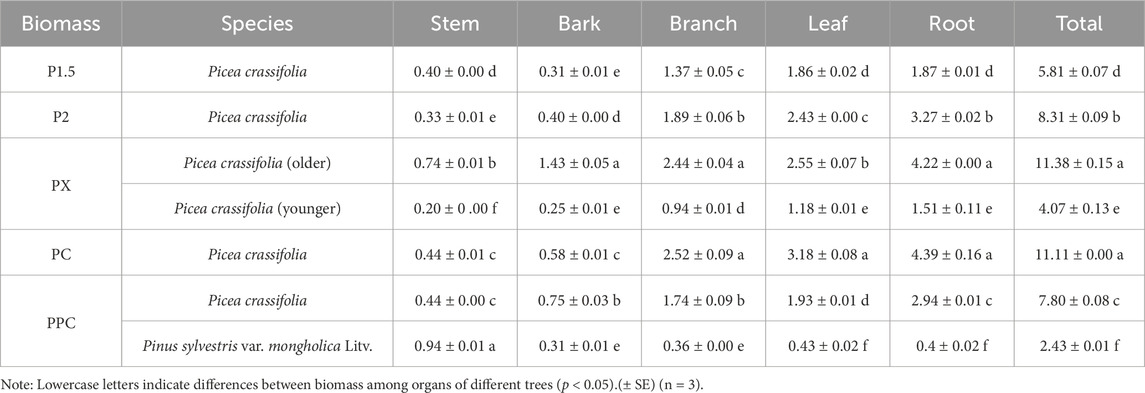
Table 3. Tree layer biomass of different plantation types (t·hm-2).
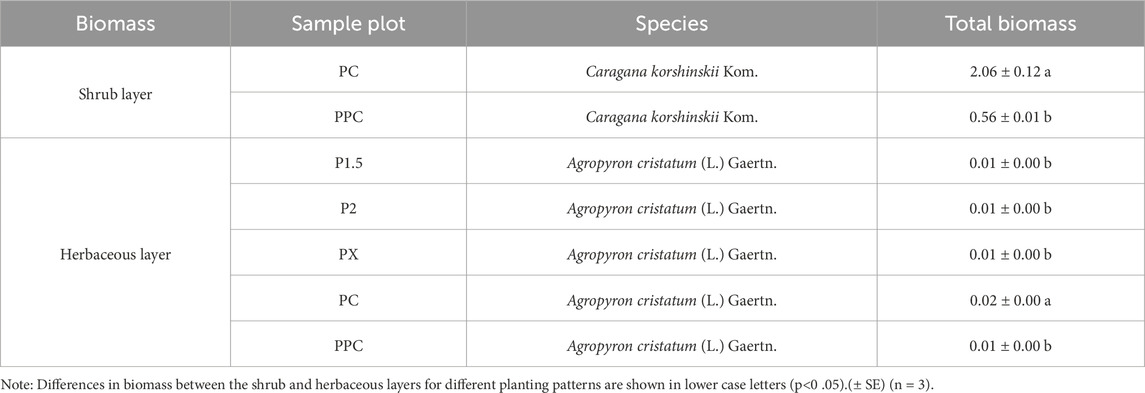
Table 4. Biomass of shrub layer and herbaceous layer in different types of artificial forests (t·hm-2).
Soil bulk density greatly among the plots, with PPC showing the highest values in the 0–20 cm layer (1.50 g cm-3) and PC the lowest (1.10 g cm-3) (Figure 3). In the vertical space, the soil bulk density of the samples tended to decrease with the deepening of the soil layer, and the bulk density of the PPC was significantly greater in the 0–20 cm than in the 20-40 and 60–80 cm. In the horizontal space, the average values of the soil bulk density of the 0-20, 40-60, and 60–80 cm samples were the highest in the layer, with the values of 1.50, 1.46, and 1.42 g‧cm-3, respectively; PC, on the other hand, was the smallest, with 1.30, 1.11, and 1.10 g‧cm-3.
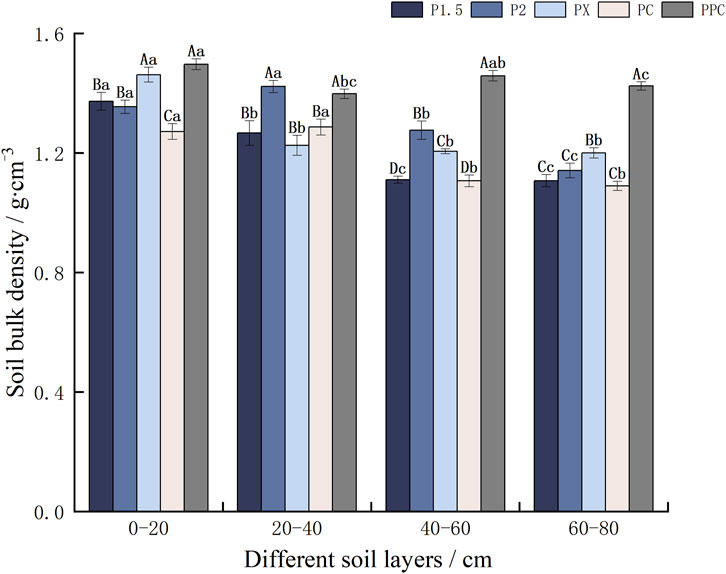
Figure 3. Soil bulk density of different plantation types (g·cm-3). Note: Lowercase letters denote intra-layer differences within the same soil layer, while uppercase letters indicate inter-layer differences between different soil layers(p < 0 .05).(± SE) (n = 9)
3.3 C stocks in different planting patterns
3.3.1 C stocks in pure forest plantation patterns
According to Figure 4, P1.5 adopts 1.5 × 1.5 row spacing, in the vegetation layer, due to the dense row spacing, the growing space of plants is limited, and it is difficult to develop the biomass of a single plant, resulting in a lower level of C storage, which is about 5 t‧hm-2. On the other hand, P2 adopts 2 × 2 row spacing, the growing space of plants is relatively wide, the single plants can grow better, the biomass of single plant is increased, and the C storage of the vegetation layer is about 10 t‧hm-2, which is higher than P1.5. P2 is a same-age forest of 15a, and PX is a heterogeneous forest age of 15a and 20a. The C storage was about 10 t‧hm-2, higher than that of P1.5. Overall, its P2 C stock is larger than that of PX, with 111.079 t‧hm-2. PX C stock in the vegetation layer is significantly higher than that of P2, and there is no significant difference in the soil layer.
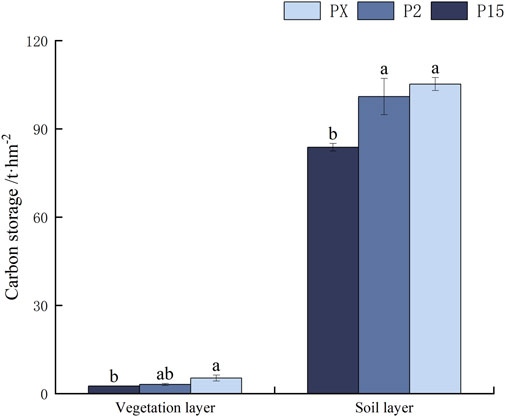
Figure 4. C stocks in pure forest plantation patterns. Note: Lowercase letters indicate the difference in C stocks between pure forests with different cropping patterns.
3.3.2 Pure and mixed forests
According to Table 5, the distribution of carbon (C) stocks across different ecological layers—soil layer, tree layer, shrub layer, and herb layer—follows a clear hierarchical pattern, with the soil layer storing the highest proportion of C, followed by the tree layer, shrub layer, and herb layer. Predominantly, the soil layer exhibited the largest C stock, contributing over 94.02% across all sample plots, particularly the 0–20 cm depth, is the most significant component of total carbon storage (Figure 5B). The total C stocks associated with different planting patterns followed the order of P2 > PX > PPC > PC > P1.5. Notably, the C stocks in both the soil and tree layers of P1.5 were significantly lower compared to other sample plots, leading to an overall diminished C stock relative to the different planting configurations. The PX pattern demonstrated the highest vegetation layer C stock, which constituted 6.15% of the total stock within that sample plot. Despite PX’s favorable vegetation layer C stock, the total C stock of P2 surpassed that of PX, primarily due to P2’s top-ranking soil layer C stock of 107.69 t‧hm-2. This superiority is associated with the elevated SOC content observed in P2 at both the 0–20 cm and 40–60 cm depths, the highest among all examined planting patterns (Figure 5A). The total C stock is closely linked to the attributes of the tree layer, which retains a dominant proportion in both the PC and PPC planting patterns, even with the addition of contributions from the shrub layer. Conversely, the C stocks within the herbaceous layer were consistently below 0.01 t‧hm-2.
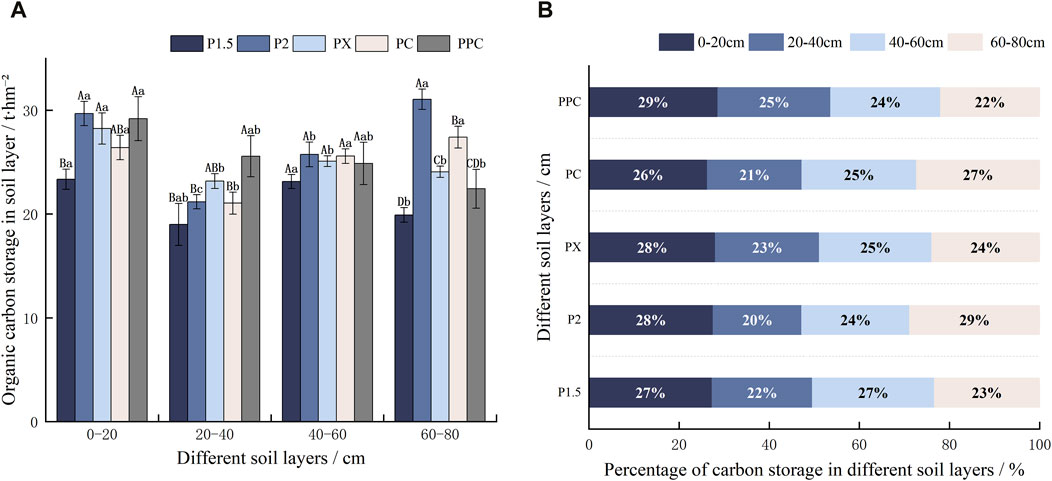
Figure 5. Soil C storage in different plantation types (A) (t·hm-2) and C storage percentage (%) in different soil layerss (B). Note: Lowercase letters denote intra-layer differences within the same soil layer, while uppercase letters indicate inter-layer differences between differet soil layers (p < 0.05).

Table 5. Plant layer C storage of different plantation types (t·hm-2).
3.4 Analysis of tree growth, C storage, and planting pattern C sink potential
3.4.1 Correlation analysis of growth indicators and CStorage
In Figure 6, correlations between plot type, species composition, elevation, stand age, planting distance, DBH, tree height, plant number, biomass, soil bulk weight, and carbon storage (vegetation carbon storage, soil layer carbon storage, and total carbon storage) were analyzed. The results show that soil layer carbon storage is positively correlated with total carbon storage and is the main contributor to total carbon storage, while the contribution of vegetation carbon storage is relatively small. Planting distance and DBH were positively correlated with carbon storage, indicating that a greater increase in planting distance and DBH would help increase carbon storage. There was a significant negative correlation between plant number and carbon storage, suggesting that over-dense planting may inhibit carbon fixation. The direct effects of stand age and tree height on carbon storage are weak, but stand age and tree height are strongly positively correlated. There was also a strong positive correlation between soil bulk density and planting distance.
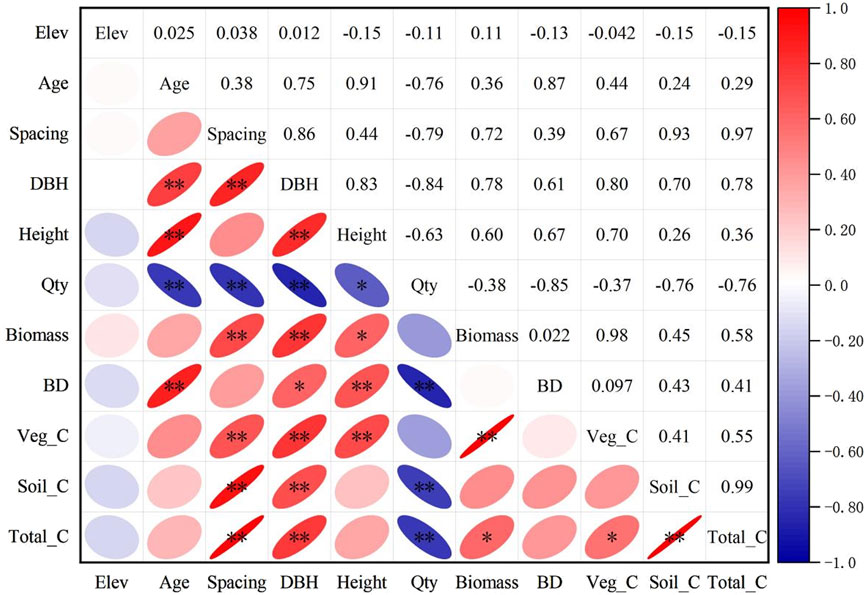
Figure 6. Correlation Matrix of Tree Growth Indicators and C Storage. Note: Elevation is abbreviated as Elev, Average tree height as Height, Quantity as Qty, Total Biomass as Biomass, soil bulk density as SBD, vegetation carbon storage as Veg_C, soil layer carbon storage as Soil_C, and total carbon storage as Total_C. ** denotes significance at p < 0.01, and * denotes significance at p < 0.05.
3.4.2 Membership function analysis and C sink potential evaluation
In the membership function analysis, the correlation among variables was initially assessed through a correlation coefficient matrix (Figure 6). The analysis revealed that biomass exhibited a strong positive correlation with DBH, while quantity was negatively correlated with biomass. Additionally, soil layer carbon storage showed a high correlation with total carbon storage. To mitigate redundancy and multicollinearity issues, representative variables such as DBH, Spacing, and Total_C were selected, whereas elevation, which demonstrated weak correlations with other variables, was excluded. Subsequently, the standardized values of Age, Spacing, DBH, Height, BDH, Veg_C, and Total_C were subjected to factor extraction using SPSS 26.0 software. Based on the Kaiser criterion (eigenvalue >1) and the principle of cumulative contribution rate exceeding 85%, two principal components were extracted (Table 6). Principal component 1, accounting for 67.46% of the total variance, primarily represented growth structure factors, while principal component 2, explaining 20.52% of the variance, was predominantly associated with carbon accumulation factors. Together, these two components explained 87.98% of the total variance, demonstrating a robust extraction effect, with the communality of each variable exceeding 0.67 (Table 7). The score values for the two principal components, denoted as X(x), were calculated by multiplying the standardized data by the respective index coefficients of the principal component composite indices. Membership values were derived using the corresponding membership functions, and the weights of the principal components were determined as 0.77 and 0.23 based on their variance contribution rates. The composite score was computed using the formula: Score = 0.77 × μ1 + 0.23 × μ2. The overall ranking of the planting patterns was PX > PPC > PC > P2 > P1.5 (Table 8). The PX planting pattern achieved the highest composite score, indicating superior performance in both growth characteristics and carbon storage. Specifically, PX scored the maximum membership value of 1.00 for principal component 1 and a moderate value of 0.52 for principal component 2. The PPC model excelled in principal component 2 with a membership value of 1.00 but performed moderately in principal component 1 with a value of 0.68, resulting in a composite score of 0.75. In contrast, the P1.5 model performed poorly across both principal components, yielding the lowest composite score of 0.06. These findings underscore that the PX planting pattern exhibits the highest carbon sequestration potential among the evaluated models.
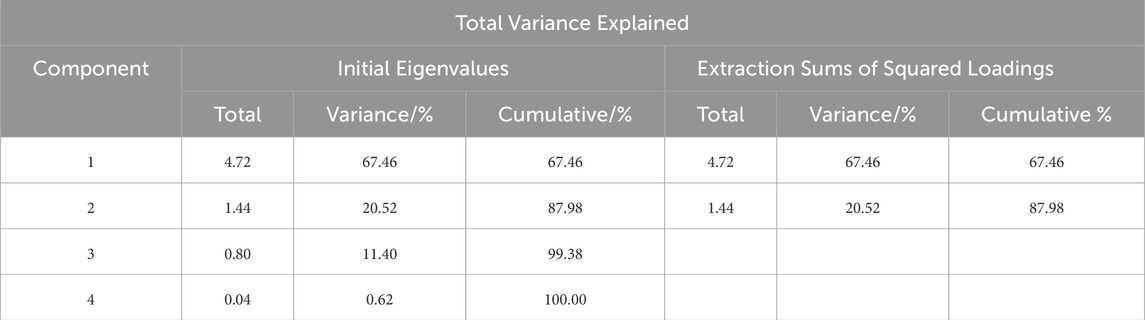
Table 6. Total Variance Explained by Principal Components.
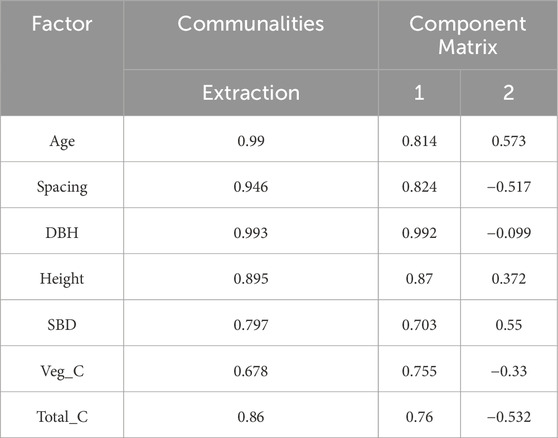
Table 7. Communalities and Component Loadings for Extracted Factors.
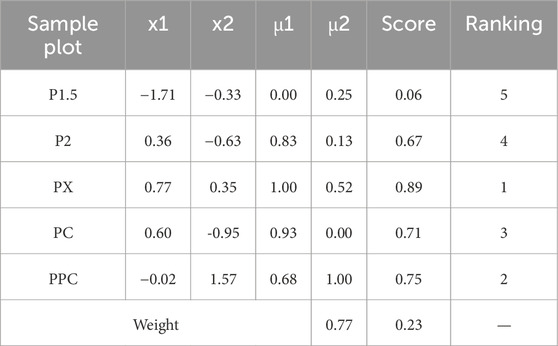
Table 8. Evaluation and Ranking of Sample Plots Based on Membership Scores and Composite Metrics.
4 Discussion
4.1 Vegetation C and SOC content
Carbon content in Qinghai spruce organs followed the order: leaf > stem > branch > bark > root, consistent with findings by Liu et al. (2016). This pattern reflects higher photosynthetic efficiency and carbon allocation to leaves under stress conditions. The higher C content of leaves implies a lower photosynthetic rate, slower growth rate, and higher adaptability to adverse external environments (Li et al.,. 2022). The size of the organic C content of each organ of P. sylvestris var. mongholica Litv. in this study was in the order of stem, leaf, branch, bark, and root. This result is similar to that of Dai et al., (2021). There was a difference in the order of C content of the organs of P. crassifolia and P. sylvestris var. mongholica Litv., as shown by the difference in the order of leaves and stem. The organ with the highest Carbon sequestration capacity varied among different tree species, reflecting their unique growth characteristics and ecological roles (Widagdo et al.,. 2021). This may be due to the different antagonistic strategies adopted by the two tree species in response to environmental stress. Picea crassifolia may be more inclined to increase foliar C storage to improve photosynthetic efficiency, while P. sylvestris var. mongholica Litv. may focus more resources on stem growth, resulting in a different pattern of C allocation. In global carbon stock estimations, the average carbon content of tree layers is typically assumed to be 0.45 or 0.50. However, this approach fails to account for the diversity of tree species and ecosystems, potentially leading to significant estimation errors (Pan et al., 2011). In this study, systematic measurements of carbon content in different organs provide foundational data to improve carbon stock estimation models.
The SOC content was highest in the 0–20 cm layer, followed by a significant decrease in the 20–40 cm layer, while a certain rebound and stabilization trend was observed in the deeper layers (40–80 cm). The reason why the organic C content of the surface soil (0–20 cm) is higher than that of the deep soil is that the decomposition of surface litter and plant roots has a direct effect on the surface layer of the soil, and organic matter will first enter the surface layer of the soil, while the deeper layers of the soil show a gradual decrease due to the weakening of plant decomposition and the attenuation of the accumulation and sedimentation of organic matter (Zhang et al.,. 2009). Similarly, SOC accumulates most in the surface layer, which is similar to the results of previous studies (Yu et al.,. 2023).
4.2 Pure forest C stocks
P1.5 and P2 were both pure stands of P. crassifolia, and the C stocks in both vegetative and soil layers were greater in P2 than in P1.5. The reason for the smaller biomass of P1.5 than that of P2 was due to the difference in planting distance, with a spacing of 1.5 × 1.5 m in P1.5 and 2 × 2 m in P2. The two sample plots were afforested at the same time, and the DBH of P1.5 was small (Table 1). The reason for the smaller diameter growth at higher densities compared to low and medium densities may be due to the very intense competition for belowground resources, which affects the overall growth (Farooq et al.,. 2021). It was inferred that the higher stand density made the trees in P1.5 more competitive, which may have limited their growth and biomass increase, resulting in a relatively low C stock. Ma et al. found that SOC decreased with increasing stand density (Ma et al.,. 2023), which was also verified in this study in the comparison between P1.5 and P2.
Both PX and P2 were established using a planting distance of 2 × 2 m, with the C stock of PX measured at 111.079 t hm-2, which surpassed that of P2. This finding is consistent with the research conducted by Nilsen and Strand, which indicated that C stocks in homogeneous forest systems of the same age tend to be greater than those found in heterogeneous forest systems, specifically within P. abies (L.) Karst. Habitats (Nilsen et al.,. 2013). The C stock of PX in the vegetation layer was significantly higher than that of P2. P. crassifolia is a long-lived perennial plant (Li et al.,. 2014), in the young forest stage, the C sequestration rate increases with the increase of age (Justine et al.,. 2017). The accumulation of vegetation biomass carbon along the age gradient can be attributed to the increase in leaf area index prior to canopy closure (Wang et al.,. 2019). At the same time, the multi-layered canopy structure formed by trees of different ages in Xeric forests and the vertically elongated light wells at the top of the conical canopy allow light to reach the lower canopy and understory, making more efficient use of light resources and promoting biomass accumulation and C fixation (Dănescu et al.,. 2016). Although the soil C stocks of PX and P2 did not show significant differences, P2 had a higher soil C stock primarily due to its significantly greater SOC content at a depth of 60–80 cm. This may be attributed to P2’s more regular and organized root growth pattern compared to PX, as well as P2’s relatively greater root depth and density of distribution in the 60–80 cm soil layer.
4.3 C stocks in pure and mixed forests
The carbon stock in the pure forest PX was larger than that in the mixed forest PC, and it was the vegetation layer carbon stock that was the highest among the five planting modes, which was mainly due to the 15 extra 20-year old P. crassifolia trees in the PX. Cheng et al. (2008) demonstrated that C stock increases with the age of the forest. This indicates that in the young forest stage, C stock rises as the trees mature. Since PX has a higher number of individual P. crassifolia compared to PC, and as these additional P. crassifolia continue to accumulate C with age, this results in the highest level of C storage in the vegetation layer of PX.
The layer C stock of pure forest PX was larger than that of mixed forest PC, and the difference in C stock between PX and PPC was mainly reflected in the vegetation layer, specifically in the tree species. The accumulation of C stock of P. crassifolia in PX was larger than that of P. sylvestris var. mongholica Litv., which might be because the current standing conditions were more suitable for the growth of P. crassifolia. Zhao et al. (2024) showed that P. crassifolia was the dominant species in the Qilian Mountains. The study also found that monoculture plantations typically exhibit higher values in DBH, total height, and tree volume (Redondo-Brenes, 2007). This suggests that under specific ecological conditions, monoculture plantations of well-adapted single tree species may achieve higher carbon sequestration efficiency compared to mixed forests, particularly during the early stages of afforestation. However, their long-term carbon sequestration potential and ecosystem stability require further research and evaluation. In this study, the extent of C storage in the vegetation layer was in the order of tree layer, shrub layer, and herb layer. This is consistent with the results of Ming et al. (2014), where the C stock in the tree layer was dominant in the sample plots. This is because trees can synthesize and accumulate more organic matter than other vegetation types (Cleveland et al.,. 2011). And because the C stock in the shrub layer is smaller than that in the tree layer, even with the addition of the shrub C. korshinskii Kom. in the PPC, the C stock in the PX remains the largest. The C stocks in the herbaceous layer are all lower than 0.01 t hm -2, indicating Limited growth and low C stock contribution. In the mixed forest PC and PPC, the C stock in the shrub layer was higher than that in the herb layer, which was mainly related to the characteristics of the ecosystem community structure. The shrub layer is above the herb layer, which has an absolute advantage in the competition for sunlight and heat and can effectively absorb sufficient light and fully photosynthesize, thus accumulating more organic matter (Xie et al.,. 2018).
The total carbon storage of P2 P. crassifolia plantation (with a planting spacing of 2 × 2 m) is 111.079 t‧hm-2. When compared with other plantations globally and within the study area, the carbon storage of P. crassifolia plantation is at a moderately high level. For instance, the total carbon storage of a 16 - year - old Castanea mollissima plantation is 67.53 t‧hm-2 (Zhang L. et al., 2021). In contrast, the carbon storage of a 12 - year - old Eucalyptus plantation ecosystem amounts to 151.331 t‧hm-2 (Lu, 2024). Additionally, the carbon storage of a young mixed - species plantation (Liriodendron chinense × Cinnamomum camphora × Liquidambar formosana Hance × Schima superba) in the mid - subtropical region reaches 167.06 t‧hm-2 (Li et al., 2019), which is significantly higher than that of Picea crassifolia plantation. These comparisons indicate that Picea crassifolia plantation exhibits certain competitiveness in carbon sequestration, especially in arid and semi - arid regions. Its strong adaptability and long growth cycle make it an important carbon - sink tree species. However, compared with Eucalyptus plantations and young mixed - species plantations, there is still room for improvement in the carbon storage of Picea crassifolia plantation. Compared to Picea crassifolia forests in other regions of China, the carbon stock of the spruce forest in this study demonstrates competitiveness. Ji et al. (2014) found that the total organic carbon stock of Picea crassifolia forests in the Helan Mountains of Ningxia reached 247.71 t‧hm-2. Peng et al. (2011) reported that the average carbon density of young Picea crassifolia forests in the Qilian Mountains was 83.8 t‧hm-2. These studies indicate that the carbon stock of Picea crassifolia forests varies significantly across different regions and age classes, yet it generally exhibits high carbon sequestration potential in arid and semi-arid regions.
Taken together, P2 had the highest C storage of all the planting patterns, although the P2 vegetation layer did not have the highest C storage. Among them, soil C storage was largest (Wang et al.,. 2002; Yang et al.,. 2018). It may be P. crassifolia had higher soil C stocks than the exotic species (Eslamdoust and Sohrabi, 2018). Tree C stocks increased significantly with stand age, whereas shrub and herbaceous C stocks did not vary with stand age (Jun et al.,. 2018). However, the process of C stock growth in forest stands is not static, but after reaching a certain age, the magnitude of growth gradually decreases with increasing age (Jiang et al.,. 2015). Therefore, the carbon sequestration of planted forest is mainly stored in vegetation in the short term, while in the long term, soil carbon accounts for a larger proportion in the total carbon sequestration of aged planted forest (Redondo-Brenes and Montagnini, 2007). Therefore, while P2 currently exhibits the highest carbon storage among all planting patterns, the data in Table 8 suggest that the PX planting model may demonstrate greater carbon sequestration potential in the long term. Therefore, regular monitoring and evaluation of the sample plots should be carried out. SOC levels are significantly influenced by mixing patterns, with microorganisms demonstrating selective utilization of C sources based on these patterns (Yang et al.,. 2018). Consequently, it is imperative to investigate and develop diverse silvicultural strategies in future research. These strategies should encompass not only the selection of tree species and planting densities but also integrate various ecological and climatic conditions to optimize the accumulation of soil C stocks. By employing a range of silvicultural approaches, it is possible to enhance the stability and resilience of the ecosystem, ultimately leading to an increase in overall C stocks. This research not only contributes to a deeper understanding of forest carbon dynamics but also provides practical guidance for forestry management. Future research and management efforts should focus on continuous monitoring and the development of innovative silvicultural practices to maximize the carbon sink potential of forest ecosystems, thereby playing a more effective role in mitigating climate change.
5 Conclusion
The C content of each tree layer of P. crassifolia was measured in the order of leaf > stem > branch > bark > root. The SOC content was highest in the 0–20 cm layer, followed by a significant decrease in the 20–40 cm layer, while some recovery and stabilization trend was observed in the deeper layers (40–80 cm). The PX cropping pattern had the highest carbon stock in the vegetation layer. The planting distance of 2 × 2 m and the even-aged forest planting pattern corresponded to a stronger C sink capacity in the pure forest planting mode. In both pure and mixed forest planting patterns, pure forest plantation P2 (even-aged forest) outperformed mixed forest in carbon sequestration and exhibited the highest soil carbon sequestration, indicating the potential for pure forest to serve as effective carbon sinks. The 2 × 2 m pure forest (P2) configuration maximizes carbon sequestration in shallow mountain ecosystems, driven by soil carbon dominance (94% of total stocks). Future research should focus on long-term monitoring and adaptive management strategies to sustain carbon sink potential. Moving forward, maximizing the carbon sink potential of forest ecosystems will necessitate innovative research and management strategies, including the development of comprehensive, long-term monitoring systems and the exploration of diverse silvicultural practices. It is essential to establish a comprehensive, long-term monitoring system that integrates satellite remote sensing, ground-based sensors, and UAV mapping to accurately track carbon dynamics and inform adaptive management strategies. Simultaneously, it is crucial to explore diversified silvicultural practices that optimize plantation forest structures by incorporating environmental factors such as rainfall, temperature, and soil texture into management strategies. These efforts will enable forest ecosystems to play a pivotal role in mitigating climate change and ensuring environmental sustainability, thereby contributing to global climate goals.
Data availability statement
The raw data supporting the conclusions of this article will be made available by the authors, without undue reservation.
Author contributions
YS: Writing – original draft, Investigation. HZ: Writing – review and editing, Conceptualization, Methodology, Project administration. ZZ: Writing – review and editing, Conceptualization, Methodology. EX: Writing – review and editing, Resources, Supervision. DL: Project administration, Supervision, Writing – review and editing. YW: Project administration, Supervision, Writing – review and editing. XZ: Investigation, Project administration, Writing – review and editing. NW: Writing–review and editing. GC: Investigation, Writing – review and editing. JL: Formal Analysis, Investigation, Methodology, Validation, Writing – review and editing. XW: Formal Analysis, Investigation, Methodology, Validation, Writing – review and editing. ZG: Project administration, Writing–review and editing. ML: Project administration, Writing – review and editing.
Funding
The author(s) declare that financial support was received for the research and/or publication of this article. This work was funded by The Provincial Talent (Youth Team) Program of Gansu Province (Gan Zu Tong Zi (2024)4), The ‘Young Scholars in the West’ program, a joint initiative of the Chinese Academy of Sciences (CAS) and the Gansu Provincial Department of Science and Technology (GDST) (23JR6KG035), The Science and Technology Plan Program in Zhangye City, Gansu Province of China (ZY2023KY02 and ZY2022BJ1), The Gansu Youth Science and Technology Fund Project (24JRRA658, The Yunnan Key Laboratory of Plant Reproductive Adaptation and Evolutionary Ecology (No.YNPREC-2024005),The Gansu Agricultural University Public Recruitment Doctoral Research Launch Fund (GAU-KYQD-2019-12) and The Zhangye City Forestry and Grassland Science and Technology Programme Project (Zhanglin Zaofa [2023] No. 159).
Acknowledgments
We would like to sincerely thank everyone who has helped make this study possible.
Conflict of interest
Author ZG was employed by the Environmental Bridge (Shanghai) Environmental Technology Company Limited. Author ML was employed by the Western C Sink Trading Asset Management (Gansu) Company Limited.
The remaining authors declare that the research was conducted in the absence of any commercial or financial relationships that could be construed as a potential conflict of interest.
Generative AI statement
The author(s) declare that no Generative AI was used in the creation of this manuscript.
Publisher’s note
All claims expressed in this article are solely those of the authors and do not necessarily represent those of their affiliated organizations, or those of the publisher, the editors and the reviewers. Any product that may be evaluated in this article, or claim that may be made by its manufacturer, is not guaranteed or endorsed by the publisher.
Supplementary material
The Supplementary Material for this article can be found online at: https://www.frontiersin.org/articles/10.3389/feart.2025.1560899/full#supplementary-material
References
Bai, Y., and Ding, G. (2024). Estimation of changes in carbon sequestration and its economic value with various stand density and rotation age of Pinus massoniana plantations in China. Sci. Rep. 14 (1), 16852. doi:10.1038/s41598-024-67307-z
Berger, T. W., Neubauer, C., and Glatzel, G. (2002). Factors controlling soil carbon and nitrogen stores in pure stands of Norway spruce (Picea abies) and mixed species stands in Austria. For. Ecol. Manag. 159 (1-2), 3–14. doi:10.1016/S0378-1127(01)00705-8
Brovkin, V., Raddatz, T., Reick, C. H., Claussen, M., and Gayler, V. (2009). Global biogeophysical interactions between forest and climate. Geophys. Res. Lett. 36 (7). doi:10.1029/2009GL037543
Cheng, F., Tian, J., He, J., He, H., Bao, G., Yang, Y., et al. (2024). China's future forest carbon sequestration potential under different management scenarios. Trees, For. People 17, 100621. doi:10.1016/j.tfp.2024.100621
Cheng, T. R., Feng, J., Ma, Q. Y., Wang, Y., Kang, F., Feng, Z., et al. (2008). Carbon pool and allocation of forest vegetations in Xiaolong mountains, Gansu Province. Acta Ecol. Sin. 1, 33–44. doi:10.3321/j.issn:1000-0933.2008.01.004
Cleveland, C. C., Townsend, A. R., Taylor, P., Alvarez-Clare, S., Bustamante, M. M., Chuyong, G., et al. (2011). Relationships among net primary productivity, nutrients and climate in tropical rain forest: a pan-tropical analysis. Ecol. Lett. 14, 939–947. doi:10.1111/j.1461-0248.2011.01658.x
Dai, L., Zhang, Y. F., Wang, L., Zheng, S. L., and Xu, W. Q. (2021). Assessment of carbon density in natural mountain forest ecosystems at northwest China. Int. J. Environ. Res. Public Health 18, 2098. doi:10.3390/ijerph18042098
Dănescu, A., Albrecht, A. T., and Bauhus, J. (2016). Structural diversity promotes productivity of mixed, uneven-aged forests in southwestern Germany. Oecologia 182 (2), 319–333. doi:10.1007/s00442-016-3623-4
Du, M., Zhang, F., Gou, X., Liu, Y., Xia, J., and Wu, X. (2022). Different responses of radial growth of Picea crassifolia to climate warming in the middle and eastern Qilian Mountains. J. Glaciol. Geocryol. 44, 14–23. doi:10.7522/j.issn.1000-0240.2021.0130
Eslamdoust, J., and Sohrabi, H. (2018). Carbon storage in biomass, litter, and soil of different native and introduced fast-growing tree plantations in the South Caspian Sea. J. For. Res. 29, 449–457. doi:10.1007/s11676-017-0469-5
Farooq, T. H., Shakoor, A., Rashid, M. H., Zhang, S., Wu, P., and Yan, W. (2021). Annual growth progression, nutrient transformation, and carbon storage in tissues of Cunninghamia lanceolata monoculture in relation to soil quality indicators influenced by intraspecific competition intensity. J. Soil Sci. Plant Nutr. 21, 3146–3158. doi:10.1007/s42729-021-00595-w
Fornara, D. A., and Tilman, D. (2008). Plant functional composition influences rates of soil carbon and nitrogen accumulation. J. Ecol. 96, 314–322. doi:10.1111/j.1365-2745.2007.01345.x
Gao, L. L., Gou, X. H., Deng, Y., Wang, Z. Q., Gu, F., and Wang, F. (2018). Increased growth of Qinghai spruce in northwestern China during the recent warming hiatus. Agric. For. meteorology 260, 9–16. doi:10.1016/j.agrformet.2018.05.025
Hao, Z., Quan, Z., Han, Y., Lv, C., Zhao, X., Jing, W., et al. (2022). Soil mineralized carbon drives more carbon stock in coniferous-broadleaf mixed plantations compared to pure plantations. PeerJ 10, e13542. doi:10.7717/peerj.13542
Ji, B., Wang, J., He, J., Xu, H., Li, N., and Zhang, Y. (2014). Organic carbon storage of Picea crassifolia forests in the helan mountains nature Reserve of Ningxia. Pratacultural Sci. 31 (8), 1445–1449. doi:10.11829/j.issn.1001-0629.2013-0595
Jiang, J. M., Jia, W. W., and Liu, Q. (2015). Research on carbon storage maturity of larch plantation in county forest area of Heilongjiang Province. Plant Res. (4), 597–603. doi:10.7525/j.issn.1673-5102.2015.04.019
Jun, W. Y., Guan, J. H., Lei, D., Zhang, J. G., Li, G. Q., and Du, S. (2018). Allocation pattern and accumulation potential of carbon stock in natural spruce forests in northwest China. PeerJ 6, e4859. doi:10.7717/peerj.4859
Justine, M. F., Yang, W., Wu, F., and Khan, M. N. (2017). Dynamics of biomass and carbon sequestration across a chronosequence of masson pine plantations. Biogeosciences 122 (3), 578–591. doi:10.1002/2016JG003619
Keenan, R. J., Reams, G. A., Achard, F., de Freitas, J. V., Grainger, A., and Lindquist, E. (2015). Dynamics of global forest area: results from the FAO global forest resources Assessment 2015. For. Ecol. Manag. 352, 9–20. doi:10.1016/j.foreco.2015.06.014
Li, Y., Li, D. W., and Han, D. C. (2014). Population dynamics of Qinghai spruce on the eastern slope of helan mountain. J. Zhejiang A F Univ. 31 (001), 50–56. doi:10.11833/j.issn.2095-0756.2014.01.008
Li, Y., Tang, Y., and Tang, J. (2019). Carbon storage characteristics of four mixed young artificial forest ecosystems in the subtropical zone of Central Asia. J. Central South Univ. For. & Technol. 39 (5), 56–62. doi:10.14067/j.cnki.1673-923x.2019.05.009
Li, Z. T., Zhan, L. J., Liang, Y., Ge, Z. Q., Cao, Z. F., Du, Z. Y., et al. (2022). Leaf stoichiometric characteristics of Japanese red pine forest inShandong Province and their correlation with stand characteristics and soil nutrients. Chin. Agric. Sci. Bull. 22, 20–30. doi:10.11924/j.issn.1000-6850.casb2021-0772
Liu, C. L. C., Kuchma, O., and Krutovsky, K. V. (2018). Mixed-species versus monocultures in plantation forestry: development, benefits, ecosystem services and perspectives for the future. Glob. Ecol. conservation 15, e00419. doi:10.1016/j.gecco.2018.e00419
Liu, G. C., Chen, S. X., Wang, Z. C., Zhang, L. L., and Du, A. P. (2016). Carbon storage and distribution pattern of Eucalyptus grandis plantation under three land preparation measures. Bot. Guangxi. 36 (7), 9. doi:10.11931/guihaia.gxzw201502016
Liu, G. C., Chen, S. X., Whang, Z. C., Zhang, L. L., and Du, A. P. (2016). Carbon storage and distribution pattern of Eucalyptus grandis plantation under three land preparation measures. Guangxi Bot. 36, 768–775+858. doi:10.11931/guihaia.gxzw201502016
Liu, J. G., Gou, X. H., Zhang, F., Bian, R., and Yin, D. C. (2021). Spatial patterns in the C: N: P stoichiometry in Qinghai spruce and the soil across the Qilian Mountains, China. Catena 196, 104814. doi:10.1016/j.catena.2020.104814
Liu, X. M., Wang, C., Gao, J. X., Yuan, J. F., Huang, Y., and Wang, B. (2023). Approaches to carbon sequestration in China's planted forest ecosystems serving the dual carbon goal. Acta Ecol. Sin. 43, 5662–5673. doi:10.5846/stxb202206221770
Lu, D. (2024). Characteristics of soil nutrients and carbon storage in Eucalyptus plantations of different ages. Hortic. & Seedlings 25, 9–11. doi:10.16530/j.cnki.cn21-1574/s.2024.06.003
Ma, X. Y., Gong, L., Zhu, H. Q., Zhang, T., Yin, K. J., and Lu, X. Y. (2023). Effects of different carbon inputs on soil stoichiometry in Tianshan mountains. Huan Jing ke Xue= Huanjing Kexue 44 (5), 2715–2723. doi:10.13227/j.hjkx.202204063
Manson, D. G., Schmidt, S., Bristow, M., Erskine, P. D., and Vanclay, J. K. (2013). Species-site matching in mixed species plantations of native trees in tropical Australia. Agrofor. Syst. 87, 233–250. doi:10.1007/s10457-012-9538-0
Ming, A. G., Jia, H. Y., Zhao, J. L., Tao, Y., and Li, Y. F. (2014). Above-and below-ground carbon stocks in an indigenous tree (Mytilaria laosensis) plantation chronosequence in subtropical China. PLoS One 9, e109730. doi:10.1371/journal.pone.0109730
Nilsen, P., and Strand, L. T. (2013). Carbon stores and fluxes in even-and uneven-aged Norway spruce stands. Silva Fenn. 47 (4). doi:10.14214/sf.1024
Pan, Y., Birdsey, R. A., Fang, J., Houghton, R., Kauppi, P. E., Kurz, W. A., et al. (2011). A large and persistent carbon sink in the world’s forests. Science 333 (6045), 988–993. doi:10.1126/science.1201609
Peng, S., Zhao, C., Zheng, X., Xu, Z., and He, L. (2011). Spatial distribution characteristics of biomass and carbon storage of Picea crassifolia forests in the Qilian Mountains. Chin. J. Appl. Ecol. 22 (7), 1689–1694. doi:10.13287/j.1001-9332.2011.0240
Pregitzer, K. S., and Euskirchen, E. S. (2004). Carbon cycling and storage in world forests: biome patterns related to forest age. Glob. change Biol. 10 (12), 2052–2077. doi:10.1111/j.1365-2486.2004.00866.x
Redondo-Brenes, A. (2007). Growth, carbon sequestration, and management of native tree plantations in humid regions of Costa Rica. New For. 34, 253–268. doi:10.1007/s11056-007-9052-9
Redondo-Brenes, A., and Montagnini, F. (2006). Growth, productivity, aboveground biomass, and carbon sequestration of pure and mixed native tree plantations in the Caribbean lowlands of Costa Rica. For. Ecol. Manag. 232 (1-3), 168–178. doi:10.1016/j.foreco.2006.05.067
Rodríguez-Loinaz, G., Amezaga, I., and Onaindia, M. (2013). Use of native species to improve carbon sequestration and contribute towards solving the environmental problems of the timberlands in Biscay, northern Spain. J. Environ. Manag. 120, 18–26. doi:10.1016/j.jenvman.2013.01.032
Singh, S., Dixit, B., and Chandrakar, S. (2024). A review on soil microbial biomass carbon in relation to pure or Monospecific and mixed tree stand.
Truax, B., Fortier, J., Gagnon, D., and Lambert, F. (2018). Planting density and site effects on stem dimensions, stand productivity, biomass partitioning, carbon stocks and soil nutrient supply in hybrid poplar plantations. Forests 9 (6), 293. doi:10.3390/f9060293
Wan, Y. F., Yu, P. T., Li, X. Q., Wang, Y. H., Wang, B., Yu, Y. P., et al. (2022). Divergent seasonal patterns of Qinghai spruce growth with elevation in northwestern China. Forests 13 (3), 388. doi:10.3390/f13030388
Wang, B., Chen, T., Li, C. J., Xu, G. B., Wu, G. J., and Liu, G. X. (2020). Radial growth of Qinghai spruce (Picea crassifolia Kom.) and its leading influencing climate factor varied along a moisture gradient. For. Ecol. Manag. 476, 118474. doi:10.1016/j.foreco.2020.118474
Wang, B., Chen, T., Wu, G. J., Xu, G. B., Zhang, Y. F., Gao, H. N., et al. (2016). Qinghai spruce (Picea crassifolia) growth–climate response between lower and upper elevation gradient limits: a case study along a consistent slope in the mid-Qilian Mountains region. Environ. Earth Sci. 75, 236–316. doi:10.1007/s12665-015-4930-5
Wang, B., Chen, T., Xu, G. B., Liu, X. H., Wang, W. Z., Wu, G. J., et al. (2016). Alpine timberline population dynamics under climate change: a comparison between Qilian juniper and Qinghai spruce tree species in the middle Qilian Mountains of northeast Tibetan Plateau. Boreas 45 (3), 411–422. doi:10.1111/bor.12161
Wang, G. X., Qian, J., Cheng, G. D., and Lai, Y. M. (2002). Soil organic carbon pool of grassland soils on the Qinghai-Tibetan Plateau and its global implication. Sci. Total Environ. 291, 207–217. doi:10.1016/S0048-9697(01)01100-7
Wang, Q. K., Wang, S. L., and Zhong, M. C. (2013). Ecosystem carbon storage and soil organic carbon stability in pure and mixed stands of Cunninghamia lanceolata and Michelia macclurei. Plant Soil 370, 295–304. doi:10.1007/s11104-013-1631-2
Wang, Y., Liu, L., Yue, F., and Li, D. (2019). Dynamics of carbon and nitrogen storage in two typical plantation ecosystems of different stand ages on the Loess Plateau of China. PeerJ 7, e7708. doi:10.7717/peerj.7708
Waring, B., Neumann, M., Prentice, I. C., Adams, M., Smith, P., and Siegert, M. (2020). Forests and decarbonization–roles of natural and planted forests. Front. For. Glob. Change 3, 534891. doi:10.3389/ffgc.2020.00058
Widagdo, F. R. A., Li, F., Xie, L., and Dong, L. (2021). Intra-and inter-species variations in carbon content of 14 major tree species in Northeast China. J. For. Res. 32, 2545–2556. doi:10.1007/s11676-020-01264-x
Wu, J. J., Jiao, L., Zhu, X. L., Che, X. C., Yuan, X., Zhang, K., et al. (2024). Different resource allocation strategies of two dominant conifer species to the heterogeneous environments in the Qinghai-Tibet Plateau. For. Ecol. Manag. 563, 121986. doi:10.1016/j.foreco.2024.121986
Xie, H. H., Wu, Q. G., Hu, J. Y., Yu, L. F., Bie, P. F., Wang, H., et al. (2018). Changes in soil physical and chemical properties during the process of alpine meadow degradation along the Eastern Qinghai-Tibet Plateau. Eurasian Soil Sci. 51, 1440–1446. doi:10.1134/S1064229318130045
Yang, J. L., Liu, X. L., Li, F., Cao, B., and Zhang, W. J. (2018). Study on soil microbial functional diversity in different vegetation restoration models in Liupan Mountain. J. Ecol. Environ. 12, 2193–2199. doi:10.16258/j.cnki.1674-5906.2018.12.003
Yang, W. J., Wang, Y. H., Webb, A. A., Li, Z. Y., Tian, X., Han, Z. T., et al. (2018). Influence of climatic and geographic factors on the spatial distribution of Qinghai spruce forests in the dryland Qilian Mountains of Northwest China. Sci. Total Environ. 612, 1007–1017. doi:10.1016/j.scitotenv.2017.08.180
Yu, H., Wei, T. X., Chen, Y. X., Sha, G. L., Ren, K., Xin, P. C., et al. (2023). Distribution characteristics of soil organic carbon stocks in typical plantations in loess hilly region of northwestern China. J. Beijing For. Univ. 45, 100–107. doi:10.12171/j.1000-1522.20230097
Yu, Z., Wang, K., Li, J., Shangguan, Z., and Deng, L. (2023). Mixed plantations have more soil carbon sequestration benefits than pure plantations in China. For. Ecol. Manag. 529, 120654. doi:10.1016/j.foreco.2022.120654
Zeng, K., Huang, X., Guo, J., Dai, C., He, C., Chen, H., et al. (2024). Microbial-driven mechanisms for the effects of heavy metals on soil organic carbon storage: a global analysis. Environ. Int. 184, 108467. doi:10.1016/j.envint.2024.108467
Zhai, J. Y., Zhou, H. K., Wu, Y., Wang, G., and Xue, S. (2024). Effect of nitrogen and Phosphorus on soil enzyme Activities and organic carbon stability in Qinghai–Tibet plateau. Agronomy 14, 1376. doi:10.3390/agronomy14071376
Zhang, J., Shen, X., Wang, Y., Jiang, M., and Lu, X. (2021). Effects of Forest changes on summer surface temperature in Changbai Mountain, China. Forests 12 (11), 1551. doi:10.3390/f12111551
Zhang, L., Wang, Y., Zhao, Y., Zheng, Z., and Shen, H. (2021). Carbon storage and allocation patterns in chestnut forests of different ages on the southern slope of Yanshan Mountains. J. Hebei Agric. Univ. 44 (2), 79–85. doi:10.13320/j.cnki.jauh.2021.0029
Zhang, S. J., Xiang, W. H., and Xu, G. L. (2009). Distribution of soil active organic carbon and its carbon pool management index in Chinese fir forest under different regeneration methods. J. soil water conservation 23, 213–217. doi:10.13870/j.cnki.stbcxb.2009.04.050
Zhang, Z., Guo, J. B., Wang, Y. H., Yu, P., and Wang, X. (2021). Variation of soil organic carbon density with plantation age and initial vegetation types in the Liupan mountains areas of Northwest China. Forests 12, 1811. doi:10.3390/f12121811
Zhao, H., Xu, E., Lv, D., Wang, Y. X., Zhao, X. P., Wei, N., et al. (2024). Discrepancies and evaluation of Needle-leaf and Tracheid Traits of Qinhai spruce in Qilian mountains, northwest China. Forests 15, 960. doi:10.3390/f15060960
Keywords: Qilian mountains, Picea crassifolia, carbon storage, mixed planting patterns, ecosystem stratification
Citation: Shangguan Y, Zhao H, Zhang Z, Xu E, Lv D, Wang Y, Zhao X, Wei N, Chen G, Liu J, Wei X, Gao Z and Liu M (2025) Carbon storage and sequestration of five planting patterns of Picea crassifolia plantations in Qilian mountains. Front. Earth Sci. 13:1560899. doi: 10.3389/feart.2025.1560899
Received: 15 January 2025; Accepted: 17 March 2025;
Published: 01 April 2025.
Edited by:
Ji Liu, Institute of Earth Environment, Chinese Academy of Sciences (CAS), ChinaReviewed by:
Xiangjin Shen, Key Laboratory of Wetland Ecology and Environment, Northeast Institute of Geography and Agroecology, Chinese Academy of Sciences (CAS), ChinaYun Chen, Yunnan Normal University, China
Copyright © 2025 Shangguan, Zhao, Zhang, Xu, Lv, Wang, Zhao, Wei, Chen, Liu, Wei, Gao and Liu. This is an open-access article distributed under the terms of the Creative Commons Attribution License (CC BY). The use, distribution or reproduction in other forums is permitted, provided the original author(s) and the copyright owner(s) are credited and that the original publication in this journal is cited, in accordance with accepted academic practice. No use, distribution or reproduction is permitted which does not comply with these terms.
*Correspondence: Hu Zhao, emhhb2h1MTk5MDEwMDZAMTYzLmNvbQ==; Zhengzhong Zhang, emhhbmd6aGVuZ3pAZ3NhdS5lZHUuY24=