 Tatsu Kuwatani
 Shotaro Akaho
 Kengo Nakamura
 Takeshi Komai5
94% of researchers rate our articles as excellent or good
Learn more about the work of our research integrity team to safeguard the quality of each article we publish.
Find out more
ORIGINAL RESEARCH article
Front. Earth Sci., 07 April 2025
Sec. Geochemistry
Volume 13 - 2025 | https://doi.org/10.3389/feart.2025.1559321
This article is part of the Research TopicAdvanced Methods for Interpreting Geological and Geophysical Data Volume IIView all 3 articles
Matrix factorization techniques, such as principal component analysis (PCA) and independent component analysis (ICA), are widely used to extract geological processes from geochemical data. However, their effectiveness in accurately identifying geological processes remains uncertain due to the heuristic nature of these methods. This study introduces a synthetic data-based framework to evaluate the validity of matrix factorization for geochemical process extraction. By constructing a forward model that simulates geochemical weathering, we generated synthetic datasets replicating real-world geochemical compositions, incorporating both the elemental leaching during fluid-rock interactions and the compositional heterogeneity of the original rocks. These datasets were analyzed using PCA and ICA, with preprocessing steps that included standardization and log-ratio transformation to address the challenges posed by compositional data. The results indicate that PCA and ICA effectively extracted the two key geological processes -elemental leaching and original rock heterogeneity-from the synthetic datasets. Among these methods, ICA combined with log-ratio transformation provided the most accurate separation of independent geochemical processes, particularly under ideal conditions with sufficient samples. To quantitatively validate the extracted basis vectors, we estimated elemental mobility parameters during weathering and compared them with known values in the synthetic dataset, demonstrating the applicability of our approach in quantifying geological processes. This study highlights the advantages of a bilateral approach that integrates forward modeling and inversion analysis to enhance the reliability of geochemical process interpretation. The proposed framework offers a systematic methodology for identifying and quantifying underlying geological processes from high-dimensional geochemical data, with potential applications in geochemistry, environmental science, and resource exploration.
Geological processes are critical in shaping the Earth’s surface, influencing natural resource distribution, environmental stability, and ecosystem dynamics. For example, chemical weathering is a key process in soil formation, substantially impacting Earth’s surface dynamics and regional geological history (e.g., Bland and Rolls, 2016). Understanding weathering is crucial for assessing environmental issues, such as heavy metal contamination in soils and tracking element distribution in geological processes from engineering and scientific perspectives. However, advanced analytical methods are required to interpret the underlying patterns due to the complexity of these processes and the presence of multiple overlapping processes.
Matrix factorization, or matrix decomposition, is a vital inversion method for extracting geological processes from geochemical data. Various matrix factorization methods have been applied to the geochemical datasets of soil as well as sedimentary, igneous, and metamorphic rocks. These include principal component analysis (PCA) (e.g., Kuwatani et al., 2014; Ueki and Iwamori, 2017; Nakamura et al., 2018; Nishio et al., 2022; Chen et al., 2024; Zhao et al., 2024), independent component analysis (ICA) (e.g., Iwamori and Albarède, 2008; Yasukawa et al., 2016; Miki et al., 2025), non-negative matrix decomposition (e.g., Yoshida et al., 2018; Zekri et al., 2019), and other sophisticated methods (e.g., Liu et al., 2016; Liu et al., 2019). Moreover, in matrix factorization, the factors responsible for controlling the compositional variability of rocks are considered to be separable, with each attributed to a different geological process (e.g., Le Maitre, 1982; Davis and Sampson, 1986).
Although matrix factorization is effective in practical geochemical analyses, it is heuristic, relying on empirical insights, and exploratory, seeking to uncover underlying patterns: it remains unclear how these methods extract relevant processes or which method is the most effective. Moreover, interpreting the obtained basis vector is a qualitative procedure that relies on the intuition and experience of researchers. Furthermore, it is difficult to evaluate whether these methods appropriately extract geological processes as basis vectors, as they are typically applied to real-world geochemical datasets in which verifying the true geological processes is nearly impossible in many cases.
The only quantitative method for verifying the effectiveness of an inverse analysis technique is synthetic-data analysis. In this approach, synthetic observation data that mimics real-world physical processes are generated and used to examine whether the original processes and parameters can be reconstructed. Although this framework is common in mathematical sciences, it has rarely been applied in Earth-material-science fields such as geochemistry and geology, with a few notable exceptions (e.g., Yang and Cheng, 2015).
This study aims 1) to introduce a framework that integrates forward modeling and inversion analysis to assess the effectiveness of matrix decomposition in geochemical-process extraction and 2) to demonstrate that PCA and ICA can separate and extract geological processes from the synthetic chemical compositional data of weathered rocks. In the following sections, a forward model simulating the chemical weathering of rocks is constructed, and a synthetic dataset is generated in Section 2.1. Next, the fundamental concepts and mathematical procedures of matrix factorization as an inversion analysis technique for geochemical process extraction are explained in Section 2.2. Thereafter, PCA and ICA are applied to the synthetic data, and their effectiveness is verified by comparing the results with those of the assumed true model and its parameters in Section 3. It is important to note that our objective is not solely to demonstrate the effectiveness of PCA and ICA for general geochemical weathering problems; instead, we aim to present a framework for assessing effectiveness in a specific case study. In the discussion section, we provide a quantitative interpretation of the extracted basis vectors, compare the performance of PCA and ICA, discuss applications to real-world datasets, and propose integrated bilateral approaches for addressing complex geochemical processes.
By constructing a forward model of geochemical weathering, we can generate synthetic data that simulate the chemical composition of weathered rocks in natural systems. The factors controlling chemical composition are assumed to consist of two primary processes: 1) leaching, which results from chemical interactions between water and rock, and 2) the compositional heterogeneity of the original rock. Limiting the analysis to these two processes enables a simplified yet effective modeling and evaluation framework, ensuring that the results remain comprehensible and visually intuitive.
Although this assumption is simplified, it captures the fundamental processes necessary for extracting information about chemical weathering from geochemical datasets. Furthermore, the constructed forward model is a generalized framework for understanding elemental migration within geological materials. Given its foundation in geochemical mass transfer, this approach broadly applies to other geological processes, such as hydrothermal alteration, sediment diagenesis, and magmatic differentiation, all involving element mobility under varying physicochemical conditions.
The chemical composition of an altered sample is assumed to result from the elemental leaching of a fresh, original rock. Parameters related to element mobility during leaching are introduced following Anderson and Hawkes (1958) and Ichikuni (1992). For element
where
In general,
If the original rock sample reacts with water and undergoes weathering, the mass-conservation law of the closed system can be expressed as:
where
where
Figure 1 illustrates the chemical composition changes in the altered samples as a function of the water amount
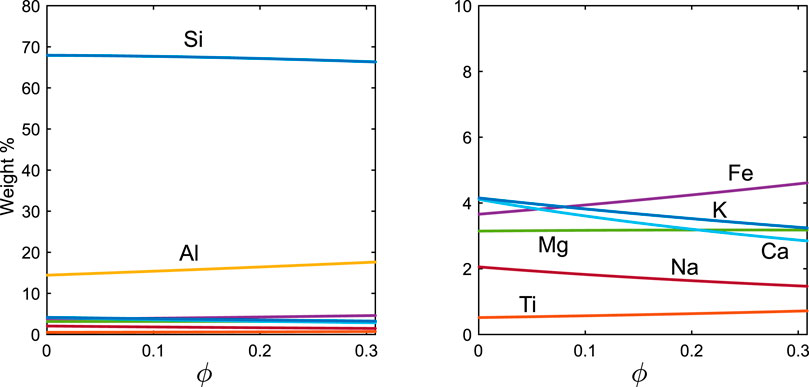
Figure 1. Compositional changes in weathered rock due to the leaching process. The right panel provides a magnified view of the left panel. Elemental symbols for cations, such as ‘Si’, represent their corresponding oxides (e.g., Si refers to
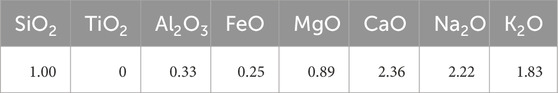
Table 1. Relative mobility of element
The compositional heterogeneity of original rocks can be modeled as follows:
where
where
In this study, the chemical compositions of 1,000 synthetic weathered rocks are generated by randomly varying the amount of water
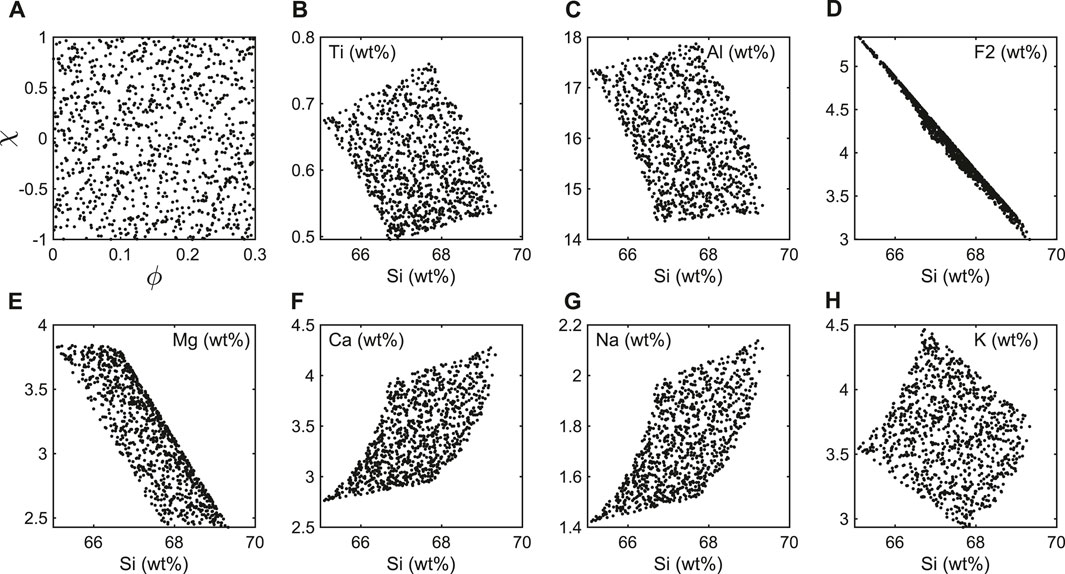
Figure 2. (A) Distribution of the assumed true parameters
In this study, we analyze this synthetic dataset using matrix factorization methods. However, when applying our model to other practical problems, it is essential to appropriately adjust parameters and refine the weathering model to account for various geological environments and weathering processes. The synthetic dataset has been uploaded as a CSV file in the Supplementary Materials.
In the inversion analysis, geological processes are extracted from the synthetic dataset using matrix factorization. By doing so, we can evaluate the effectiveness of the proposed method by comparing the extracted processes and their intensities with the assumed ones. In this study, we use PCA, the most widely representative matrix-factorization method and widely used in geochemistry (e.g., Le Maitre, 1982; Ueki and Iwamori, 2017), and ICA, a more sophisticated technique commonly employed for geochemical-process extraction (e.g., Iwamori and Albarède, 2008; Yasukawa et al., 2016; Akamatsu et al., 2025). Figure 3 shows the flowchart of the inversion analysis.
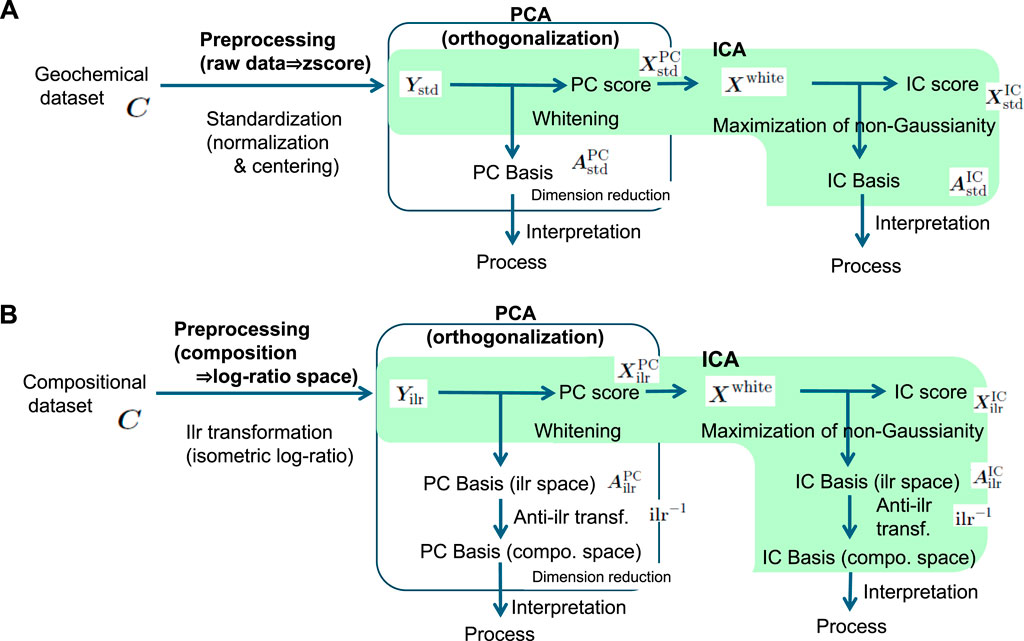
Figure 3. Flow charts of PCA and ICA analyses using two data preprocessing methods: (A) standardization and (B) isometric log-ratio (ilr) transformation.
Geochemical data for a sample, represented as the vector
where the vector
where the
The obtained vector
Since the observational dataset consists of chemical-composition data, isotopic ratios, or other chemical properties, the value range of each element may vary substantially—sometimes by several orders of magnitude. Additionally, when using chemical-composition data, the constant-sum constraint complicates rigorous quantitative statistical analysis in Euclidean space (Aitchison, 1986; Filzmoser et al., 2018). Therefore, appropriate data preprocessing is crucial for maximizing the extraction of meaningful information from high-dimensional datasets.
In this study, we employ two representative data preprocessing methods: standardization and log-ratio transformation. Standardization is a widely used normalization technique that adjusts the distribution of each dimension to have a mean of 0 and a variance of 1, ensuring equal treatment of all dimensions regardless of their value ranges. Its main advantage lies in its simplicity, as it involves an interpretable and computationally efficient linear transformation. However, a key drawback is the introduction of pseudo-correlation due to the constant-sum constraint. The log-ratio transformation maps compositional data to Euclidean space, addressing the constant-sum constraint and enabling the application of statistical methods based on Euclid geometry (e.g., Aitchison, 1986; Pawlowsky-Glahn et al., 2015; Filzmoser et al., 2018). Log-ratio transformations are commonly used as preprocessing steps for matrix decomposition techniques such as PCA and ICA (e.g., von Eynatten et al., 2003; von Eynatten, 2004; Ohta and Arai, 2007; Filzmoser et al., 2009) Among the family of log-ratio transformation methods, such as additive log-ratio (alr) and centered log-ratio (clr) transformations (Aitchison, 1986), we adopt the isometric log-ratio (ilr) transformation, proposed by Egozcue et al. (2003). The ilr transformation provides a bijection mapping from a simplex to real space, preserving distances through isometric mapping. This allows compositional data in the simplex to be transformed into an orthogonal basis in Euclidean space, making it highly suitable for Euclidean-based data analysis. However, the ilr transformation has a limitation—low interpretability—since transformed values cannot be intuitively understood. We always perform an inverse transformation after matrix decomposition to present the results in the original compositional space to address this.
The main features of PCA and ICA are outlined below. For detailed descriptions of each method, please refer to the existing literature (e.g., Hyvärinen and Oja, 2000; Hyvärinen, 2001; Ueki and Iwamori, 2017; Iwamori et al., 2017). On one hand, PCA decomposes the matrix
First, data preprocessing is performed on a geochemical dataset
where
In contrast, compositional data are subject to a constant-sum constraint, which induces spurious correlations and dependencies among components, complicating statistical analyses. The ilr transformation is applied to address this issue. This transformation maps compositional data from the constrained simplex space to the unconstrained Euclidean space, enabling the use of standard statistical methods (Egozcue et al., 2003). The ilr transformation for compositional data is given by:
where the operator
If
PCA is based on the singular value decomposition of the variance-covariance matrix of the dataset,
where
where
where the subscripts
ICA requires whitening, a preprocessing step that ensures the variables are uncorrelated and have equal magnitudes before determining the independent component (IC) vectors. Whitening is achieved using matrices obtained from PCA, as follows:
where
ICA determines the mixing matrix
where
Since the vectors in the whitened space are not directly interpretable, we transform them back to the real space. Using Equations 12, 14, 16, we obtain:
If we define
Since values in the ilr-transformed space are not directly interpretable, the obtained matrices must be inverse-transformed to the original compositional space for process interpretation.
where the constituents of
We apply PCA and ICA to the synthetic compositional data generated in Section 2.1. Figures 4A, B show the eigenvalues of each PC vector obtained using standardization and ilr transformation, respectively. These eigenvalues indicate the proportion of variance explained by each PC vector in the high-dimensional dataset. In both cases, only two PC vectors can explain most of the compositional variation in the eight-dimensional compositional space. In contrast, real-world datasets often exhibit a gradual decrease in eigenvalues across all dimensions. This indicates that the number of processes initially assumed in the forward model has been successfully reconstructed.
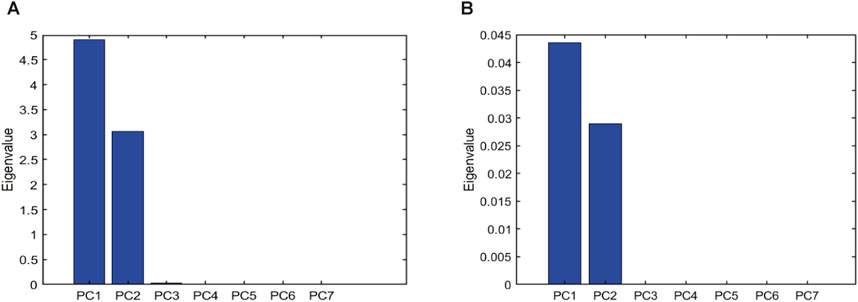
Figure 4. Eigenvalues of PC vectors representing data variance. (A) Standardization. (B) Ilr transformation.
Figure 5 presents the basis vector obtained by PCA and ICA, from which we can infer correlations among the elements. Since the order of the basis vectors obtained by ICA (i.e., IC1, IC2) is arbitrary, we rearrange them to match the PC vectors (i.e., PC1, PC2) in this study. Regarding standardization (Figure 5A), the loading of
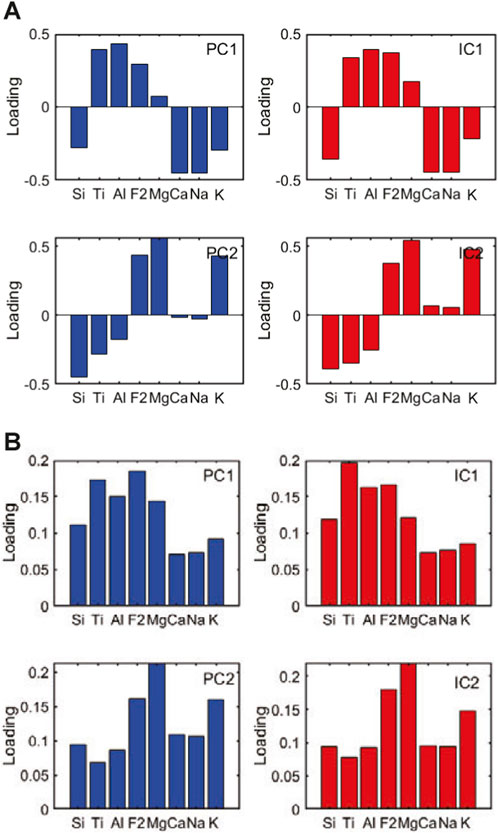
Figure 5. Basis vectors extracted by PCA (blue bars) and ICA (red bars) in the cases of (A) standardization and (B) ilr transformation. The order of IC vectors has been rearranged to match the PC vectors.
Figure 6 presents the distributions of PC and IC scores, representing the intensity of PC and IC vectors for each sample. For both standardization and ilr transformation methods (Figures 6A, B), the distribution of PC scores appears as a rotated and distorted rectangle, resulting from the orthogonal transformation. This shape’s longer and shorter sides align with the PC1 and PC2 axes, respectively, visually confirming that PCA effectively captures the directions of maximum variance in the data. In contrast, the IC score distributions form an approximate square with sides nearly perpendicular to the IC axes, indicating that ICA successfully extracts statistically independent components.
Figure 7 presents the PC and IC vectors and sample data points in the actual compositional space. For both standardization and ilr transformation methods, the direction of PC and IC vectors is generally consistent with the compositional variation caused by the leaching process and the heterogeneity of the original rock composition. The score distributions (Figure 6) and the vector direction in actual compositional space (Figure 7) indicate that the two key basis vectors have been successfully extracted from the high-dimensional compositional dataset. Notably, the shape of IC vectors in the ilr transformation method (Figure 7B) aligns accurately with each element’s external boundaries of sample distributions. This indicates that ICA with ilr transformation achieves high accuracy in geological process extraction.
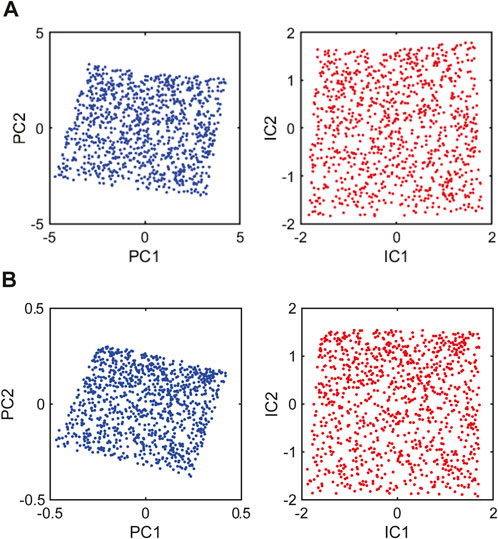
Figure 6. Distributions of scores
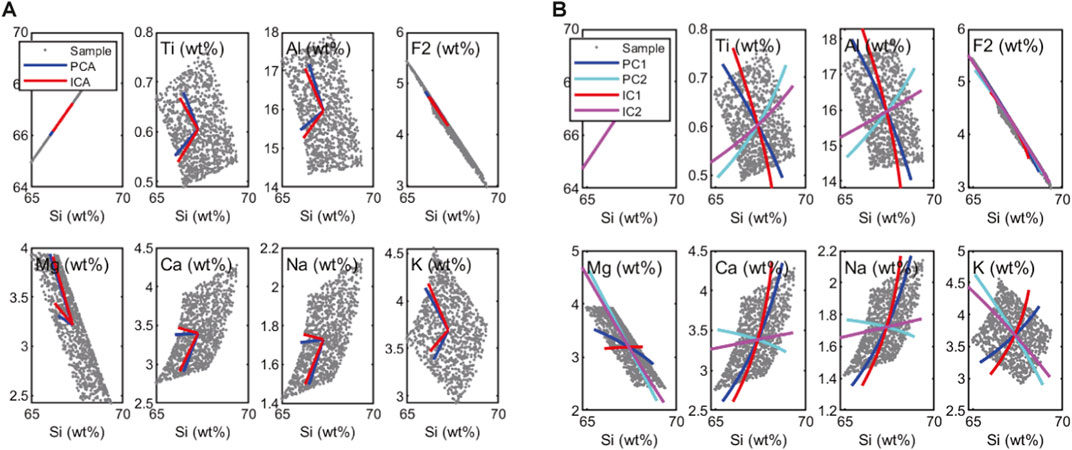
Figure 7. Extracted PC and basis vectors in the actual compositional space. (A) Standardization: Red and blue lines represent PC and IC vectors, respectively. (B) Ilr transformation: Red, magenta, blue, and light blue lines represent PC1, PC2, IC1, and IC2 vectors. The starting points are set to the average compositions, and the length of each vector is scaled to three times the unit vector for better visualization.
Figure 8 illustrates the scatter plots showing a correlation between PC/IC scores and the variation of the assumed true parameters. For both standardization and ilr transformation, PC1 and IC1 scores exhibit strong positive correlations with the leaching process
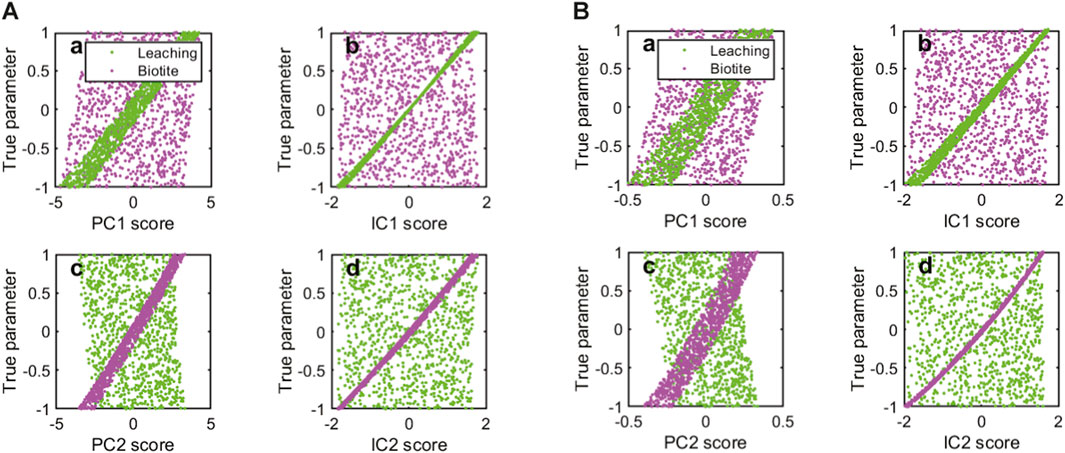
Figure 8. Scatter plots between PC/IC scores and assumed true parameters for (A) standardization and (B) ilr transformation methods. Bold letters a, b, c, and d indicate PC1, IC1, PC2, and IC2, respectively. Green points represent the intensity of the leaching process, while red points represent the intensity of the biotite mode. The values of the true parameters are normalized from −1 to 1.
In the previous section, we validated our method by comparing estimates with assumed true values. However, we must infer geological processes from the estimated results when analyzing real-world (natural) datasets where true processes are unknown. Multi-element correlations, derived from the composition vector’s shape (Figure 5), play a crucial role in this inference.
For instance, in the standardized preprocessing, PC1 and IC1 exhibit a strong inverse correlation between
Vector directions further aid interpretation compared with sample datasets in chemical composition spaces, such as Harker diagrams (Figure 7). Additionally, analyzing the spatial distribution of ICA and PCA scores, in combination with existing geological knowledge, enhances our understanding of natural samples.
If the corresponding processes can be inferred, constructing a forward model allows for quantitative insights into these processes. For example, if the leaching model (Equation 3) aligns with the extracted basis vectors, we can estimate the elemental mobility parameters,
where
In general, the total mass change ratio
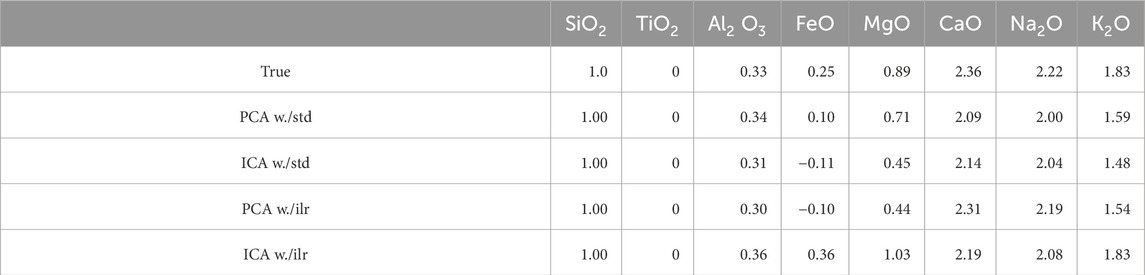
Table 2. Relative mobility of element
Process extraction has been found to be generally feasible for the synthetic data generated in Section 2.1, using both PCA and ICA, with standardization and ilr transformation as preprocessing methods. This implies that the conditions—such as sample size and assumed parameters—are optimal for PCA and ICA. Here, we examine the differences between PCA and ICA, employing the ilr transformation, a standard method for handling compositional data. Each method has its advantages and disadvantages, depending on the problem settings. Since synthetic-data tests allow for arbitrary modifications to problem settings, it is possible to evaluate and compare the performances of different methods under specific assumed conditions.
Figure 9 presents the relationship between the assumed parameters,
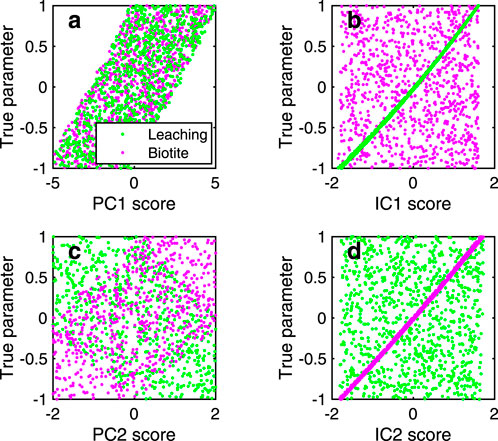
Figure 9. Scatter plots between PC/IC scores and assumed true parameters with the ilr transformation. Bold letters (a–d) indicate PC1, IC1, PC2, and IC2, respectively. The values of the true parameters are normalized from −1 to 1.
Figure 10 illustrates the case using only 15 samples from the synthetic data in Section 2.1. In Figures 10a, b, the data points align approximately along a straight line, indicating that each process and its corresponding PC score exhibit a strong correlation. This suggests that PCA successfully captures the relationships between the extracted components and the true geological processes. No clear alignment is observed in Figures 10b, d, indicating that the correlation between each process and its corresponding IC score is weak. This indicates that ICA struggles to extract meaningful components when the sample size is small. In general, ICA requires a larger sample size because it relies on the distribution pattern of data to extract independent components. In contrast, PCA depends on fewer statistical parameters related to correlation.
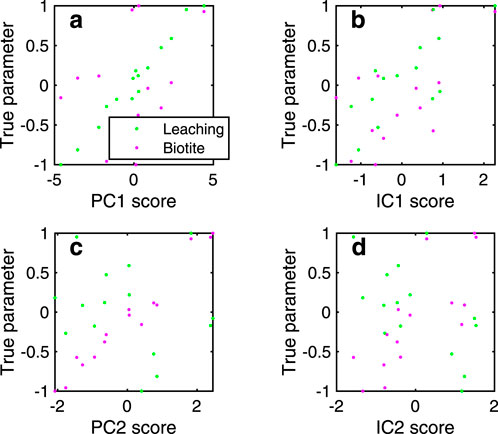
Figure 10. Scatter plots between PC/IC scores and assumed true parameters with the ilr transformation. Bold letters (a–d) indicate PC1, IC1, PC2, and IC2, respectively. The values of the true parameters are normalized from −1 to 1.
This highlights the robustness of PCA in small-sample scenarios, where PCA scores maintain a reasonable correlation with the true parameters, while ICA performance deteriorates.
While PCA demonstrates robustness in small-sample scenarios, it has a notable limitation: its tendency to extract mixed processes, mainly when their intensities are similar or overlapping. Conversely, despite its higher accuracy in process separation, ICA requires a sufficient number of samples for reliable results. These findings underscore the importance of selecting an appropriate matrix factorization method based on sample size constraints and the nature of the dataset.
While our previous discussion focused on synthetic data, real-world datasets often exhibit sample size, noise levels, and complexity variability. As noted earlier, ICA is generally effective for process extraction under ideal conditions with sufficient samples. However, in practical geochemical problems, where samples are limited and noise levels are higher, PCA demonstrates robustness and efficacy in process extraction. As illustrated in Figure 3, PCA can be a preliminary step to ICA analysis. Therefore, when analyzing real-world data, it is advisable to examine the robust results of PCA before proceeding with ICA.
In this study, we have focused on PCA and ICA; however, depending on the specific problem, other matrix factorization methods may also be effective. These include non-negative matrix factorization (NMF) (Lee and Seung, 2000) and positive matrix factorization (PMF) (Paatero and Tapper, 1994). These methods directly estimate end-members and their contributions, making them particularly useful in geochemical and environmental science applications (Yoshida et al., 2018; Yazman et al., 2024). To understand the advantages and disadvantages of each method, conducting synthetic-data experiments that simulate real-world conditions is a critical approach.
Real geochemical datasets often contain zero or negative values and missing data due to detection limits of analytical methods, measurement noise, or unmeasured elements. Log-ratio transformation methods cannot directly handle data with zeros or negative values. In such cases, common approaches include substituting small positive values and employing statistical imputation methods. However, applying log-ratio transformations to such data can introduce substantial bias, and in some cases, standardization may be a more appropriate approach. Given these considerations, while log-ratio transformations are valuable, it is essential to be aware of their limitations and carefully assess whether they are suitable for a given dataset.
In real-world data analysis, different problem settings must be considered: in some cases, the geological process may be partially known, while in others, it may be completely unknown before analysis. When prior knowledge about geological processes is available, synthetic data analysis can be beneficial by constructing a simple forward model. This approach clarifies the characteristics of the matrix-factorization method and the basis-vector structure of the geological processes under study. Such insights are highly valuable for evaluating the validity of natural data analysis and enhancing geological interpretation of the obtained results.
If the geological process is entirely unknown, matrix factorization is performed for exploratory purposes. In this case, synthetic-data analysis remains essential for assessing the effectiveness of the matrix-factorization method in inversion analysis. Accordingly, synthetic data are generated using a forward model, which is constructed based on the extracted processes from natural datasets.
By iterating these steps, forward modeling and inversion methods are continuously redefined and improved, enabling better representation of complex geological processes. This systematic bilateral approach (Figure 11), which integrates both data-driven and model-driven methodologies, provides a fundamental framework for geochemical process extraction and interpretation.
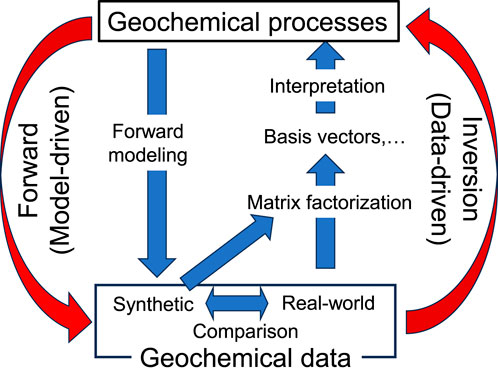
Figure 11. Schematic diagram of the geochemical process extraction framework using forward modeling and inversion analysis.
This study proposed a framework to evaluate the effectiveness of matrix factorization techniques in extracting geological processes from geochemical data. To achieve this, we constructed a forward model of chemical weathering that incorporates both the leaching process and the compositional heterogeneity of original rocks. Using this model, we generated synthetic datasets that simulate natural geochemical variations.
We applied PCA and ICA to these synthetic datasets and examined their performance, separating independent geochemical processes. In doing so, we introduced and evaluated two representative preprocessing methods: z-score standardization and log-ratio transformation. The results showed that ICA, combined with log-ratio transformation, was particularly effective in accurately identifying independent geochemical processes under ideal conditions with sufficient samples. At the same time, PCA demonstrated robustness, making it a valuable approach for analyzing datasets with limited sample sizes.
Furthermore, we quantitatively validated the extracted basis vectors by estimating elemental mobility parameters, confirming that matrix factorization can provide qualitative insights and quantitative interpretations of geochemical processes. This study provides a structured approach to evaluating geochemical data interpretation by integrating forward modeling with inversion analysis. The proposed bilateral framework offers a systematic methodology applicable to real-world geological and environmental studies, serving as a robust tool for extracting and interpreting complex geochemical processes.
The raw data supporting the conclusions of this article will be made available by the authors, without undue reservation.
TK: Conceptualization, Data curation, Formal Analysis, Funding acquisition, Investigation, Methodology, Visualization, Writing–original draft. SA: Conceptualization, Methodology, Writing–review and editing. KN: Data curation, Investigation, Validation, Writing–review and editing. TK: Funding acquisition, Investigation, Project administration, Supervision, Writing–review and editing.
The author(s) declare that financial support was received for the research and/or publication of this article. This study was financially supported by JSPS KAKENHI (JP18H03820, JP22K18742). This study was supported by the Cooperative Research Program of the Earthquake Research Institute, the University of Tokyo (ERI JURP 2022-B-06; 2024-B-01).
The authors declare that the research was conducted in the absence of any commercial or financial relationships that could be construed as a potential conflict of interest.
The author(s) declare that Generative AI was used in the creation of this manuscript.
All claims expressed in this article are solely those of the authors and do not necessarily represent those of their affiliated organizations, or those of the publisher, the editors and the reviewers. Any product that may be evaluated in this article, or claim that may be made by its manufacturer, is not guaranteed or endorsed by the publisher.
Aitchison, J. (1986). “The statistical analysis of compositional data,” in Monographs on statistics and applied probability (Springer Netherlands).
Akamatsu, Y., Kuwatani, T., and Oyanagi, R. (2025). Alteration processes of mantle peridotite in the samail ophiolite inferred from independent component analysis of rock physical properties. Lithos 496-497, 107946. doi:10.1016/j.lithos.2025.107946
Anderson, D., and Hawkes, H. (1958). Relative mobility of the common elements in weathering of some schist and granite areas. Geochimica Cosmochimica Acta 14, 204–210. doi:10.1016/0016-7037(58)90079-6
Bland, W. J., and Rolls, D. (2016). Weathering: an introduction to the scientific principles. London, United Kingdom: Routledge.
Chen, J., Zhao, Z., Yang, Y., Li, C., Yin, Y., Zhao, X., et al. (2024). Metallogenic prediction based on fractal theory and machine learning in duobaoshan area, heilongjiang province. Ore Geol. Rev. 168, 106030. doi:10.1016/j.oregeorev.2024.106030
Davis, J. C., and Sampson, R. J. (1986). “Statistics and data analysis in geology,”, 646. New York: Wiley.
Egozcue, J. J., Pawlowsky-Glahn, V., Mateu-Figueras, G., and Barcelo-Vidal, C. (2003). Isometric logratio transformations for compositional data analysis. Math. Geol. 35, 279–300. doi:10.1023/A:1023818214614
Filzmoser, P., Hron, K., and Reimann, C. (2009). Principal component analysis for compositional data with outliers. Environmetrics Official J. Int. Environmetrics Soc. 20, 621–632. doi:10.1002/env.966
Filzmoser, P., Hron, K., and Templ, M. (2018). Applied compositional data analysis. Switzerland: Springer Nature.
Grant, J. A. (1986). The isocon diagram; a simple solution to Gresens’ equation for metasomatic alteration. Econ. Geol. 81, 1976–1982. doi:10.2113/gsecongeo.81.8.1976
Gresens, R. L. (1967). Composition-volume relationships of metasomatism. Chem. Geol. 2, 47–65. doi:10.1016/0009-2541(67)90004-6
Hyvärinen, A. (2001). “Fast ICA by a fixed-point algorithm that maximizes non-gaussianity,” in Independent component analysis: principles and practice 1.
Hyvärinen, A., and Oja, E. (2000). Independent component analysis: algorithms and applications. Neural Netw. 13, 411–430. doi:10.1016/s0893-6080(00)00026-5
Ichikuni, M. (1992). Mobility of elements dusing weathering (in Japanese with English abstract). Clay Sci. (Nendo-Kagaku) 32, 3–7. doi:10.11362/jcssjnendokagaku1961.32.3
Iwamori, H., and Albarède, F. (2008). Decoupled isotopic record of ridge and subduction zone processes in oceanic basalts by independent component analysis. Geochem. Geophys. Geosystems 9. doi:10.1029/2007gc001753
Iwamori, H., Yoshida, K., Nakamura, H., Kuwatani, T., Hamada, M., Haraguchi, S., et al. (2017). Classification of geochemical data based on multivariate statistical analyses: complementary roles of cluster, principal component, and independent component analyses. Geochem. Geophys. Geosystems 18, 994–1012. doi:10.1002/2016gc006663
Kuwatani, T., Nakamura, K., Watanabe, T., Ogawa, Y., and Komai, T. (2014). Evaluation of geochemical characteristics of tsunami deposits by the 2011 off the pacific cost of tohoku Earthquake using dimensionality reduction with a principal component analysis. J. Geogr. ZASSHI 123, 923–935. doi:10.5026/jgeography.123.923
Kuwatani, T., Yoshida, K., Ueki, K., Oyanagi, R., Uno, M., and Akaho, S. (2020). Sparse isocon analysis: a data-driven approach for material transfer estimation. Chem. Geol. 532, 119345. doi:10.1016/j.chemgeo.2019.119345
Lee, D., and Seung, H. S. (2000). Algorithms for non-negative matrix factorization. Adv. neural Inf. Process. Syst. 13. Available online at: https://papers.nips.cc/paper_files/paper/2000/hash/f9d1152547c0bde01830b7e8bd60024c-Abstract.html
Liu, Y., Carranza, E. J. M., Zhou, K., and Xia, Q. (2019). Compositional balance analysis: an elegant method of geochemical pattern recognition and anomaly mapping for mineral exploration. Nat. Resour. Res. 28, 1269–1283. doi:10.1007/s11053-019-09467-8
Liu, Y., Cheng, Q., Zhou, K., Xia, Q., and Wang, X. (2016). Multivariate analysis for geochemical process identification using stream sediment geochemical data: a perspective from compositional data. Geochem. J. 50, 293–314. doi:10.2343/geochemj.2.0415
Miki, Y., Takazawa, E., Ueki, K., and Kuwatani, T. (2025). Variable upper mantle geochemical processes constrained from independent component analysis of the mantle section of the Oman ophiolite. Geochem. Geophy. Geosys. doi:10.1029/2024GC012134
Nakamura, K., Kuwatani, T., Komai, T., and Yamasaki, S.-i. (2018). Extraction of surface soil geochemical characteristics of element concertation by principal component analysis. J. MMIJ 134, 13–21. doi:10.2473/journalofmmij.134.13
Nishio, I., Itano, K., Waterton, P., Tamura, A., Szilas, K., and Morishita, T. (2022). Compositional data analysis (coda) of clinopyroxene from abyssal peridotites. Geochem. Geophys. Geosystems 23, e2022GC010472. doi:10.1029/2022gc010472
Ohta, T., and Arai, H. (2007). Statistical empirical index of chemical weathering in igneous rocks: a new tool for evaluating the degree of weathering. Chem. Geol. 240, 280–297. doi:10.1016/j.chemgeo.2007.02.017
Paatero, P., and Tapper, U. (1994). Positive matrix factorization: a non-negative factor model with optimal utilization of error estimates of data values. Environmetrics 5, 111–126. doi:10.1002/env.3170050203
Pawlowsky-Glahn, V., Egozcue, J. J., and Tolosana-Delgado, R. (2015). Modeling and analysis of compositional data. John Wiley and Sons.
Takahashi, Y., and Arakawa, Y. (1988). Petrochemistry of the granitic rocks in the tsukuba area. J. MINERALOGY, PETROLOGY Econ. Geol. 83, 203–209. doi:10.2465/ganko.83.203
Ueki, K., and Iwamori, H. (2017). Geochemical differentiation processes for arc magma of the Sengan volcanic cluster, Northeastern Japan, constrained from principal component analysis. Lithos 290, 60–75. doi:10.1016/j.lithos.2017.08.001
von Eynatten, H. (2004). Statistical modelling of compositional trends in sediments. Sediment. Geol. 171, 79–89. doi:10.1016/j.sedgeo.2004.05.011
von Eynatten, H., Barceló-Vidal, C., and Pawlowsky-Glahn, V. (2003). Modelling compositional change: the example of chemical weathering of granitoid rocks. Math. Geol. 35, 231–251. doi:10.1023/A:1023835513705
Yamada, H., Ossaka, J., Urabe, K., and Akagawa, Z. (1968). Weathering of granites: especially weathering and alteration of biotite. Chikyukagaku Geochem. 2, 37–38. (in Japanese). doi:10.14934/chikyukagaku.2.37
Yang, J., and Cheng, Q. (2015). A comparative study of independent component analysis with principal component analysis in geological objects identification, part I: simulations. J. Geochem. Explor. 149, 127–135. doi:10.1016/j.gexplo.2014.11.013
Yasukawa, K., Nakamura, K., Fujinaga, K., Iwamori, H., and Kato, Y. (2016). Tracking the spatiotemporal variations of statistically independent components involving enrichment of rare-earth elements in deep-sea sediments. Sci. Rep. 6, 29603. doi:10.1038/srep29603
Yazman, M. M., Yüksel, B., Ustaoğlu, F., Şen, N., Tepe, Y., and Tokatlı, C. (2024). Investigation of groundwater quality in the southern coast of the black sea: application of computational health risk assessment in giresun, türkiye. Environ. Sci. Pollut. Res. 31, 52306–52325. doi:10.1007/s11356-024-34712-w
Yoshida, K., Kuwatani, T., Hirajima, T., Iwamori, H., and Akaho, S. (2018). Progressive evolution of whole-rock composition during metamorphism revealed by multivariate statistical analyses. J. Metamorph. Geol. 36, 41–54. doi:10.1111/jmg.12282
Zekri, H., Mokhtari, A. R., and Cohen, D. R. (2019). Geochemical pattern recognition through matrix decomposition. Ore Geol. Rev. 104, 670–685. doi:10.1016/j.oregeorev.2018.11.026
Keywords: matrix factorization, geological interpretation, forward, inversion, weathering, geochemical data
Citation: Kuwatani T, Akaho S, Nakamura K and Komai T (2025) Geochemical-process extraction and interpretation using matrix factorization: a framework for verifying effectiveness through forward modeling and inversion analysis. Front. Earth Sci. 13:1559321. doi: 10.3389/feart.2025.1559321
Received: 14 January 2025; Accepted: 10 March 2025;
Published: 07 April 2025.
Edited by:
Ahmed M. Eldosouky, Suez University, EgyptReviewed by:
Zhonghai Zhao, Liaoning Technical University, ChinaCopyright © 2025 Kuwatani, Akaho, Nakamura and Komai. This is an open-access article distributed under the terms of the Creative Commons Attribution License (CC BY). The use, distribution or reproduction in other forums is permitted, provided the original author(s) and the copyright owner(s) are credited and that the original publication in this journal is cited, in accordance with accepted academic practice. No use, distribution or reproduction is permitted which does not comply with these terms.
*Correspondence: Tatsu Kuwatani, a3V3YXRhbmlAamFtc3RlYy5nby5qcA==
Disclaimer: All claims expressed in this article are solely those of the authors and do not necessarily represent those of their affiliated organizations, or those of the publisher, the editors and the reviewers. Any product that may be evaluated in this article or claim that may be made by its manufacturer is not guaranteed or endorsed by the publisher.
Research integrity at Frontiers
Learn more about the work of our research integrity team to safeguard the quality of each article we publish.