 Alemnew Ali
 Degfie Teku
 Tesfaldet Sisay
 Bishaw Mihret
94% of researchers rate our articles as excellent or good
Learn more about the work of our research integrity team to safeguard the quality of each article we publish.
Find out more
ORIGINAL RESEARCH article
Front. Earth Sci., 24 March 2025
Sec. Geohazards and Georisks
Volume 13 - 2025 | https://doi.org/10.3389/feart.2025.1557860
Introduction: Landslides are a major geohazard in the northern Ethiopian highlands, causing significant damage to farmland, infrastructure, and settlements, with profound socio-economic consequences. This study aims to address the pressing need for enhanced natural hazard management by investigating landslide susceptibility in the Debek region of South Wollo, Ethiopia.
Methods: The study employs advanced geospatial modeling techniques to assess landslide susceptibility. Key causative factors—slope gradient, aspect, elevation, proximity to streams and springs, slope material, distance to lineaments, and land use/land cover (LULC)—were identified and analyzed through field surveys and satellite imagery. A total of 328 landslide events were documented, with data divided into training (75%) and validation (25%) sets. Landslide susceptibility maps were generated using the Frequency Ratio (FR) and Analytical Hierarchy Process (AHP) models. Validation of the models was conducted through landslide density indices (R-index) and receiver operating characteristic (ROC) curves.
Results: The analysis revealed that slope material and proximity to springs were the most influential factors contributing to landslide susceptibility. The FR model demonstrated a slightly better performance than the AHP model, with an ROC success rate of 0.828 and a prediction rate of 0.835, compared to 0.826 and 0.832, respectively, for the AHP model. The models were validated through the R-index and ROC curves, which showed a high degree of concordance between the predicted and observed landslide events.
Discussion: This study highlights the effectiveness of GIS-based geomatics approaches in landslide susceptibility mapping in a data-scarce region. The comparative analysis of the FR and AHP models demonstrates the strengths and limitations of each, offering valuable insights for landslide risk mitigation. The findings underscore the importance of integrating geospatial modeling in natural hazard management, supporting more informed land-use planning, targeted mitigation strategies, and comprehensive disaster prevention initiatives.
Conclusion: This research contributes to advancing the understanding of landslide dynamics in the Ethiopian highlands and provides critical resources for policymakers and stakeholders involved in disaster risk management. The study's findings enhance the capacity for effective landslide-prone area identification and susceptibility reduction, reinforcing the importance of geospatial modeling in improving natural hazard management frameworks.
Landslides are among the most persistent natural hazards worldwide, arising from the complex interplay of geological, hydrological, and anthropogenic factors (Silalahi et al., 2019). Defined as the downward movement of rock, debris, or earth materials along slopes due to gravitational forces exceeding the shear strength of underlying materials, landslides occur in various forms, including slides, flows, topples, falls, spreads, and creep (Varnes, 1984). These geohazards result in profound social, economic, and environmental impacts, particularly in regions susceptible to climate change, land-use transformations, seismic activity, and intense rainfall, which collectively amplify the frequency and magnitude of landslide occurrences (Mao et al., 2024; Mekonne et al., 2022; Nanehkaran et al., 2023; Pardeshi et al., 2013).
Ethiopia, with its rugged terrain and diverse climatic conditions, is particularly vulnerable to georisks such as landslides, especially in highland and escarpment regions (Wubalem et al., 2022). The socio-economic repercussions of landslides in Ethiopia are severe, resulting in fatalities, displacement, and extensive damage to infrastructure and agriculture (Mewa and Mengistu, 2022). Between 2018 and 2020, landslides caused 120 deaths, 60 injuries, and displaced over 8,000 households (Wubalem, 2021). A notable event occurred on 13 August 2021, when a landslide along the Addis Ababa-Bahir Dar corridor obstructed transportation for nearly 5 days, causing substantial economic losses (Wubalem et al., 2022). Beyond immediate human and economic costs, landslides contribute to environmental degradation, emphasizing the necessity for robust susceptibility assessment and mitigation measures (Shano et al., 2022). Despite the prevalence of landslides, comprehensive susceptibility mapping in Ethiopia remains inadequate. This deficiency impedes effective land-use planning and disaster mitigation efforts (Abay et al., 2019).
South Wollo, in the Amhara region, is one of the most affected areas, with Debek identified as a key zone of concern (Ali, 2024). The convergence of steep slopes, heavy seasonal rainfall, and unsustainable land-use practices such as deforestation and agricultural expansion significantly contribute to slope instability (Ayele et al., 2025). Seismic activities further compound these susceptibility s, reflecting the intricate relationship between natural and human-induced factors (Pardeshi et al., 2013; Wubalem et al., 2022). Debek, South Wollo, exemplifies a vulnerable region with limited landslide susceptibility analysis. The absence of thorough hazard assessments has led to infrastructure damage, reduced agricultural output, and community displacement (Ali, 2024; Mekonne et al., 2022). For instance, in 2018, a rotational landslide in the Tiy Embuayochi area destroyed farmland and residential properties, exacerbating local vulnerabilities (Wubalem et al., 2022). Similarly, in 2010, a landslide near Mersa village resulted in 17 fatalities (Wubalem et al., 2022). These incidents underscore the urgent need for advanced susceptibility mapping to inform mitigation and preparedness strategies.
Despite the country’s vulnerability, existing studies have not adequately addressed the limitations of various modeling techniques in hazard assessments. Prior research on landslide susceptibility has predominantly employed statistical and deterministic models without systematically comparing their efficacy with expert-driven methodologies (Abay et al., 2019; Shano et al., 2021). While statistical models provide quantitative assessments, they often lack contextual adaptability, whereas expert-driven approaches, despite their flexibility, introduce subjectivity (Ali, 2024). This study aims to bridge this gap by integrating both statistical and expert-driven models, offering a more balanced and robust approach to landslide susceptibility assessment. Moreover, the study is motivated by the need to advance geospatial modeling for disaster susceptibility reduction. Existing literature on landslide susceptibility modeling has largely overlooked the comparative advantages and limitations of Frequency Ratio (FR) and Analytical Hierarchy Process (AHP) models, particularly in the Ethiopian context (Berhane and Tadesse, 2021; Mengstie et al., 2024). A critical examination of these methodologies is necessary to determine their suitability in data-scarce environments such as Debek, South Wollo, where landslide events are frequent and poorly documented (Ali, 2024; Mekonnen et al., 2022). This research, therefore, provides empirical insights into the efficacy of FR and AHP models, contributing to improved decision-making in hazard-prone regions.
The rationale for selecting FR and AHP models lies in their unique advantages over other geospatial modeling techniques, such as Machine Learning (ML) and deep learning approaches (Abay et al., 2019). The FR model is particularly useful for landslide susceptibility assessment due to its ability to statistically quantify the relationship between historical landslides and conditioning factors (Baral et al., 2021). It is a widely used bivariate approach that is computationally efficient and interpretable, making it suitable for regions with limited geospatial data availability (Baral et al., 2021; Shano et al., 2021). On the other hand, the AHP model incorporates expert judgment in assigning weights to influencing factors, allowing for a more flexible, qualitative assessment of landslide susceptibility (Kumar and Anbalagan, 2016; El Jazouli et al., 2019). In contrast, ML and deep learning models, while powerful, require extensive datasets for training and validation (Mao et al., 2024), which may not be readily available in regions like South Wollo. Additionally, the “black box” nature of ML models often limits interpretability, making them less practical for policymakers and land-use planners who require transparent, explainable methodologies (Nanehkaran et al., 2023). Given these considerations, FR and AHP models were selected for their complementary strengths FR providing quantitative precision and AHP incorporating expert-driven insights. The comparative analysis of these models enables a more comprehensive susceptibility assessment, facilitating effective disaster susceptibility management. This study, therefore, aims to conduct a comparative analysis of FR and AHP models to assess landslide susceptibility in Debek, South Wollo. The study’s objectives are threefold: 1) to evaluate the spatial distribution of landslide susceptibility using FR and AHP models, 2) to assess the relative effectiveness of these models in predicting landslide-prone areas, and 3) to generate susceptibility maps that can inform mitigation strategies, land-use planning, and community resilience efforts. By addressing these objectives, this research contributes to the growing body of knowledge on landslide susceptibility modeling and provides actionable insights for disaster susceptibility reduction in Ethiopia.
The study area, Debek, is situated along the border of Tenta and Mekdela weredas in the South Wollo Zone of the Amhara Region, within Ethiopia’s northern highlands. It covers approximately 295.59 km2 and is geographically bounded by Eastings of 0503675 to 0531986 and Northings of 1241155 to 1259835 (Figure 1). The region’s physical characteristics include steep highland terrain with elevations ranging from 1,617 to 3,160 m above sea level, placing it within the Northern Ethiopian volcanic plateau. The climate is classified as semi-arid to temperate, with mean annual precipitation of 924.5 mm and temperatures ranging from 6.6°C to 26.4°C. The rainy season (June to September) coincides with the Ethiopian Kiremt, contributing to intense soil saturation and runoff, which increase landslide susceptibility. The geological profile is dominated by Cenozoic volcanic formations and Quaternary deposits, including lapilli tuff, agglomerate basalt, and columnar aphanitic basalt, overlaid by residual and colluvial soils. These geologic and climatic factors, combined with anthropogenic activities such as deforestation and agricultural expansion, render the area highly prone to landslides. A high-resolution topographic map (Figure 1), land use map, and geological layers were created to provide a spatial understanding of the study area. These maps were developed using a 12.5 m × 12.5 m Alos Palsar DEM and field data, ensuring accuracy and relevance for susceptibility modeling.
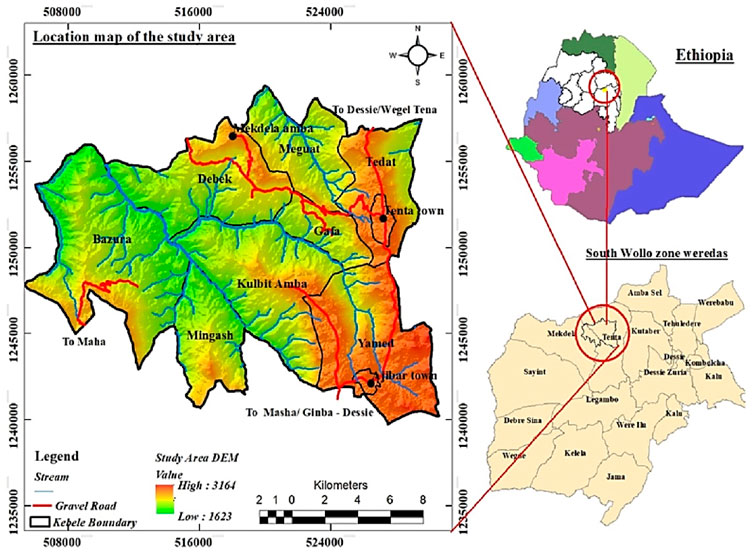
Figure 1. Location map of the study area.
Accurate and comprehensive data is essential for developing reliable landslide susceptibility maps. This study integrates various environmental, topographical, geological, and land-use datasets to assess and map landslide-prone areas in Debek, South Wollo, Ethiopia. The datasets used are carefully selected to reflect critical landslide conditioning factors, ensuring that the Frequency Ratio (FR) and Analytical Hierarchy Process (AHP) models effectively capture the spatial variability of landslide susceptibility. By leveraging Geographic Information System (GIS) tools, these datasets are processed and analyzed to produce accurate and actionable susceptibility maps. The following Table 1 summarizes the primary data sources utilized in this study, detailing their relevance, resolution, and acquisition sources.

Table 1. Primary data sources utilized in this study, their relevance, resolution, and acquisition sources.
In this study, the Frequency Ratio (FR) and Analytical Hierarchy Process (AHP) models were selected for landslide susceptibility assessment due to their simplicity, interpretability, and widespread application in geohazard studies, particularly in data-scarce environments. These models offer practical advantages, making them accessible to researchers and decision-makers without requiring complex computational resources (Althuwaynee et al., 2016; El Jazouli et al., 2019). Their ability to provide clear insights into the contribution of various causative factors enhances their utility for disaster susceptibility management and mitigation strategies (Leonardi et al., 2022). One of the key strengths of FR and AHP is their applicability in regions where comprehensive landslide inventories and high-resolution geospatial datasets are limited (Kumar and Anbalagan, 2015). The FR model, as a data-driven approach, establishes statistical relationships between landslide occurrence and conditioning factors, making it effective in identifying spatial patterns of susceptibility (Li et al., 2016). AHP, on the other hand, allows for expert-driven weighting of factors, ensuring that domain knowledge plays a critical role in hazard assessment (Abay et al., 2019). Their established reliability in geospatial modeling further underscores their relevance in landslide-prone regions like Debek, South Wollo, Ethiopia. This dual-model approach enhances the reliability of susceptibility assessments by combining statistical correlations with expert-driven factor weighting (Ali, 2024). The process begins with data acquisition and preprocessing, where landslide inventories and conditioning factors (e.g., slope, lithology, and land cover) are integrated into the GIS environment to build a comprehensive spatial database. The FR model calculates the relative frequency of landslide occurrences for each factor class, providing a quantitative assessment of susceptibility. Simultaneously, the AHP model applies pairwise comparisons to derive factor weights, reflecting the influence of each parameter on landslide occurrence through expert judgment.
The resulting susceptibility maps are generated by overlaying and integrating weighted factor layers, producing classified outputs that delineate zones of varying landslide susceptibility. Model validation is conducted using historical landslide data and performance metrics to ensure accuracy and reliability. The key novelty of this study lies in its integrated methodology, combining detailed field surveys with advanced remote sensing techniques, thus ensuring the inclusion of both accessible and remote areas in the landslide inventory map. The large dataset of 328 identified landslides, combined with a comprehensive sampling method and rigorous model validation, provides a robust foundation for landslide susceptibility modeling. This approach contributes to the advancement of landslide susceptibility assessment in the region and offers a replicable methodology for similar studies in other landslide-prone areas. Furthermore, the study’s findings are particularly valuable for improving disaster preparedness and land-use planning in South Wollo, Ethiopia, by providing actionable data for policymakers and planners.
Despite these advantages, both models have certain limitations. AHP’s reliance on expert judgment introduces a level of subjectivity, which can lead to inconsistencies in factor weight assignment (El Jazouli et al., 2019). Similarly, the FR model assumes a linear relationship between landslide occurrence and conditioning factors, which may not always capture the complex interactions that drive landslide processes (Intarawichian and Dasananda, 2011). Additionally, while these models perform well in many contexts, machine learning (ML) and deep learning techniques often yield higher predictive accuracy by leveraging large datasets and identifying non-linear patterns (He et al., 2021). However, these advanced methods require extensive training datasets, which may not always be available for landslide studies in remote regions (Kumar et al., 2023). Given these considerations, future research could explore hybrid approaches that integrate FR and AHP with ML techniques to enhance predictive accuracy. Combining expert-driven insights with data-driven machine learning models could help overcome the limitations of individual methods while leveraging their respective strengths (Mao et al., 2024). This would contribute to more robust and adaptable geohazard assessment frameworks, ultimately improving disaster preparedness and mitigation efforts in landslide-prone regions. The overall research approach, summarizing data integration, model application, and validation processes, is visually represented in Figure 2.
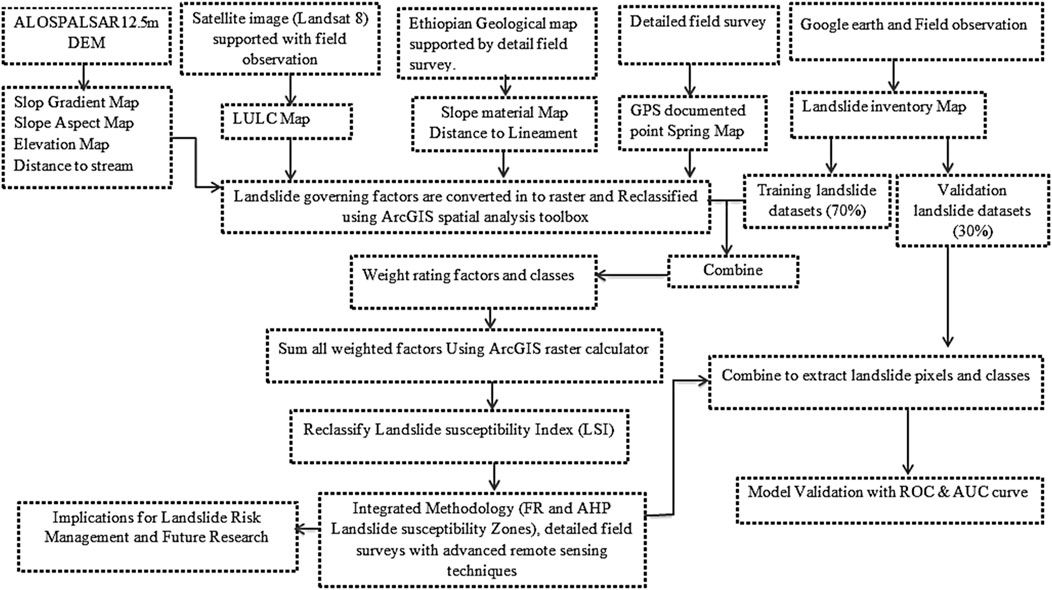
Figure 2. General work flow of the study.
A landslide inventory map is a crucial tool for assessing and understanding landslide-prone areas, providing a detailed spatial representation of landslide occurrences (Mohammady et al., 2012; Pourghasemi and Rahmati, 2018). It plays a fundamental role in landslide susceptibility modeling by cataloging and mapping landslide events, their frequency, and distribution (Nohani et al., 2019). Such maps enable researchers, planners, and policymakers to identify regions at high susceptibility of landslides, making them indispensable in disaster susceptibility reduction and land-use planning (Reichenbach et al., 2018). The accuracy and comprehensiveness of the landslide inventory map directly influence the reliability of subsequent analyses, such as landslide susceptibility mapping, which plays a key role in developing effective mitigation strategies. Landslides are complex natural hazards influenced by various factors, including geological conditions, topography, climate, and human activities (Tsangaratos and Rozos, 2013). Understanding the distribution of past landslides and their relationship to these factors is essential for predicting future occurrences. The landslide inventory map serves as the foundation for such investigations, providing critical data on the spatial distribution of landslides, their frequency, and the contributing factors (Althuwaynee et al., 2016). This information is indispensable in creating models that predict the likelihood of future landslides under various conditions.
In this study, we utilized a combined approach to construct a detailed landslide inventory map for the Debek region of South Wollo, Ethiopia (Figure 3). The methodology involved both field surveys and remote sensing techniques, ensuring comprehensive data collection from different areas of the study region. Field surveys, conducted on-site, provide ground-truth data, enabling researchers to confirm landslide presence and map their exact locations. This approach is essential for obtaining detailed information on the morphology, size, and types of landslides, which cannot always be captured by remote sensing methods alone. Remote sensing, including high-resolution Google Earth imagery, was employed to map landslides in more remote or less accessible areas where field surveys were difficult due to geographical constraints. This approach enabled the coverage of larger regions, providing valuable insights into landslides occurring in hard-to-reach areas. By combining the data from both sources, the resulting inventory map is comprehensive, accurate, and representative of both accessible and remote areas of the study region.
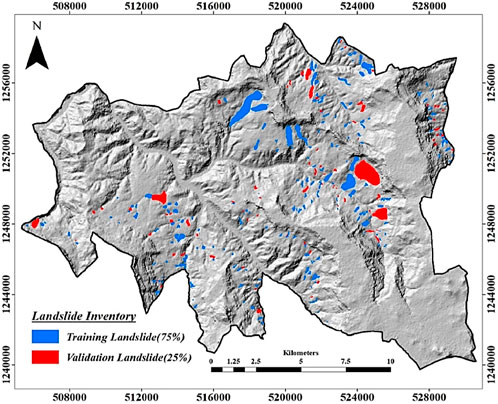
Figure 3. Landslide inventory map of the study area.
The landslide data used in this study consists of 328 individual landslides identified through field surveys and satellite imagery. The sampling method involved the random selection of 246 landslides (75%) for model training, with the remaining 82 landslides (25%) set aside for validation. This approach ensures a robust model training process while maintaining the independence of the validation dataset. To ensure the reliability of the landslide data, both field surveys and remote sensing techniques were applied, with each complementing the other. Field surveys provided first-hand, ground-based observations, while remote sensing offered broader regional coverage, particularly in inaccessible areas. The use of both methods ensures comprehensive data collection and enhances the accuracy of the landslide inventory map. Despite these efforts, inherent data limitations could introduce biases in model outputs. The accuracy of landslide inventories depends on factors such as spatial resolution, cloud cover interference in satellite imagery, and potential underreporting of smaller or inaccessible landslides. Moreover, temporal inconsistencies in data collection may affect the precision of susceptibility modeling, as some landslide occurrences may not be captured in real time. Future improvements could involve the integration of high-resolution remote sensing techniques, such as LiDAR and InSAR, to enhance landslide detection accuracy. Additionally, collaboration with local authorities and community-based monitoring initiatives could provide more comprehensive and real-time data for refining landslide susceptibility assessments.
Model validation is a critical component of landslide susceptibility assessment, ensuring the reliability and robustness of predictive models (Cemiloglu et al., 2023). In this study, we employed Receiver Operating Characteristic (ROC) curves and landslide density indices (R-index) to evaluate model performance, as these techniques provide valuable insights into predictive accuracy and spatial agreement between susceptibility maps and observed landslide events. The ROC curve measures the model’s ability to distinguish between susceptible and non-susceptible areas, while the R-index quantifies the distribution of landslide occurrences within different susceptibility zones, reinforcing the consistency of our results (Nanehkaran et al., 2021). We acknowledge the importance of incorporating diverse validation techniques to enhance model robustness. While k-fold cross-validation is a widely used approach for assessing model generalizability, its implementation was constrained by the nature of our dataset (Mao et al., 2024). The limited availability of landslide inventories in the study area and the spatial clustering of events presented challenges in dividing the dataset into independent training and validation subsets. Instead, we supplemented our validation framework with additional performance indicators, including the area under the ROC curve (AUC) for quantitative evaluation and a comparative assessment of susceptibility maps through statistical correlation analyses. These methods provide a comprehensive validation strategy that strengthens the reliability of our findings (Ali, 2024; Ayele et al., 2025; Berhane and Tadesse, 2021). Future research could explore the integration of k-fold cross-validation and other advanced validation techniques, particularly as more extensive landslide datasets become available (Rosi et al., 2023). Incorporating machine learning-based validation approaches, such as permutation feature importance and bootstrapping methods, could further refine model assessment, ensuring the robustness of susceptibility mapping in diverse geomorphological settings.
Landslides are complex natural phenomena influenced by a range of conditioning and triggering factors (Wubalem et al., 2022). Conditioning factors are those that predispose an area to landslide occurrence, while triggering factors are immediate or short-term causes that initiate landslide events (Kumar and Anbalagan, 2016). This section delves into various key factors identified in the literature and their influence on landslide susceptibility in Debek, South Wollo, Ethiopia, focusing on slope gradient, slope aspect, elevation, distance to streams, springs, slope material, lineaments, and land use/land cover changes (Abay et al., 2019). These factors include a combination of topographical, geological, hydrological, and anthropogenic variables that together shape the landscape’s vulnerability to landslides. Understanding these factors is essential for developing effective landslide susceptibility maps, which form the foundation for mitigation efforts and disaster susceptibility reduction strategies.
Slope gradient is one of the most influential factors in landslide susceptibility modeling. The slope gradient directly impacts the shear forces acting on the terrain, with steeper slopes experiencing higher shear stresses compared to gentler slopes, making them more susceptible to failure (Mohammady et al., 2012). Steep slopes are more prone to destabilization because the gravitational pull on the soil or rock is significantly higher, reducing the material’s shear strength and leading to potential landslides (Anbalagan, 1992). In the study area of Debek, South Wollo, the slope gradient was derived from a 12.5 m × 12.5 m Alos Palsar DEM and classified into five distinct categories: 0°–15°, 15°–25°, 25°–35°, 35°–45°, and >45° (Figure 4a). This classification follows Ambalagan (1992) slope gradient categorization, which is crucial for differentiating areas with varying vulnerabilities to landslides. As indicated by Mohammady et al. (2012), the higher the slope gradient, the greater the potential for landslides, as steep terrain experiences more significant gravitational forces, leading to a higher probability of slope failure.
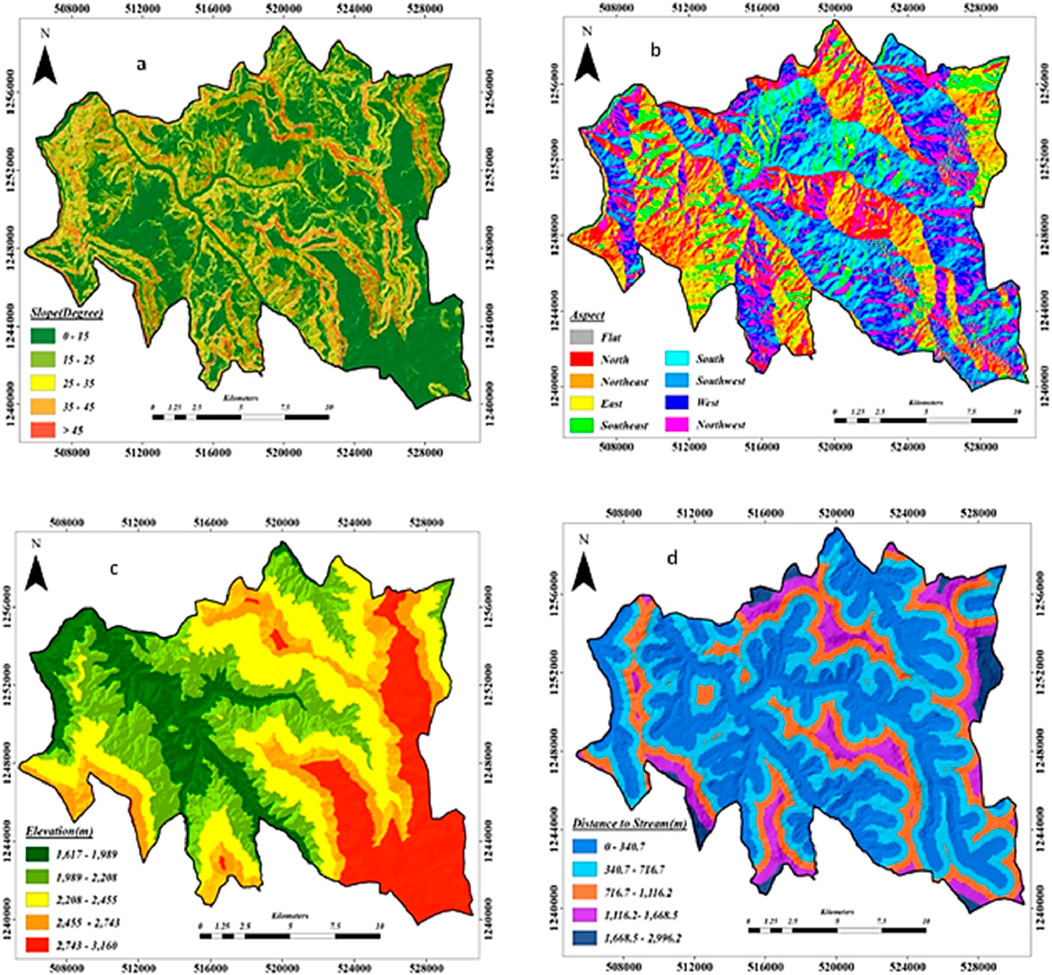
Figure 4. Landslide causative factors. (a) Slope, (b) Aspect, (c) Elevation, (d) Distance to stream.
The slope aspect plays a significant role in understanding the exposure of an area to environmental factors such as sunlight, rainfall, and wind. These factors directly affect vegetation growth, evaporation rates, and erosion, all of which are closely linked to slope stability (Ramesh and Anbalagan, 2015; Chen et al., 2017). Vegetation, for example, can act as a natural stabilizer for slopes by binding the soil, while areas exposed to more rainfall or intense sunlight may experience increased erosion, reducing the soil’s shear strength. The slope aspect map for the study area was also derived from the Alos Palsar DEM, and classified into nine categories: flat, north (N), north-east (NE), east (E), south-east (SE), south (S), south-west (SW), west (W), and north-west (NW) (Figure 4b). Each category represents different exposure levels to climatic and hydrological processes, as observed by Abay et al. (2019), who highlight the significant role of slope aspect in shaping the ecological and hydrological conditions of a region. For instance, slopes facing the south receive more direct sunlight, which can increase evaporation and reduce soil moisture, thereby potentially reducing the susceptibility of landslides in some areas. In contrast, north-facing slopes may accumulate more moisture, leading to higher erosion and a greater likelihood of failure.
While elevation alone does not directly trigger landslides, it is closely associated with other environmental factors such as rainfall intensity, temperature variations, erosion rates, and vegetation patterns—all of which influence slope stability (Leonard et al., 2023; Catani et al., 2013). Higher elevations are typically characterized by more intense rainfall, which can exacerbate soil erosion and increase the likelihood of slope failure. Furthermore, the combination of high altitude and intense weathering processes can lead to the weakening of the slope material, making it more vulnerable to collapse. In the case of Debek, the elevation map was created using the Alos Palsar DEM and classified into five altitude classes: 1,617 m–1,989 m, 1,989 m–2,208 m, 2,208 m–2,455 m, 2,455 m–2,743 m, and 2,743 m–3,160 m (Figure 4c). The higher elevation classes, particularly those exceeding 2,455 m, often experience more intense rainfall and rapid erosion processes, contributing to increased landslide susceptibility. As demonstrated in other regions, such as the study by Catani et al. (2013), elevation serves as an indirect indicator of environmental conditions that significantly affect slope stability.
The proximity to streams and springs plays a pivotal role in landslide susceptibility. Streams, through the continuous flow of water, can reduce the shear strength of earth materials by saturating soils, making them more prone to erosion and failure (Dai and Lee, 2002). Springs, on the other hand, elevate groundwater levels, leading to increased pore water pressure that further reduces the strength of slope materials, thereby triggering landslides (Chimidi et al., 2017). For the Debek region, the distance to streams was classified into five categories based on buffer zones: 0 m–340.7 m, 340.7 m–716.7 m, 716.7 m–1116.2 m, 1,116.2 m–1,668.5 m, and 1,668.5 m–2,996.2 m (Figure 4d). Proximity to streams was identified as a critical factor in landslide occurrence, as areas closer to water sources tend to experience higher erosion and soil saturation. Likewise, the distance to springs was mapped by buffering the identified spring points, and classified into five distance classes ranging from 0 m–1,043.3 m to 5,037.7 m–7,601.2 m (Figure 5a). As reported by Dai and Lee (2002), regions near springs are more vulnerable to landslides due to the increased groundwater infiltration that weakens the slope materials.
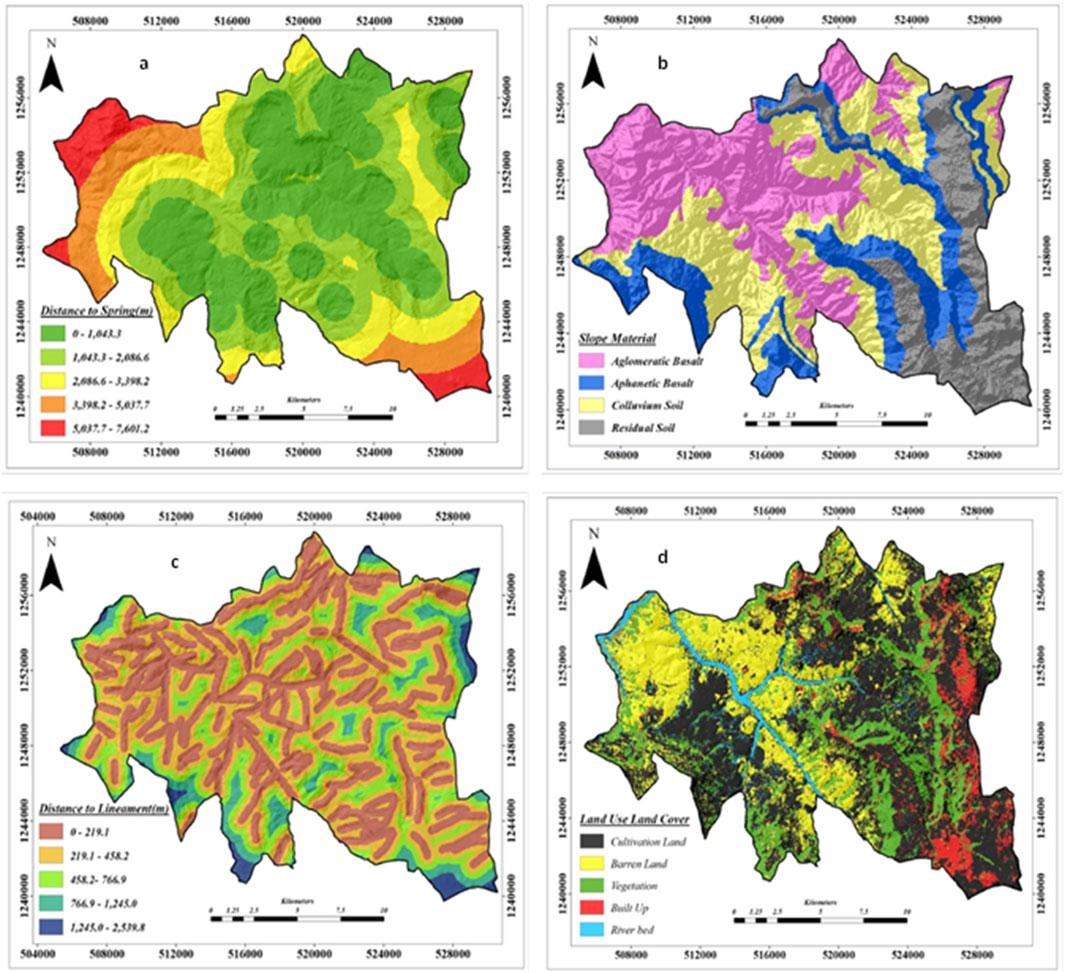
Figure 5. (a) Distance to spring, (b) Slope material, (c) Distance to lineament, (d) Landuse land cover.
The material composition of a slope is a crucial determinant of its stability. Weaker materials, such as weathered rock or loose soil, are more susceptible to landslides compared to more competent rocks (Raghuvanshi et al., 2015). In Debek, lithological data from the Geological Survey of Ethiopia (GSE, 2010) and soil data from the Food and Agriculture Organization (1986) were used to classify the slope material into four categories: Agglomeratic basalt, Aphanetic basalt, Colluvium soil, and Residual soil (Figure 5b). These classifications indicate varying degrees of strength and stability, with more resistant rocks like basalt being less prone to failure compared to softer materials like residual soils, which are more easily eroded and prone to sliding. Lineaments, which include faults, fractures, and joints, serve as pathways for water infiltration and increase the permeability of rock formations (Raghuvanshi et al., 2015). The closer a slope is to a lineament, the more vulnerable it becomes due to the structural disruption that weakens the slope material and provides easier drainage channels. In Debek, the distance from lineaments was classified into five categories, ranging from 0 m–219.1 m to 1,245.0 m–2539.8 m (Figure 5c). As observed by Raghuvanshi et al. (2015), the presence of lineaments in the region enhances the potential for landslide development by disrupting the natural stability of the geological structure.
Human activities such as deforestation, intensive agriculture, and urbanization significantly affect landslide susceptibility, particularly in areas where natural vegetation is removed, leaving the slopes vulnerable to erosion and instability (Raghuvanshi et al., 2015). In Debek, land use/land cover data derived from Landsat 8 imagery were classified into five categories: cultivation land, vegetation, barren land, built-up areas, and riverbeds (Figure 5d). As demonstrated by numerous studies (e.g., Raghuvanshi et al., 2015), deforestation and agricultural activities are major contributors to landslide occurrences, particularly in steep regions where vegetation loss exacerbates soil erosion.
Two widely used models in landslide susceptibility mapping, Frequency Ratio (FR) and Analytical Hierarchy Process (AHP), were employed in this study to predict landslide-prone areas in Debek, South Wollo. Both models have their strengths and limitations, and their combined use allows for a more comprehensive assessment of landslide susceptibility.
The Frequency Ratio (FR) model is a robust and widely used bivariate statistical approach for generating landslide susceptibility maps (Mandal et al., 2018). It operates by examining the spatial relationship between landslide occurrences and the various causative factors influencing slope instability in the study area (Intarawichian and Dasananda, 2011). This approach quantifies the association between landslide distribution and each factor class by calculating the ratio of landslide occurrence to non-landslide occurrence across different factor classes. The FR model is based on the premise that areas with similar factors to those where landslides have occurred in the past are more likely to experience future landslides. This model provides a relatively simple, yet effective, method for identifying landslide-prone regions. The formula for calculating the frequency ratio is given in Equation 1.
Where a value greater than 1 indicates a stronger spatial correlation between the factor class and landslide occurrence, while a value less than 1 signifies weaker correlation (Ramesh and Anbalagan, 2015; Nohani et al., 2019). For this study, after calculating the FR values for each factor class, the values were normalized to a probability range of [0, 1] by applying the relative frequency formula given in Equation 2.
The relative frequency values were then multiplied by 100 to assign class weights to each factor class (Sifa et al., 2019). Each causative factor in the landslide model has a different degree of influence, which is represented by the Prediction Rate (PR), determined through Equation 3.
Finally, the Landslide Susceptibility Index (LSI) for the study area was derived by multiplying the PR and RF values for each factor and performing a raster summation of all factors using Equation 4.
This provides a comprehensive susceptibility map, where areas with higher susceptibility to landslides are identified based on the combined effect of multiple causative factors.
The Analytical Hierarchy Process (AHP) model is a multi-criteria decision analysis technique that involves the comparison of various factors affecting landslide susceptibility (Saaty, 1990). In AHP, factors are ranked based on their relative importance in contributing to landslides, and the model assigns weights to each factor accordingly. The weighted factors are then combined to produce a susceptibility map that indicates the likelihood of landslide occurrences in different regions (Vargas, 1990). The AHP model is particularly useful for integrating various types of data, including both qualitative and quantitative factors, and is capable of handling complex interactions between different variables. To develop a robust landslide susceptibility map this method involves the following steps:
Step 1: Problem Definition and Hierarchical Structuring: In this study, the first step was to define the problem; landslide susceptibility modeling and organize it into a hierarchical structure with the goal of determining the relative importance of each causative factor affecting landslides. This hierarchical decomposition allows for a clear understanding of the problem’s complexity and how each factor interrelates (Saaty, 1990).
Step 2: Judgmental Matrix Development: The next step involves the construction of a judgmental matrix based on pairwise comparisons of factors and their classes. Using Saaty’s (2000) scale, values between 1 and 9 were assigned to express the relative importance of one factor over another. This subjective judgment process helps quantify the degree of importance each factor holds in relation to landslide occurrence. The matrix is of a very specific form, known as a reciprocal matrix, where the entry
Step 3: Computation of Local Weights/Priorities: After the matrix is constructed, the next stage involves calculating the local weights or priorities for each factor. These weights reflect the relative importance of each factor in influencing landslide occurrence. In AHP, this is done by computing the principal eigenvector of the matrix, represented by Equation 5.
where ω is the principal eigenvector, and
Step 4: Consistency Check: To ensure the reliability of the results, consistency needs to be checked. The Consistency Index (CI) is computed using Equation 6.
Where
Where,
Step 5: Aggregation of Scores and Final Susceptibility Index Calculation: Once consistency is verified, the final step is to aggregate the individual weights and ratings of each factor and class. The overall Landslide Susceptibility Index (LSI) is then calculated using Equation 8.
Where,
Both the Frequency Ratio (FR) and Analytical Hierarchy Process (AHP) models, when applied in tandem, offer complementary insights into the spatial distribution of landslide hazards. By using this data to train and validate susceptibility models such as FR and AHP, the study offers valuable insights into the potential for landslides in the Debek region of South Wollo. These maps are critical for disaster susceptibility management and land-use planning, as they help decision-makers implement effective measures to reduce landslide susceptibility s and protect communities and infrastructure. By leveraging both statistical and subjective judgmental approaches, these models provide a nuanced, robust framework for landslide susceptibility assessment in Debek, South Wollo, Ethiopia.
Landslide susceptibility mapping is a crucial tool for identifying and assessing the susceptibility of landslides in vulnerable regions (Gautam et al., 2021). In this study, we employed the Frequency Ratio (FR) model to generate a Landslide Susceptibility Index (LSI) for the Debek region of South Wollo, Ethiopia. The FR method uses the spatial distribution of landslide occurrences and the relationships between various causative factors, such as slope, aspect, elevation, land use, and distance to streams, springs, lineaments, and other relevant features. By analyzing these factors, the study aims to better understand the spatial variations in landslide susceptibility and to guide effective mitigation strategies. The Landslide Susceptibility Index (LSI) was computed by multiplying the Prediction Rate (PR) and the Relative Frequency (RF) for each factor class. The resulting LSI values were then summed using raster operations to obtain a comprehensive susceptibility map. The study categorized the region into five susceptibility classes: very low, low, moderate, high, and very high. The results highlight significant spatial heterogeneity in landslide susceptibility across the area, with notable implications for land-use planning, infrastructure development, and disaster preparedness.
Slope: The slope factor plays a significant role in landslide susceptibility, with steeper slopes exhibiting a higher likelihood of landslide occurrences. In this study, the slope was classified into five distinct classes: 0º–15°, 15º–25°, 25º–35°, 35º–45°, and >45°. The results show that the lowest susceptibility is associated with gentle slopes (0º–15°), which constitute 44% of the region, with a Frequency Ratio (FR) of 1.39. As the slope steepens, the susceptibility increases, particularly in the >45° class, which has a very low Frequency Ratio of 0.14. The relationship between slope and landslide occurrence is consistent with previous studies that indicate steeper areas are more prone to landslides due to gravitational forces, reduced vegetation cover, and erosion susceptibility s. This is because steeper slopes have a greater component of downward force that can overcome the resisting forces, such as friction and cohesion, thus triggering landslide events (Bishop, 1955). Landslides tend to occur more frequently on slopes that exceed a certain angle, which varies depending on soil composition, vegetation cover, and other factors (Kohno and Higuchi, 2023). For example, in areas with loose or unconsolidated soils, the threshold for slope failure may be lower than in areas with more stable rock formations (Luzon et al., 2016). According to studies, slopes steeper than 30–35° are often associated with increased landslide susceptibility, especially in areas with high rainfall or seismic activity (Guzzetti et al., 2012). The relationship between slope and landslide occurrence is one of the most well-established in landslide studies. Studies conducted globally in similar geomorphological regions support the finding that steeper slopes are more prone to landslides. For instance, a study in the Southern Alps of New Zealand (Schlögl et al., 2025) found that slopes greater than 35° were highly susceptible to landslides due to gravitational forces and reduced vegetation cover, similar to what was observed in South Wollo. The study further indicated that the presence of unconsolidated material, such as loose soil or volcanic ash, made these slopes even more vulnerable, an aspect that could be explored in the Debek region where soil composition may contribute to slope failure. In Ethiopia, especially in areas like the Ethiopian Highlands, where the combination of steep terrain and frequent rainfall exacerbates soil erosion, studies have also confirmed that steeper slopes exhibit increased landslide susceptibility (Guzzetti et al., 2012). The role of deforestation and agricultural encroachment in increasing landslide susceptibility has also been noted (Ali, 2024), and this is a factor that should be considered in the Debek region as well.
Aspect: Aspect, which refers to the direction in which a slope faces, also significantly influences landslide susceptibility. These elements can significantly influence factors like erosion rates, vegetation growth, and soil moisture, all of which affect slope stability (Dahal et al., 2008). For instance, south-facing slopes in the Northern Hemisphere typically receive more direct sunlight and experience higher temperatures, which can lead to increased evaporation rates and, consequently, drier conditions. On the other hand, north-facing slopes are generally cooler and receive less direct sunlight, which may result in higher soil moisture content. These variations in moisture levels can affect the cohesion of soil particles and contribute to soil erosion or accumulation, both of which influence the stability of slopes. Additionally, certain environmental conditions, such as higher rainfall or snowmelt, may exacerbate erosion and lead to slope failure in areas with specific aspects (Schuster, 1986). In the Debek region, the highest susceptibility is observed on southern-facing slopes (1.75 FR), followed by southeastern-facing slopes (1.36 FR). These directions are often more exposed to the sun, which can lead to rapid weathering of the soil and increased instability during heavy rainfall events. Conversely, northern-facing slopes exhibit the lowest landslide susceptibility, reflecting the fact that these areas tend to retain moisture longer and experience less soil erosion. This finding aligns with similar research in other mountainous regions, where aspect influences the amount of rainfall infiltration and moisture retention, critical factors in slope stability. In terms of aspect, studies in other regions with similar climatic conditions show consistent patterns with those observed in the Debek region. In regions of Nepal, for example, southern-facing slopes were found to be more prone to landslides due to their exposure to higher temperatures and increased evaporation rates (Schuster, 1986). Similarly, in the Central Andes of Peru, southern-facing slopes were found to exhibit higher erosion rates, leading to a greater susceptibility of landslides (Zhou et al., 2020). These findings confirm the importance of aspect in controlling moisture levels, erosion, and temperature, all of which contribute to slope instability in the Debek region. Furthermore, studies in the Mediterranean region have found that aspect-related variability in landslide susceptibility is particularly marked during wet seasons when southern slopes experience greater drying, further reducing soil cohesion (Petley et al., 2007). Such dynamics may be more prominent in the Debek region, where seasonal rainfall patterns contribute to fluctuating soil moisture content.
Elevation: Elevation is another important factor in landslide occurrence, with different altitudinal zones displaying varying levels of susceptibility. The study divides elevation into five categories: 1,617–1,989 m, 1,989–2,208 m, 2,208–2,455 m, 2,455–2,743 m, and 2,743–3,160 m. The highest susceptibility is found in the 2,208–2,455 m elevation range, where the FR value reaches 2.39. This area is characterized by steep slopes and high rainfall, which together exacerbate the susceptibility of landslides. As elevation increases beyond 2,455 m, landslide susceptibility significantly decreases, likely due to more stable terrain and lower population density. The association between elevation and landslide susceptibility is well-documented in the literature, where mid-range altitudes are often more susceptible to landslides due to a combination of physical terrain features and climatic factors. Furthermore, elevation can influence temperature and moisture conditions that affect erosion rates and vegetation health. For example, at higher elevations, freezing and thawing processes can weaken rock and soil materials, making them more susceptible to landslide initiation during periods of rapid warming or heavy rainfall (Malet et al., 2002). The association between mid-range altitudes and increased landslide susceptibility is well-documented in mountainous regions globally. For instance, in the Himalayas, elevation zones between 1,500 and 2,500 m are often found to be most prone to landslides due to the combination of steep slopes, frequent rainfall, and rapid snowmelt (Kumar et al., 2023). Similarly, studies in the European Alps have shown that mid-elevation areas (around 2,000 m) are at heightened susceptibility of landslides during the wet season, particularly when rainfall triggers mass movements (Schlögl et al., 2025). In Ethiopia, as in other mountainous regions, the vulnerability of mid-elevation areas to landslides is compounded by factors such as population density, agricultural expansion, and infrastructure development. The highest susceptibility observed in the 2,208–2,455 m elevation zone in the Debek region further corroborates the global trend that mid-range altitudes tend to experience a higher frequency of landslides. Thus, understanding elevation patterns is critical for assessing the potential for landslide occurrences, particularly in mountainous regions like South Wollo, where significant elevation changes are common.
Distance to Stream: The proximity to streams and rivers is another crucial factor influencing landslide susceptibility. Areas within 340.7 m of a stream exhibit the highest susceptibility (FR = 1.55), while regions located farther away show progressively lower susceptibility. This trend is expected, as streams often erode banks, saturate soils during floods, and destabilize slopes. The positive correlation between landslide susceptibility and distance to streams is supported by several studies, which suggest that streams can both directly and indirectly trigger landslides through processes like undercutting and hydrological saturation. Furthermore, the undercutting of riverbanks by streams or rivers can lead to the destabilization of slopes, especially in areas with steep gradients. As the water erodes the base of the slope, it weakens the foundation, increasing the likelihood of landslide occurrence (Montgomery and Dietrich, 1994). In the Debek region, the presence of streams is a critical factor in determining landslide susceptibility, as it directly influences soil saturation levels and erosion rates along riverbanks and slopes adjacent to waterways. The findings in Ethiopia align with studies from other mountainous regions like the Andes in South America and the Himalayas in Asia (Mandal, et al., 2018). In these regions, streams and rivers similarly undercut slopes, leading to soil instability and landslides. For example, in Nepal’s hilly terrains, research has shown that the proximity of rivers increases the likelihood of landslide events due to bank erosion and soil saturation (Regmi et al., 2014). Similarly, in the Peruvian Andes, Calderón-Guevara et al. (2022) emphasize the role of streams in triggering landslides through processes like undercutting, echoing findings from the Debek region.
Distance to spring: Springs, like streams, contribute to slope instability by saturating the soil and increasing pore pressure (Ali et al., 2024). The study reveals that areas within 1,043.3 m of a spring exhibit a high susceptibility to landslides (FR = 2.49), indicating the significant role of groundwater in triggering slope failures. The correlation between proximity to springs and landslide susceptibility highlights the importance of groundwater dynamics in the study of landslides, a relationship that is increasingly emphasized in landslide susceptibility research. In areas where springs are located near steep slopes, the combination of groundwater seepage and high soil moisture can act as a trigger for landslides, particularly during periods of heavy rainfall or snowmelt (Mekonnen et al., 2022). In regions where groundwater discharge is concentrated, such as fault zones or areas with highly permeable soils, the susceptibility of landslides is amplified (Baral et al., 2021). This is because the increased water content in the soil decreases its overall stability, making it more likely to slide down the slope under gravitational forces. Similar patterns are observed in other mountainous regions with fault zones and significant groundwater discharge. For example, in Japan’s mountainous terrain, Kohno and Higuchi (2023) demonstrated the critical role of springs in triggering landslides, especially in regions with steep gradients and high rainfall. Similarly, in the Italian Alps, Schlögl et al. (2025) emphasized the influence of springs and groundwater seepage on landslide occurrence, where springs concentrated near fault zones and permeable soils amplified landslide susceptibility s.
Slope Material: The type of underlying slope material is another critical factor in determining landslide susceptibility (Leonardi et al., 2022). In this study, colluvial soil, characterized by loose and unconsolidated material, exhibited the highest susceptibility (FR = 3.17). This finding is consistent with many previous studies, which have shown that colluvial soils are more prone to landslides because of their low shear strength and high moisture retention capacity (Ali, 2024; Mekonnen et al., 2022). Aphanetic basalt and agglomeratic basalt, by contrast, show much lower susceptibility due to their more cohesive and stable properties. Geological materials, such as lapilli tuff, residual soils, and other loose or unconsolidated materials, are more susceptible to erosion and failure than more consolidated bedrock (Nohani et al., 2019). These materials are easily eroded by water, especially during periods of intense rainfall, which can increase the susceptibility of slope failure. Other regions with similar geomorphology, such as the Andes and the Himalayas, show similar patterns. In the Andes, Calderón-Guevara et al. (2022) observed that colluvial soils in steep slopes were highly susceptible to landslides, particularly during periods of intense rainfall. Likewise, in the Himalayan region, Chawla et al. (2018) highlighted the vulnerability of colluvial soils to landslides, particularly in areas where agriculture and land use changes have led to soil instability.
Distance to Lineament: Lineaments, which refer to fractures or faults in the earth’s crust, are critical factors influencing landslide susceptibility (Kumar and Anbalagan, 2016). These features concentrate stress within the earth’s crust and create pathways for groundwater movement, both of which can contribute to slope instability (Mohammednur et al., 2024). Faults and fractures weaken the surrounding rock mass, reducing its shear strength and making it more susceptible to failure. The proximity of a slope to these geological features increases the likelihood of landslides, particularly in regions with active tectonic processes (Ali, 2024). In the Debek region, areas closer to lineaments, specifically within 219.1 m, display a higher susceptibility (FR = 1.01). This is because fault zones often create zones of weakness in the rock mass, which can be more easily mobilized during seismic events or heavy rainfall. The role of lineaments in landslide occurrence is widely recognized in geological literature, where it is understood that fractures can act as pathways for water infiltration, further weakening the slope. Similar trends are observed globally. In the Italian Alps, Schlögl et al. (2025) noted that landslides frequently occur in regions near fault lines, as the faults reduce the shear strength of the rock and provide pathways for water to infiltrate. In Nepal, Baral et al. (2021) observed that lineaments often coincide with high landslide susceptibility, particularly in tectonically active regions where faults increase the likelihood of slope failure due to seismic activity and water infiltration.
Land Use and Land Cover (LULC): The type of land use and land cover (LULC) significantly influences landslide susceptibility (Catani et al., 2013). Cultivated lands (FR = 1.48) and river beds (FR = 1.11) exhibit moderate susceptibility, while barren lands (FR = 0.19) are less susceptible to landslides. Vegetation, which provides slope stabilization through root systems, significantly reduces susceptibility (Wubalem et al., 2022). This finding supports the conclusion that deforestation and land degradation are key drivers of landslide susceptibility in many regions, particularly in the Ethiopian Highlands. Studies have repeatedly shown that areas with extensive agricultural land use or sparse vegetation are more prone to landslides due to reduced root cohesion and increased soil erosion (Mekonnen et al., 2022). Forest clearing for agriculture, combined with the expansion of settlements, has likely led to greater soil exposure and higher erosion rates (Chimidi et al., 2017). These activities coupled with natural environmental factors such as rainfall and slope gradient, create conditions that are highly conducive to landslide occurrence (Intarawichian and Dasananda, 2011). This pattern is consistent with findings from other regions where land degradation and deforestation exacerbate landslide susceptibility. In the Philippines, Luzon et al. (2016) showed that deforestation for agriculture significantly increases landslide vulnerability, especially during the rainy season. Similarly, in the Andes, Calderón-Guevara et al. (2022) highlighted that areas with heavy agricultural land use, where vegetation is removed, experience higher landslide susceptibility s due to reduced soil stability and increased erosion. Table 2 presents the Frequency Ratio (FR), Relative Frequency (RF), and Prediction Rate (PR) for each class of the conditioning factors, providing insight into their influence on landslide susceptibility.
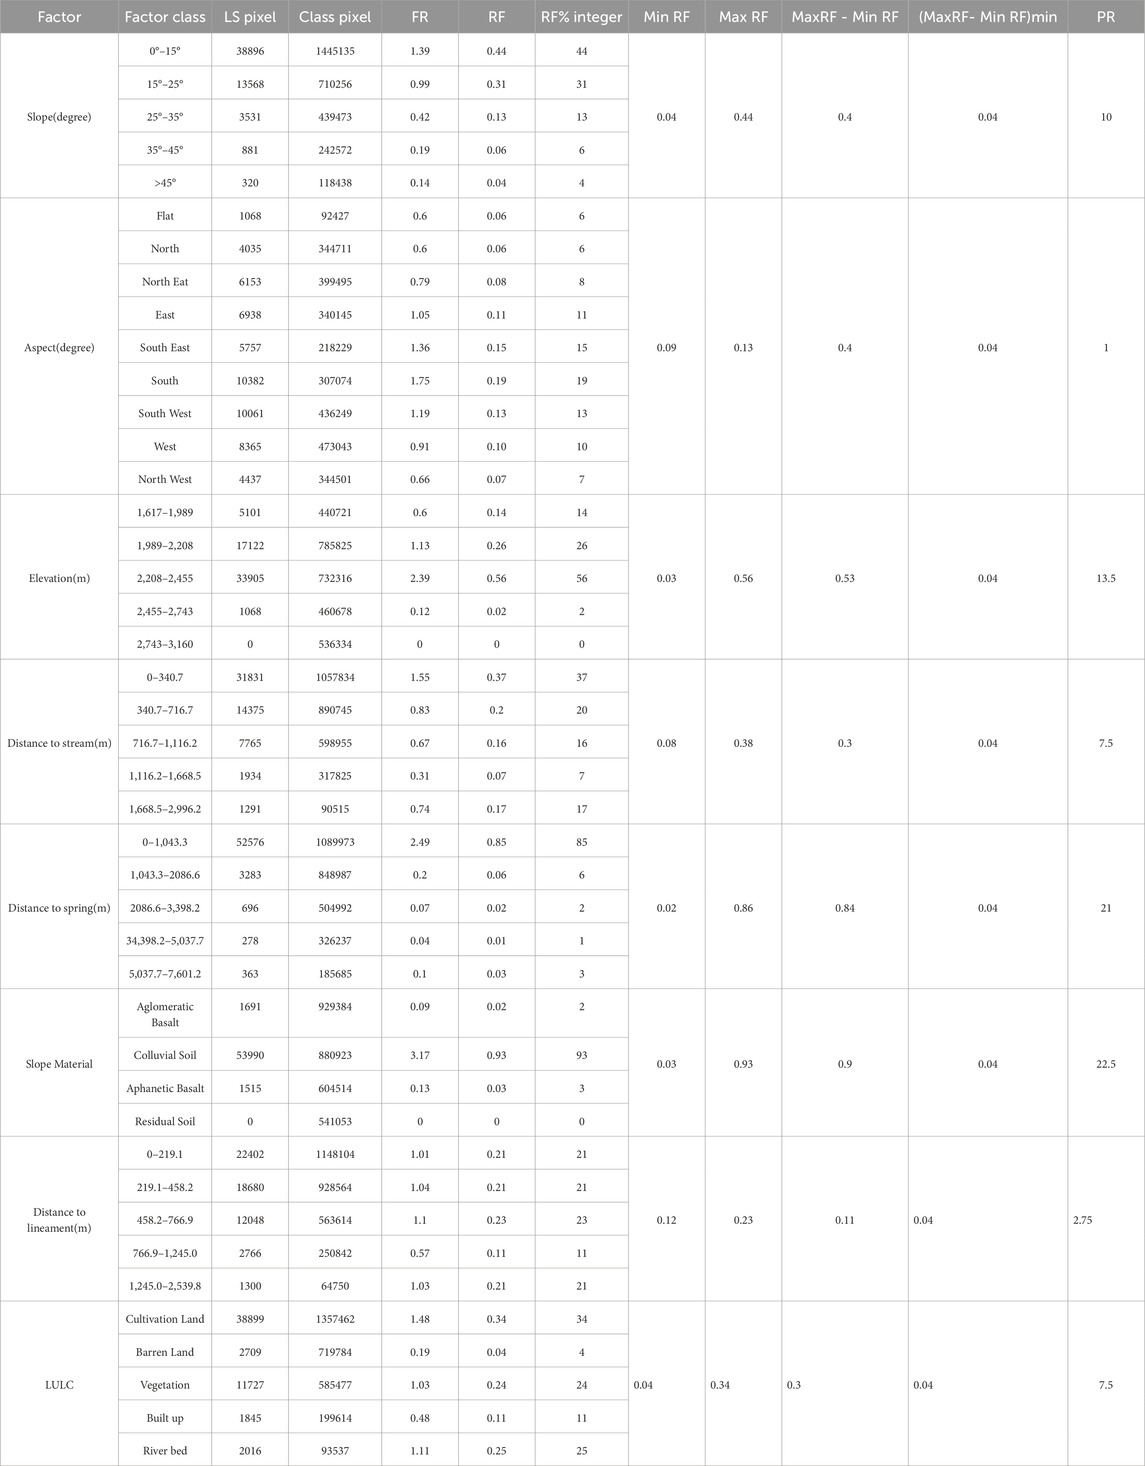
Table 2. FR,RF, and PR for each class of the conditioning factors.
The final Landslide Susceptibility Map (Figure 6) was derived by integrating the weighted contributions of all causative factors using the Frequency Ratio (FR) model. The study area was classified into five distinct landslide susceptibility categories: very low, low, moderate, high, and very high. The spatial distribution of these categories highlights significant variations in landslide susceptibility across the region. As depicted in the susceptibility map, approximately 41.18% of the study area falls under the “Very Low” susceptibility category, indicating regions with minimal susceptibility of landslides, predominantly located in relatively flat terrains and areas with stable soil conditions. The “Low” susceptibility class accounts for 17.77%, while “Moderate” susceptibility covers 18.52% of the region. These areas are characterized by moderate slopes, relatively stable soil structures, and less intense land-use activities. Conversely, the “High” susceptibility zones, comprising 15.95% of the study area, are primarily associated with steeper slopes, unstable geological formations, and areas with significant land-use changes, such as deforestation and agricultural expansion. Most notably, the “Very High” susceptibility category covers 22.53% of the region, indicating the most critical zones requiring immediate attention. These high-susceptibility areas are primarily concentrated around Debek, Meguat, Gafa, and Mingash, where steep slopes, proximity to water bodies, and altered land-use patterns converge to increase landslide potential.
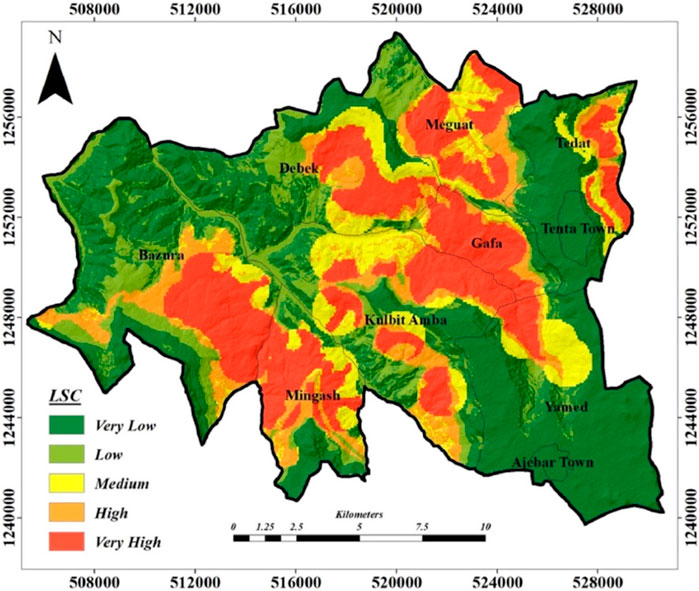
Figure 6. Landslide susceptibility map produced by FR model.
The findings in the Debek region align with previous studies conducted in other landslide-prone areas of Ethiopia. For instance, a study by Ali et al. (2024) in the Amhara region revealed that 70% of landslides occurred on slopes steeper than 25°, which is consistent with the current study, where high susceptibility areas were predominantly associated with slopes exceeding 30°. Similarly, Mohammednur et al. (2024) conducted an assessment in the Sidama Zone and found that land-use changes, particularly agricultural expansion on steep slopes, significantly increased landslide susceptibility. In the current study, agricultural practices near steep slopes and deforested regions in Debek further corroborate these findings. Moreover, Shano et al. (2021) reported that Ethiopian highlands with slopes greater than 30–35°, especially when combined with high rainfall and land-use changes, were highly susceptible to landslides. The current results support this observation, as regions with slopes exceeding 35°, such as the Mingash and Kulbit Amba areas, exhibited the highest susceptibility indices.
The findings from the Debek region also exhibit strong similarities with landslide susceptibility studies conducted in other mountainous regions globally. In the Andes Mountains of South America, Zhou et al. (2020) applied a Frequency Ratio (FR) model and identified slopes above 30° as the most susceptible to landslides, closely mirroring the results of the current study. Likewise, Sharma and Sandhu. (2024) reported similar patterns in the Himalayas of Nepal, where landslide susceptibility was strongly influenced by slope steepness, elevation, and land-use changes. Furthermore, a study conducted by Kumar et al. (2023) in the Himalayas found that mid-range altitudes (between 2,000 and 3,000 m) exhibited the highest landslide susceptibility due to a combination of steep slopes, intense rainfall, and rapid snowmelt. This observation parallels the current study, where elevations ranging from 2,200 to 2,500 m showed the highest susceptibility indices, particularly around Debek, Meguat, and Mingash. In Japan’s mountainous regions, particularly in the Chugoku and Kinki areas, Chiba et al. (2017) found that slopes steeper than 25° and elevations between 500 and 1,500 m were associated with high landslide frequencies. While the elevation range in Debek is higher, the similarity in slope thresholds underscores the universal role of steep terrain in landslide susceptibility. The landslide susceptibility map generated through the AHP model offers a critical tool for disaster susceptibility management and land-use planning in Debek and other similar regions. The identification of 22.53% of the area as “Very High” susceptibility highlights the urgent need for targeted mitigation strategies.
In the context of Debek, South Wollo, Ethiopia, landslide susceptibility mapping serves as a crucial tool for understanding the potential for landslide events and enabling the implementation of appropriate disaster susceptibility reduction strategies. The application of the Analytical Hierarchy Process (AHP) model for landslide susceptibility assessment integrates multiple environmental factors such as slope, aspect, elevation, proximity to streams and springs, slope material, land use/land cover (LULC), and distance to lineament that influence the occurrence and severity of landslides in the region. This method provides a robust framework for generating spatial susceptibility maps, which can significantly aid in land-use planning, hazard mitigation and adaptive management strategies.
Slope is one of the most critical parameters influencing landslide susceptibility. The AHP-based weighting system revealed that areas with slopes greater than 45° are associated with the highest susceptibility, receiving the greatest weight of 0.36. These areas represent steep terrain, which is more prone to mass movement due to gravitational forces. Conversely, areas with slopes between 10° and 15° are classified as low-susceptibility zones, receiving a weight of only 0.09. This weighting reflects the natural resistance of shallower slopes to landslides. The model suggests a clear correlation between increasing slope and heightened susceptibility, highlighting the importance of managing steep terrains through engineering and vegetation-based stabilization measures. The findings corroborate existing literature emphasizing slope as a primary determinant in landslide susceptibility assessment. Slope angles exceeding 45° exhibits the highest susceptibility (weight 0.36), reflecting the strong correlation between steep gradients and gravitational forces that trigger mass movement (Juliev et al., 2019). These results underscore the necessity of implementing engineered slope stabilization techniques, such as retaining walls and terracing, in steep terrains (Chen et al., 2017). Additionally, afforestation and bioengineering methods have demonstrated effectiveness in reducing surface erosion and enhancing soil cohesion in steep landscapes (Catani et al., 2013).
Aspect is another significant factor that affects landslide occurrence in mountainous regions (Mandal et al., 2018). The susceptibility model demonstrated that southern-facing slopes (S) are more prone to landslides compared to other aspects, with a weight of 0.18. This may be due to increased solar exposure, which can lead to greater weathering of rocks and soils, thereby reducing their stability. On the other hand, flat and northern-facing slopes exhibit relatively low susceptibility to landslides, as reflected by their respective weights of 0.07 and 0.08. The differential influence of slope aspect underscores the importance of incorporating orientation-based susceptibility assessments in landslide susceptibility mapping. This pattern aligns with studies indicating that higher solar radiation on southern slopes accelerates weathering and desiccation, compromising slope stability (Hosseini et al., 2023). In contrast, northern-facing slopes, which are typically shaded, exhibit lower susceptibility due to reduced thermal stress and moisture loss (weight 0.08). This finding suggests the integration of aspect-related data into comprehensive susceptibility assessment models, as advocated by Reichenbach et al. (2018).
Elevation is another influential variable in the AHP model. The study revealed that areas situated at higher elevations (above 2,455 m) have a significantly higher susceptibility of landslides, with the highest weightings attributed to elevations ranging from 2,743 to 3,160 m (0.32) and 2,455–2,743 m (0.29). These regions often experience more intense weather events, including heavy rainfall and snowmelt, which can trigger landslides. The relationship between elevation and landslide susceptibility emphasizes the need for increased monitoring and adaptive strategies in high-altitude areas. These results reflect the heightened exposure of high-altitude regions to intense precipitation, snowmelt, and freeze-thaw cycles, all of which contribute to slope instability (Jaiswal and Van Westen, 2013). Monitoring systems and early warning networks in high-altitude zones are vital to mitigating the susceptibility s associated with these environmental stressors (Gariano and Guzzetti, 2016).
Proximity to Streams and Springs also emerged as a critical factor in landslide susceptibility. The AHP model demonstrated that areas closer to streams and springs are at greater susceptibility of landslides, with the weight for the nearest zone (0–283.7 m) being 0.45. This suggests that water plays a pivotal role in the destabilization of slopes, either through saturation of soils or by undermining the structural integrity of the terrain. Areas far from water sources (beyond 1,622 m) are less susceptible, which highlights the protective role of distance from water bodies in reducing landslide susceptibility. Hydrological factors, particularly proximity to streams and springs, significantly influence landslide susceptibility, as indicated by the highest weighting (0.45) for areas within 283.7 m of water sources. This observation aligns with global studies demonstrating that water saturation reduces soil shear strength, increasing the likelihood of slope failure (Rahman et al., 2022). Structural interventions, such as drainage channels and slope surface sealing, have proven effective in managing hydrological impacts and reducing landslide occurrence (Ayalew and Yamagishi, 2005).
The slope material factor also contributes significantly to the overall susceptibility assessment. The AHP model revealed that colluvial soils, which consist of loose, unconsolidated materials, are highly susceptible to landslides, receiving a weight of 0.56. This soil type is prone to erosion and mass movement, particularly in areas where the slope is steep. In contrast, residual soils and agglomeratic basalt are relatively more stable, as indicated by their lower weights (0.06 and 0.13, respectively). The importance of slope material is evident in the high susceptibility associated with colluvial soils (weight 0.56), which are inherently unstable and prone to erosion (Liu et al., 2021). These findings align with investigations in other regions where colluvial deposits consistently emerge as critical zones for landslide initiation (Tang et al., 2020). The relatively stable nature of residual soils and agglomeratic basalt reinforces the protective role of denser, consolidated materials (weight 0.06 and 0.13, respectively), emphasizing the need for detailed geotechnical assessments in landslide-prone areas.
Proximity to Lineaments also contributes to landslide susceptibility, though to a lesser extent. The AHP model assigns a higher susceptibility (weight of 0.38) to areas within 219.1 m of lineaments, which are indicative of geological fault zones. These areas are more likely to experience ground movements, including landslides, as a result of tectonic activity. The influence of lineament proximity highlights the importance of incorporating geological data into landslide susceptibility assessments, particularly in seismically active regions. The proximity to lineaments (within 219.1 m, weight 0.38) reflects tectonic activity’s role in destabilizing terrain (Pourghasemi et al., 2013). This finding highlights the value of integrating remote sensing and geophysical surveys into landslide mapping, as advocated by Guzzetti et al. (2012).
Land Use/Land Cover (LULC) is another critical factor influencing landslide susceptibility in Debek. The AHP model highlighted that cultivated lands, with a weight of 0.46, are the most susceptible to landslides. This result aligns with previous studies indicating that agricultural activities, especially those involving intensive land cultivation and deforestation, contribute significantly to soil instability and erosion. Conversely, areas covered with vegetation (weight of 0.17) are less susceptible to landslides due to the stabilizing effect of plant roots on the soil. The land use data reinforces the notion that sustainable land management practices, such as reforestation and controlled agricultural expansion, can play a significant role in mitigating landslide susceptibility s. This result aligns with research demonstrating that intensive agricultural practices and deforestation exacerbate soil erosion and slope destabilization (Ray and Lazzari, 2020). Conversely, vegetated areas exhibit lower susceptibility (weight 0.17), supporting the well-established role of plant roots in enhancing slope stability (Sidle et al., 2006). Promoting sustainable land management practices, such as agroforestry and controlled deforestation, are crucial in reducing landslide susceptibility s (Youssef et al., 2023). Table 3 presents the pairwise comparison matrix, weightings, and consistency ratio (CR) for the factor classes, which are essential for assessing the relative influence of each conditioning factor in the landslide susceptibility analysis.

Table 3. Pair wise comparison matrix, weightings, and CR of factor classes.
The final landslide susceptibility map generated from the Analytical Hierarchy Process (AHP) model classified the study area into five distinct susceptibility categories: very low, low, moderate, high, and very high (Figure 7). The results revealed that approximately 23.09% of the area falls under the very low susceptibility category, while 26.34% is classified as low susceptibility. Moderate susceptibility areas cover 17.77% of the study area, whereas high susceptibility zones account for 13.74%. Notably, the most concerning zones are the very high susceptibility areas, which comprise 19.06% of the region. These findings underscore the urgent need for targeted landslide susceptibility management strategies, particularly in the very high susceptibility zones, where the likelihood of landslides is greatest. To mitigate the potential impacts of landslides in high-susceptibility zones, proactive measures are essential. These include the implementation of early warning systems, enforcement of land-use regulations, and the adoption of soil stabilization techniques. Such strategies can significantly reduce the vulnerability of communities and infrastructure in susceptible areas. Furthermore, integrating community-based awareness programs with technological solutions can enhance resilience and preparedness against future landslide events. The AHP-based landslide susceptibility mapping approach employed in this study offers a robust and comprehensive framework for assessing landslide susceptibility s in Debek, South Wollo, Ethiopia. By integrating multiple environmental factors and assigning appropriate weightings, the model provides valuable insights into the spatial distribution of landslide susceptibility. The analysis highlights the critical role of factors such as slope, aspect, elevation, and proximity to water sources in determining landslide susceptibility. Moreover, the findings emphasize the importance of considering both natural and anthropogenic factors in landslide susceptibility mapping.
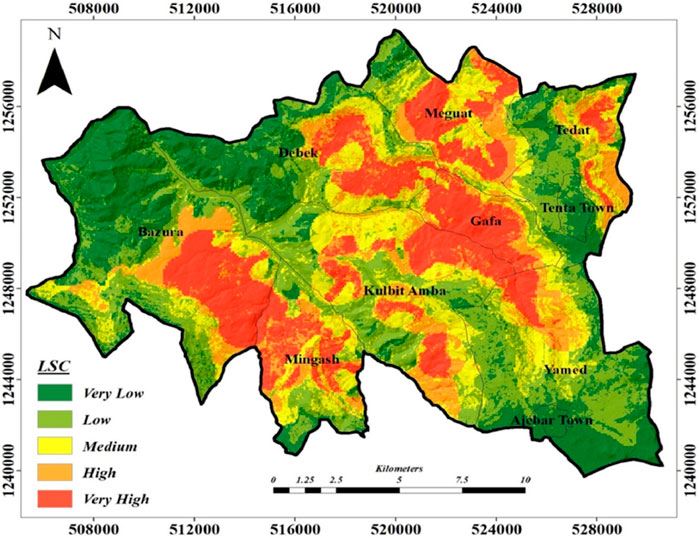
Figure 7. Landslide susceptibility map produced by AHP.
The findings of this study align closely with previous research conducted in Ethiopia and other regions with similar geomorphological and climatic conditions. In Ethiopia, landslide susceptibility mapping using the Frequency Ratio (FR) model has been conducted in various regions, including the central and southern highlands. For instance, studies in the Amhara region (Ali et al., 2024) and the Sidama Zone (Ayele et al., 2025) employed similar models and found that slope, elevation, and land use were significant contributors to landslide occurrences. The steep slopes of the Ethiopian highlands, particularly in areas like South Wollo, were identified as primary determinants of landslide susceptibility, consistent with the findings in the Debek region. Ali et al. (2024) reported that 70% of landslides in the Amhara region occurred on slopes steeper than 25°, similar to the Debek region, where slopes greater than 45° exhibited very low Frequency Ratios (0.14). Furthermore, the results of these studies indicated that areas with slopes greater than 30–35° were highly susceptible to landslides, especially when coupled with high rainfall and land-use changes such as deforestation (Ali, 2024). This consistency in findings across Ethiopia suggests that steep terrain and intense rainfall patterns are universal susceptibility factors for landslide susceptibility in Ethiopian highland regions. While the general findings are consistent, some variations were noted regarding the impact of land-use changes. For example, Mekonnen et al. (2022) highlighted that agricultural activities on steep slopes significantly contributed to landslide susceptibility, an aspect that warrants further exploration in the Debek region.
Internationally, the FR model has been applied in regions with comparable geomorphological and climatic conditions, further contextualizing the findings in the Debek region. For example, studies in the Andes Mountains in South America (Valdes Carrera et al., 2023) and the Himalayas in Nepal (Mandal et al., 2018) used the same method to assess landslide susceptibility and found similar relationships between slope and landslide occurrences. In the Andes, steep slopes above 30° were identified as the most prone to landslides, closely matching the results observed in Ethiopia (Calderón-Guevara et al., 2022). In the Himalayas, landslide susceptibility was strongly influenced by elevation, with mid-range altitudes being most susceptible due to a combination of steep terrain, increased rainfall, and rapid snowmelt (Batar and Watanabe, 2021). This parallels the findings in the Debek region, where elevation zones between 2,208 and 2,455 m exhibited the highest landslide susceptibility. Similarly, in the mountainous regions of Japan, particularly in the Chugoku and Kinki areas, landslide susceptibility studies also emphasize the role of slope and elevation (Kohno and Higuchi, 2023). Luzon et al. (2016) found that areas with slopes greater than 25° and elevations between 500 and 1,500 m had a higher frequency of landslides, reflecting the patterns observed in Ethiopia’s highlands. This comparative analysis suggests that the landslide susceptibility in the Debek region is largely influenced by common physical and climatic factors consistent across several global regions with mountainous terrains (Kohno and Higuchi, 2023). In conclusion, the AHP-based landslide susceptibility mapping approach provides a highly effective framework for assessing landslide susceptibility s in Debek, South Wollo, Ethiopia. The results emphasize the critical role of environmental factors such as slope, elevation, and land use in determining susceptibility. Furthermore, the consistency of findings with both regional and international studies highlights the robustness of the model in identifying high-susceptibility areas. To enhance the accuracy and reliability of future landslide susceptibility predictions, further studies should incorporate dynamic data, such as rainfall intensity, seismic activity, and land-use changes. Such advancements would contribute to more effective disaster susceptibility management and sustainable land-use planning in landslide-prone areas, ultimately safeguarding lives, livelihoods, and infrastructure in Ethiopia’s highland regions.
Validating landslide susceptibility maps is crucial for assessing the reliability of the models used to predict landslide-prone areas. In this study, two widely recognized models—Frequency Ratio (FR) and Analytical Hierarchy Process (AHP) were employed to map landslide susceptibility in Debek, South Wollo, Ethiopia. Validation is necessary to determine how well these models predict landslide occurrences and their spatial distribution. Several robust techniques were applied to validate the generated maps, including the Relative Landslide Density Index (R Index) and the Receiver Operating Characteristics (ROC) curve analysis. These methods are commonly used in landslide susceptibility studies and provide a quantifiable measure of model performance. Both the R Index and ROC curve analysis assess the models’ predictive abilities and their effectiveness in correctly identifying landslide-prone regions.
The Relative Landslide Density Index (R Index) is a key validation method used to assess how well landslide occurrences align with the generated susceptibility classes (Figure 8). This index indicates the distribution of landslide points across different susceptibility classes and helps to measure the model’s effectiveness in identifying areas that are more likely to experience landslides. The formula for the R Index compares the percentage of landslide occurrences in each susceptibility class with the area of that class, providing a relative measure of landslide density in each category. In the case of Debek, the R Index revealed an increasing trend in landslide occurrence from the very low susceptibility classes to the very high susceptibility classes (Figure 8). This pattern underscores the validity of both the Frequency Ratio and Analytical Hierarchy Process models. As expected, the high and very high susceptibility areas exhibited a significantly higher concentration of landslides, suggesting that the models effectively prioritize landslide-prone areas. The R Index value demonstrates that the maps are accurately reflecting the spatial relationship between susceptibility and landslide occurrence. This reinforces the reliability of the models in predicting landslide hotspots and highlights the importance of these tools in disaster susceptibility management and land-use planning in vulnerable regions.
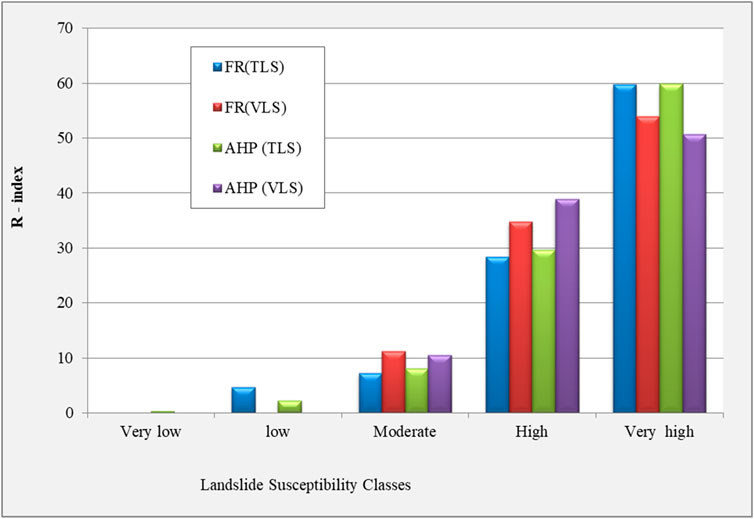
Figure 8. R-index for the landslide susceptibility classes.
The Receiver Operating Characteristics (ROC) curve is another critical validation tool used to assess the predictive accuracy of landslide susceptibility models. The ROC curve provides a graphical representation of a model’s ability to classify landslide-prone areas correctly. The performance of the model is quantified by calculating the Area Under the Curve (AUC), with values ranging from 0 to 1. An AUC value above 0.5 indicates that the model has predictive power, while values below 0.5 suggest that the model’s predictions are unreliable. AUC values closer to 1 reflect excellent model performance. In this study, both the Frequency Ratio (FR) and Analytical Hierarchy Process (AHP) models were evaluated using the ROC curve. The AUC values for the success rate, which measures the model’s accuracy in fitting with historical landslide data, were 0.828 for the FR model (Figure 9a) and 0.826 for the AHP model (Figure 9b). These values indicate that both models performed well, with the FR model showing a marginal advantage in terms of fitting the historical landslide data. The success rate AUC values above 0.8 suggest that both models have strong predictive capabilities and are highly effective in identifying landslide-prone areas based on past occurrences. Furthermore, the prediction rate, which measures the model’s ability to predict future landslide occurrences, was also evaluated using the validation landslide dataset. For the prediction rate, the AUC values were 0.835 for the FR model (Figure 10a) and 0.832 for the AHP model (Figure 10b). Similar to the success rate, the FR model slightly outperformed the AHP model in terms of predictive accuracy. However, both models demonstrated strong performance, with AUC values well above the threshold of 0.8, which is considered indicative of excellent predictive power. These results further validate the effectiveness of both the FR and AHP models in forecasting landslide-prone areas.
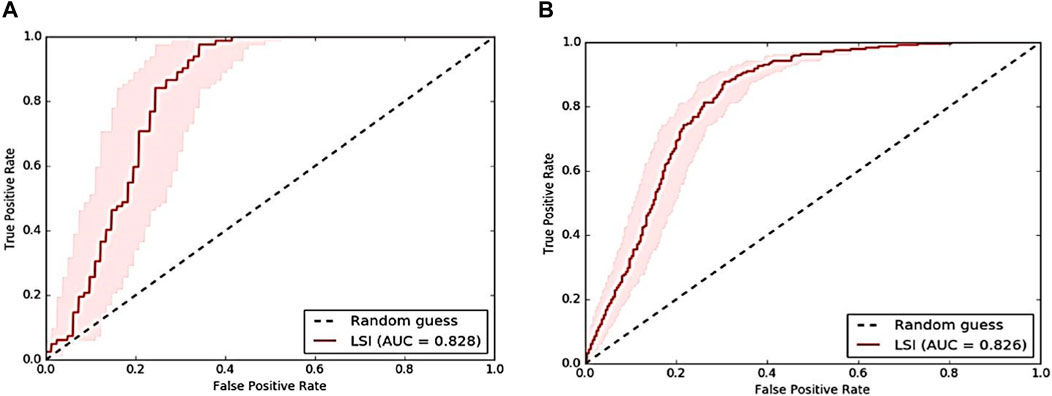
Figure 9. AUC (success rate) of the landside susceptibility maps. (a) FR model. (b) AHP model.
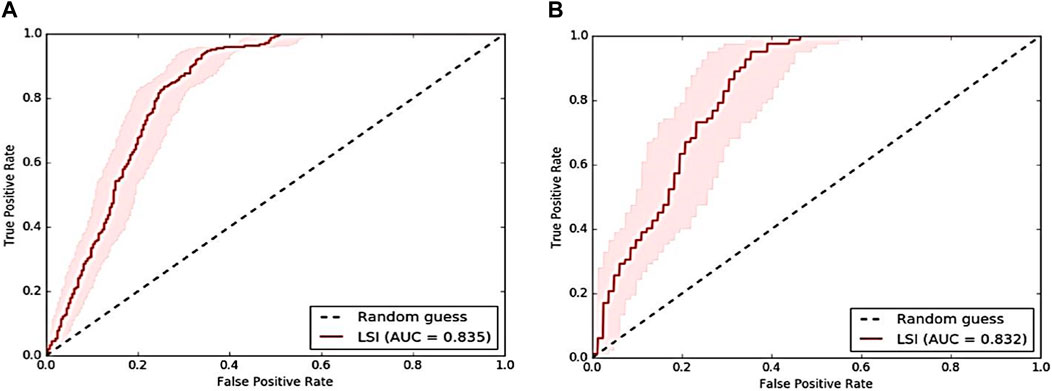
Figure 10. AUC (Prediction rate) of the landside susceptibility maps. (a) FR model. (b) AHP model.
The comparative analysis of the Frequency Ratio (FR) and Analytical Hierarchy Process (AHP) models revealed that the FR model demonstrated superior predictive performance, reflected in its higher success and prediction rates. This advantage aligns with the FR model’s data-driven nature, which objectively quantifies landslide susceptibility based on historical occurrences. In contrast, the AHP model, while slightly less precise, provides valuable flexibility through expert-driven pairwise comparisons, enabling the integration of domain knowledge into susceptibility assessments. Despite the marginal performance edge of the FR model, both approaches proved highly effective in identifying landslide-prone areas. The strengths of each suggest that a hybrid modeling approach, integrating the statistical robustness of FR with the structured decision-making framework of AHP, could further enhance predictive accuracy and resilience in landslide susceptibility assessments. This integrated approach would allow for better calibration across diverse terrains while retaining interpretability and adaptability for regions with limited geospatial data. In the Debek region, slope material and proximity to springs emerged as the most significant conditioning factors, underscoring the role of lithological weaknesses and groundwater dynamics in slope instability. These findings align with previous studies in highland environments, where subsurface hydrology and geological composition often drive landslide occurrences. However, susceptibility factors may vary across regions, influenced by localized conditions such as seismic activity, deforestation, or seasonal precipitation extremes. This highlights the importance of site-specific recalibration when applying these models to other areas.
The increasing exploration of hybrid approaches in geospatial modeling further emphasizes the potential of combining FR and AHP with machine learning (ML) techniques. Advanced classifiers such as Random Forest and Support Vector Machines offer high classification accuracy but typically require extensive training datasets and computational resources. By integrating FR and AHP with ML-based models, future studies could refine susceptibility mapping while maintaining interpretability in data-scarce environments. Recognizing the potential of hybrid methodologies, future research should explore ensemble modeling techniques, sensitivity analyses, and region-specific calibrations to enhance the robustness and applicability of landslide susceptibility assessments. Additionally, advancements in remote sensing technologies, such as high-resolution LiDAR and Synthetic Aperture Radar (SAR), can further improve landslide inventories by enabling real-time terrain monitoring. Ultimately, the landslide susceptibility maps generated through this study provide valuable resources for disaster susceptibility reduction, land-use planning, and infrastructure development in Ethiopia. By identifying high-susceptibility zones, these maps empower decision-makers to prioritize mitigation measures, such as slope stabilization, early warning systems, and sustainable land-use practices. Collaboration with regional authorities and disaster management agencies is underway to integrate these findings into national hazard management frameworks, ensuring that both existing and future developments account for landslide susceptibility.
The successful validation of both the Frequency Ratio (FR) and Analytical Hierarchy Process (AHP) models underscores their significant potential for advancing disaster susceptibility management, land-use planning, and hazard mitigation in mountainous regions like Debek. The generated landslide susceptibility maps offer critical insights that can guide decision-making in land development, infrastructure planning, and environmental conservation. By identifying high-susceptibility areas, policymakers and stakeholders can implement targeted susceptibility mitigation strategies, including early warning systems, land-use regulations, and engineering interventions aimed at reducing the socio-economic and environmental impacts of landslides. A key implication of this study is the necessity of integrating landslide susceptibility assessments into comprehensive susceptibility management frameworks. Proactive measures can significantly enhance community resilience and reduce the adverse effects of landslides. Slope stabilization techniques, such as vetiver grass planting, terracing, and check dams, can reinforce vulnerable slopes and minimize soil erosion. Simultaneously, reforestation efforts using native vegetation can restore degraded landscapes, improve soil stability, and reduce surface runoff. Moreover, land-use zoning policies should restrict agricultural expansion and construction activities in high-susceptibility zones to prevent further land degradation and exposure to hazards.
The establishment of community-based early warning systems is equally crucial, enabling timely alerts during heavy rainfall events and facilitating rapid evacuation. Infrastructure planning should also incorporate landslide susceptibility considerations, ensuring the design and construction of roads, bridges, and buildings with proper drainage systems, soil retention structures, and resilient materials. Such integrated approaches can significantly mitigate landslide susceptibility s while promoting sustainable development in vulnerable regions. While the current models demonstrate strong predictive capabilities, future research should focus on enhancing their accuracy by integrating additional dynamic factors known to influence landslide occurrence. These include rainfall intensity, soil moisture, and seismic activity, which can provide more comprehensive susceptibility assessments. Moreover, the incorporation of detailed temporal datasets would enable the development of models that are responsive to changing environmental conditions, improving their utility for real-time susceptibility management. Long-term monitoring through remote sensing technologies and field-based assessments would further strengthen the understanding of landslide susceptibility evolution over time. Additionally, evaluating the impact of land-use changes, such as urban expansion and agricultural intensification, could refine susceptibility predictions and inform adaptive land management strategies. Collaboration between researchers, policymakers, and local communities will be essential in ensuring the successful implementation of these approaches.
This study demonstrates the effectiveness of geospatial modeling in assessing landslide susceptibility in Debek, South Wollo, Ethiopia, by comparing the Frequency Ratio (FR) and Analytical Hierarchy Process (AHP) models. Through the integration of topographical, geological, hydrological, and anthropogenic factors, the analysis identified slope material and proximity to springs as the most significant contributors to landslide susceptibility. The FR model exhibited slightly superior performance, achieving an ROC success rate of 0.828 and a prediction rate of 0.835, compared to the AHP model’s success and prediction rates of 0.826 and 0.832, respectively. The final Landslide Susceptibility Map revealed a spatially diverse distribution of landslide susceptibility, with 22.53% of the study area classified under the “Very High” susceptibility category and 41.18% falling within the “Very Low” susceptibility category. These findings emphasize the urgent need for targeted mitigation strategies in high-susceptibility zones, including slope stabilization, reforestation, and land-use zoning to limit human activity in vulnerable areas. Moreover, the study underscores the critical role of GIS-based approaches in natural hazard management, offering policymakers and stakeholders valuable insights for informed decision-making. The integration of susceptibility maps into land-use planning, early warning systems, and infrastructure development can significantly reduce landslide hazards. Future research should focus on incorporating real-time monitoring systems and climate change projections to further refine susceptibility assessments and enhance geosusceptibility mitigation efforts. By advancing the understanding of landslide dynamics in the Ethiopian highlands, this study reinforces the pivotal role of geospatial modeling in strengthening disaster resilience and promoting sustainable development in landslide-prone regions.
1. Enhanced Data Integration: Future studies should integrate additional conditioning and triggering factors, such as rainfall intensity, soil moisture content, and seismic activity, to improve the accuracy and predictive power of landslide susceptibility models.
2. Monitoring and Early Warning Systems: Implementing real-time monitoring systems and early warning mechanisms in high-susceptibility areas can help mitigate landslide susceptibility s and reduce the impact on vulnerable communities.
3. Vegetative and Engineering Stabilization: Promote the use of vegetation-based stabilization techniques and engineering interventions (e.g., retaining walls, terracing) in steep and high-susceptibility areas to reduce slope instability and soil erosion.
4. Community Engagement and Education: Engage local communities in landslide susceptibility reduction through awareness campaigns, capacity building, and participatory land-use planning initiatives.
5. Policy and Land-Use Planning: Incorporate landslide susceptibility maps into regional and national land-use planning frameworks, ensuring that infrastructure development in high-susceptibility areas is minimized or accompanied by appropriate mitigation strategies.
6. Interdisciplinary Collaboration: Foster collaboration between geologists, hydrologists, engineers, and policymakers to develop integrated, multidisciplinary approaches for landslide susceptibility assessment and mitigation.
7. Long-Term Research and Modeling: Encourage long-term studies and continuous refinement of FR and AHP models, leveraging advancements in remote sensing, machine learning, and big data analytics to enhance the reliability of landslide susceptibility assessments.
By adopting these recommendations, stakeholders can reduce the adverse impacts of landslides, protect communities and infrastructure, and promote sustainable land management practices in landslide-prone regions such as Debek, South Wollo. By adopting these recommendations, stakeholders can reduce the adverse impacts of landslides, protect communities and infrastructure, and promote sustainable land management practices in landslide-prone regions such as Debek, South Wollo.
The original contributions presented in the study are included in the article/supplementary material, further inquiries can be directed to the corresponding author.
AA: Conceptualization, Data curation, Formal Analysis, Investigation, Methodology, Project administration, Software, Supervision, Validation, Writing–original draft, Writing–review and editing. DT: Conceptualization, Investigation, Methodology, Writing–original draft. TS: Data curation, Investigation, Supervision, Visualization, Writing–original draft. BM: Conceptualization, Formal Analysis, Investigation, Methodology, Writing–original draft, Writing–review and editing.
The author(s) declare financial support was received for the research, authorship, and/or publication of this article. Mekdela Amba University is acknowledged for providing the complete funding for this research.
We would like to thank Mekdela Amba University for full funding of finance required for this research. We sincerely thank the residents who graciously hosted us during our field work. Their warm hospitality and support were invaluable and greatly appreciated.
The authors declare that the research was conducted in the absence of any commercial or financial relationships that could be construed as a potential conflict of interest.
The author(s) declare that no Generative AI was used in the creation of this manuscript.
All claims expressed in this article are solely those of the authors and do not necessarily represent those of their affiliated organizations, or those of the publisher, the editors and the reviewers. Any product that may be evaluated in this article, or claim that may be made by its manufacturer, is not guaranteed or endorsed by the publisher.
Abay, A., Barbieri, G., and Woldearegay, K. (2019). GIS-Based landslide susceptibility evaluation using analytical hierarchy process (AHP) approach: the case of tarmaber district, Ethiopia. J. Sci 11, 14–36. doi:10.4314/mejs.v11i1.2
Ali, A. (2024). Landslide susceptibility mapping using modified frequancy ratio method in Correb area, South Wollo, North-Western Ethiopia. Discov. Geosci. 2 (1), 45. doi:10.1007/s44288-024-00053-x
Ali, Y., Gugsa, T. H., and Raghuvanshi, T. K. (2024). GIS-based statistical analysis for landslide susceptibility evaluation and zonation mapping: a case from Blue Nile Gorge, Gohatsion-Dejen road corridor, Central Ethiopia. Environ. Challenges 16, 100968. doi:10.1016/j.envc.2024.100968
Althuwaynee, O. F., Pradhan, B., and Lee, S. (2016). A novel integrated model for assessing landslide susceptibility mapping using CHAID and AHP pairwise comparison. Int. J. of Remo. Sens 37 (5), 1190–1209. doi:10.1080/01431161.2016.1148282
Anbalagan, R. (1992). Landslide hazard evaluation and zonation mapping in mountainous terrain. Eng. Geol. 32 (4), 269–277. doi:10.1016/0013-7952(92)90053-2
Ayalew, L., and Yamagishi, H. (2005). The application of GIS-based logistic regression for landslide susceptibility mapping in the Kakuda-Yahiko Mountains, Central Japan. Geomorphology 65 (1-2), 15–31. doi:10.1016/j.geomorph.2004.06.010
Ayele, N. A., Engda, E. M., Terefe, T. T., Leta, E., Reda, T. M., and Jothimani, M. (2025). Geospatial analysis of landslide susceptibility and safe relocation zones: insights from recent disasters in gofa zone, southern Ethiopia. Quat. Sci. Adv. 17, 100272. doi:10.1016/j.qsa.2025.100272
Baral, N., Karna, A. K., and Gautam, S. (2021). Landslide susceptibility assessment using modified frequency ratio model in Kaski District,Nepal. Int.J Eng. Manag.Res 11 (1), 167–177. doi:10.31033/ijemr.11.1.23
Batar, A. K., and Watanabe, T. (2021). Landslide susceptibility mapping and assessment using geospatial platforms and weights of evidence (WoE) method in the Indian Himalayan Region: recent developments, gaps, and future directions. ISPRS Int. J. Geo-Information 10 (3), 114. doi:10.3390/ijgi10030114
Berhane, G., and Tadesse, K. (2021). Landslide susceptibility zonation mapping using statistical index and landslide susceptibility analysis methods: a case study from Gindeberet district, Oromia Regional State, Central Ethiopia. J. Afr. earth Sci. 180, 104240. doi:10.1016/j.jafrearsci.2021.104240
Bishop, A. W. (1955). The use of the slip circle in the stability analysis of slopes. Geotechnique 5 (1), 7–17. doi:10.1680/geot.1955.5.1.7
Calderón-Guevara, W., Sánchez-Silva, M., Nitescu, B., and Villarraga, D. F. (2022). Comparative review of data-driven landslide susceptibility models: case study in the Eastern Andes mountain range of Colombia. Nat. Hazards 113 (2), 1105–1132. doi:10.1007/s11069-022-05339-2
Catani, F., Lagomarsino, D., Segoni, S., and Tofani, V. (2013). Landslide susceptibility estimation by random forests technique: sensitivity and scaling issues. Nat. Hazards Earth Syst. Sci. 13, 2815–2831. doi:10.5194/nhess-13-2815-2013
Cemiloglu, A., Zhu, L., Mohammednour, A. B., Azarafza, M., and Nanehkaran, Y. A. (2023). Landslide susceptibility assessment for Maragheh County, Iran, using the logistic regression algorithm. Land 12 (7), 1397. doi:10.3390/land12071397
Chawla, A., Chawla, S., Pasupuleti, S., Rao, A. C. S., Sarkar, K., and Dwivedi, R. (2018). Landslide susceptibility mapping in darjeeling Himalayas, India. Adv. Civ. Eng. 2018 (1), 6416492. doi:10.1155/2018/6416492
Chen, W., Peng, J., Hong, H., Shahabi, H., Pradhan, B., Liu, J., et al. (2017). Landslide susceptibility modelling using GIS-based machine learning techniques for Chongren County, Jiangxi Province. China. Sci. Total Environ. 626, 1121–1135. doi:10.1016/j.scitotenv.2018.01.124
Chiba, Y., Shaw, R., and Banba, M. (2017). Japan’s experiences of catastrophic mountain disasters in wakayama. Land Use Manag. Disaster Risk Reduct. Pract. Cases a Glob. Perspective, 215–235. doi:10.1007/978-4-431-56442-3_12
Chimidi, G., Raghuvanshi, T. K., and Suryabhagavan, K. V. (2017). Landslide hazard evaluation and zonation in and around Gimbi town, western Ethiopia - a GIS-based statistical approach. Appl. Geomat. 9, 219–236. doi:10.1007/s12518-017-0195-x
Dahal, R. K., Hasegawa, S., Nonomura, A., Yamanaka, M., Dhakal, S., and Paudyal, P. (2008). Predictive modelling of rainfall-induced landslide hazard in the Lesser Himalaya of Nepal based on weights-of-evidence. Geomorphology 102 (3-4), 496–510. doi:10.1016/j.geomorph.2008.05.041
Dai, F. C., and Lee, C. F. (2002). Landslide characteristics and slope instability modeling using GIS, Lantau Island, Hong Kong. Geomorph 42, 213–228. doi:10.1016/s0169-555x(01)00087-3
El Jazouli, A., Barakat, A., and Khellouk, R. (2019). GIS-multicriteria evaluation using AHP for landslide susceptibility mapping in Oum Er Rbia high basin (Morocco). J. geoenvi. Disa 6 (3), 3–12. doi:10.1186/s40677-019-0119-7
Food and Agriculture Organization (FAO) (1986). Soil map of the world: revised legend. Rome, Italy: FAO. Available online at: https://www.fao.org/soils-portal/ (Accessed March 10, 2023).
Gariano, S. L., and Guzzetti, F. (2016). Landslides in a changing climate. Earth-science Rev. 162, 227–252. doi:10.1016/j.earscirev.2016.08.011
Gautam, P., Kubota, T., Sapkota, L. M., and Shinohara, Y. (2021). Landslide susceptibility mapping with GIS in high mountain area of Nepal: a comparison of four methods. Environ. Earth Sci. 80 (9), 359. doi:10.1007/s12665-021-09650-2
Geological Survey of Ethiopia (2010). Lithological data of Ethiopia. Geological Survey of Ethiopia: Addis Ababa, Ethiopia. Available online at: https://www.mom.gov.et (Accessed November 16, 2023).
Guzzetti, F., Mondini, A. C., Cardinali, M., Fiorucci, F., Santangelo, M., and Chang, K. T. (2012). Landslide inventory maps: New tools for an old problem. Earth-Science Rev. 112 (1-2), 42–66. doi:10.1016/j.earscirev.2012.02.001
He, Q., Jiang, Z., Wang, M., and Liu, K. (2021). Landslide and wildfire susceptibility assessment in Southeast Asia using ensemble machine learning methods. Remote Sens. 13 (8), 1572. doi:10.3390/rs13081572
Hosseini, K., Reindl, L., Raffl, L., Wiedemann, W., and Holst, C. (2023). 3D landslide monitoring in high spatial resolution by feature tracking and histogram analyses using laser scanners. Remote Sens. 16 (1), 138. doi:10.3390/rs16010138
Intarawichian, N., and Dasananda, S. (2011). Frequency ratio model based landslide susceptibility mapping in lower Mae Chaem watershed, Northern Thailand. Earth. Sci. 64, 2271–2285. doi:10.1007/s12665-011-1055-3
Jaiswal, P., and van Westen, C. J. (2013). Use of quantitative landslide hazard and risk information for local disaster risk reduction along a transportation corridor: a case study from Nilgiri district, India. Nat. hazards 65, 887–913. doi:10.1007/s11069-012-0404-1
Juliev, M., Mergili, M., Mondal, I., Nurtaev, B., Pulatov, A., and Hübl, J. (2019). Comparative analysis of statistical methods for landslide susceptibility mapping in the Bostanlik District, Uzbekistan. Sci. total Environ. 653, 801–814. doi:10.1016/j.scitotenv.2018.10.431
Kohno, M., and Higuchi, Y. (2023). Landslide susceptibility assessment in the Japanese archipelago based on a landslide distribution map. ISPRS Int. J. Geo-Information 12 (2), 37. doi:10.3390/ijgi12020037
Kumar, C., Walton, G., Santi, P., and Luza, C. (2023). An ensemble approach of feature selection and machine learning models for regional landslide susceptibility mapping in the arid mountainous terrain of Southern Peru. Remote Sens. 15 (5), 1376. doi:10.3390/rs15051376
Kumar, R., and Anbalagan, R. (2015). Landslide susceptibility zonation in part of Tehri reservoir region using frequency ratio, fuzzy logic and GIS. Sci 124 (2), 431–448. doi:10.1007/s12040-015-0536-2
Kumar, R., and Anbalagan, R. (2016). Landslide susceptibility mapping using analytical hierarchy process (AHP) in tehri reservoir rim region, uttarakhand. J. Geol. Soc. india 87, 271–286. doi:10.1007/s12594-016-0395-8
Leonard, J. S., Whipple, K. X., and Heimsath, A. M. (2023). Isolating climatic, tectonic, and lithologic controls on mountain landscape evolution. Sci. Adv. 9 (3), eadd8915. doi:10.1126/sciadv.add8915
Leonardi, G., Palamara, R., Manti, F., and Tufano, A. (2022). GIS-multicriteria analysis using AHP to evaluate the landslide susceptibility in road lifelines. Appl. Sci. 12 (4707), 2–19. doi:10.3390/app12094707
Li, L., Lan, H., Guo, C., Zhang, Y., Li, Q., and Wu, Y. (2016). A modified frequency ratio method for landslide susceptibility assessment: landslide. Landslides 14 (2), 727–741. doi:10.1007/s10346-016-0771-x
Liu, Y., Deng, Z., and Wang, X. (2021). The effects of rainfall, soil type and slope on the processes and mechanisms of rainfall-induced shallow landslides. Appl. Sci. 11 (24), 11652. doi:10.3390/app112411652
Luzon, P. K., Montalbo, K., Galang, J., Sabado, J. M., Escape, C. M., Felix, R., et al. (2016). Hazard mapping related to structurally controlled landslides in Southern Leyte, Philippines. Nat. Hazards Earth Syst. Sci. 16 (3), 875–883. doi:10.5194/nhess-16-875-2016
Malet, J. P., Maquaire, O., and Calais, E. (2002). The use of Global Positioning System techniques for the continuous monitoring of landslides: application to the Super-Sauze earthflow (Alpes-de-Haute-Provence, France). Geomorphology 43 (1-2), 33–54. doi:10.1016/s0169-555x(01)00098-8
Mandal, S. P., Chakrabarty, A., and Maity, P. (2018). Comparative evaluation of information value and frequency ratio in landslide susceptibility analysis along national highways of Sikkim Himalaya. Spat. Inf. Res. 26, 127–141. doi:10.1007/s41324-017-0160-0
Mao, Y., Li, Y., Teng, F., Sabonchi, A. K., Azarafza, M., and Zhang, M. (2024). Utilizing hybrid machine learning and soft computing techniques for landslide susceptibility mapping in a Drainage Basin. Water 16 (3), 380. doi:10.3390/w16030380
Mekonnen, A. A., Raghuvanshi, T. K., Suryabhagavan, K. V., and Kassawmar, T. (2022). GIS-based landslide susceptibility zonation and risk assessment in complex landscape: a case of Beshilo watershed, northern Ethiopia. Environ. Challenges 8, 100586. doi:10.1016/j.envc.2022.100586
Mengstie, L., Nebere, A., Jothimani, M., and Taye, B. (2024). Landslide susceptibility assessment in Addi Arkay, Ethiopia using GIS, remote sensing, and AHP. Quat. Sci. Adv. 15, 100217. doi:10.1016/j.qsa.2024.100217
Mewa, G., and Mengistu, F. (2022). Assessment of landslide susceptibility in Ethiopia: distributions, causes, and impacts.
Mohammady, M., Pourghasemi, H. R., and Pradhan, B. (2012). Landslide susceptibility mapping at Golestan Province, Iran: a comparison between frequency ratio, Dempster–Shafer, and weights-of-evidence models. J. Asian Earth Sci 60, 221–236. doi:10.1016/j.jseaes.2012.10.005
Mohammednur, R. S., Deribew, K. T., Moisa, M. B., and Gemeda, D. O. (2024). Landslide susceptibility zonation mapping using geospatial technologies and multi criteria evaluation techniques in the upper Didessa sub-basin, Southwest Ethiopia. Geol. Ecol. Landscapes, 1–15. doi:10.1080/24749508.2024.2395205
Montgomery, D. R., and Dietrich, W. E. (1994). A physically based model for the topographic control on shallow landsliding. Water Resour. Res. 30 (4), 1153–1171. doi:10.1029/93wr02979
Nanehkaran, Y. A., Chen, B., Cemiloglu, A., Chen, J., Anwar, S., Azarafza, M., et al. (2023). Riverside landslide susceptibility overview: leveraging artificial neural networks and machine learning in accordance with the United Nations (UN) sustainable development goals. Water 15 (15), 2707. doi:10.3390/w15152707
Nanehkaran, Y. A., Mao, Y., Azarafza, M., Kockar, M. K., and Zhu, H. H. (2021). Fuzzy-based multiple decision method for landslide susceptibility and hazard assessment: a case study of Tabriz, Iran. Geomechanics Eng. 24 (5), 407–418. doi:10.12989/gae.2021.24.5.407
Nohani, E., Moharrami, M., Sharafi, S., Khosravi, K., Pradhan, B., Pham, B. T., et al. (2019). Landslide susceptibility mapping using different GIS-based bivariate models. Water 11 (1402), 1402–1422. doi:10.3390/w11071402
Pardeshi, S. D., Autade, S. E., and Pardeshi, S. S. (2013). Landslide hazard assessment: recent trends and techniques. SpringerPlus 2 (523), 523–611. doi:10.1186/2193-1801-2-523
Petley, D. N., Hearn, G. J., Hart, A., Rosser, N. J., Dunning, S. A., Oven, K., et al. (2007). Trends in landslide occurrence in Nepal. Nat. hazards 43, 23–44. doi:10.1007/s11069-006-9100-3
Pourghasemi, H. R., Pradhan, B., Gokceoglu, C., Mohammadi, M., and Moradi, H. R. (2013). Application of weights-of-evidence and certainty factor models and their comparison in landslide susceptibility mapping at Haraz watershed, Iran. Arabian J. Geosciences 6, 2351–2365. doi:10.1007/s12517-012-0532-7
Pourghasemi, H. R., and Rahmati, O. (2018). Prediction of the landslide susceptibility: which algorithm, which precision? Catena 162, 177–192. doi:10.1016/j.catena.2017.11.022
Raghuvanshi, T. K., Negassa, L., and Kala, P. M. (2015). GIS based grid overlay method versus modeling approach – a comparative study for landslide hazard zonation (LHZ) in Meta Robi District of West Showa Zone in Ethiopia. Egypt. J. remo. Sens. space sci 18 (2), 235–250. doi:10.1016/j.ejrs.2015.08.001
Rahman, G., Bacha, A. S., Ul Moazzam, M. F., Rahman, A. U., Mahmood, S., Almohamad, H., et al. (2022). Assessment of landslide susceptibility, exposure, vulnerability, and risk in shahpur valley, eastern hindu kush. Front. Earth Sci. 10, 953627. doi:10.3389/feart.2022.953627
Ramesh, V., and Anbalagan, S. (2015). Landslide susceptibility mapping along Kolli hills Ghat road section (India) using frequency ratio, relative effect and fuzzy logic models. Envi. Earth. Sci 73, 8009–8802. doi:10.1007/s12665-014-3954-6
Ray, R. L., and Lazzari, M. (2020). “Introductory chapter: importance of investigating landslide hazards,” in Landslides-investigation and monitoring (London, United Kingdom: IntechOpen).
Regmi, A. D., Devkota, K. C., Yoshida, K., Pradhan, B., Pourghasemi, H. R., Kumamoto, T., et al. (2014). Application of frequency ratio, statistical index, and weights-of-evidence models and their comparison in landslide susceptibility mapping in Central Nepal Himalaya. Arab. J. Geosci. 7, 725–742. doi:10.1007/s12517-012-0807-z
Reichenbach, P., Rossi, M., Malamud, B. D., Mihir, M., and Guzzetti, F. (2018). A review of statistically-based landslide susceptibility models. Earth Sci. Rev. 180, 60–91. doi:10.1016/j.earscirev.2018.03.001
Rosi, A., Frodella, W., Nocentini, N., Caleca, F., Havenith, H. B., Strom, A., et al. (2023). Comprehensive landslide susceptibility map of Central Asia. Nat. Hazards Earth Syst. Sci. 23 (6), 2229–2250. doi:10.5194/nhess-23-2229-2023
Saaty, T. (1990). How to make a decision: the analytic hierarchy process. Eur. J. Operational Res. 48, 9–26. doi:10.1016/0377-2217(90)90057-i
Saaty, T. (2000). The fundamentals of decision making and priority theory with the analytical hierarchy process. New York: McGraw Hill Publishers.
Schlögl, M., Spiekermann, R., and Steger, S. (2025). Towards a holistic assessment of landslide susceptibility models: insights from the Central Eastern Alps. Environ. Earth Sci. 84 (4), 113. doi:10.1007/s12665-024-12041-y
Schuster, R. L. (1986). Landslide dams: processes risk and mitigation. Am. Soc. Civ. Engeneers Geothecnical Special Pubblication 3, 163.
Shano, L., Raghuvanshi, T. K., and Meten, M. (2022). Fuzzy set theory and pixel-based landslide risk assessment: the case of Shafe and Baso catchments, Gamo highland, Ethiopia. Earth Sci. Inf. 15 (2), 993–1006. doi:10.1007/s12145-022-00774-y
Shano, L., Raghuvanshi, T. K., and Meten, T. (2021). Landslide susceptibility mapping using frequency ratio model: the case of Gamo highland, South Ethiopia. Arab.J.of Geosci. 14 (623), 623–718. doi:10.1007/s12517-021-06995-7
Sharma, A., and Sandhu, H. A. S. (2024). Investigating the dynamic nature of landslide susceptibility in the Indian Himalayan region. Environ. Monit. Assess. 196 (3), 257. doi:10.1007/s10661-024-12440-5
Sidle, R. C., Ziegler, A. D., Negishi, J. N., Nik, A. R., Siew, R., and Turkelboom, F. (2006). Erosion processes in steep terrain—truths, myths, and uncertainties related to forest management in Southeast Asia. For. Ecol. Manag. 224 (1-2), 199–225. doi:10.1016/j.foreco.2005.12.019
Sifa, S. F., Mahmud, T., Tarin, M. A., and Haque, D. M. E. (2019). Event-based landslide susceptibility mapping using weights of evidence (WoE) and modified frequency ratio (MFR) model: a case study of Rangamati district in Bangladesh. Geol.Eco. landscapes 4, 222–235. doi:10.1080/24749508.2019.1619222
Silalahi, F. E. S. P., Arifanti, Y., and Hidayat, F. (2019). Landslide susceptibility assessment using frequency ratio model in Bogor, West Java, Indonesia. Geosci. Lett. 6 (10), 1–17. doi:10.1186/s40562-019-0140-4
Tang, Y., Che, A., Cao, Y., and Zhang, F. (2020). Risk assessment of seismic landslides based on analysis of historical earthquake disaster characteristics. Bull. Eng. Geol. Environ. 79 (5), 2271–2284. doi:10.1007/s10064-019-01716-7
Tsangaratos, P., and Rozos, D.(2013). Producing landslide susceptibility maps by applying expert knowledge in a GIS—based environment. Bull. Geol. Soc.,47:1539–1549. doi:10.12681/bgsg.10993
Valdes Carrera, A. C., Mendoza, M. E., Allende, T. C., and Macías, J. L. (2023). A review of recent studies on landslide hazard in Latin America. Phys. Geogr. 44 (3), 243–286. doi:10.1080/02723646.2021.1978372
Vargas, L. (1990). An overview of the analytic hierarchy process and its applications. Eur. J. Operational Res. 48, 2–8. doi:10.1016/0377-2217(90)90056-H
Varnes, D. J. (1984). “Landslide hazard zonation: a review of principles and practice,” in Natural hazards. Paris: UNESCO.
Wubalem, A. (2021). Landslide susceptibility mapping using statistical methods in Uatzau catchment area, northwestern Ethiopia. Geoenvironmental Disasters 8 (1), 1. doi:10.1186/s40677-020-00170-y
Wubalem, A., Getahun, B., Hailemariam, Y., Mesele, A., Tesfaw, G., Dawit, Z., et al. (2022). Landslide susceptibility modeling using the index of entropy and frequency ratio method from Nefas-Mewcha to Weldiya Road Corridor, Northwestern Ethiopia. Geotechnical Geol. Eng. 40 (10), 5249–5278. doi:10.1007/s10706-022-02214-6
Youssef, K., Shao, K., Moon, S., and Bouchard, L. S. (2023). Landslide susceptibility modeling by interpretable neural network. Commun. Earth and Environ. 4 (1), 162. doi:10.1038/s43247-023-00806-5
Keywords: analytical hierarchy process (AHP), frequency ratio (FR) model, geohazards and georisks, geospatial modeling, landslide susceptibility mapping, natural hazard mitigation
Citation: Ali A, Teku D, Sisay T and Mihret B (2025) Geospatial modeling of landslide susceptibility in Debek, South Wollo, Ethiopia: comparative analysis of frequency ratio and analytical hierarchy process models for geohazards management. Front. Earth Sci. 13:1557860. doi: 10.3389/feart.2025.1557860
Received: 09 January 2025; Accepted: 04 March 2025;
Published: 24 March 2025.
Edited by:
Hong-Hu Zhu, Nanjing University, ChinaReviewed by:
Mohammad Azarafza, University of Tabriz, IranCopyright © 2025 Ali, Teku, Sisay and Mihret. This is an open-access article distributed under the terms of the Creative Commons Attribution License (CC BY). The use, distribution or reproduction in other forums is permitted, provided the original author(s) and the copyright owner(s) are credited and that the original publication in this journal is cited, in accordance with accepted academic practice. No use, distribution or reproduction is permitted which does not comply with these terms.
*Correspondence: Alemnew Ali, YWxlbW5ld2FsaTI5QGdtYWlsLmNvbQ==; Degfie Teku, ZGVnZmllMjAyM0BnbWFpbC5jb20=;
Disclaimer: All claims expressed in this article are solely those of the authors and do not necessarily represent those of their affiliated organizations, or those of the publisher, the editors and the reviewers. Any product that may be evaluated in this article or claim that may be made by its manufacturer is not guaranteed or endorsed by the publisher.
Research integrity at Frontiers
Learn more about the work of our research integrity team to safeguard the quality of each article we publish.