
94% of researchers rate our articles as excellent or good
Learn more about the work of our research integrity team to safeguard the quality of each article we publish.
Find out more
ORIGINAL RESEARCH article
Front. Earth Sci., 03 April 2025
Sec. Geohazards and Georisks
Volume 13 - 2025 | https://doi.org/10.3389/feart.2025.1556612
 Jinrong Cao1*†
 Linming Dou1*Xiufeng Zhang2Siyuan Gong1Yueyong Han2Guoying Li2Chuancheng Liu3Yang Chen2
The control of mining-induced seismicity caused by hard and extremely thick rock stratum (HETRS) has become an important topic in more and more coal mines. This study investigates the mechanisms of mining-induced seismicity through a discrete element numerical model (UDEC-Trigon) calibrated with field data from the Dongtan Coal Mine, China. The failure process of HETRS was categorized into three stages: deformation (Stage I), initial fracture (Stage II), and periodic fracture (Stage III). In the initial fracture stage, the change of vertical displacement is 4.33 m, the change of vertical stress is 26.21 MPa, and the change of seismic energy is 1.91E8 J. The change values during the initial fracture are the largest. A novel method was developed to dynamically track seismic events, identifying tensile failures in central HETRS and shear failures along interfaces. The total decrement of gravitational potential energy is 2.27E10J. The total increment of shear dissipation energy, plastic strain energy and mining-induced seismic energy are 1.16E9J, 1.49E9J and 2.84E10J. Therefore, in addition to elastic energy, gravitational potential energy is also the main source of mining-induced seismic energy and dissipation energy. The mining-induced seismicity energy comes from the fractured strata as well as the surrounding rock. The results provide a unique perspective to understand the mechanism of mining-induced seismicity triggered by HETRS.
As one of the human-induced seismic events, the mining-induced seismicity has gradually increased in underground coal mining (Foulger et al., 2018; Pan et al., 2024). Seismic events caused potential risks to both underground structures (Keneti and Sainsbury, 2018; Lurka, 2024; Zhang et al., 2017; Khan et al., 2023a; Cao et al., 2023a) and buildings on the ground (Li et al., 2007; Lednická and Kaláb, 2016; Kuzniar and Tatara, 2022). In China, mining-induced seismicity have become a major factor in the decrease in coal production in some coal mines in Inner Mongolia, Shandong Province, Shaanxi Province, and other areas. On 8 April 2018, a mining-induced seismic event (ML = 2.5) occurred at Menkeqing Coal Mine, causing a coal burst in the roadway. On 2 August 2019, a mining-induced seismic event (ML = 2.0) occurred at Tangshan Coal Mine which was felt in the ground. In 2021, three mining-induced seismicity of ML = 2.0 or greater occurred within 5 months at the Shilawusu Coal Mine. From May 2023 to February 2024, four mining-induced seismicity occurred during the mining process of Hongqinghe Coal Mine. On 12 January 2024, Longwanggou Coal Mine experienced a mining-induced seismicity of ML = 2.1.
The study of mechanisms is the basis for the prediction and prevention of mining-induced seismicity. Stec (2007) studied the mining-induced seismicity mechanisms occurring in the Upper Silesian Coal Basin in Poland, the first type is related to geological structures and the second type is related to mining activities. Alber et al. (2009) classified the mining-induced seismicity in the German Ruhr mining district into three types: fault activation type, residual coal pillar instability type, and stratum rupture type. On the one hand, geological structures have been confirmed as a primary factor in the occurrence of mining-induced seismicity (Li et al., 2024; Marcak and Mutke, 2013). The mechanisms by which geological structures trigger seismic events include the reduction of fault normal stress (Khan et al., 2022) and high horizontal stress induced by synclinal structures (Wang et al., 2024). On the other hand, fracturing of rock strata constitutes another major contributor to mining-induced seismicity. Leake et al. (2017) analyzed the focal mechanisms of 50 mining-induced seismic events, suggesting that some mining-induced seismic events may be related to collapses caused by sudden subsidence of strata. Cao et al. (2018) simulated the evolution of microseismic events during coal mining, showing that the energy of seismic events is directly proportional to the size of fractures in the rock mass. Based on mining practices in Poland, Wojtecki et al. (2021) found that the number and energy of mining-induced seismicity significantly increase during the mining of the second working face compared to the first working face. Bańka et al. (2017) presented a method for estimating changes in strata energy, finding a quantitative relationship between energy changes and mining-induced seismicity.
The regions prone to mining-induced seismicity exhibit strong spatial consistency with stress concentration zones (Abdul-Wahed et al., 2006; Khan et al., 2023b). Orlecka-Sikora (2010) found that the static stress changes caused by coseismic slip play an important role in the occurrence of mining-induced seismicity. Orlecka-Sikora et al. (2012) found a strong correlation between the occurrence of strong mining-induced seismicity and changes in Coulomb stress caused by previous seismic events. Waveform-based inversion has emerged as a critical tool for revealing the mechanisms of mining-induced seismicity. Liu et al. (2024) used regional full-waveform inversion to analyze mining-induced seismicity with a local magnitude of 2.9, showing that the mechanism was the fracture-sliding of a thick and hard roof. Song et al. (2024) analyzed the focal mechanism of mining-induced seismicity using the probabilistic Bayesian inversion method, indicating that the mining-induced seismicity in the roof are mainly tensile or shear failure.
Studies have shown that the failure of hard and extremely thick rock stratum (HETRS) is one of the main driving factors of mining-induced seismicity. A large amount of research has been conducted from the perspective of stress analysis and source focal mechanisms. However, there are fewer analyses of mining-induced seismicity energy. The process of mining-induced seismicity caused by the failure of HETRS and the triggering mechanisms of mining-induced seismicity still need to be explored.
This study focuses on a typical coal mine in China characterized by mining-induced seismicity caused by HETRS, the failure process of HETRS was analyzed using discrete element numerical simulation. The numerical model was established based on the geological and mining conditions of the coal mine, and the parameters were calibrated. Displacement changes and stress evolution due to the fracture of HETRS were analyzed. Crack development and failure types in HETRS were obtained. A new method was developed in numerical simulation to capture the distribution of mining-induced seismic events. Energy changes and transformations during the mining were investigated. The mechanism and energy source of mining-induced seismicity were proposed. The results can provide insights into the prevention and control of mining-induced seismicity caused by the fracture of HETRS.
The Dongtan Coal Mine is located in Shandong Province, China. The entire mining area is divided into seven mining districts, and the main coal seam is the No. 3 coal seam with an average thickness of 6 m. The burial depth of the coal seam at the Dongtan Coal Mine reaches 700 m. The sixth mining district is located in the south of the mining area, covering an area of about 6.9 km2. The sixth mining district is divided into four working faces, namely 6303, 6304, 6305, and 6306 working faces, as shown in Figure 1A. There is a hard and extremely thick rock stratum (HETRS) above the coal seam, with a thickness exceeding 100 m, as shown in Figure 1B. As the goaf area in the sixth mining district increases, a large amount of elastic strain energy accumulates in the HETRS.

Figure 1. Overview of the sixth mining district: (A) Mining layout; (B) Geological profile.
During the mining of the sixth mining district, mining-induced seismicity with a magnitude greater than 2.0 frequently occurred, causing vibrations in surface buildings. When mining of the 6303 working face, 11 mining-induced seismicity were recorded, with a maximum energy of 2.16E6 J. When mining of the 6304 working face, 35 mining-induced seismicity were recorded, with a maximum energy of 8.8E6 J. When mining of the 6305 working face, 55 mining-induced seismicity were recorded, with a maximum energy of 1.45E7 J. Table 1 shows partial mining-induced seismicity during the mining of the six mining district.
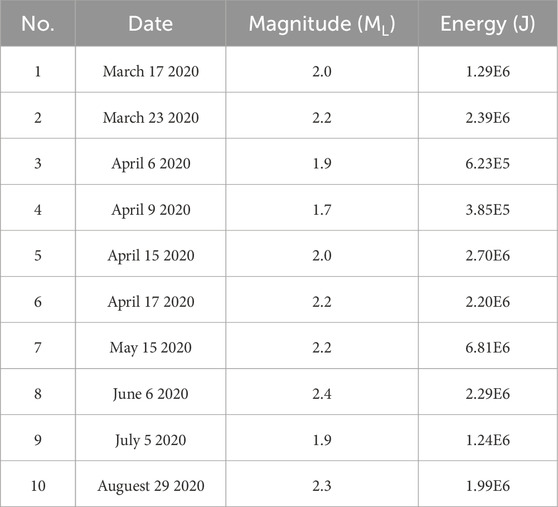
Table 1. Statistics of mining-induced seismicity in the sixth mining district (partial).
According to the records of the micro-seismic monitoring system, the locations of partial mining-induced seismicity are shown in Figure 2. Figure 2A shows the distribution of mining-induced seismicity in the horizontal direction and Figure 2B shows the distribution of mining-induced seismicity in the vertical direction. The mining-induced seismicity exhibits the following characteristics: (1) The mining-induced seismicity are all distributed within the goaf; (2) High-energy mining-induced seismicity with an energy greater than 1E6 J are mostly located in the HETRS outside the 100 m range of the coal seam. The maximum distance between the mining-induced seismicity and the coal seam is 177 m, the minimum distance is 54 m, and the average distance is 106 m.
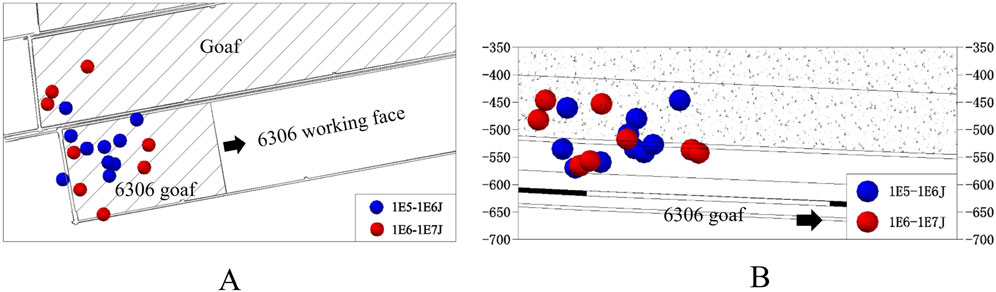
Figure 2. Locations of partial mining-induced seismicity: (A) Plan view; (B) Cross-section view.
The numerical simulations in this study are performed through the Universal Distinct Element Code (UDEC). As shown in Figure 3, the coal and rock mass in the simulation consists of blocks and joints, and the blocks can slide or open along the joints. The deformation and failure of the coal and rock mass are jointly controlled by the blocks and joints. Under stress, the blocks may undergo elastic or plastic deformation. When the stress exceeds the strength limit, the joint surfaces may undergo shear or tensile failure, and the failure criteria are as follows (Itasca Consulting Group Inc, 2014):
(1) Shear failure along the tangential direction of the joint surface: When the shear stress on the joint surface is less than the maximum shear stress, no shear failure occurs. When the shear stress on the joint surface exceeds the maximum shear stress, shear failure occurs. Maximum shear stress on the joint surface is calculated as in Equation 1.
Where
(2) Tensile failure along the normal direction of the joint surface: When the normal stress on the joint surface is less than the tensile strength, no tensile failure occurs; in this case, the normal stress increment can be calculated as in Equation 2. When the normal stress on the joint surface exceeds the tensile strength, tensile failure occurs.
Where
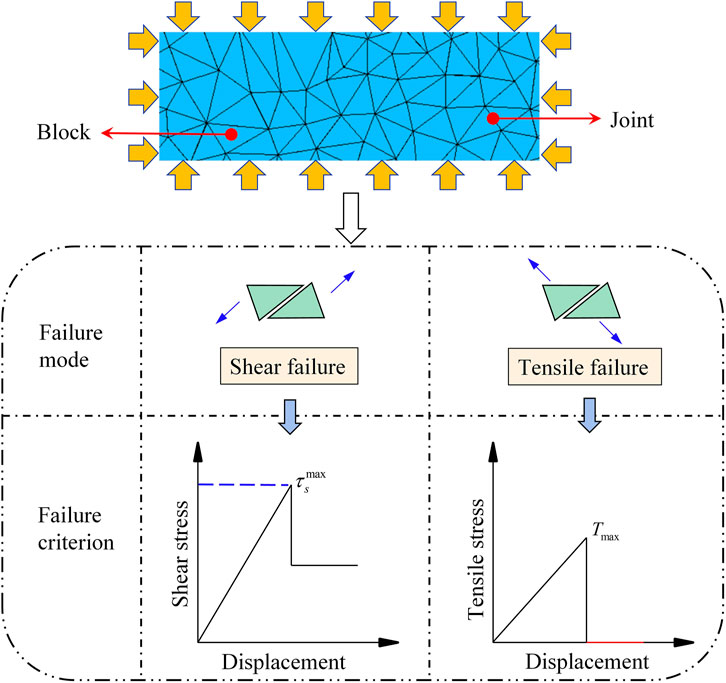
Figure 3. Failure criteria of the numerical model.
According to the geological conditions and mining design of the sixth mining district, a large-scale numerical model was established along the strike direction of the sixth mining district, as shown in Figure 4. Considering the computational cost, only three work faces are included in the numerical model of this study. The total length of the model is 1,160 m, and the total height is 406 m. To reduce the boundary effect on the simulation results, 200 m on the left and right sides of the model were set aside as the boundary area. Three working faces were set in the coal seam from left to right: 6304 working face, 6305 working face, and 6306 working face. The length of each working face is 250 m. From bottom to top, the model was divided into four parts: floor, coal seam, roof in low position (RLP), and HETRS. In UDEC, rectangular blocks, polygonal blocks, and triangular blocks are commonly used. Studies have shown that compared to rectangular and polygonal blocks, triangular blocks have advantages in simulating the brittle failure of rocks and the extension of fractures (Gao and Stead, 2014; Cao, et al., 2023a; Cao, et al., 2023b). Therefore, the coal and rock mass were divided into triangular blocks using the built-in Trigon command, and the model consists of 11,443 blocks, 30,400 elements, and 52,306 nodes. For fine mudstone, siltstone, medium mudstone, and coal, the size of the zone is different. The minimum size of the zone is estimated to be half the size of the block. The block material adopts the Mohr-Coulomb plastic constitutive model, and the joint surface adopts the joint contact-Coulomb slip constitutive model with residual strength. Based on the results of in-situ stress measurements, the initial horizontal and vertical stresses at the bottom of the model are 27 MPa and 18.5 MPa, respectively.
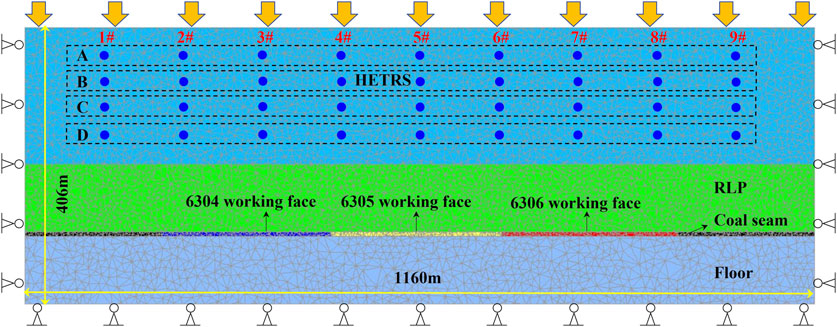
Figure 4. Large-scale numerical model.
The top of the model is a stress boundary, and the other three boundaries are displacement boundaries. The rock layer properties and thicknesses were set according to the borehole data shown in Figure 1B. Four different materials were included in the numerical model, including fine mudstone, siltstone, medium mudstone, and coal. To study the displacement and stress changes at different positions during the entire failure process of the HETRS, four groups of monitoring points were set in the key areas, namely, Group A (upper part of the HETRS), Group B (upper-middle part of the HETRS), Group C (lower-middle part of the HETRS), and Group D (lower part of the HETRS). Each group includes nine monitoring points, numbered from left to right as 1#, 2#, 3#, 4#, 5#, 6#, 7#, 8#, and 9#.
Four steps are included in the calculations, as follows: (1) Initial equilibrium of the numerical model; (2) Excavate the 6304 working face (Stage I), with the calculation divided into 10 steps, and 20,000 cycles are calculated and saved in each step; (3) Excavate the 6305 working face (Stage II), with the calculation divided into 10 steps, and 20,000 cycles are calculated and saved in each step; (4) Excavate the 6306 working face (Stage III), with the calculation divided into 10 steps, and 20,000 cycles are calculated and saved in each step.
Before the numerical calculations start, some values called micro-mechanical parameters should be assigned to the blocks and joints in the model. According to the UDEC 6.0 manual, the bulk and shear moduli of the block are calculated according to Equation 3. The normal and shear stiffnesses of the joint are calculated according to Equation 4. Therefore, some basic mechanical parameters are required. The mechanical parameters of the rock samples obtained from the laboratory are significantly different from those of the in-situ rock mass. Since a large-scale model was developed in this study, we used the following method to convert the mechanical parameters of rock samples obtained from experiments to the mechanical parameters of in-situ rock mass.
The steps for obtaining in situ rock mass mechanical parameters are as follows: (1) Obtain conventional mechanical parameters of standard samples of coal rock, including modulus of elasticity, compressive strength, tensile strength, Poisson’s ratio, cohesion, and friction angle, through a series of experiments in the laboratory. (2) Calculate the modulus of elasticity of the rock mass based on the modulus of elasticity of the rock sample using the RQD method. The RQD–Em/Er relation (see Equation 5) proposed by Zhang and Einstein (2004) based on field monitoring, was applied to estimate the deformation modulus of the rock mass. (3) Calculate the compressive strength of the rock mass based on the compressive strength of the rock sample (see Equation 6). (4) The tensile strength of the rock mass is estimated to be one-tenth of the compressive strength of the rock mass. (5) The Poisson’s ratio, cohesion and friction angle of the rock mass are the same as those of the rock sample.
Where
Where
Where,
Where
The micro-mechanical parameters were validated using the trial-and-error method. By comparing the simulation results of uniaxial compression (Figure 5A) and Brazilian splitting (Figure 5B) with the theoretical calculations, if the error is less than 10%, the parameters used in the model are considered reasonable. The simulation results of uniaxial compression and Brazilian splitting are shown in Figure 5C. The detailed mechanical parameters of the numerical model are shown in Table 2.
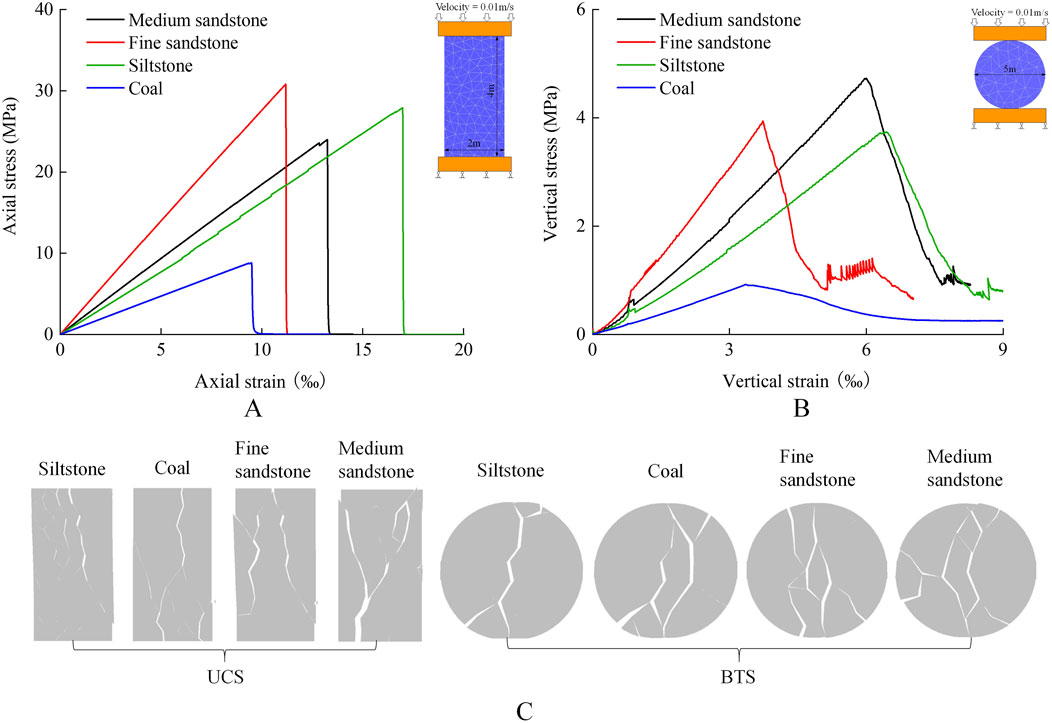
Figure 5. Calibration results of uniaxial compression tests and Brazilian splitting tests: (A) Uniaxial compression (simulated); (B) Brazilian splitting (simulated); (C) Model failure pattern (simulated).

Table 2. Mechanical parameters of UDEC-Trigon numerical model.
Figure 6 shows the vertical displacement changes of the HETRS during the mining process in the sixth mining district. The monitoring points in Group A are set in the upper part of the HETRS, with A-1# representing the 1# monitoring point in Group A, as shown in Figure 6A. The monitoring points in Group D are set in the lower part of the HETRS, with D-1# representing the 1# monitoring point in Group D, as shown in Figure 6B. The locations of the monitoring points are shown in Figure 4. The mining is divided into three stages: Stage I - 6304 working face is mined; Stage II - 6305 working face is mined; Stage III - 6306 working face is mined. As shown in Figure 6, in Stage I, failure did not occur on the HETRS, and the vertical displacement was relatively small, mainly due to the bending and subsidence of the rock layer. In Stage II, the HETRS experienced a large number of fractures, and after the layer failure, it rapidly subsided into the goaf, resulting in a sudden and significant increase in vertical displacement. This stage had the largest displacement increment. In Stage III, as the goaf area increased, the HETRS above the goaf continued to fail and subside, and the displacement increased gradually. The vertical displacement changes can be divided into three segments, representing the three stages of failure of the HETRS: the initial bending stage (Stage I); the initial failure stage (Stage II); and the periodic failure stage (Stage III). Furthermore, the maximum vertical displacements of the monitoring points in the upper part of the HETRS during the three stages mentioned above are 0.47 m, 4.64 m, and 5.57 m, respectively, and the maximum vertical displacements of the monitoring points in the lower part are 0.51 m, 4.72 m, and 5.60 m, respectively, indicating that the displacement of the upper part is less than the lower part, demonstrating the “layered displacement” characteristic of the HETRS failure.
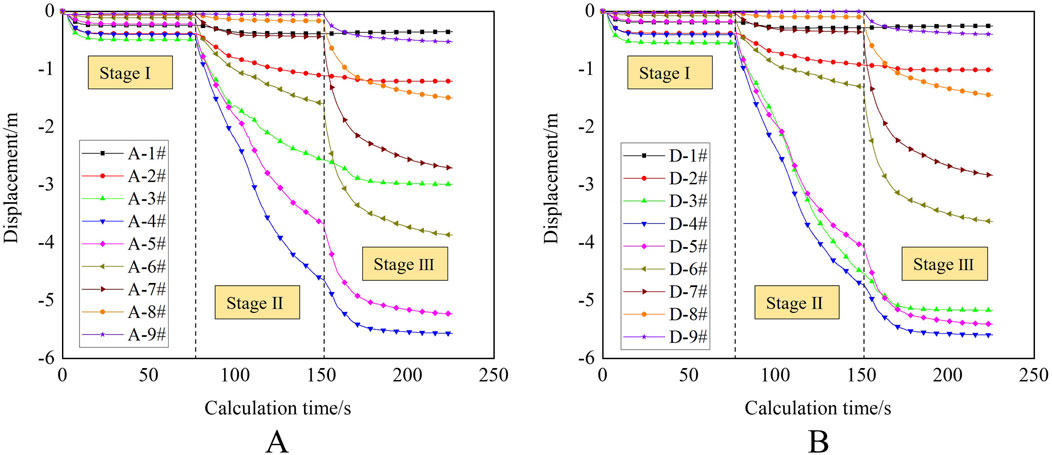
Figure 6. Vertical displacement changes of the HETRS: (A) Displacement in the upper part of the HETRS; (B) Displacement in the lower part of the HETRS.
Figure 7 shows the distribution of the maximum principal stress during the failure process of the HETRS. As shown in Figure 7A, after the excavation of the 6304 working face, stress reduction areas first appear in the RLP and floor above and below the goaf, while stress concentration areas appear in the RLP and floor on both sides of the working face. As the 6305 working face is mined, the goaf area increases, the depressurized area gradually expands and develops into the HETRS, and the lower part of the HETRS first shows stress reduction. At the same time, the peak value of the maximum principal stress in the stress concentration area also gradually increases, and the stress concentration area gradually shifts outward, moving towards the solid coal on both sides of the working face in the horizontal direction and upward in the vertical direction, resulting in a stress concentration area at the interface between the HETRS and RLP, as shown in Figure 7B, indicating that after the failure of the RLP, the horizontal stress and the normal stress at the interface are significantly reduced, the interfacial frictional force is weakened, and a tendency of shear slip occurs, leading to stress increases. As the calculation time increases, the bending deformation of the top of the HETRS increases, and the maximum principal stress also increases significantly, with the maximum principal stress concentration area gradually developing to the upper-middle and upper parts of the HETRS, as shown in Figures 7C, D. After the failure of the HETRS, the goaf is filled and compacted by the fallen roof rock layers, resulting in irregular local stress concentration areas, as shown in Figure 7E. The range of local stress concentration areas in the goaf also gradually increases with the calculation time increases, as shown in Figure 7F.
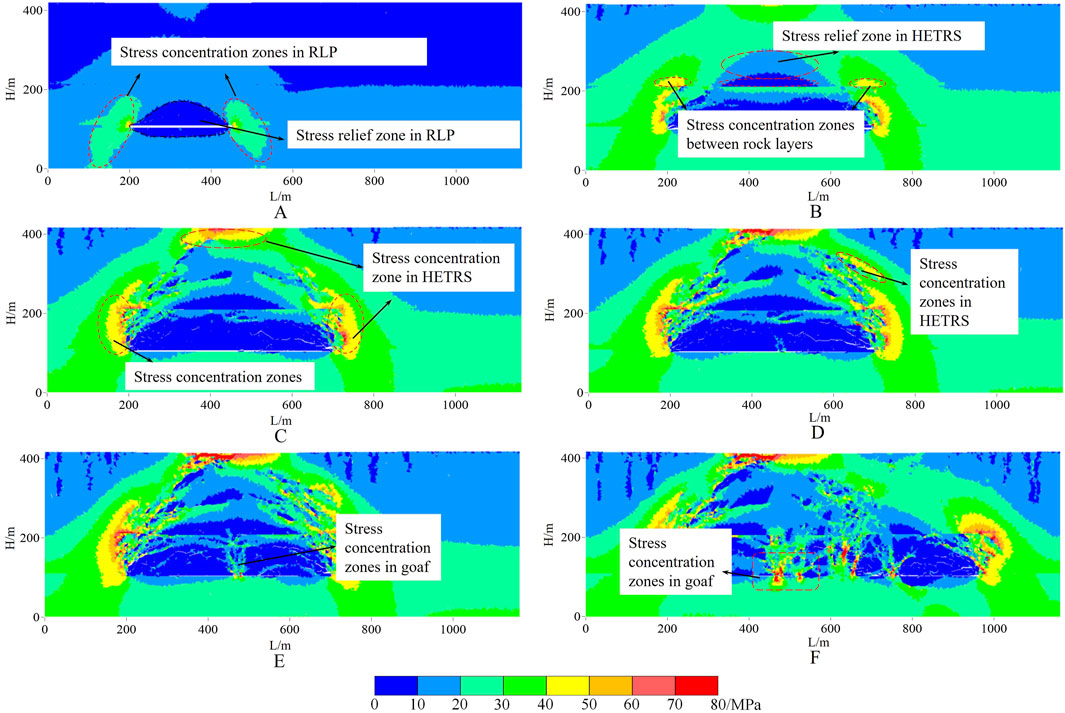
Figure 7. Distribution of the maximum principal stress: (A) 10000 steps, (B) 20000 steps, (C) 30000 steps, (D) 40000 steps, (E) 50000 steps, (F) 60000 steps.
The changes in vertical stress in the upper, upper-middle, lower-middle, and lower parts of the HETRS are shown in Figures 8A–D. Based on the characteristics of stress changes, the vertical stress change process can be divided into three stages: vertical stress disturbance stage, vertical stress drastic adjustment stage, and vertical stress gradual adjustment stage. After the excavation of the 6304 working face, the vertical stress in the HETRS above the goaf is released, and the stress value at the 3# monitoring point decreases. The maximum vertical stresses in the upper, upper-middle, lower-middle, and lower parts of the HETRS are 10.3 MPa, 10.1 MPa, 8.6 MPa, and 6.6 MPa, respectively, and the vertical stress reduction in the lower part of the HETRS is much greater than the upper part. After the excavation of the 6305 working face, the HETRS undergoes the initial failure, and the vertical stress changes drastically, with the vertical stresses of multiple monitoring points in the HETRS above the goaf decreasing, such as the 3#, 4#, and 5# monitoring points, and the vertical stress reduction and stress reduction range of the lower part (Group D) of the HETRS are greater than the upper part (Group A). In addition, the vertical stresses in the overlying rock layers on both sides of the goaf increase, such as the 2# and 6# monitoring points, and the vertical stress increase in the lower part of the HETRS is greater than the upper part, with a higher degree of stress concentration. After the excavation of the 6306 working face, the HETRS enters the periodic failure stage, and the vertical stress changes are relatively stable, entering the gradual adjustment period.

Figure 8. Vertical stress changes in the HETRS: (A) the upper part, (B) the upper-middle part, (C) the lower-middle part, (D) the lower part.
In summary, during the mining in the sixth mining district, the HETRS did not fail after the first working face was mined, and the stress changes were the smallest. After the second working face was mined, the HETRS underwent the initial failure, and the stress changes were the largest. After the third working face was mined, the HETRS underwent periodic failure, and the stress changes were relatively small. The stress changes in the upper, upper-middle, lower-middle, and lower parts of the HETRS are not synchronous, and do not occur simultaneously in terms of increase or decrease, indicating that the HETRS does not fail all at once, but rather show a layered fracture characteristic. The “layered fracture characteristics” refers to the progressive failure of the HETRS across its thickness due to differential stress distribution, rather than instantaneous collapse.
Figure 9 shows the distribution of cracks in the coal and rock mass during the mining process, with blue representing tensile cracks and red representing shear cracks. As shown in Figure 9A, after the excavation of the 6304 working face, a small number of cracks begin to appear in the coal and rock mass around the goaf due to the failure of the immediate roof, immediate floor, and surrounding coal. And the crack lengths are relatively small and independently distributed. As shown in Figure 9B, after the excavation of the 6305 working face, the number of cracks in the RLP increases significantly. Inclined shear cracks appear in the RLP on both sides of the goaf, and tensile failure cracks appear in the middle of the RLP. Importantly, horizontal shear cracks are observed between the RLP and the HETRS, indicating that interlayer shear slip has occurred. As shown in Figure 9C, with the increase of calculation time, the cracks on both sides of the goaf further develop upwards the goaf, forming two crack bands in the RLP: the outer shear fracture band and the inner tensile fracture band. The range of the tensile fracture band is larger than the shear fracture band, but the fracture angle is smaller than the shear fracture band. In addition, some of the interlayer cracks between the RLP and the HETRS have also changed from the original shear type to the tensile type. After the failure of the RLP, the HETRS continues to bend, and when the concentrated stress in the rock layer exceeds the ultimate strength, cracks begin to appear in the HETRS, as shown in Figure 9D, with cracks of varying lengths first appearing in the bottom and middle parts of the HETRS, mainly concentrated above the goaf. Subsequently, the existing cracks develop upwards, and cracks also appear at the top of the HETRS. The final crack distribution pattern in the roof presents “shear cracks on both sides as the main type, and tensile cracks in the middle as the main type”, as shown in Figure 9E. After the excavation of the 6306 working face, shear fracture bands and tensile fracture bands will also form at the edges and above the new goaf. In addition to the goaf, large-scale mining also leads to the appearance of cracks dominated by tensile cracks in the overlying rock layers of certain unexcavated areas due to the strata bending, as shown in Figure 9F. After the separation of the RLP and the HETRS, cracks began to appear in the HETRS. At the same time, horizontally oriented cracks appeared in the middle-lower part of the HETRS, as shown in Figures 9D, E. The horizontally oriented cracks split the thick rock strata into two parts, and then the failure of the HETRS showed the characteristics of layered and progressive fracture.
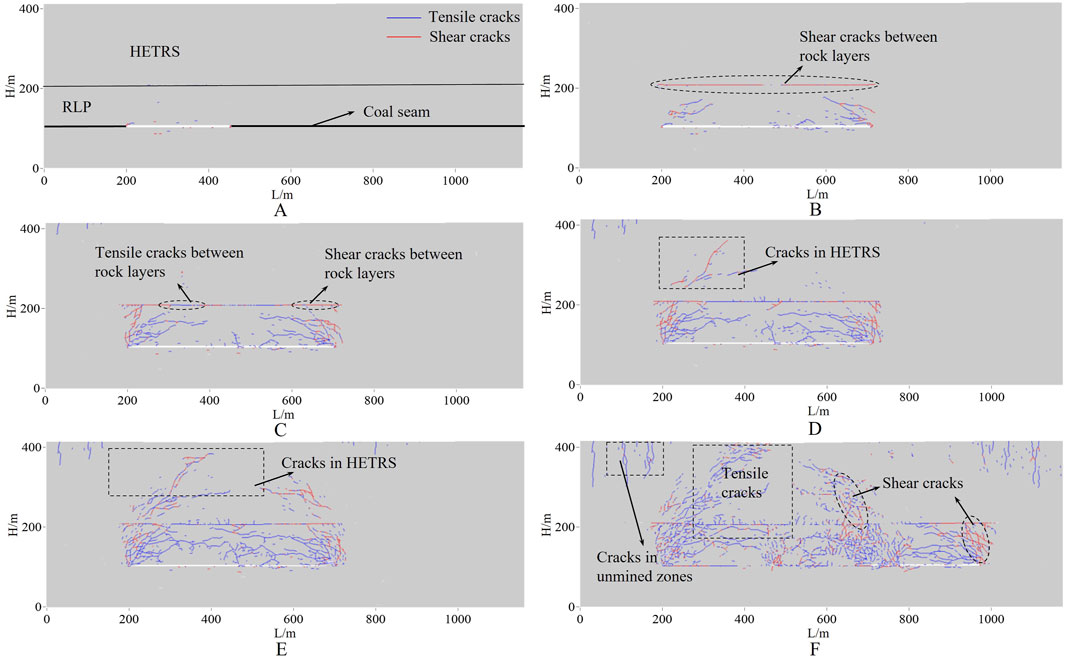
Figure 9. Distribution of cracks in the coal and rock mass during the mining process: (A) 10000 steps, (B) 20000 steps, (C) 30000 steps, (D) 40000 steps, (E) 50000 steps, (F) 60000 steps.
A new approach to capturing seismic events during the fracturing of rock has been developed in UDEC. Mining-induced seismic events are caused by plastic failure of the rock accompanied by energy release. Therefore, a plastic failure is defined as a seismic event and the type of plastic failure is the type of seismic event. Failure of the block in UDEC was recorded as a mining-induced seismicity. In this study, the state of all blocks in the model is traversed. The coordinates of the block and the type of failure are recorded if the block is in a plastic failure state. As the calculation time increases, we can get the set of mining-induced seismic events.
Figure 10 shows the distribution of mining-induced seismic events simulated during mining. As can be seen from Figure 10, in the RLP, tensile-type mining-induced seismic events are mainly distributed above the goaf, while shear-type mining-induced seismic events are mainly distributed in the rock on both sides of the goaf, because the rock strata above the goaf are prone to tensile failure due to downward bending deformation, while the rock strata on both sides of the goaf undergo compression-shear failure due to the squeezing of the floor and HETRS. During the failure process of the HETRS, the seismic events are mainly of the tensile type, with a small number of shear-type seismic events, and the tensile-type seismic events are mainly distributed in the middle part of the HETRS, while the shear-type seismic events are mainly distributed on both sides and the top of the HETRS. As shown in Figure 10A, after the excavation of the 6304 working face, only a small number of mining-induced seismic events occur in the coal and rock mass, and the seismic events are mostly at a relatively low level, basically around the goaf. After the excavation of the 6305 working face, the number of mining-induced seismic events increases significantly, and the location of the seismic events also gradually develops upwards. First, as shown in Figure 10B, a large number of tensile-type seismic events occur in the middle of the RLP, indicating that the low-position roof first undergoes tensile failure in the middle; then, a large number of shear-type seismic events occur in the RLP on both sides of the goaf, as shown in Figure 10C, because the RLP is under the squeeze of the floor and the HETRS, and the superimposition of the original stress and the mining stress causes shear failure on both sides; finally, as the mining time increases, the bottom, middle, and upper parts of the HETRS also undergo successive failure, forming seismic events. As shown in Figures 10D, E, tensile-type seismic events appear first in the HETRS, and most of the seismic events in the HETRS are of the tensile type. In addition, the seismic events in the HETRS are distributed in an inverted “V” shape, which is consistent with the location of the fracture lines formed by the natural caving of the rock layers. After the excavation of the 6306 working face, shear-type seismic events occur along the edge of the 6306 goaf, while a large number of tensile-type seismic events occur above the goaf, as shown in Figure 10F. The distribution of mining-induced seismicity is in the same region as that of the stress changes, in agreement with the results of the study (Orlecka-Sikora, 2010).
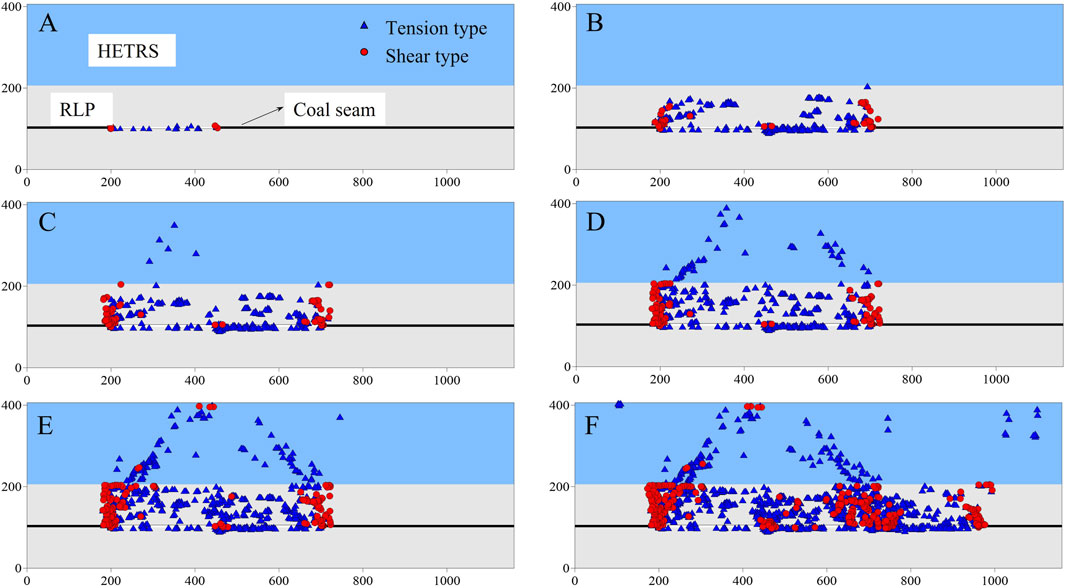
Figure 10. Distribution of mining-induced seismic events during the mining process: (A) 10000 steps, (B) 20000 steps, (C) 30000 steps, (D) 40000 steps, (E) 50000 steps, (F) 60000 steps.
Figure 11 shows the changes in elastic strain energy, gravitational potential energy, shear dissipation energy, and plastic dissipation energy during the working face mining process, with positive values representing the accumulated energy in the coal and rock mass and negative values representing the dissipated energy in the coal and rock mass. As shown in the figure, after the working face is excavated, the elastic strain energy experiences a sudden decrease, which is due to the release of elastic energy caused by the excavation. During the mining process in the sixth mining district, the elastic strain energy shows an upward trend, indicating that although the elastic strain energy will be transformed into other forms of energy when the coal and rock mass is damaged, resulting in a decrease in the strain energy; but under the effect of mining, large-scale stress and energy concentration areas are also formed in the coal and rock mass, and these areas will transform other forms of energy (boundary force work, potential energy, etc.) into elastic strain energy. The increase in elastic strain energy is greater than the dissipation of elastic strain energy, resulting in a continuous increase in the total elastic strain energy.
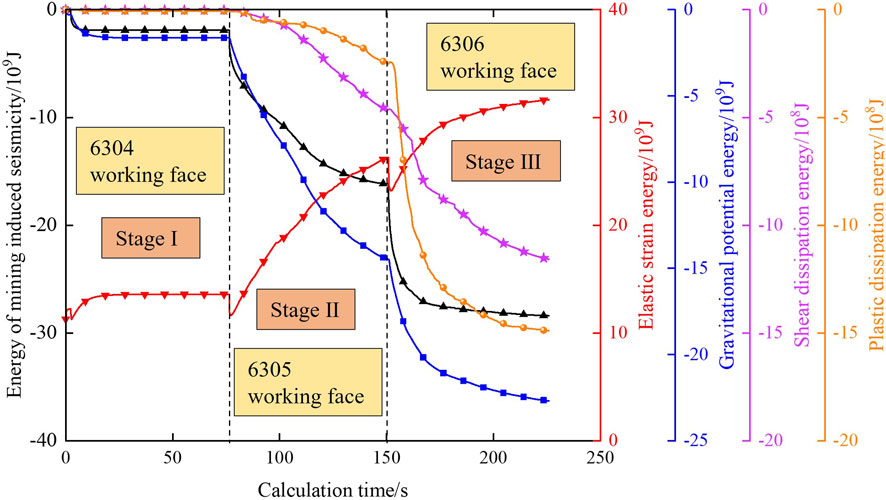
Figure 11. Changes in different types of energy during the mining process.
As shown in Figure 11, the increments of elastic strain energy during the mining of the 6304 working face, 6305 working face, and 6306 working face are 2.20E9 J, 1.45E10 J, and 8.40E9 J, respectively. Therefore, the increment of strain energy during the mining of the first working face is the smallest, and the increment during the mining of the second working face is the largest. After the working face is excavated, the gravitational potential energy decreases due to the deformation and subsidence of the strata. The decrements of gravitational potential energy during the mining of the 6304 working face, 6305 working face, and 6306 working face are 1.64E9 J, 1.28E10 J, and 8.21E9 J, respectively. Therefore, the decrement of gravitational potential energy during the mining of the first working face is the smallest, and the decrement during the mining of the second working face is the largest. The shear dissipation energy refers to the energy dissipated during the shear slip process of the coal and rock mass. The increments of shear dissipation energy during the mining of the 6304 working face, 6305 working face, and 6306 working face are 2.26E6 J, 4.61E8 J, and 6.98E8 J, respectively. Therefore, the increment of shear dissipation energy during the mining of the first working face is the smallest, and the increment during the mining of the second working face is the largest. The plastic dissipation energy refers to the energy dissipated during the plastic failure process of the coal and rock mass. The increments of plastic strain energy during the mining of the 6304 working face, 6305 working face, and 6306 working face are 1.52E7 J, 2.35E8 J, and 1.24E9 J, respectively. Therefore, the increment of plastic strain energy during the mining of the first working face is the smallest, and the increment during the mining of the second working face is the largest.
The total mining-induced seismic energy obtained from the simulation is shown in Figure 11. With the increase in the goaf area and the calculation time, the total mining-induced seismic energy gradually increases, but each stage has different characteristics. It can be seen that before mining, the coal and rock mass is in an initial stable state, and the total mining-induced seismic energy is 0. After the excavation of the 6304 working face (Stage I), local failure occurs in the low-position roof, accompanied by the release of some energy, and the total mining-induced seismic energy increases from 0 to 1.89E9 J. However, due to the small goaf area, the overlying strata quickly enter a re-stabilization stage, and correspondingly, the total mining-induced seismic energy remains unchanged in the second half of this stage. In Stage I, the increment of mining-induced seismic energy is the smallest. After the excavation of the 6305 working face (Stage II), the HETRS undergoes the initial failure, and the large-scale failure causes the mining-induced seismic energy to increase rapidly, with the total mining-induced seismic energy increasing from 1.89E9 J to 1.62E10 J. In Stage II, the increment of mining-induced seismic energy is the largest. After the excavation of the 6306 working face (Stage III), the HETRS undergoes periodic failure, and the number of fractures continues to increase, with the total mining-induced seismic energy increasing from 1.62E10 J to 2.84E10 J. The increments of mining-induced seismic energy during the mining of the 6304 working face, 6305 working face, and 6306 working face are 1.89E9 J, 1.43E10 J, and 1.22E10 J, respectively. It can be seen that the increment of total mining-induced seismic energy during the mining of the first working face is the smallest, and the increment during the mining of the second working face is the largest, indicating that the mining-induced seismic energy is mainly from the failure of the HETRS. This is in agreement with the results of mining-induced seismicity monitoring by Wojtecki et al. (2021). The increment of total mining-induced seismic energy during the mining of the third working face is smaller than the second working face, indicating that the mining-induced seismic energy during the initial failure of the HETRS is greater than the periodic failure stage. The characteristics of the variation of the total mining-induced seismicity energy derived from the simulations in this paper are consistent with the conclusions of Lu et al. (2016) based on field observations.
It has been demonstrated that many mining-induced seismicity are associated with roof failures (Alber et al., 2009; Zhang et al., 2024; Liu et al., 2024). As shown in Figure 12A, as the goaf area increases, the RLP first fails, and mining-induced seismicity occur during this process. Then, after the failure of the RLP, the separation between the RLP and the HETRS increases. Deformation of HETRS leads to increased stress. When the maximum stress exceeds the limit strength of the strata, mining-induced seismicity occur in the HETRS, as shown in Figure 12B. In addition to the fracturing of the strata, the slip of interlayers and within the HETRS is also one of the main factors leading to mining-induced seismicity. This result is consistent with the findings of (Stec, 2007; Song et al., 2024). The energy transformation behavior during the failure process of the HETRS is studied. After the coal seam is mined, part of the elastic strain energy and gravitational potential energy in the coal and rock mass will be transformed into dissipated energy, including plastic dissipation energy, shear dissipation energy, and mining-induced seismic energy. The mining-induced seismicity energy comes from the fractured strata as well as the surrounding rock, as shown in Figure 13.
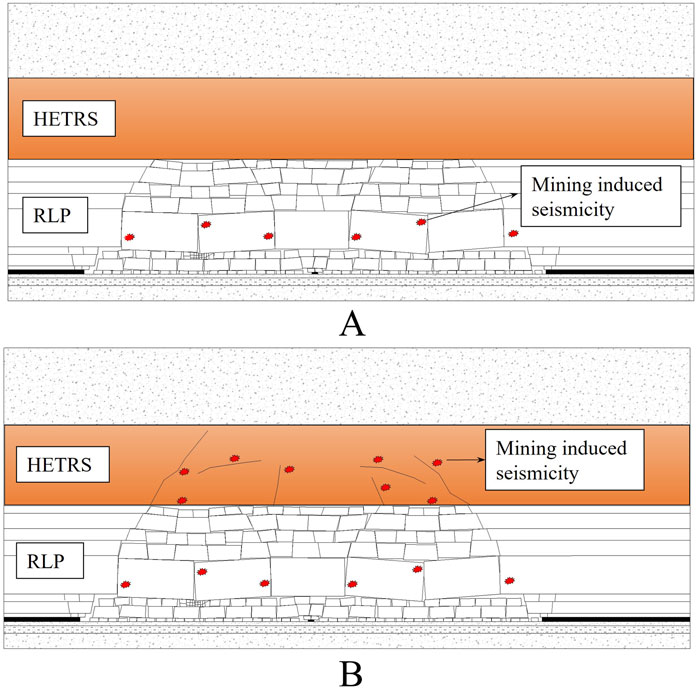
Figure 12. Mechanism of mining-induced seismicity triggered by strata failure: (A) Mining-induced seismicity triggered by the failure of the RLP; (B) Mining-induced seismicity triggered by the failure of the HETRS.
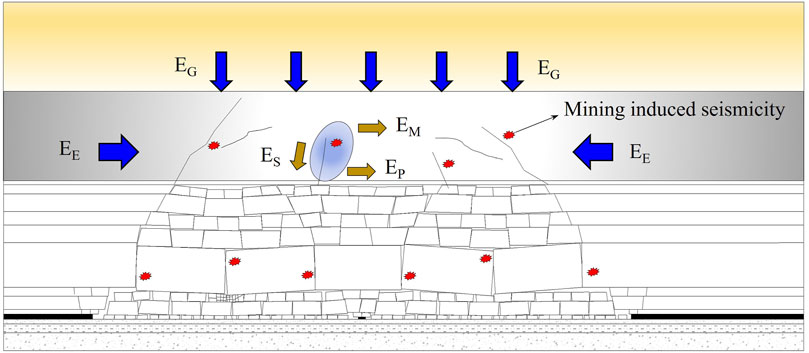
Figure 13. Energy transformation of mining-induced seismicity.
FISH in UDEC was called in this study. Compared with previous studies using UDEC, the simulations in this study have two different aspects: (1) the location and type of vibration events in the process of rock failure are captured, as shown in Figure 10. A plastic failure is defined as a seismic event and the type of plastic failure is the type of seismic event. The state of all blocks in the model is traversed. The coordinates of the block and the type of failure are recorded if the block is in a plastic failure state. (2) In this study, the energy evolution in the process of rock failure is analyzed. The changes in elastic strain energy, gravitational potential energy, shear dissipation energy, and plastic dissipation energy are analyzed. The proposed method for capturing the location and type of seismic events can be used to study the processes of dynamic failure of coal in tectonic regions, such as mining-induced seismicity, rockbursts, and coalbursts. By using this method, the location and energy evolution of seismic events during slip on faults can be analyzed, additionally, the energy release induced by fracture of rock strata in tectonic regions can be well reproduced.
The capture of seismic events in the numerical model provides the basis for the development of a predictive model for mining-induced seismicity. In future studies, more complex numerical models incorporating geological structures will be developed. The location and type of seismic events during mining of the working face will be collected using the method proposed in this study. Then, a database including geological descriptions, mining records, and simulated seismic events is created. Based on methods such as deep learning or big data mining, data analysis will be carried out on the database with the aim of obtaining a prediction model. However, numerical models require input parameters like elastic modulus, compressive strength, Poisson’s ratio, cohesion, and friction angle, etc. If these parameters are not well-acquired in a new geological setting, the simulation results could be inaccurate. In addition, the heterogeneity of coal and rock needs to be considered in future numerical models. Heterogeneity and anisotropy are common in geology. The numerical model in this study was adopted homogeneous and isotropic materials for simplicity.
In this study, UDEC numerical simulations were employed to analyze the stress evolution and crack development induced by the fracture of HETRS. A new method was developed in the numerical simulation to study the failure type and distribution of mining-induced seismic events. The energy changes and transformations during mining were investigated. The main conclusions are as follows.
(1) The fracture of HETRS in the six mining districts can be divided into three stages: deformation (stage I), initial breakage (stage II), and cyclic breakage (stage III). In Stage I, fracturing occurs only in the roof below the HETRS, with the lowest mining-induced seismicity energy. In Stage II, the change of vertical displacement is 4.33 m, the change of vertical stress is 26.21 MPa, and the change of seismic energy is 1.91E8 J. There is a “layered fracture” characteristic of the HETRS.
(2) The crack distribution pattern in the roof presents “shear cracks on both sides as the main type, and tensile cracks in the middle as the main type.” The majority of mining-induced seismicity in HETRS is of the tensile type. The seismic events in the HETRS are distributed in an inverted “V” shape. On the one hand, fracture of HETRS leads to mining-induced seismicity, and on the other hand, “shear-slip” in the horizontal direction along the interfaces between the strata and within the HETRS induces mining-induced seismicity.
(3) The energy shows different changes characteristic during coal seam mining at different stages. Elastic energy decreases then increases. The gravitational potential energy decreases. Shear dissipative energy and plastic dissipative energy increase. In addition to elastic energy, gravitational potential energy is also the main source of mining-induced seismic energy and dissipation energy. The energy supply sources of mining-induced seismicity include not only the strata in the failure area but also the surrounding rock.
The original contributions presented in the study are included in the article/supplementary material, further inquiries can be directed to the corresponding authors.
JC: Conceptualization, Writing–original draft, Writing–review and editing, Data curation, Formal Analysis, Funding acquisition, Investigation, Methodology, Project administration, Software, Validation, Visualization. LD: Conceptualization, Data curation, Funding acquisition, Methodology, Project administration, Software, Validation, Visualization, Writing–original draft. XZ: Funding acquisition, Methodology, Supervision, Writing–original draft. SG: Resources, Writing–original draft, Writing–review and editing. YH: Methodology, Writing–review and editing. GL: Formal Analysis, Investigation, Writing–review and editing. CL: Formal Analysis, Investigation, Writing–review and editing. YC: Writing–review and editing
The author(s) declare that financial support was received for the research and/or publication of this article. This work was funded by the Postdoctoral Fellowship Program (Grade C) of China Postdoctoral Science Foundation (Grant No. GZC20241923), the Taishan Industrial Experts Program (NO.tscx202408130), the National Natural Science Foundation of China (Grant No. 52227901), the Jiangsu Funding Program for Excellent Postdoctoral Talent (Grant No. 2024ZB733), and the Shandong Energy Group Foundation (No. SNKJ2022A01-R26).
The authors thank for financial support from the Postdoctoral Fellowship Program (Grade C) of China Postdoctoral Science Foundation (Grant No. GZC20241923), the Taishan Industrial Experts Program (NO.tscx202408130), the National Natural Science Foundation of China (Grant No. 52227901), the Jiangsu Funding Program for Excellent Postdoctoral Talent (Grant No. 2024ZB733), and the Shandong Energy Group Foundation (No. SNKJ2022A01-R26).
Authors XZ, YH, GL, and YC were employed by Shandong Energy Group Co., Ltd. Author CL was employed by Shandong Energy Group Technology Development Co., Ltd.
The remaining authors declare that the research was conducted in the absence of any commercial or financial relationships that could be construed as a potential conflict of interest.
The reviewer QZ declared a shared affiliation with the authors XZ, YH, GL, CL, YC to the handling editor at time of review.
The author(s) declare that no Generative AI was used in the creation of this manuscript.
All claims expressed in this article are solely those of the authors and do not necessarily represent those of their affiliated organizations, or those of the publisher, the editors and the reviewers. Any product that may be evaluated in this article, or claim that may be made by its manufacturer, is not guaranteed or endorsed by the publisher.
Abdul-Wahed, M. K., Al Heib, M., and Senfaute, G. (2006). Mining-induced seismicity: seismic measurement using multiplet approach and numerical modeling. Int. J. Coal Geol. 66 (1-2), 137–147. doi:10.1016/j.coal.2005.07.004
Alber, M., Fritschen, R., Bischoff, M., and Meier, T. (2009). Rock mechanical investigations of seismic events in a deep longwall coal mine. Int. J. Rock Mech. Min. Sci. (1997). 46 (2), 408–420. doi:10.1016/j.ijrmms.2008.07.014
Bańka, P., Chmiela, A., Menéndez Fernández, M., Fernández Muñiz, Z., and Bernardo Sanchez, A. (2017). Predicting changes in induced seismicity on the basis of estimated rock mass energy states. Int. J. Rock Mech. Min. Sci. 95, 79–86. doi:10.1016/j.ijrmms.2017.03.010
Cao, J., Dou, L., He, J., Xie, J., Han, Z., and Wang, S. (2023a). Mechanism of the coal bursts in the working face during mining of steeply inclined and extra thick coal seam. Geomatics, Nat. Hazards Risk 14 (1), 2206511. doi:10.1080/19475705.2023.2206511
Cao, J., Dou, L., Konietzky, H., Zhou, K., and Zhang, M. (2023b). Failure mechanism and control of the coal bursts triggered by mining-induced seismicity: a case study. Environ. Earth Sci. 82, 168. doi:10.1007/s12665-023-10856-9
Cao, W., Shi, J.-Q., Si, G., Durucan, S., and Korre, A. (2018). Numerical modelling of microseismicity associated with longwall coal mining. Int. J. Coal Geol. 193, 30–45. doi:10.1016/j.coal.2018.04.010
Foulger, G. R., Wilson, M. P., Gluyas, J. G., Julian, B. R., and Davies, R. J. (2018). Global review of human-induced earthquakes. Earth-Science Rev. 178, 438–514. doi:10.1016/j.earscirev.2017.07.008
Gao, F. Q., and Stead, D. (2014). The application of a modified Voronoi logic to brittle fracture modelling at the laboratory and field scale. Int. J. Rock Mech. Min. Sci. 68, 1–14. doi:10.1016/j.ijrmms.2014.02.003
Itasca Consulting Group Inc. (2014). UDEC manual, version 6.0. Minneapolis: Itasca Consulting Group Inc.
Keneti, A., and Sainsbury, B.-A. (2018). Review of published rockburst events and their contributing factors. Eng. Geol. 246, 361–373. doi:10.1016/j.enggeo.2018.10.005
Khan, M., He, X., Dazhao, S., Tian, X., Li, Z., Xue, Y., et al. (2023). Extracting and predicting rock mechanical behavior based on microseismic spatio-temporal response in an ultra-thick coal seam mine. Rock Mech. Rock Eng. 56 (5), 3725–3754. doi:10.1007/s00603-023-03247-w
Khan, M., He, X., Farid, A., Chen, J., Wang, H., Dazhao, S., et al. (2022). Geophysical characterization of mining-induced complex geological deformations in a deep coalmine. Lithosphere 2021 (Special 4): 7564984. doi:10.2113/2022/7564984
Khan, M., He, X., Jia, G., and Dazhao, S. (2023). Accurate prediction of indicators for engineering failures in complex mining environments. Eng. Fail. Anal. 155, 107736. doi:10.1016/j.engfailanal.2023.107736
Kuzniar, K., and Tatara, T. (2022). Full-scale long-term monitoring of mine-induced vibrations for soil-structure interaction research using dimensionless response spectra. Case Stud. Constr. Mater. 16, e00801. doi:10.1016/j.cscm.2021.e00801
Leake, M. R., Conrad, W. J., Westman, E. C., Ghaychi Afrouz, S., and Molka, R. J. (2017). Microseismic monitoring and analysis of induced seismicity source mechanisms in a retreating room and pillar coal mine in the Eastern United States. Undergr. Space 2 (2), 115–124. doi:10.1016/j.undsp.2017.05.002
Lednická, M., and Kaláb, Z. (2016). Study of site effect at seismic station located in undermined area of Karviná region (Czech Republic). Acta Geophys. 64 (5), 1715–1730. doi:10.1515/acgeo-2016-0053
Li, T., Cai, M., and Cai, M. (2007). A review of mining-induced seismicity in China. Int. J. Rock Mech. Min. Sci. 44 (8), 1149–1171. doi:10.1016/j.ijrmms.2007.06.002
Li, X., Si, G., Cao, W., Cai, W., Oh, J., and Ismet, C. (2024). A sequence of seismic event triggering in longwall coal mines based on the aftershock cascade theory. Int. J. Rock Mech. Min. Sci. 182, 105883. doi:10.1016/j.ijrmms.2024.105883
Liu, C., Qu, J., Li, G., Li, B., Liu, F., Zhang, Z., et al. (2024). Source types of induced earthquakes in underground mines: revealed by regional moment tensor inversion. Geomechanics Geophys. Geo-Energy Geo-Resources 10 (1), 106. doi:10.1007/s40948-024-00811-8
Lu, C.-P., Liu, Y., Wang, H.-Y., and Liu, P.-F. (2016). Microseismic signals of double-layer hard and thick igneous strata separation and fracturing. Int. J. Coal Geol. 160–161, 28–41. doi:10.1016/j.coal.2016.04.011
Lurka, A. (2024). Combining deep neural network and spatio-temporal clustering to automatically assess rockburst and seismic hazard – case study from Marcel coal mine in Upper Silesian Basin, Poland. Comput. and Geosciences 192, 105709. doi:10.1016/j.cageo.2024.105709
Marcak, H., and Mutke, G. (2013). Seismic activation of tectonic stresses by mining. J. Seismol. 17 (4), 1139–1148. doi:10.1007/s10950-013-9382-3
Orlecka-Sikora, B. (2010). The role of static stress transfer in mining induced seismic events occurrence, a case study of the Rudna mine in the Legnica-Glogow Copper District in Poland. Geophys. J. Int. 182 (2), 1087–1095. doi:10.1111/j.1365-246x.2010.04672.x
Orlecka-Sikora, B., Lasocki, S., Lizurek, G., and Rudziński, Ł. (2012). Response of seismic activity in mines to the stress changes due to mining induced strong seismic events. Int. J. Rock Mech. Min. Sci. 53, 151–158. doi:10.1016/j.ijrmms.2012.05.010
Pan, Y., Song, Y., Luo, H., and Xiao, Y. (2024). Coalbursts in China: theory, practice and management. J. Rock Mech. Geotechnical Eng. 16 (1), 1–25. doi:10.1016/j.jrmge.2023.11.003
Song, J.-F., Lu, C.-P., Zhang, X.-F., Song, C.-H., Zhou, J., and Zhang, Z.-G. (2024). Application of Bayesian method for mining-induced tremors: a case study of the Xinjulong coal mine in China. Int. J. Rock Mech. Min. Sci. 174, 105635. doi:10.1016/j.ijrmms.2023.105635
Stec, K. (2007). Characteristics of seismic activity of the upper silesian Coal Basin in Poland. Geophys. J. Int. 168 (2), 757–768. doi:10.1111/j.1365-246x.2006.03227.x
Wang, S., Cao, A., Wang, C., Guo, W., Xue, C., Liu, J., et al. (2024). Mechanism of rockburst induced by the microseismic event in the floor strata of high tectonic stress zones: a case study. Int. J. Coal Sci. Technol. 11, 76. doi:10.1007/s40789-024-00728-3
Wojtecki, Ł., Kurzeja, J., and Knopik, M. (2021). The influence of mining factors on seismic activity during longwall mining of a coal seam. Int. J. Min. Sci. Technol. 31 (3), 429–437. doi:10.1016/j.ijmst.2021.01.010
Zhang, C., Canbulat, I., Hebblewhite, B., and Ward, C. R. (2017). Assessing coal burst phenomena in mining and insights into directions for future research. Int. J. Coal Geol. 179, 28–44. doi:10.1016/j.coal.2017.05.011
Zhang, L., and Einstein, H. (2004). Using RQD to estimate the deformation modulus of rock masses. Int. J. Rock Mech. Min. Sci. 41 (2), 337–341. doi:10.1016/s1365-1609(03)00100-x
Keywords: hard and extremely thick rock stratum, stress evolution, crack development, energy transformation, mining-induced seismicity
Citation: Cao J, Dou L, Zhang X, Gong S, Han Y, Li G, Liu C and Chen Y (2025) Study on the mechanism of mining-induced seismicity triggered by fracture of hard and extremely thick rock stratum: a case study. Front. Earth Sci. 13:1556612. doi: 10.3389/feart.2025.1556612
Received: 07 January 2025; Accepted: 10 March 2025;
Published: 03 April 2025.
Edited by:
Chong Xu, Ministry of Emergency Management, ChinaReviewed by:
Heng Zhang, Beijing Academy of Science and Technology Institute of Urban Safety and Environmental Science, ChinaCopyright © 2025 Cao, Dou, Zhang, Gong, Han, Li, Liu and Chen. This is an open-access article distributed under the terms of the Creative Commons Attribution License (CC BY). The use, distribution or reproduction in other forums is permitted, provided the original author(s) and the copyright owner(s) are credited and that the original publication in this journal is cited, in accordance with accepted academic practice. No use, distribution or reproduction is permitted which does not comply with these terms.
*Correspondence: Jinrong Cao, amluLXJvbmdjYW9AY3VtdC5lZHUuY24=; Linming Dou, bG1kb3VAY3VtdC5lZHUuY24=
†ORCID: Jinrong Cao, orcid.org/0000-0003-3662-9479
Disclaimer: All claims expressed in this article are solely those of the authors and do not necessarily represent those of their affiliated organizations, or those of the publisher, the editors and the reviewers. Any product that may be evaluated in this article or claim that may be made by its manufacturer is not guaranteed or endorsed by the publisher.
Research integrity at Frontiers
Learn more about the work of our research integrity team to safeguard the quality of each article we publish.