 M. M. Abdullah Al Mamun
 Li Zhang
 Yan Xuzhe1,2,3
 Jian Zuo
 Shyamal Karmakar
94% of researchers rate our articles as excellent or good
Learn more about the work of our research integrity team to safeguard the quality of each article we publish.
Find out more
ORIGINAL RESEARCH article
Front. Earth Sci., 18 March 2025
Sec. Geoinformatics
Volume 13 - 2025 | https://doi.org/10.3389/feart.2025.1554864
Tropical cyclones, including surge inundation, are a joint event in the coastal regions of Bangladesh. The surge washes out the life and property within a very short period. Besides, in most cases, the area remains flooded for several days. Prediction of inundation susceptibility due to cyclone surge is one of the key issues in reducing cyclone vulnerability. Surge susceptibility can be analyzed effectively through geospatial techniques and various algorithms. Two geospatial techniques, such as GIS-based Analytical Hierarchy Process (AHP) multi-criteria analysis and bivariate Frequency Ratio (FR) techniques, and three algorithms, i.e., Artificial Neural Network (ANN), k-nearest neighbor (KNN) and Random Forest (RF), were applied to understand the comparative surge inundation susceptibility level between an island, i.e., Sandwip and an area protected by mangrove, i.e., Dacope on the Bangladesh coast. A total of ten criteria were considered influential to surge flooding, i.e., Elevation, Slope, Topographic Wetness Index, Drainage density, Distance from river and sea, Wind flow distance, LULC, NDVI, Precipitation, and Soil types. Among them, distance from river and sea (16.34%) and elevation (15.01%) were found to be crucial to surge inundation susceptibility analysis, according to the AHP expert’s opinions. Similarly, precipitation (9.88) and elevation (6.92) in Sandwip and LULC (4.16) and NDVI (4.33) in Dacope were found to be the highest PR values in the FR analysis. The factor maps and final surge susceptibility maps were analyzed through ArcGIS 10.8. The final surge susceptibility maps were categorized into five classes, i.e., very low, low, moderate, high, and very high. Very high and high susceptibility was found around the boundary of Sandwip island and the upper portion of the Dacope upazila. A very high susceptibility area in Sandwip (45.07%) and Dacope (49.41%) was observed by KNN and ANN, respectively. The receiver operating characteristic (ROC) found all techniques acceptable in susceptibility prediction; however, geospatial techniques possessed a better consistent area under the curve (AUC) value than the algorithms for both study sites. Policymakers and professionals can plan to manage disaster reduction activities based on the susceptibility outcomes.
A cyclone is one of the most dangerous disasters, accompanied by dreadful winds and high tidal surges. The surge washes out low-gradient areas quickly and remains inundated for extended periods. Due to the force generated from the sea surface, the impact of cyclones is enormous in tropical and subtropical areas. Thus, it causes severe life losses and property damages. For example, the recent super Typhoon Yagi made landfall on 07 September 2024 in Vietnam and instigated tremendous flooding problems in Southeast Asia. It approximately caused a life loss of 21 in the Philippines, 344 in Vietnam, and 125 in Myanmar (IFRC, 2024a). A few years back, another cyclone, ‘Haiyan’, in the Philippines caused a large number of causalities (34,870) with massive property damages (Ryu et al., 2020). Similarly, Bangladesh had the highest life loss (300,000) in history due to the cyclonic surge in 1970 (Hossain and Mullick, 2020). Due to its geographical position, Bangladesh is regarded as one of the places most likely to experience cyclone incidents. Weather Underground enlisted thirty-six of the most perilous cyclonic events throughout the world, according to some research sources. Among them, seventeen cyclones hit the coast of Bangladesh, and twenty-six originated from the Bay of Bengal. In most of the year, Bangladesh’s coast experiences cyclonic events (Weather Underground, 2022). However, the most notable incidents occurred in 1876, 1919, 1961, 1963, 1965, 1970, 1985, 1988, 1991, 2007, and 2009. On 26 May 2024 cyclone ‘Remal’ hit the coastal area of Bangladesh with the highest wind velocity of 111 km/hr and around 2.5 m of surge height. Although only 16 people died from the incidents, however, 4.6 million people were directly affected. Their houses, field crops, and aquaculture fishponds were flooded and damaged (IFRC, 2024b). Surge height is one of the prime causes of the severity of cyclones. During the cyclone in 1970, the highest surge height was 10.6 m. Another incident occurred in the Chittagong coastal area in 1991, where the surge height was found to be 6.1 m (Tasnim et al., 2015), and that caused 140,000 causalities (Flather, 1993). Due to the development of early warning and evacuation processes by government and non-government organizations, mortality has been reduced (Baten et al., 2018; Wang et al., 2022). However, in 2007, the cyclone ‘Sidr’ caused 3,295 people to die with a wind speed of 223 km/hr and a surge height of 6 m. The Barguna district and its adjacent regions were seriously destroyed due to the perilous event (Tasnim et al., 2015). Thus, cyclone management in Bangladesh still needs to improve to reduce its impact. Predicting surge inundation susceptibility during a cyclonic event is one of the critical aspects of the cyclone management system.
Susceptibility can be assessed through different means. Geospatial techniques and machine learning algorithms are very effective in the present context (Hoque et al., 2018). GIS-RS techniques such as Analytical Hierarchy Process (AHP) multi-criteria analysis, and Frequency Ratio (FR) are two effective ways by which policymakers and managers are now making several decisions. In recent times, AHP has been applied in several susceptibility analyses, such as landslide (Liu et al., 2024), flooding (Mourato et al., 2023; Rana et al., 2023; Sarkar et al., 2023), and soil erosion (Sadia et al., 2023). In addition, AHP is also used to identify potential sites for solar power (Islam et al., 2024) and groundwater (Sutradhar et al., 2021). On the contrary, FR was used in research around 2000. However, recently, FR has been widely used in flood susceptibility assessment (Hasanuzzaman et al., 2022a; Saha et al., 2022; Sarkar et al., 2022; Addis, 2023; Dutta et al., 2023; Ghosh et al., 2023; Megahed et al., 2023). In line with geospatial science, machine learning algorithms are increasingly popular in many decision-making tools. Notably, in flood susceptibility analysis, several algorithms have been used very recently, for example, Artificial Neural Network (ANN) (Avand et al., 2021; Mangkhaseum et al., 2024), k-nearest neighbor (KNN) (Madhuri et al., 2021; Hasan et al., 2023), and Random Forest (RF) (Avand et al., 2021; Hasanuzzaman et al., 2022b; Seydi et al., 2022; Hitouri et al., 2024). Researchers also use hybrid ensembles to predict flood probability. For example, (Rahman et al., 2021), used locally weighted linear regression (LWLR), random subspace (RSS), reduced error pruning tree (REPTree), RF, and M5P model tree algorithms. Similarly, another study applied a hybrid ensemble of Dagging and Random Subspace (RS) coupled with ANN, RF, and Support Vector Machine (SVM) to predict flooding susceptibility (Islam et al., 2021). However, in very few cases, the geospatial technique or machine learning was used to analyze cyclone surge inundation susceptibility. Therefore, the comparison of these methods and techniques would be beneficial for future surge susceptibility analysis. In this regard, the most widely used techniques, i.e., AHP, FR, and algorithms i.e., ANN, KNN, and RF would be interesting to apply in this study to find their effectiveness in surge inundation susceptibility analysis.
Previously, spatial research on cyclones included the impact assessment of wind force and surges on forests, crops, transportation, and other land uses. Some of them also conducted vulnerability analysis and hazard mapping based on land use and land cover (LULC) and social indicators (Hoque et al., 2017; Murali et al., 2018; Charrua et al., 2021; Delaporte et al., 2022). A few cyclone surge predictions used surge modeling, where the Surge Decay Coefficient (SDC) was calculated. This SDC mainly depended on surge height and DEM (Hoque et al., 2016; Akter and Dayem, 2021). In only a few cases, AHP and FR have been used for surge susceptibility analysis (Mamun et al., 2024). While previous studies related to cyclones have primarily focused on evaluating their impact on mangroves, agriculture, land use, and vulnerability assessment, there is a need to consider additional factors such as wind flow distance from the seashore, Topographic Wetness Index (TWI), slope, drainage density, LULC, etc. to understand cyclone surge susceptibility better. Therefore, cyclone surge inundation susceptibility analysis has an opportunity to be assessed using geospatial techniques and machine learning algorithms. Besides, geographic locations determine essential characteristics of a place that trigger the susceptibility. For example, an island in the sea and an area protected by mangrove forests may have several features limiting the surge inundation susceptibility. This will allow the showcasing of the geographical attributes of surge inundation susceptibility. Sea shores are susceptible to cyclone surges. However, the contribution of the mangrove to reduce such susceptibility would be evident by including a mangrove-protected area. On the contrary, the seawater surrounding an island makes the location susceptible to cyclone surge inundation. Thus, the primary objective of this study is to compare the surge inundation susceptibility between an island, i.e., Sandwip upazila, and an area protected by mangroves, i.e., Dacope upazila, to cyclone surges using AHP, FR, ANN, KNN, and RF techniques. Thus, this research integrates the flood-causing criteria into the susceptibility assessment of cyclone surge inundation.
The whole southern side of Bangladesh is exposed to the Bay of Bengal. Numerous rivers and canals flow from north to south and finally fall to the Bay. Bangladesh’s coastal areas are administratively divided into exposed and interior coasts (Figure 1). Several islands are situated in the estuary. This study considered Sandwip island, administratively regarded as an upazila under the Chittagong district. The Sandwip upazila lies between 22°16′and 22°43′north latitudes and between 91°17′and 91°37′east longitudes. The total area of the upazila is 762.42 sq km, which is a few kilometers away from the mainland of Chittagong. The island has a population of 0.3 million, and their primary occupation is farming. The main crops are paddy, coconut, betel leaf, palm, sesame, vegetables, etc. The historical tropical cyclone destroyed the site on 29 April 1991 (Islam et al., 2012a). With a surge height of 6.1 m, the cyclone caused 140,000 casualties (Flather, 1993). Besides, the area always seems vulnerable during cyclone formation in the Bay of Bengal or Indian Ocean.
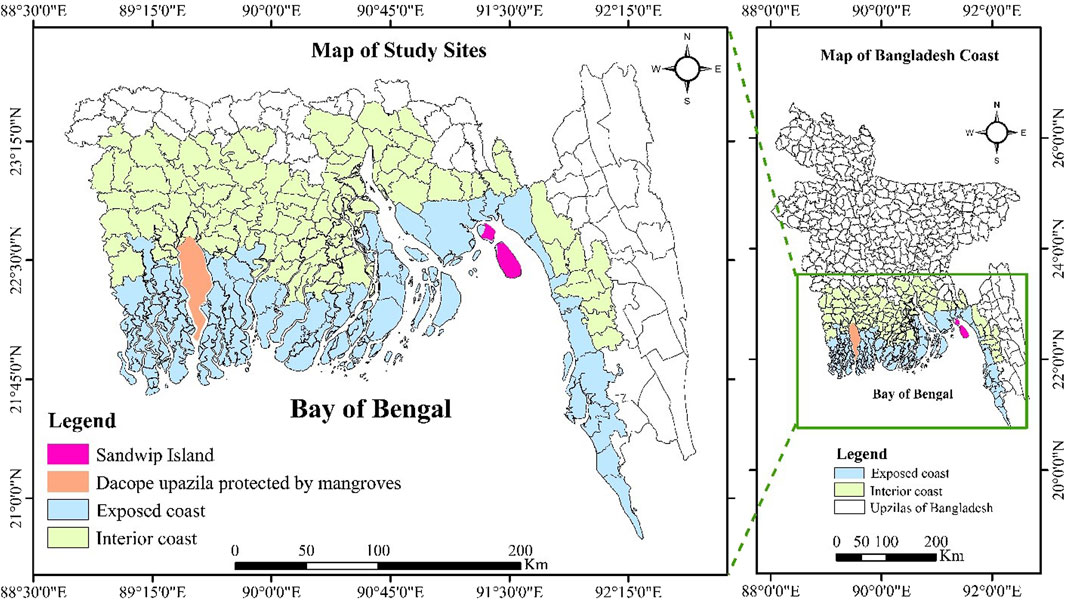
Figure 1. Map of two study areas in the Bangladesh coastal region.
The southwest corner of Bangladesh is famous for the Sundarbans mangrove forest, which covers about 6,000 sq km. Numerous interconnected rivers, creeks, and canals comprise the Sundarbans, a unique ecosystem (Begum et al., 2021). Dacope is an upazila in the Khulna district that lies between 22°24′and 22°40′north latitudes and between 89°24′and 89°35′east longitudes. The southern portion of the upazila is covered with mangroves. However, the people live in the northern part. The total population is more than 0.15 million in the upazila. The main occupation is agriculture, and the extended form of shrimp culture is practiced due to high salinity. Two mighty rivers, Shibsa and Pasur, encompass both sides of the upazila. Besides, the Manki and Bhadra rivers are notable. Moreover, a few canals are worth mentioning, such as Palashbari, Churia, Nalian, and Jugra (Islam et al., 2012b). Thus, the cyclone surge can cause inundation through these waterbodies.
Open Topography distributed the information regarding DEM and slope from the Shuttle Radar Topography Mission (SRTM) Global datasets (OpenTopography, 2013). DEM data was used to produce drainage density and TWI map. The administrative boundary of Sandwip and Dacope upazila was acquired from DIVA-GIS and Banglapedia (Islam et al., 2012a; 2012b).
Land Use Land Cover (LULC) maps were prepared from Landsat 8 OLI images through supervised classification.
Using Equations 1, 2, the Normalized Difference Vegetation Index (NDVI) map was also calculated from Landsat 8 OLI images.
Here, NIR means near-infrared, and R indicates the red band. The different categories were classified based on their values of −1 to 1.
The Euclidean distance technique was used to get wind flow distance classes from the southern last point of the upazila. Similarly, the Euclidean distance process calculated the distance from the river or sea. Before that, the shape file of canals, rivers, and the last southern point was prepared in Google Earth Pro.
Ten years of total rainfall from 2012 to 2021 was retrieved from the CHRS Data Portal, and the average for both study sites was calculated (CHRS Data Portal, 2023).
Soil types datasets were collected from the World Reference Base (WRB) for Soil Resources.
Extensive field surveys and Focus Group Discussions (FGDs) generated the flooded and non-flooded points from historical cases. A total of 120 flooded (80 for training and 40 for validity test) and 80 non-flooded points were created.
Most analyses were conducted from 2024 datasets, such as LULC, NDVI, wind distance, distance from rivers or sea, flooded locations, and non-flooded locations. Only DEM, precipitation, and soil data were collected from different years. The soil remains unchanged for a long time. Precipitation data were prepared, averaging 10 years. DEM data also remains unchanged for an extended period. The same coordinate system (WGS_1984_UTM_Zone_46N) and resolution (30 m) were adopted for all the factors (IUSS Working Group WRB, 2015) (Table 1).
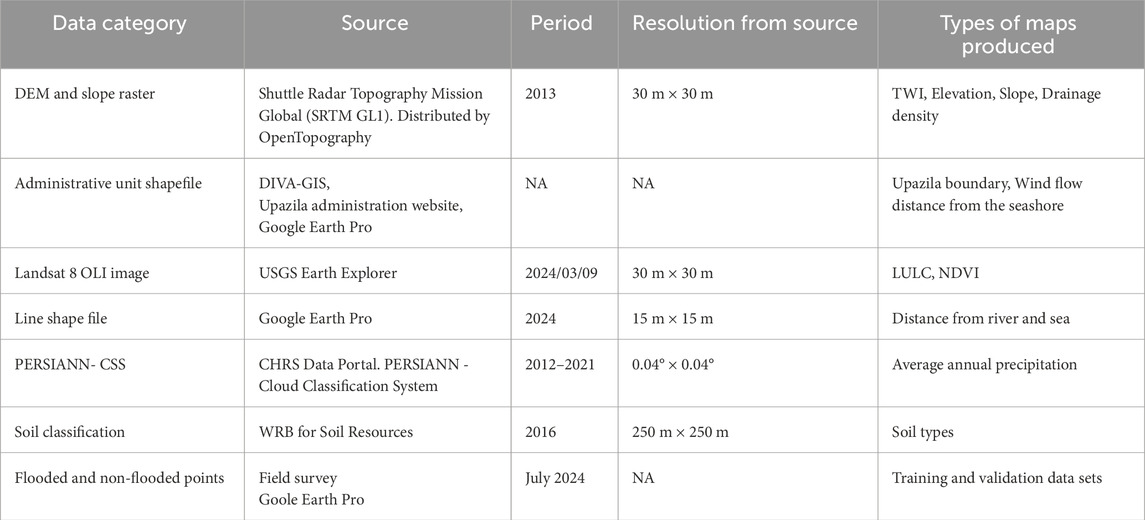
Table 1. Types of data sets used in the study with their sources and properties.
This study used five techniques, AHP, FR, ANN, KNN, and RF, to analyze cyclone surge inundation susceptibility. Ten factors related to surge inundation were identified for all of the analyses. The spatial maps were prepared by acquiring datasets from various sources. The maps were reclassified into five classes: very low, low, moderate, high, and very high susceptibility to inundation and numbered 1 to 5 chronologically. These classified maps were used for each of the five methods. Meanwhile, the pairwise ranking was done by experts from different institutions, according to (Saaty, 2008). The experts were chosen from various important and related organizations, such as several departments of relevant universities, Bangladesh Water Development Board (BWDB), Oxfam International, Center for Environmental and Geographic Information Services (CEGIS), Swisscontact, and International Federation of Red Cross and Red Crescent Societies (IFRC). The ranking outcome was used in the AHP technique to prepare the final susceptibility map. On the other hand, 80 surge inundation locations were used in the FR calculation to prepare the susceptibility map. The 80 surge-flooded and 80 non-flooded points were used in ANN, KNN, and RF techniques to prepare the final susceptibility map. Thus, ten susceptibility maps were prepared for two study sites. Finally, the ROC method assessed the accuracy of these susceptibility maps using 40 flooded points (Figure 2).
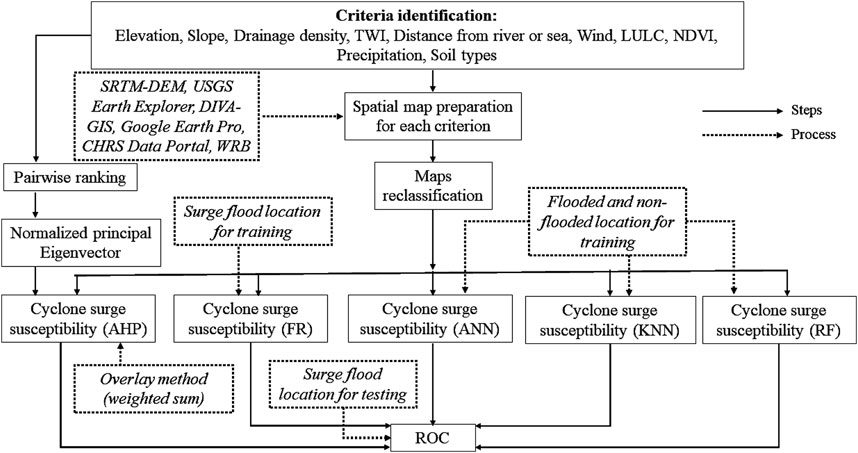
Figure 2. Flow chart of the cyclone surge inundation susceptibility analysis process.
This study identified ten significant factors responsible for cyclone surge susceptibility (Table 2). Most were crucial for flood susceptibility analysis (Saha et al., 2022; Addis, 2023; Megahed et al., 2023).
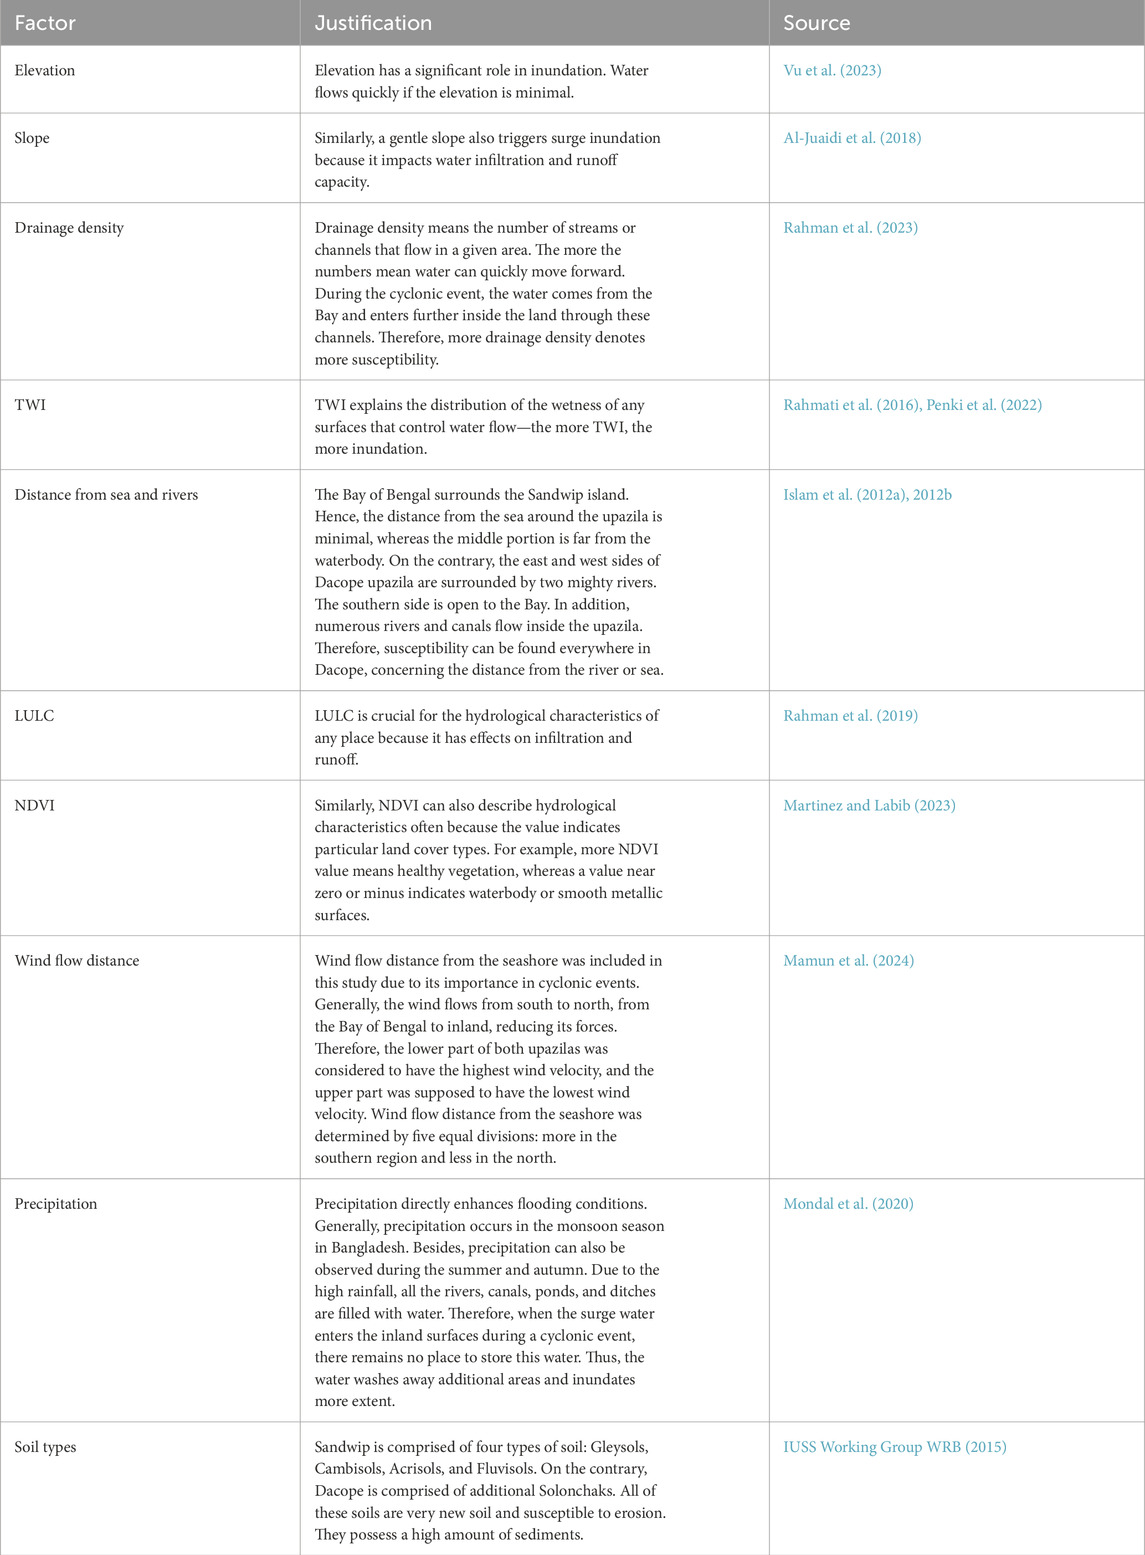
Table 2. Justification of factors selected for cyclone surge inundation susceptibility analysis.
Each factor was classified into five susceptibility classes, i.e., very low, low, moderate, high, and very high (Table 3).
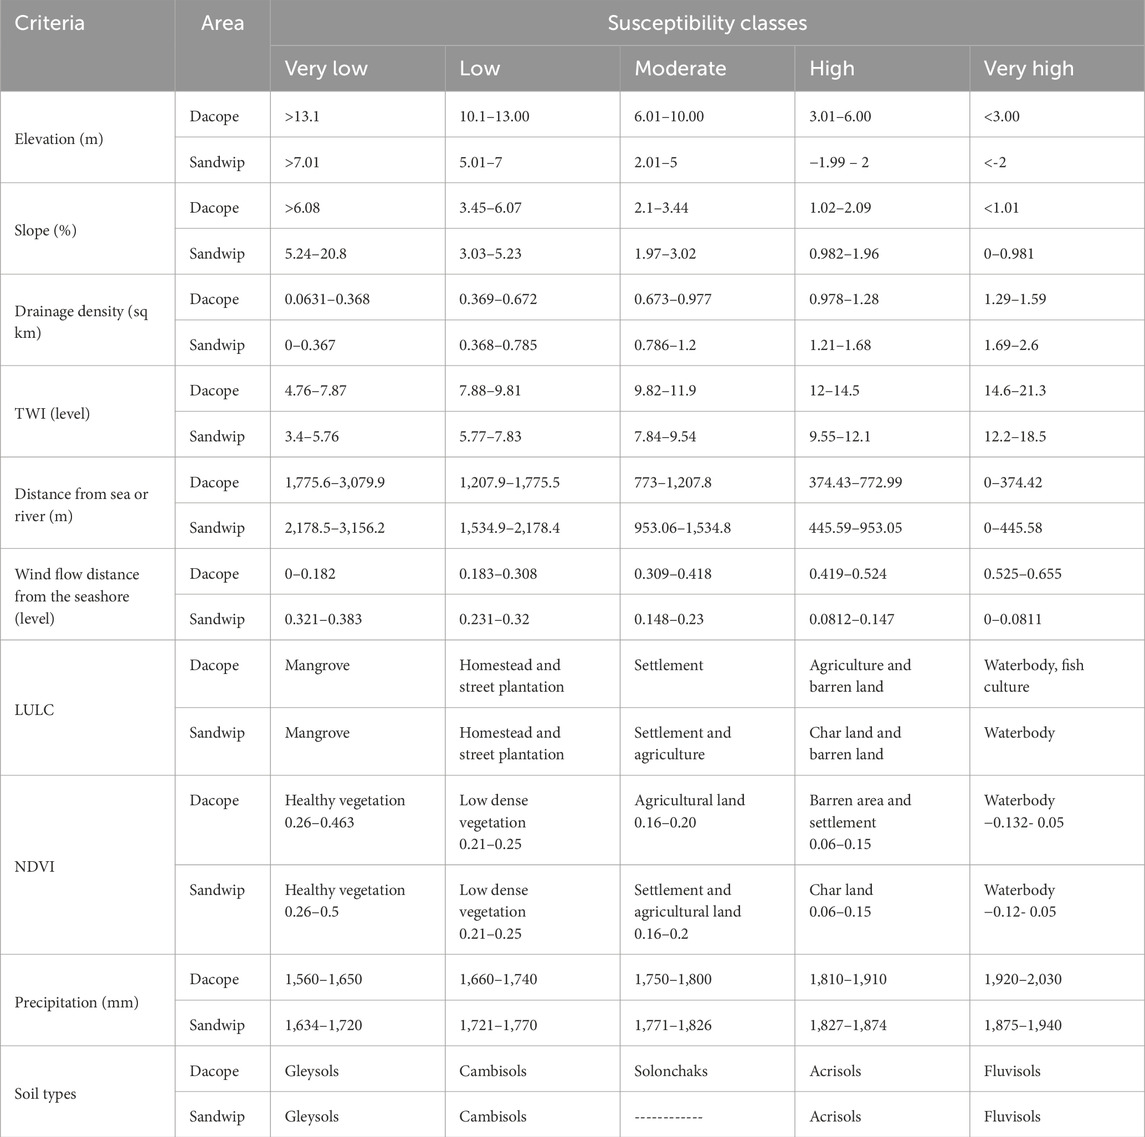
Table 3. Susceptibility classes of different factors for Sandwip island and Dacope
All factors were categorized into five classes by applying the natural break. Only the LULC was classified through supervised classification, and NDVI classes were named based on their values (Mamun et al., 2024).
AHP considers the relative importance of the factors affecting susceptibility. Pairwise contrast matrices calculated the weight of the factors. The process includes a comparison matrix, comparison normalization, Consistency Index (CI), and Consistency Ratio (CR) formation (Hussain et al., 2023).
In Equation 3, λmax expresses the product of the sum of columns in a pairwise matrix and the average weight from the normalized matrix, and n denotes the matrix’s order.
In Equation 4, RI is elaborated as a Random Index, which shows a standard value depending on the number of factors participating in the analysis.
Saaty introduced the method AHP in the 90s (Saaty, 1987), and later, it became widespread in various research areas. The relative importance was assigned and calculated on a scale of 1 to 9, which had a distinct meaning (Saaty, 2008). For example, 1 means equal importance, 3 means moderate importance, 5 means strong importance, 7 means more strong importance, and 9 means extreme importance. The intermediate values 2, 4, 6, and 8 are the intermediate stages of the upper and lower scales. The importance of one factor to another in the context of satisfying a specific objective is determined through this numbering. This study used a template developed and distributed by (Goepel, 2013), by which the relative importance was calculated by inputting the opinion of the experts. This relative importance was used as the factor’s weight and included in the overlay process during the final susceptibility map preparation.
The Frequency Ratio (FR) technique was previously used in other studies, for example, in landslide risk analysis (Youssef et al., 2023; Aziz et al., 2024). Recently, the method has also been used in flood susceptibility analysis (Addis, 2023; Barman et al., 2024). The process assesses a bivariate relationship between the dependent and independent variables. In this study, the dependent variable was the flooded area, and the independent variable was flood factors. The following equations were adopted from (Rahman et al., 2023; Youssef et al., 2023).
In Equation 5, FP = flood points in the factor class, P = total flood points, FA = factor class area, A = total area. Then, FR must be normalized into probability ranges (0,1) using Equation 6.
Predicted Rate (PR) is the interrelationship between actual flooded areas (training data points) and inundation factors, which can be determined by using Equation 7.
The study gathered 120 flooded points from each site and randomly separated 80 flooded points as training datasets. The remaining points (40) were used for the accuracy test. The bivariate statistical relationship between surge inundation factors and actual flooding points was calculated on the geospatial platform, and FR values were calculated (Tables 4, 5). The value represents the susceptible level for each of the factors. For example, slope percentage is negatively correlated with susceptibility. Therefore, more slope gradient means less susceptibility to surge inundation. In the case of Sandwip, the slope represents five classes, where the first-class FR value is 0.00052, which belongs to a high slope percentage >5.24. The FR value of the subsequent classes increases with the decrease in slope percentage. Finally, the fifth-class FR value 0.00291 corresponds to <0.981 percentage class (Table 4). Similarly, in the case of Dacope, the second slope class is (3.45–6.07) %, which has an FR value of 0.00024, and the fifth class is <1.01%, which has an FR value of 0.00076 (Table 5). Here, both the fifth classes have higher pixel values, which indicates that both the areas were very highly susceptible to surge inundation regarding slope. The other factors can be explained through this process. However, it might be possible that particular classes may not follow the chronological order of the FR value of any factor because of the correlation of that class to susceptibility—for example, the LULC and NDVI classes. Besides, a particular class of a factor may have zero (0) FR value due to the null or very negligible value of the class area and pixel value.
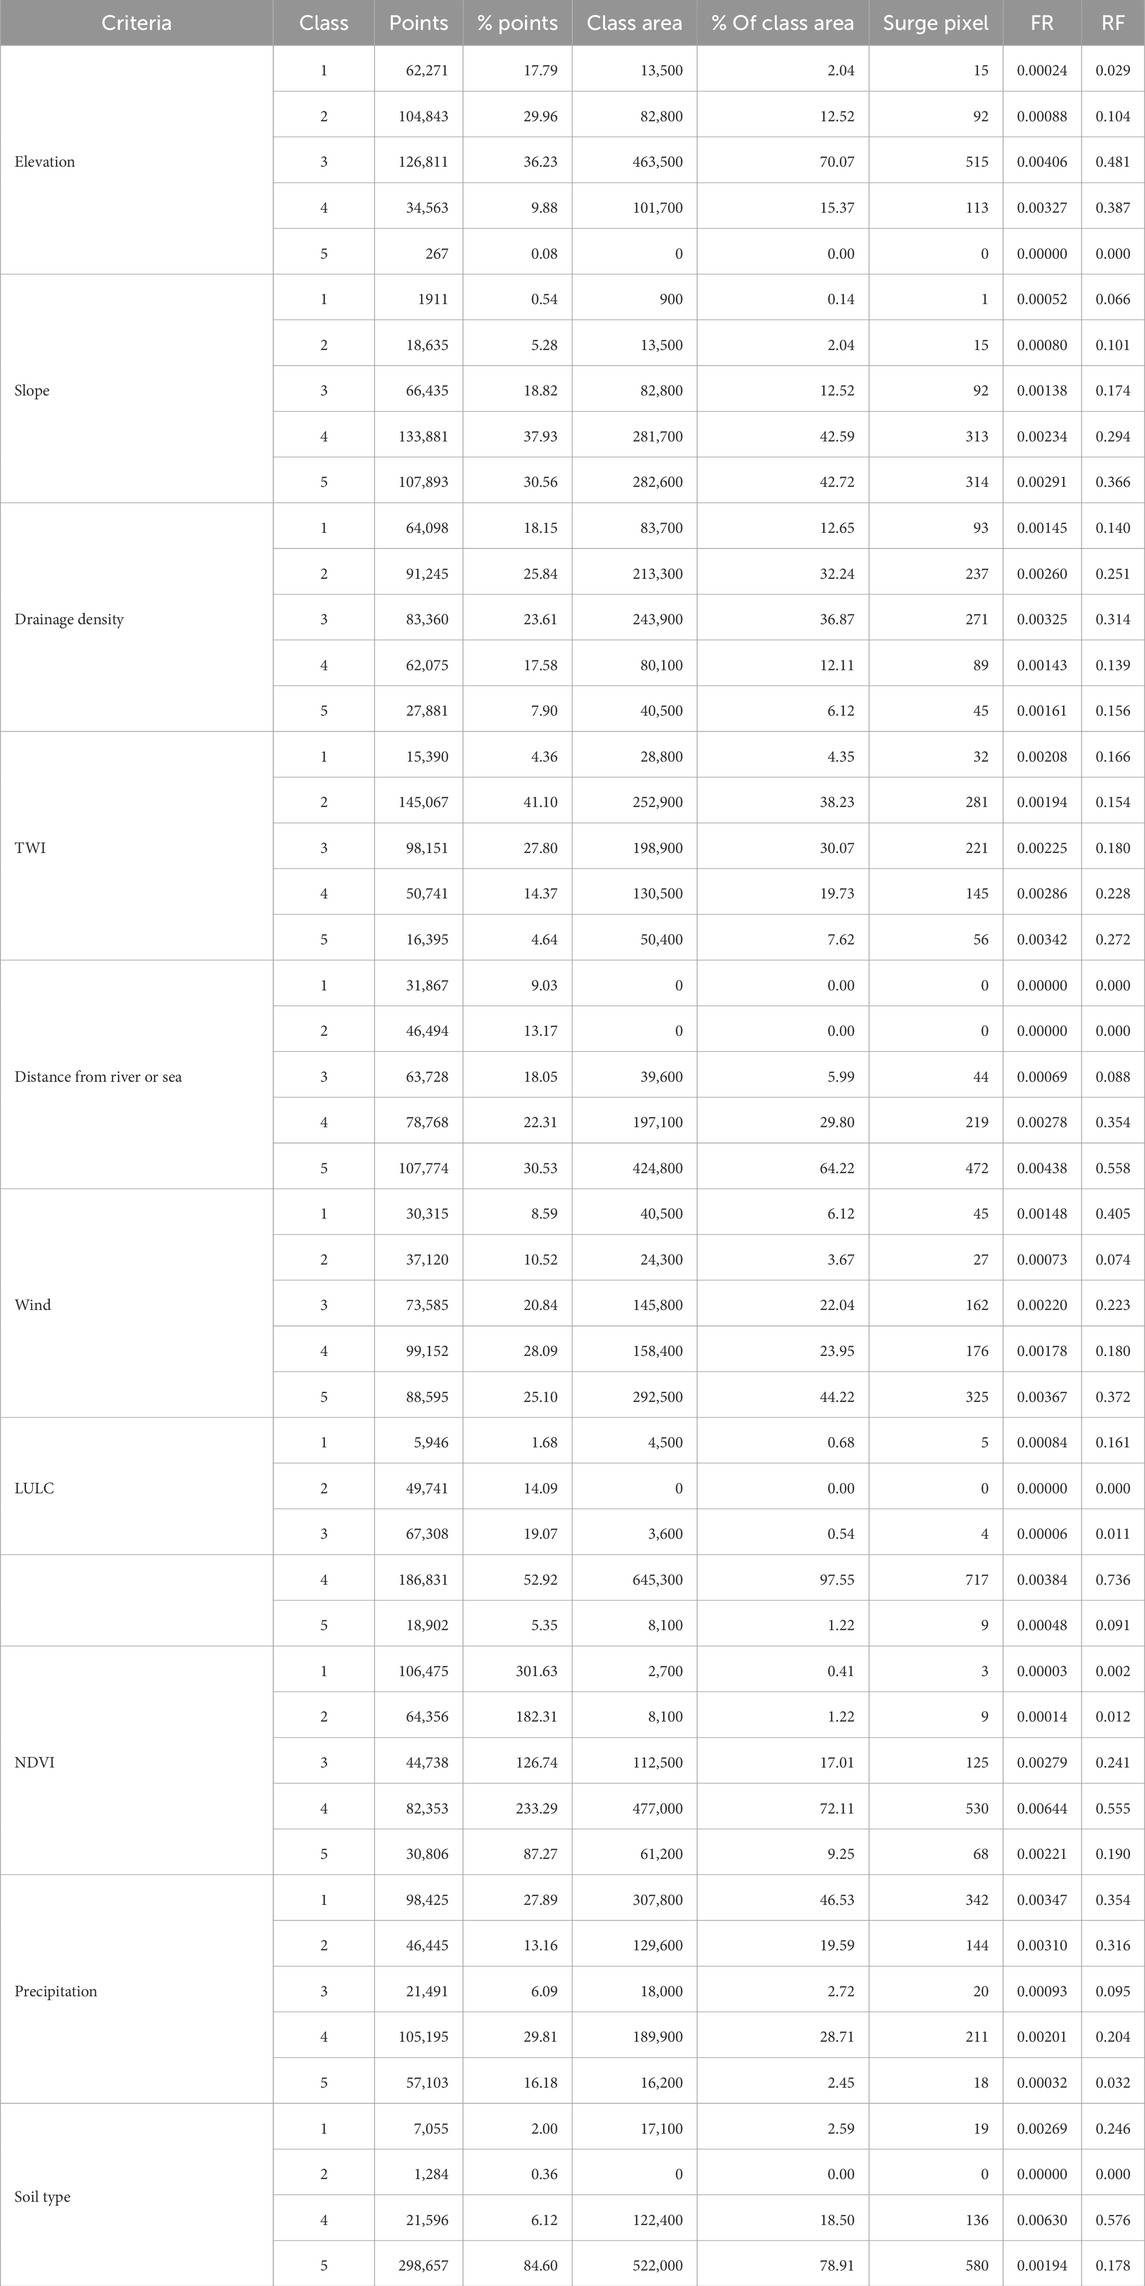
Table 4. Details of the surge flood susceptibility criteria and their FR values (Sandwip).
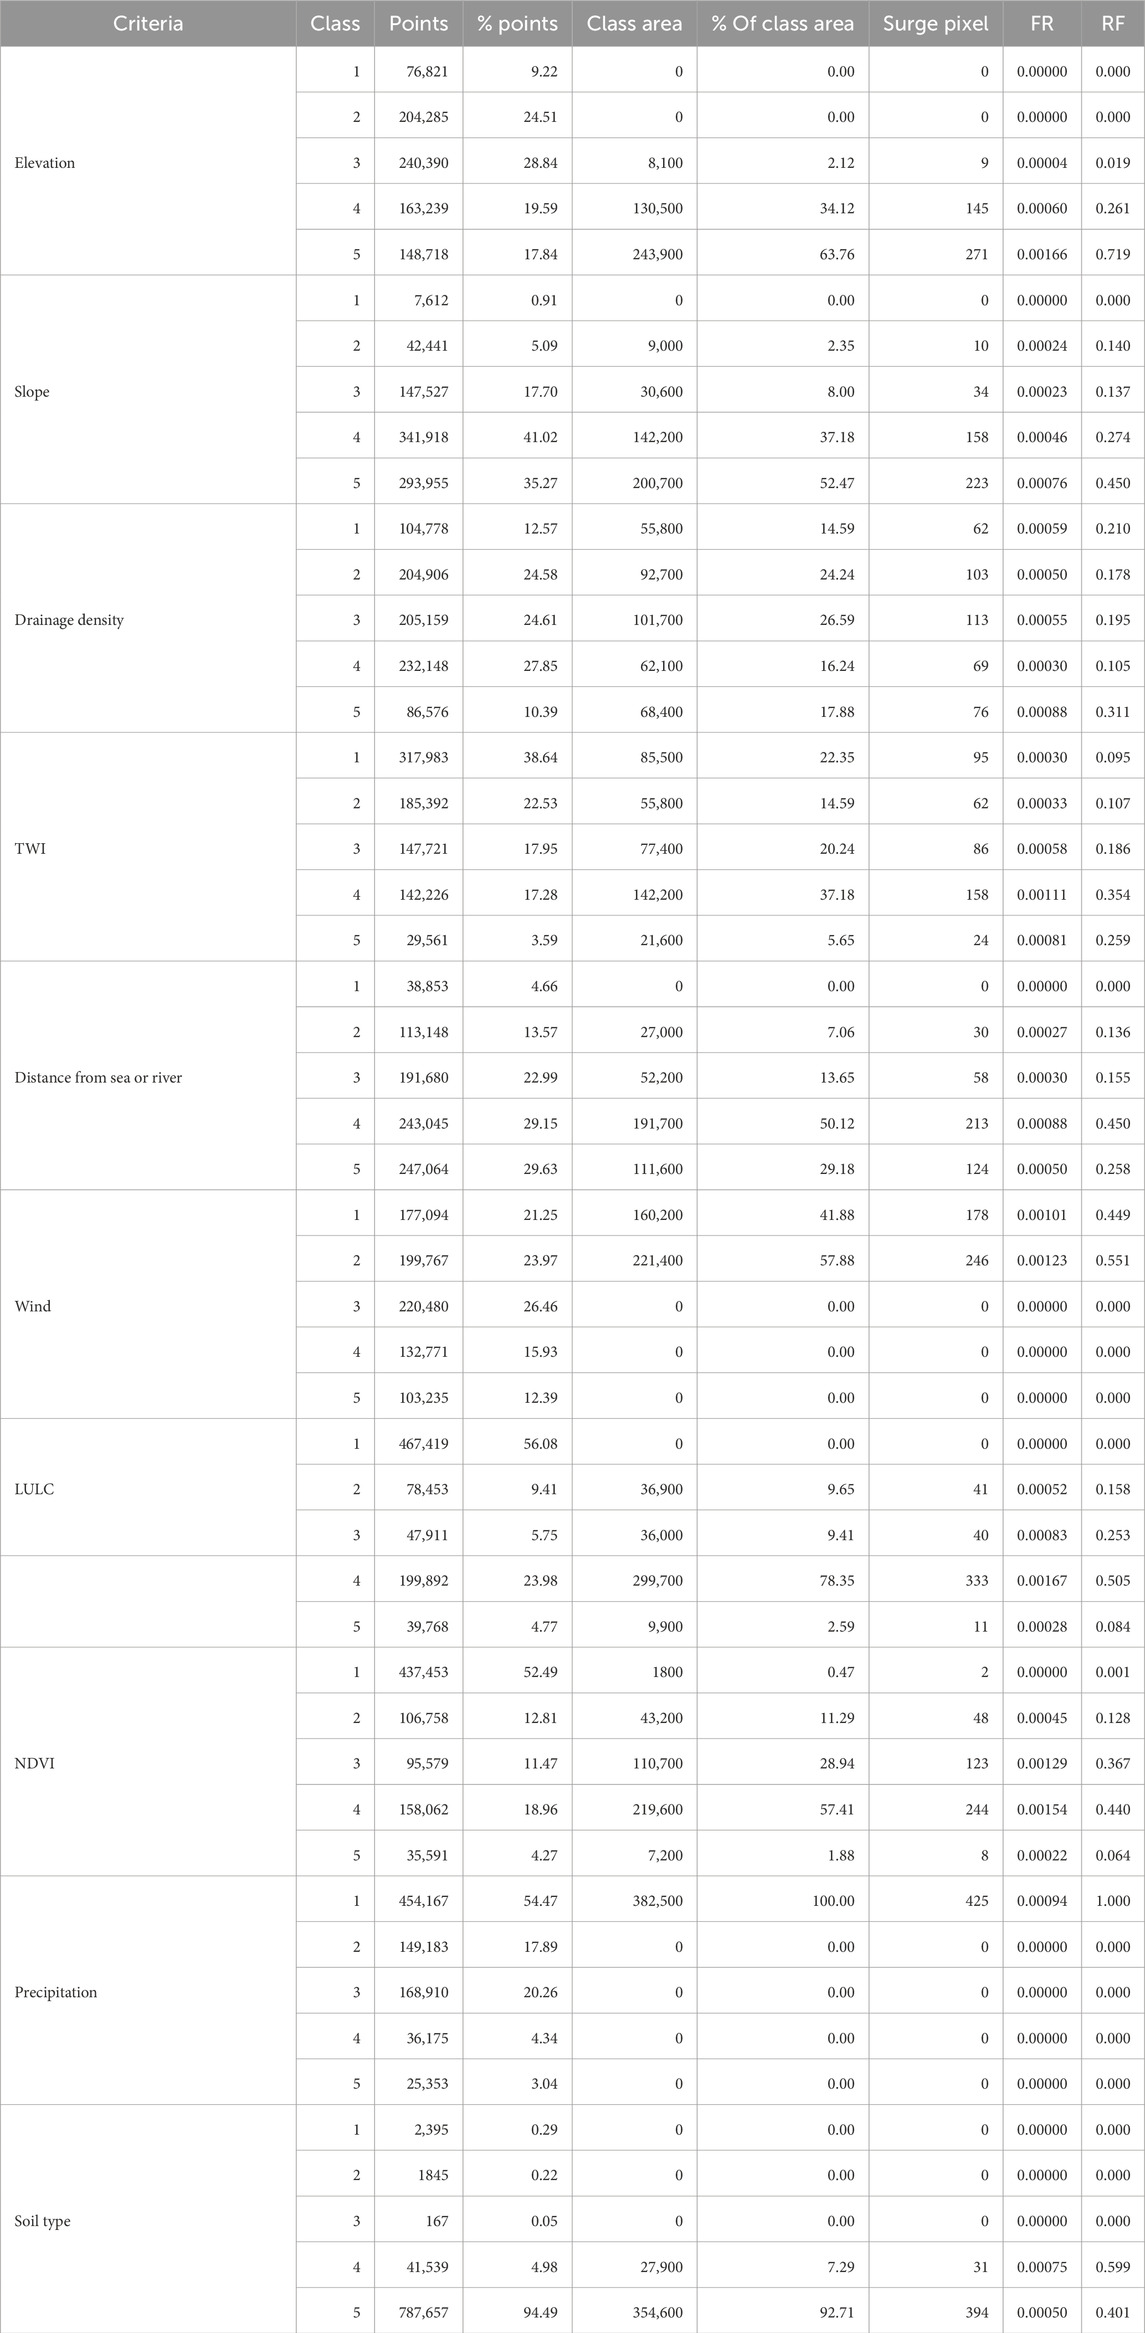
Table 5. Details of the surge flood susceptibility criteria and their FR values (Dacope).
Artificial Neural Networks (ANN) have significant advantages in regression problem analysis. It can learn nonlinear relationships from complex data and adapt to complex input-output mapping relationships. The network’s deep structure allows it to capture multilevel abstract representations of the input features, leading to a better understanding of the underlying patterns in the data. Thus, ANN can handle complex data structures in regression problems and adaptively learn and optimize models. This study optimized the internal parameters of the ANN by employing a Bayesian approach (Shanmuganathan, 2016).
The k-nearest neighbor (KNN) method calculates the distance between the input sample points and each sample point in the training set (usually using the Euclidean distance or the Manhattan distance). Then, it selects the k, the closest neighboring sample points, as the basis for prediction. In a regression problem, the nearest-neighbor method takes the weighted average or direct average of the output values of these k neighboring sample points and uses them as the predicted output values of the input sample points (Ling et al., 2020).
Random Forest (RF) is a regression algorithm based on voting from multiple decision trees. In constructing each decision tree, RF uses bootstrap sampling to select training samples and extract features randomly, which helps to deal with high-dimensional data, reduces overfitting, and improves the model’s generalization ability (Breiman, 2001). In this study, the 160 constructed inundated and non-inundated points were used as the sample set, divided into training and test sets in the ratio of 7:3, and combined with the feature factors as the input data for the three models, which ultimately resulted in the stability prediction maps of the three models.
Different feature raster values were extracted according to the location of the sample points. The sample points and their corresponding feature values were composed into different vectors. These vectors were put into the model for training. The trained model was then used for overall susceptibility prediction. In the sample collection process, only inundated or uninundated locations were considered. However, the susceptibility evaluation required the frequency and duration of the inundation. So, in the subsequent sample selection process, the composition and spatial distribution of the sample were determined according to the historical data. This study considered 80 flooded and 80 non-flooded training points for susceptibility analysis (Figure 3).
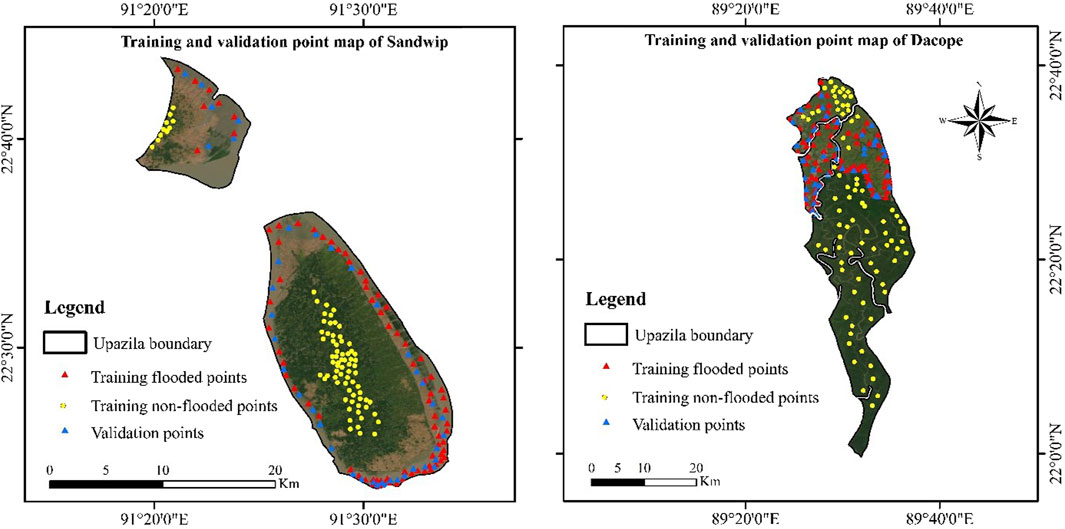
Figure 3. Training and validation points for susceptibility and accuracy analysis.
Accuracy is crucial when applying several methods for a specific analysis (Hasanuzzaman et al., 2022b). The current study used five different methods for susceptibility analysis. Therefore, their accuracy should be of great interest for future applications in similar research. Receiver Operating Characteristics (ROC) can suitably assess classification performance (Yariyan et al., 2020). The ROC process measures the true and false positive rate and provides the number of categorized cells that match accurately or speciously. Area Under Curve (AUC) generally describes the trend and provides the reliability of the methods used in the analysis (Avand et al., 2021). One hundred twenty flood points were identified for each of the study sites through field surveys and historical flooded area identification by the community people. The field surveys were conducted in July 2024. The GPS locations of flooded and non-flooded points were collected through a vigorous survey. Then, the raster format was created for those points and overlaid in the location area. Out of the 120 flooded points, 40 were separated randomly and used for validation (Figure 3).
Ten factor-maps expressing five inundation susceptibility classes were prepared for each site. The elevation map of Sandwip island showed very low to low susceptibility in the middle part and very high susceptibility in the right corner of the segregated part of the upazila. On the contrary, very high susceptibility was found in the upper part and moderate to very low susceptibility in the lower part of Dacope upazila. Both places showed very gentle slopes, thus possessing very high to high susceptibility in most areas.
Drainage density maps of both sites demonstrated many streams and channels, thus triggering more susceptibility. During any surge inundation the water can enter to the inland areas through any types of channels. Some big rivers characterize the upper part of Dacope, and the lower part has many prominent canals (Islam et al., 2012b). Therefore, Dacope revealed more very high to high susceptibility than Sandwip.
More TWI means more water to follow which increases susceptibility. Two sites demonstrated that Sandwip possessed very high and high susceptibility classes compared to Dacope in regards to TWI.
During the rainy season a good amount of rainfall occurred all over the country. However, the 10 year’s average precipitation provided some variations among different parts of the upazilas. Moderate to very high precipitation susceptibility was observed in the upper area of Sandwip island and the lower part of Dacope upazila (Figure 4).
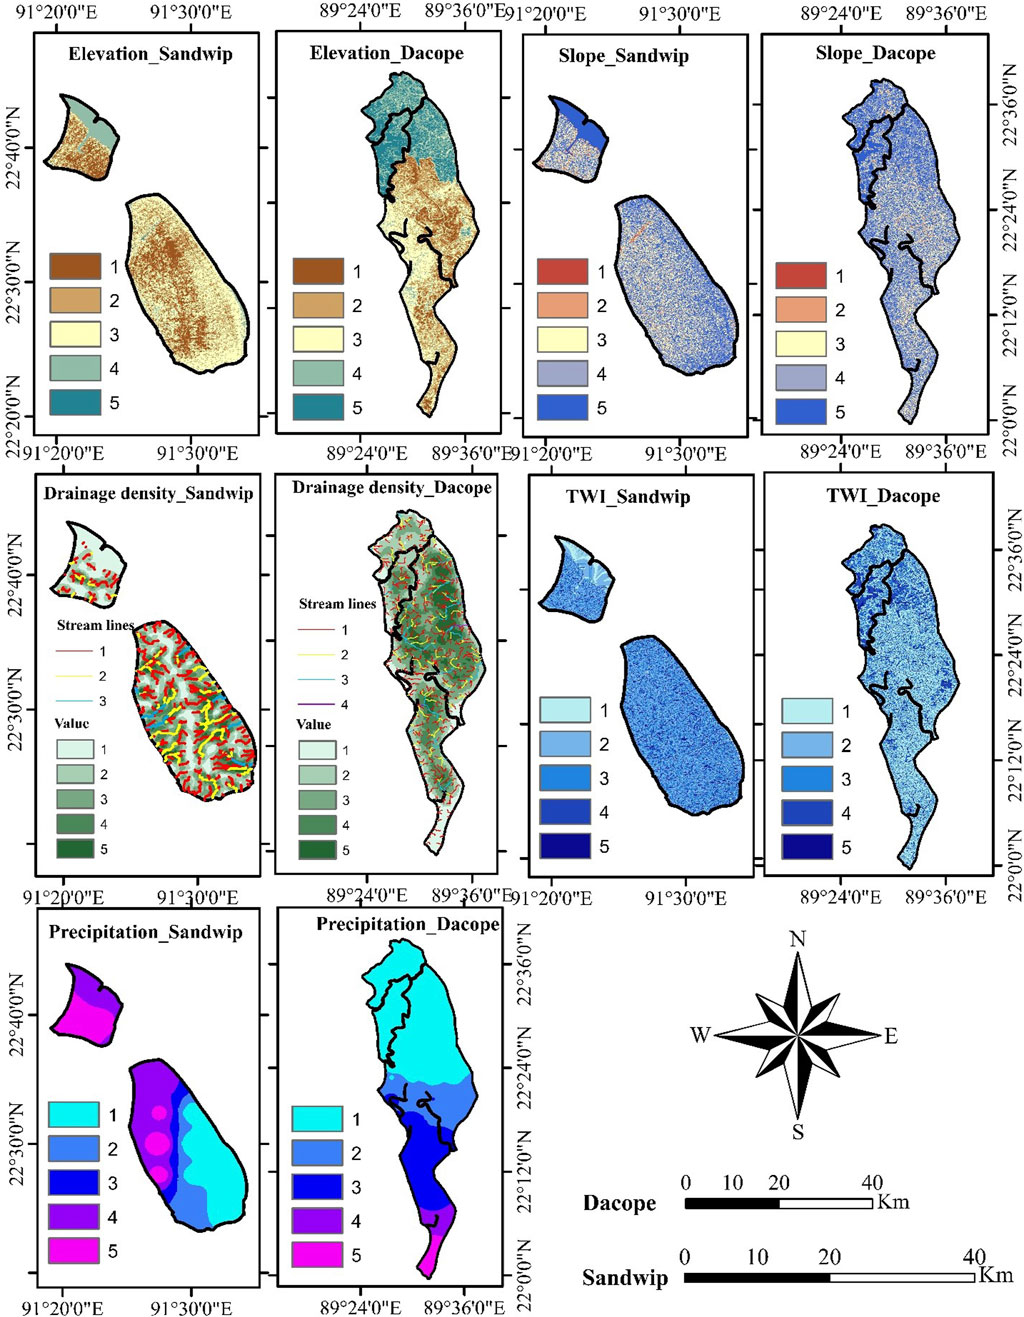
Figure 4. Factor maps of elevation, slope, drainage density, TWI, and precipitation for Sandwip island and Dacope upazila.
Distance from the river or sea map of Sandwip displayed that the surroundings of the upazila had very high susceptibility because this was an island in the Bay of Bengal, and fewer rivers were present there. On the contrary, Dacope showed susceptibility to distance from river or sea because many prominent rivers and canals were spread all over the upazila.
Five Euclidean distances from the southern shoreface to the inland northward movements create five wind classes. Due to the ghast of wind, the wave actions and flow movement vary. Wind flow distance maps illustrated more susceptibility in the southern region of both upazila, which reduces to the northward.
LULC classification of Sandwip island categorized the surrounding area of the upazila as char and barren land. Thus, this area was under high susceptibility. In the middle of the island, there were homesteads and street plantations that were denoted to have low susceptibility. On the other hand, in the lower part of Dacope, there were mangrove forests, leading to very low susceptibility—the upper part of the upazila comprised agricultural land categorized as moderate susceptibility to inundation. The same explanation can be expressed for NDVI on both sites. More NDVI defined good vegetation cover, which was responsible for susceptibility reduction.
Fluvisols type of soil was dominant in both the study sites. This soil is young in nature and rich in sediments. Therefore, most regions of both upazila had very high susceptibility classes to cyclone surge inundation (Figure 5).
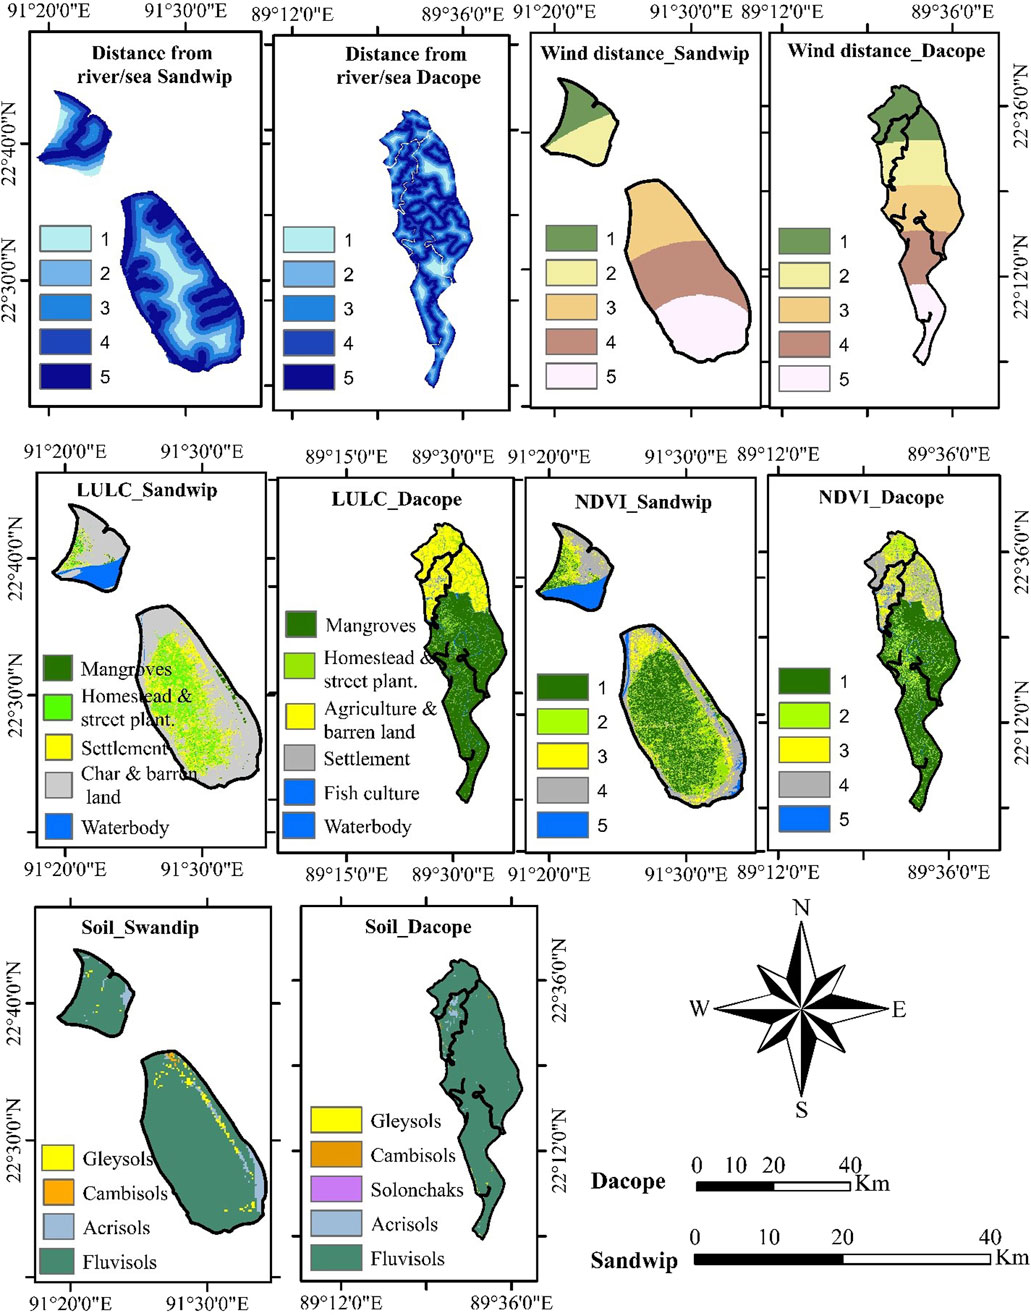
Figure 5. Factor maps of distance from river or sea, wind distance, LULC, NDVI, and soil types for Sandwip island and Dacope upazila.
The experts considered that distance from the river or sea and elevation were the most influential factors among the ten factors (Table 6). Then, LULC, slope, NDVI, and drainage density were reflected as vital factors in cyclone surge inundation susceptibility. According to the expert opinion, soil type, precipitation, TWI, and wind flow distance were the least dominant factors for inundation susceptibility. The distance from the river or sea was found to be the most influential criterion in assessing cyclone surge susceptibility in a coastal area of Bangladesh (Mamun et al., 2024).
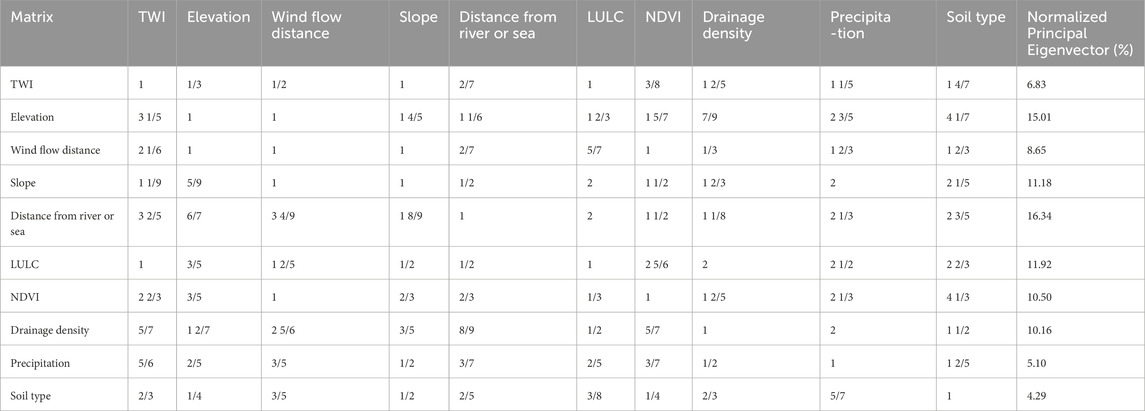
Table 6. AHP scores based on expert’s opinion on surge susceptibility factors based on (Saaty, 2008; Goepel, 2013).
Using the AHP scores, i.e., Normalized Principal Eigenvector (%), the inundation susceptibility maps were prepared for Sandwip and Dacope (Figure 6). GIS-AHP multi-criteria analysis showed that very high (17.49% of Sandwip, 9.77% of Dacope) and high (28.43% of Sandwip, 18.61% of Dacope) susceptibility classes were located all around the Sandwip island and upper part of Dacope (Figure 6). The lower part and right side of the small segregated area of Sandwip were revealed under the high susceptibility class. The middle portion of Sandwip island and the lower portion of Dacope are considered low and very low susceptibility concerning cyclone surge inundation. Moderate susceptibility class was depicted throughout the area for Sandwip (24.77%) and Dacope (23.67%) upazila.
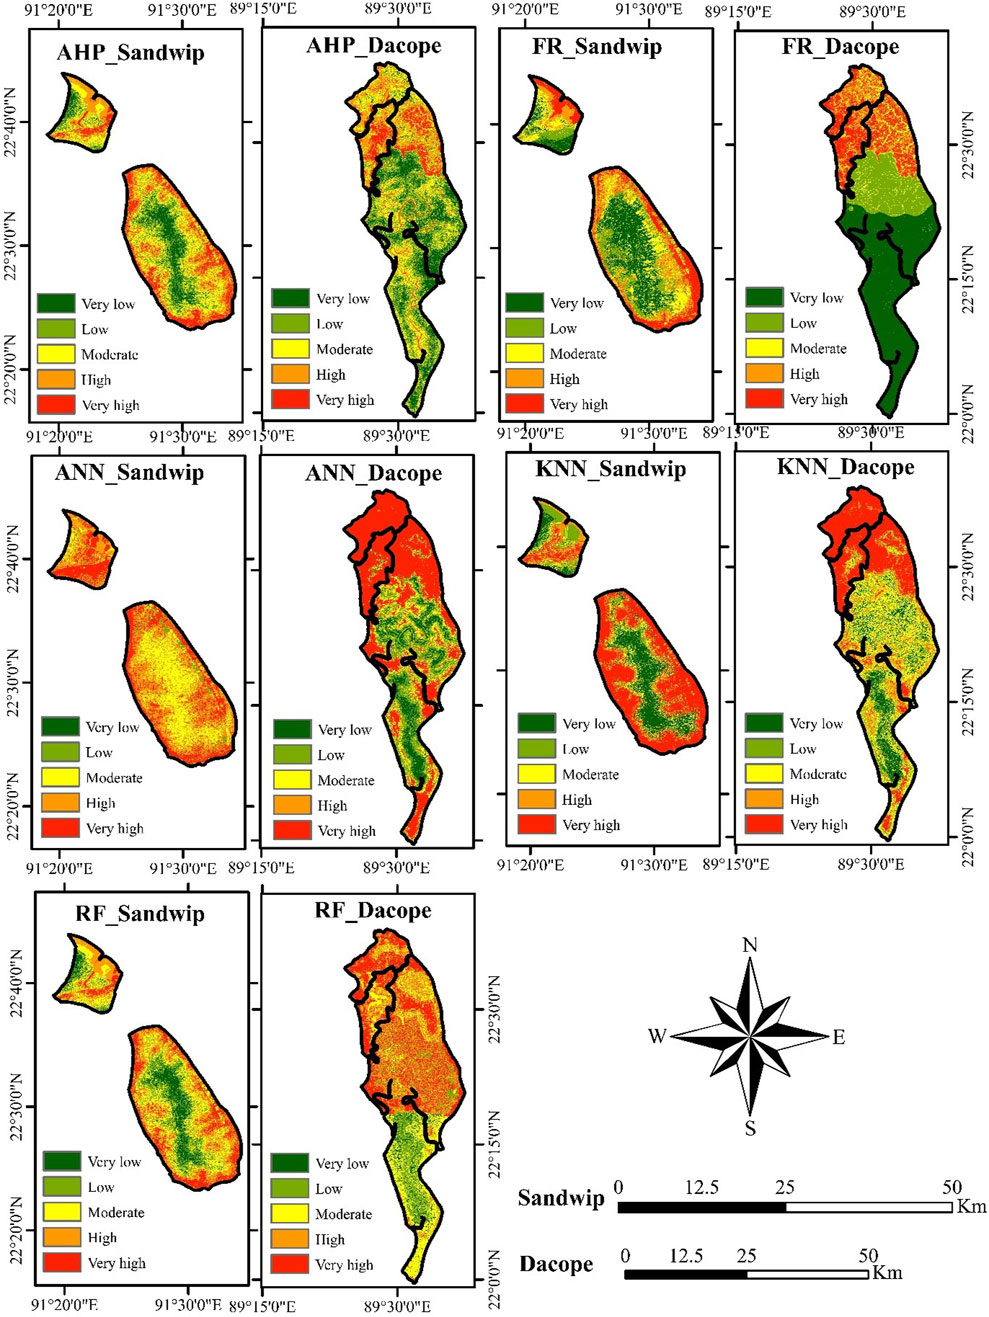
Figure 6. Cyclone surge inundation susceptibility of Sandwip island and Dacope upazila by different methods.
Surge inundation factors and actual flooding points are compared in a bivariate fashion in FR analysis. Table 7 showed that LULC possessed the highest PR value (6.15), followed by NDVI (4.68), distance from river or sea (3.99), elevation (3.84), and so on for Sandwip. So, these factors influenced high susceptibility in FR analysis in Sandwip. On the contrary, TWI (1.00) was found to be the lowest dominant criterion for FR analysis. Similarly, precipitation (9.88), elevation (6.92), NDVI (4.33), and LULC (4.16) were regarded as highly contributory factors for surge inundation susceptibility analysis for Dacope FR calculation. Wind flow distance was the least significant for the same area.
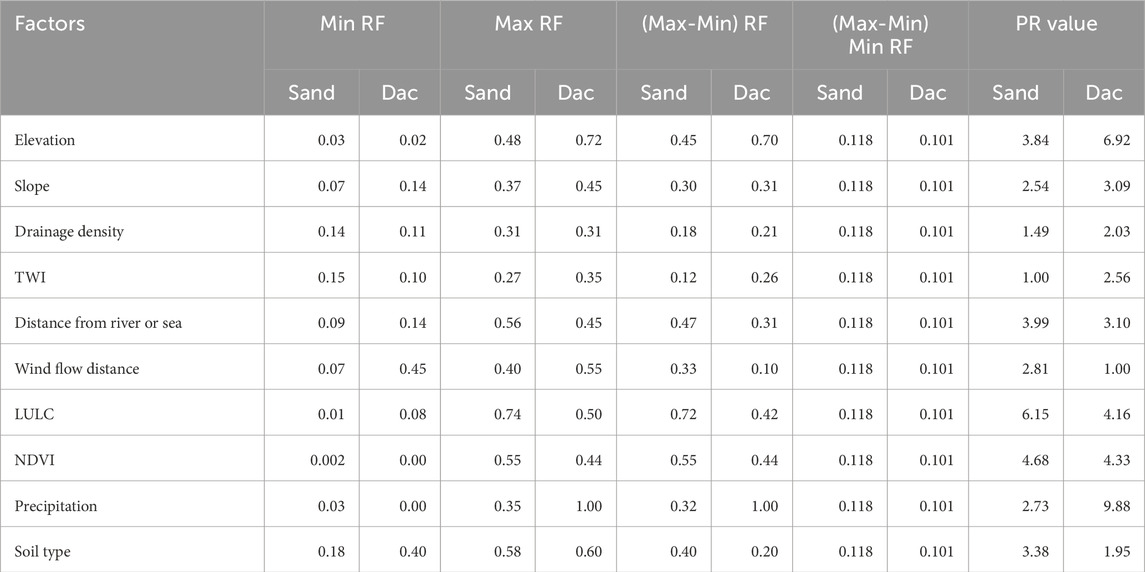
Table 7. PR values of surge flooding criteria and their contribution to susceptibility.
Like the AHP susceptibility analysis, FR showed a similar type of susceptibility class. However, the very low and low classes covered relatively more areas in both upazila. Another critical difference was that the very low (45.03%) and low (19.38%) susceptibility classes were very distinguished in Dacope (Figure 6). Moderate susceptibility to surge inundation area was very distinct in Sandwip island. In the case of Dacope, the moderate class was insignificant (6.89%).
Surge inundation susceptibility analysis of Sandwip by ANN showed that most of the areas were in very high (28.09%) to high (40.91%) classes (Figure 7). Very low (3.26%) and low (2.27%) areas were mostly absent in the figure. The moderate susceptibility class was depicted in the middle of the island. On the other hand, ANN analysis of Dacope showed a very high (49.41%) susceptibility class in the upper and very lower parts of the upazila. However, unlike Sandwip, a low (20.57%) susceptibility class was visible in the lower middle part of the Dacope upazila (Figure 6).
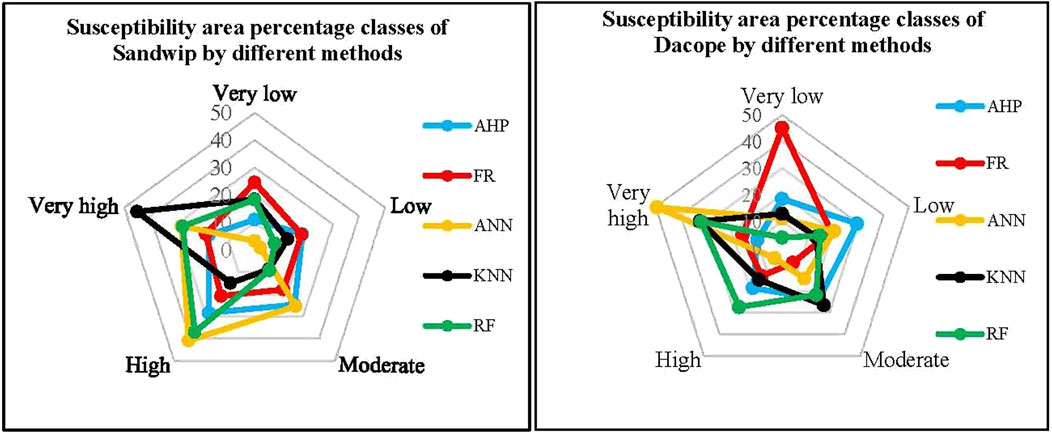
Figure 7. Susceptibility area percentage classes of Sandwip island and Dacope upazila by different methods.
KNN analysis for Sandwip showed a very high (45.07%) susceptible class around the island. A very low (18.44%) class susceptibility was found in the middle part of the island and the upper part of the segregated region of the upazila (Figure 6). The surge inundation susceptibility of Dacope by KNN was mostly similar to the outcome of the ANN analysis (32.44% very high class). However, it had a more moderate (26.57%) susceptibility class with low and very low susceptibility classes (Figure 7).
Cyclone surge inundation susceptibility by RF in Sandwip looked similar to the outcome of the AHP analysis. The outer region of the island revealed very high (27.64%) to high (37.09%) susceptible classes and very low to low classes in the central part (Figure 7). RF analysis for Dacope displayed the upper and middle lower regions of the upazila comprised of very high 31.92%), high (27.45%), and moderate (21.76%) susceptibility classes. Besides, the lower portion of the upazila demonstrated low and moderate susceptibility classes (Figure 6).
The maximum accuracy for cyclone surge inundation susceptibility analysis was found in FR and ANN for Sandwip and Dacope, respectively. The AUC value for the Sandwip analysis showed chronological values as AHP > KNN > RF > ANN. However, all the values were acceptable within standard ranges (Mandrekar, 2010). On the contrary, the Dacope’s AUC value showed that only the RF analysis was behind the standard range (0.63). The other analyses, FR, AHP, and KNN, showed sufficient accuracy for Dacope (Figure 8). Therefore, the outcome of the analysis using different methods was accepted according to the ROC calculation.
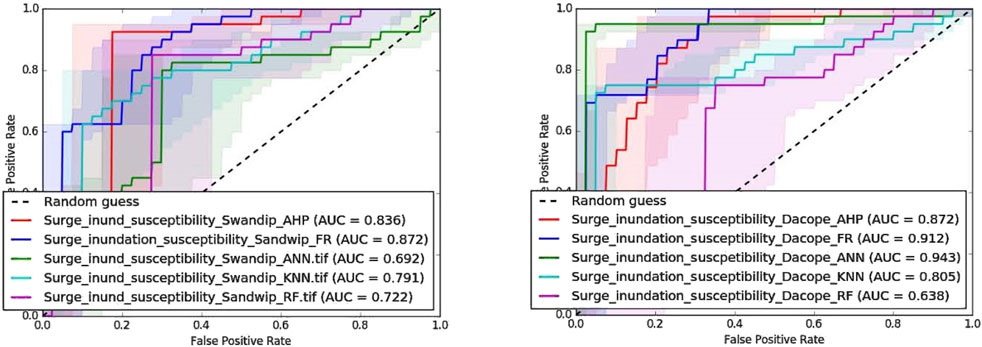
Figure 8. Accuracy validation of different methods to surge inundation susceptibility analysis.
Flood susceptibility analysis through AHP (Mourato et al., 2023; Rana et al., 2023; Sarkar et al., 2023) and FR (Hasanuzzaman et al., 2022b; Saha et al., 2022; Sarkar et al., 2022; Addis, 2023; Dutta et al., 2023; Ghosh et al., 2023; Megahed et al., 2023) has become popular recently. Machine learning algorithms have also been newly applied for flood susceptibility analysis (Avand et al., 2021; Meliho et al., 2021; Rahman et al., 2021; Hussain et al., 2023). However, the AHP, FR, ANN, KNN, and RF methods to analyze cyclone surge inundation susceptibility in this study was relatively new in this field. Previously, the cyclone surge susceptibility was assessed by calculating the Surge Decay Coefficient (SDC), which only depended on surge height and DEM (Akter and Dayem, 2021; Hoque et al., 2021). Besides these characteristics, several other issues were significant for inundation susceptibility, such as slope, TWI, distance from the river or sea, drainage density, LULC, NDVI, precipitation, etc. The wind flow distance from the seashore was also considered influential as the wind force reduced with distance from the seashore. All these factors were included in this current study. Research related to cyclones was mostly considered impact and vulnerability analysis. The impact assessment included the effect of cyclonic events on life loss, property damages, transportation destructions, etc. (Fakhruddin et al., 2022). A few studies were also based on LULC (Charrua et al., 2021). Vulnerability analysis was primarily based on social and economic indicators (Roy and Blaschke, 2015; Quader et al., 2017). On the contrary, this study considered only the physical properties for susceptibility analysis. A recent study was conducted on the Bangladesh coast to determine the cyclone surge susceptibility of a coastal upazila using AHP and FR techniques (Mamun et al., 2024). The study site of that research was located on the exposed coast, and its southern boundary was open to the Bay of Bengal. However, many other geographical contexts prevailed on the Bangladesh coast. Thus, both study sites of the current research were selected purposively. Sandwip island was a common place for cyclone surges that caused severe havoc to the lives and property of its inhabitants. A great cyclone devastated the island, causing 140,000 casualties in 1991 (Flather, 1993). Besides, due to the open boundaries surrounding the island with the Bay of Bengal, the area was more prone to cyclonic events. On the other hand, Dacope upazila possessed unique geographic and demographic characteristics; the lower portion was covered by mangroves where no people were living, and the upper portion was inhabited heavily. Besides, the upazila was surrounded by two mighty rivers from the west and east side. Additionally, a few other rivers and prominent canals flowed inside the upazila. During the cyclone Morel, the upazila has recently been flooded due to high surges in several places (IFRC, 2024b). Hence, both sites were selected purposely to discover the susceptibility differences due to cyclone surge inundation.
According to the factor maps, both study sites had a low gradient, evident in various research studies (Hoque et al., 2019; Islam et al., 2020). Therefore, the low elevation and gentle slope characteristics should be considered in disaster risk reduction (DRR) planning. The Bangladesh Water Development Board (BWDB) constructed embankments and polders in the coastal areas (Rahman et al., 2022). The height of the structures should be determined based on the previous cyclonic surge height. Besides, well-planned water regulators should be ensured before the construction. Because the drainage density showed numerous stream flows in the areas (Figure 4). Bangladesh was characterized by heavy precipitation during the monsoon period (Mondal et al., 2020). Besides, colossal precipitation occurred during cyclonic events, especially during cyclone landfall (Moon et al., 2023). Thus, the amount of rainfall needs to be considered during the susceptibility modeling and planning process. Rivers and canals were spread throughout the entire area, especially in Dacope, making the sites more susceptible (Figure 5). These rivers’ banks and canals would overflow and inundate a large area during any surge. As the rivers are directly linked to the Bay of Bengal, the surge wave pushes rapidly with more height to the northward direction during the cyclone. This triggers the water to be inundated more areas inside the upazila. Due to the absence of a proper drain-out procedure, the water remained on the land surface longer (Roy et al., 2022). Hence, hydraulic structures such as embankments, dams, sluice gates, etc., should be appropriately maintained.
Fluvisols, a relatively new soil, characterized most areas (IUSS Working Group WRB, 2015) as susceptible to inundation. The lower portion of Dacope and the middle portion of Sandwip were characterized by healthy vegetation (Figure 5). The final susceptibility map showed similarities to the LULC and NDVI susceptibility classes. Therefore, it was evident that mangroves and healthy vegetation had the potential to reduce cyclone surge inundation susceptibility. Based on this outcome, a coastal green belt should be mandatory along the entire southern coast of Bangladesh. The south-western side of the coast was covered with Sundarbans’ natural mangrove forest (Begum et al., 2021). Many other coastal regions, including several islands, were gone under mangrove plantations by the Bangladesh Forest Department (BFD) (Mahmood et al., 2023). However, many opportunities remain for mangrove plantations in the coastal area. In addition, like Dacope, a green belt of at least a minimum width should be maintained to reduce the impacts of cyclonic events.
This study discussed two main issues: inundation susceptibility analysis of two distinct areas and the suitability of geospatial techniques and algorithms used in cyclone surge inundation susceptibility analysis. From the results of the susceptibility analysis, Sandwip showed susceptibility primarily in areas around the island. The middle part showed very low to low susceptibility in all the analyses. One of the primary causes was that the island had been surrounded by seawater. There were a few patches of plantation mangroves in some locations of Sandwip. However, they were too low to reduce the susceptibility of the cyclone surge inundation in the surroundings. Conversely, in the middle of the island, there was low susceptibility presented because of the unavailability of rivers or canals, the presence of vegetation cover, and higher elevation. On the contrary, very high and high susceptibility was observed in the northern part of the Dacope upazila, whereas the southern part was adjacent to the seawater. The mangroves chiefly triggered the dissimilarities of the outcome. Mangroves could reduce cyclonic impacts, including wind force and wave action (Mahmood et al., 2023). Besides, the northern parts were characterized by two mighty rivers from the west and east sides. The LULC and NDVI analysis also supported the high susceptibility in the northern part.
Geospatial techniques were more accurate than machine learning algorithms except for ANN analysis for Dacope. Many studies found high AUC values in different susceptibility analyses (Youssef and Pourghasemi, 2021; Alqadhi et al., 2022). The reason behind the relatively low AUC values of algorithms could be explained by their processes. Machine learning algorithms generally analyze large data sets (Adadi, 2021; Sarker, 2021). Hence, in most cases, the study area was also extensive. The present study sites were relatively small compared to the entire coastal regions or a country. Besides, the factor maps information and training sample points were not very large in numbers. Therefore, the three machine learning algorithms used in the study provided a standard accuracy level but were not better than the AHP or FR methods. Thus, these results concluded that geospatial techniques such as AHP and FR are more suitable for cyclone surge inundation analysis for small regions. However, all the analyses showed their potential to assess cyclone surge inundation susceptibility. Out of ten AUC values, only the value found by RF in Dacope showed lower than 70%. Based on this analysis, it can be concluded that geospatial techniques and machine learning algorithms are capable of inundation susceptibility analysis. However, algorithms are more suitable for large volumes of data sets.
Geospatial techniques and machine learning algorithms have recently been applied in different susceptibility assessments. This study used two geospatial techniques, i.e., AHP and FR, and three algorithms, i.e., ANN, KNN, and RF, to understand the cyclone surge inundation susceptibility of two distinct physiographic regions in Bangladesh coast. The susceptibility classes were categorized into five classes. More susceptibility was depicted surrounding Sandwip island and the upper portion of Dacope upazila. Due to the mangrove forest at the lower side of the Dacope upazila, very low to low susceptibility was predicted. However, two mighty rivers, less vegetation density, and other factors caused susceptibility in the upper portion of the upazila. On the contrary, the middle part of the Sandwip upazila was found to be very low to low susceptibility due to the greater distance from the water body, higher elevation, and the abundance of vegetation. These outcomes could be similar to those of the other coastal areas of Bangladesh. Thus, a green belt has been suggested for all along the coast, including islands, to reduce cyclone vulnerability. The outcomes from different methodologies used in the study concluded that the surge inundation susceptibility analysis could be successfully conducted by geospatial techniques, and algorithms. ROC calculation found that all five analysis processes had standard accuracy, and practitioners could use them for cyclone management. However, machine learning algorithms could perform better for extensive dataset analysis. Surge inundation susceptibility analysis of a larger area through hybrid machine learning algorithms could be the further research direction of this research conclusion.
The original contributions presented in the study are included in the article/supplementary material, further inquiries can be directed to the corresponding author.
MM: Conceptualization, Formal Analysis, Investigation, Methodology, Software, Visualization, Writing–original draft, Writing–review and editing. LZ: Conceptualization, Funding acquisition, Supervision, Writing–original draft, Writing–review and editing. YX: Investigation, Software, Visualization, Writing–original draft, Writing–review and editing. BC: Conceptualization, Resources, Writing–original draft, Writing–review and editing. JZ: Software, Visualization, Writing–original draft, Writing–review and editing. SK: Validation, Writing–original draft, Writing–review and editing.
The author(s) declare that financial support was received for the research, authorship, and/or publication of this article. The work was supported by the National Natural Science Foundation of China (Grant No. 42471368).
The authors would like to thank the China Scholarship Council (CSC) for supporting some of the authors of this article in continuing their studies at the Aerospace Information Research (AIR) Institute under the University of Chinese Academy of Sciences (UCAS). They also express their appreciation to the experts from different organizations in Bangladesh for their thoughtful contribution to the AHP multi-criteria analysis.
The authors declare that the research was conducted in the absence of any commercial or financial relationships that could be construed as a potential conflict of interest.
The author(s) declare that no Generative AI was used in the creation of this manuscript.
All claims expressed in this article are solely those of the authors and do not necessarily represent those of their affiliated organizations, or those of the publisher, the editors and the reviewers. Any product that may be evaluated in this article, or claim that may be made by its manufacturer, is not guaranteed or endorsed by the publisher.
Adadi, A. (2021). A survey on data-efficient algorithms in big data era. J. Big Data 8, 24. doi:10.1186/s40537-021-00419-9
Addis, A. (2023). GIS based flood susceptibility mapping using frequency ratio and information value models in upper Abay river basin,Ethiopia. Ethiop. Nat. Hazards Res. 3, 247–256. doi:10.1016/j.nhres.2023.02.003
Akter, A., and Dayem, A. (2021). Tropical cyclone risk mapping for a coastal city using geospatial techniques. J. Coast Conserv. 25, 1. doi:10.1007/s11852-020-00788-y
Al-Juaidi, A. E. M., Nassar, A. M., and Al-Juaidi, O. E. M. (2018). Evaluation of flood susceptibility mapping using logistic regression and GIS conditioning factors. Arab. J. Geosci. 11, 765. doi:10.1007/s12517-018-4095-0
Alqadhi, S., Mallick, J., Talukdar, S., Bindajam, A. A., Saha, T. K., Ahmed, M., et al. (2022). Combining logistic regression-based hybrid optimized machine learning algorithms with sensitivity analysis to achieve robust landslide susceptibility mapping. Geocarto Int. 37, 9518–9543. doi:10.1080/10106049.2021.2022009
Avand, M., Khiavi, A. N., Khazaei, M., and Tiefenbacher, J. P. (2021). Determination of flood probability and prioritization of sub-watersheds: a comparison of game theory to machine learning. J. Environ. Manag. 295, 113040. doi:10.1016/j.jenvman.2021.113040
Aziz, K., Sarkar, S., and Sahu, P. (2024). Comparative analysis of frequency ratio, information value, and analytical hierarchy process statistical models for landslide susceptibility mapping in Kashmir Himalayas. Arab. J. Geosci. 17, 36. doi:10.1007/s12517-023-11842-y
Barman, J., Marak, B. S., Rao, K. S., and Biswas, B. (2024). GIS-based frequency ratio model for flood susceptibility zonation in the state of Meghalaya, Northeast India. Proc.Indian Natl. Sci. Acad. 90, 1015–1028. doi:10.1007/s43538-024-00290-1
Baten, A., González, P. A., and Delgado, R. C. (2018). Natural disasters and management systems of Bangladesh from 1972 to 2017: special focus on flood. OmniScience A Multi-disciplinary J. 8, 35–47. doi:10.37591/.v8i3.753
Begum, F., Lobry De Bruyn, L., Kristiansen, P., and Islam, M. A. (2021). Institutionalising co-management activities for conservation of forest resources: evidence from the Sundarban mangrove forest management of Bangladesh. J. Environ. Manag. 298, 113504. doi:10.1016/j.jenvman.2021.113504
Charrua, A. B., Padmanaban, R., Cabral, P., Bandeira, S., and Romeiras, M. M. (2021). Impacts of the tropical cyclone idai in Mozambique: a multi-temporal Landsat satellite imagery analysis. Remote Sens. 13, 201. doi:10.3390/rs13020201
CHRS Data Portal (2023). PERSIANN- CSS. CHRS data portal, center for hydrometeorology and remote sensing (CHRS) at the HSSoE at UC irvine. Available online at: https://chrsdata.eng.uci.edu/(Accessed November 12, 2023).
Delaporte, B., Ibanez, T., Despinoy, M., Mangeas, M., and Menkes, C. (2022). Tropical cyclone impact and forest resilience in the southwestern pacific. Remote Sens. 14, 1245. doi:10.3390/rs14051245
Dutta, M., Saha, S., Saikh, N. I., Sarkar, D., and Mondal, P. (2023). Application of bivariate approaches for flood susceptibility mapping: a district level study in Eastern India. HydroResearch 6, 108–121. doi:10.1016/j.hydres.2023.02.004
Fakhruddin, B., Kintada, K., and Hassan, Q. (2022). Understanding hazards: probabilistic cyclone modelling for disaster risk to the Eastern Coast in Bangladesh. Prog. Disaster Sci. 13, 100216. doi:10.1016/j.pdisas.2022.100216
Flather, R. A. (1993). A storm surge prediction model for the northern Bay of bengal with application to the cyclone disaster in April 1991. J. Phys. Oceanogr. 24, 172–190. doi:10.1175/1520-0485(1994)024<0172:asspmf>2.0.co;2
Ghosh, R., Sutradhar, S., Das, N., Mondal, P., and Sana, R. I. (2023). A comparative evaluation of GIS based flood susceptibility models: a case of Kopai river basin, Eastern India. Arab. J. Geosci. 16, 591. doi:10.1007/s12517-023-11693-7
Goepel, K. D. (2013). “Implementing the analytic hierarchy process as a standard method for multi-criteria decision making,” in Corporate enterprises – a new AHP excel template with multiple inputs. doi:10.13033/isahp.y2013.047
Hasan, Md. H., Ahmed, A., Nafee, K. M., and Hossen, Md. A. (2023). Use of machine learning algorithms to assess flood susceptibility in the coastal area of Bangladesh. Ocean and Coast. Manag. 236, 106503. doi:10.1016/j.ocecoaman.2023.106503
Hasanuzzaman, Md., Adhikary, P. P., Bera, B., and Shit, P. K. (2022a). “Flood vulnerability assessment using AHP and frequency ratio techniques,” in Spatial modelling of flood risk and flood hazards. Editors B. Pradhan, P. K. Shit, G. S. Bhunia, P. P. Adhikary, and H. R. Pourghasemi (Cham: Springer International Publishing), 91–104. doi:10.1007/978-3-030-94544-2_6
Hasanuzzaman, M., Islam, A., Bera, B., and Shit, P. K. (2022b). A comparison of performance measures of three machine learning algorithms for flood susceptibility mapping of river Silabati (tropical river, India). Phys. Chem. Earth Parts A/B/C 127, 103198. doi:10.1016/j.pce.2022.103198
Hitouri, S., Mohajane, M., Lahsaini, M., Ali, S. A., Setargie, T. A., Tripathi, G., et al. (2024). Flood susceptibility mapping using SAR data and machine learning algorithms in a small watershed in northwestern Morocco. Remote Sens. 16, 858. doi:10.3390/rs16050858
Hoque, M., Tasfia, S., Ahmed, N., and Pradhan, B. (2019). Assessing spatial flood vulnerability at kalapara upazila in Bangladesh using an analytic hierarchy process. Sensors 19, 1302. doi:10.3390/s19061302
Hoque, M. A., Phinn, S., Roelfsema, C., and Childs, I. (2016). Modelling tropical cyclone hazards under climate change scenario using geospatial techniques. IOP Conf. Ser. Earth Environ. Sci. 47, 012024. doi:10.1088/1755-1315/47/1/012024
Hoque, M. A.-A., Phinn, S., Roelfsema, C., and Childs, I. (2017). Tropical cyclone disaster management using remote sensing and spatial analysis: a review. Int. J. Disaster Risk Reduct. 22, 345–354. doi:10.1016/j.ijdrr.2017.02.008
Hoque, M. A.-A., Phinn, S., Roelfsema, C., and Childs, I. (2018). Assessing tropical cyclone risks using geospatial techniques. Appl. Geogr. 98, 22–33. doi:10.1016/j.apgeog.2018.07.004
Hoque, M. A.-A., Pradhan, B., Ahmed, N., Ahmed, B., and Alamri, A. M. (2021). Cyclone vulnerability assessment of the western coast of Bangladesh. Geomatics, Nat. Hazards Risk 12, 198–221. doi:10.1080/19475705.2020.1867652
Hossain, I., and Mullick, A. R. (2020). Cyclone and Bangladesh: a historical and environmental overview from 1582 to 2020. Int. Med. J. 25, 2595–2614. Available at: https://www.seronijihou.com/article/cyclone-and-bangladesh-a-historical-and-environmental-overview-from-1582-to-2020
Hussain, M., Tayyab, M., Ullah, K., Ullah, S., Rahman, Z. U., Zhang, J., et al. (2023). Development of a new integrated flood resilience model using machine learning with GIS-based multi-criteria decision analysis. Urban Clim. 50, 101589. doi:10.1016/j.uclim.2023.101589
IFRC (2024a). Operation update: Bangladesh | cyclone remal. Int. Fed. Red Cross Red Crescent Soc. (IFRC) Available online at: https://reliefweb.int/report/bangladesh/bangladesh-cyclone-remal-operation-update-emergency-appeal-no-mdrbd035 (Accessed January 9, 2024).
IFRC (2024b). Super Typhoon Yagi causes severe flooding across Southeast asia. Int. Fed. Red Cross Red Crescent Soc. Bangladesh: Cyclone Remal Available online at: https://www.ifrc.org/press-release/super-typhoon-yagi-causes-severe-flooding-across-southeast-asia (Accessed September 19, 2024).
Islam, A. R. M. T., Talukdar, S., Mahato, S., Kundu, S., Eibek, K. U., Pham, Q. B., et al. (2021). Flood susceptibility modelling using advanced ensemble machine learning models. Geosci. Front. 12, 101075. doi:10.1016/j.gsf.2020.09.006
Islam, Md. R., Aziz, Md. T., Alauddin, M., Kader, Z., and Islam, Md. R. (2024). Site suitability assessment for solar power plants in Bangladesh: a GIS-based analytical hierarchy process (AHP) and multi-criteria decision analysis (MCDA) approach. Renew. Energy 220, 119595. doi:10.1016/j.renene.2023.119595
Islam, S., Miah, S., Khanam, M., and Ahmed, S. (2012a). Sandwip upazila. Banglapedia Natl. Encycl. Bangladesh. Available online at: https://en.banglapedia.org/index.php/Sandwip_Upazila (Accessed August 9, 2024).
Islam, S., Miah, S., Khanam, M., and Ahmed, S. (2012b). Dacope upazila. Banglapedia Natl. Encycl. Bangladesh. Available online at: https://en.banglapedia.org/index.php/Dacope_Upazila (Accessed August 9, 2024).
Islam, S. M. S., Tanim, A. H., and Mullick, Md. R. A. (2020). “Vulnerability assessment of Bangladesh coastline using gornitz method,” in Water, flood management and water security under a changing climate. Editors A. Haque, and A. I. A. Chowdhury (Cham: Springer International Publishing), 301–313. doi:10.1007/978-3-030-47786-8_21
IUSS Working Group WRB (2015). World Reference Base for Soil Resources 2014, update 2015 International soil classification system for naming soils and creating legends for soil maps. Rome: FAO.
Ling, N., Aneiros, G., and Vieu, P. (2020). kNN estimation in functional partial linear modeling. Stat. Pap. 61, 423–444. doi:10.1007/s00362-017-0946-0
Liu, X., Shao, S., and Shao, S. (2024). Landslide susceptibility zonation using the analytical hierarchy process (AHP) in the Great Xi’an Region, China. Sci. Rep. 14, 2941. doi:10.1038/s41598-024-53630-y
Madhuri, R., Sistla, S., and Srinivasa Raju, K. (2021). Application of machine learning algorithms for flood susceptibility assessment and risk management. J. Water Clim. Change 12, 2608–2623. doi:10.2166/wcc.2021.051
Mahmood, R., Zhang, L., and Li, G. (2023). Assessing effectiveness of nature-based solution with big earth data: 60 years mangrove plantation program in Bangladesh coast. Ecol. Process 12, 11. doi:10.1186/s13717-023-00419-y
Mamun, M. M. A. A., Zhang, L., Chen, B., Rahman, Z. U., Mahzabin, T., Zuo, J., et al. (2024). Assessment of spatial cyclone surge susceptibility through GIS-based AHP multi-criteria analysis and frequency ratio: a case study from the Bangladesh coast. Geomatics, Nat. Hazards Risk 15, 2368071. doi:10.1080/19475705.2024.2368071
Mandrekar, J. N. (2010). Receiver operating characteristic curve in diagnostic test assessment. J. Thorac. Oncol. 5, 1315–1316. doi:10.1097/JTO.0b013e3181ec173d
Mangkhaseum, S., Bhattarai, Y., Duwal, S., and Hanazawa, A. (2024). Flood susceptibility mapping leveraging open-source remote-sensing data and machine learning approaches in Nam Ngum River Basin (NNRB), Lao PDR. Geomatics, Nat. Hazards Risk 15, 2357650. doi:10.1080/19475705.2024.2357650
Martinez, A. D. L. I., and Labib, S. M. (2023). Demystifying normalized difference vegetation index (NDVI) for greenness exposure assessments and policy interventions in urban greening. Environ. Res. 220, 115155. doi:10.1016/j.envres.2022.115155
Megahed, H. A., Abdo, A. M., AbdelRahman, M. A. E., Scopa, A., and Hegazy, M. N. (2023). Frequency ratio model as tools for flood susceptibility mapping in urbanized areas: a case study from Egypt. Appl. Sci. 13, 9445. doi:10.3390/app13169445
Meliho, M., Khattabi, A., and Asinyo, J. (2021). Spatial modeling of flood susceptibility using machine learning algorithms. Arab. J. Geosci. 14, 2243. doi:10.1007/s12517-021-08610-1
Mondal, M. S., Nowreen, S., and Sakib, M. N. (2020). Scale-dependent reliability of projected rainfalls over Bangladesh with the PRECIS model. Climate 8, 20. doi:10.3390/cli8020020
Moon, M., Ha, K.-J., Kim, D., Ho, C.-H., Park, D.-S. R., Chu, J.-E., et al. (2023). Rainfall strength and area from landfalling tropical cyclones over the North Indian and western North Pacific oceans under increased CO2 conditions. Weather Clim. Extrem. 41, 100581. doi:10.1016/j.wace.2023.100581
Mourato, S., Fernandez, P., Pereira, L. G., and Moreira, M. (2023). Assessing vulnerability in flood prone areas using analytic hierarchy process—group decision making and geographic information system: a case study in Portugal. Appl. Sci. 13, 4915. doi:10.3390/app13084915
Murali, M., Misra, A., and Vethamony, P. (2018). A new insight to vulnerability of Central Odisha coast, India using analytical hierarchical process (AHP) based approach. J. Coast Conserv. 22, 799–819. doi:10.1007/s11852-018-0610-4
Penki, R., Basina, S. S., and Tanniru, S. R. (2022). Application of geographical information system-based analytical hierarchy process modeling for flood susceptibility mapping of Krishna District in Andhra Pradesh. Environ. Sci. Pollut. Res. 30, 99062–99075. doi:10.1007/s11356-022-22924-x
Quader, M., Khan, A., and Kervyn, M. (2017). Assessing risks from cyclones for human lives and livelihoods in the coastal region of Bangladesh. IJERPH 14, 831. doi:10.3390/ijerph14080831
Rahman, M., Chen, N., Elbeltagi, A., Islam, M. M., Alam, M., Pourghasemi, H. R., et al. (2021). Application of stacking hybrid machine learning algorithms in delineating multi-type flooding in Bangladesh. J. Environ. Manag. 295, 113086. doi:10.1016/j.jenvman.2021.113086
Rahman, M., Ningsheng, C., Islam, M. M., Dewan, A., Iqbal, J., Washakh, R. M. A., et al. (2019). Flood susceptibility assessment in Bangladesh using machine learning and multi-criteria decision analysis. Earth Syst. Environ. 3, 585–601. doi:10.1007/s41748-019-00123-y
Rahman, M. A., Dawes, L., Donehue, P., and Rahman, M. R. (2022). Transformation of the coastal social-ecological system in southwest Bangladesh due to empolderment. Water Hist. 14, 147–167. doi:10.1007/s12685-022-00301-2
Rahman, Z. U., Ullah, W., Bai, S., Ullah, S., Jan, M. A., Khan, M., et al. (2023). GIS-based flood susceptibility mapping using bivariate statistical model in Swat River Basin, Eastern Hindukush region, Pakistan. Front. Environ. Sci. 11, 1178540. doi:10.3389/fenvs.2023.1178540
Rahmati, O., Pourghasemi, H. R., and Zeinivand, H. (2016). Flood susceptibility mapping using frequency ratio and weights-of-evidence models in the Golastan Province, Iran. Geocarto Int. 31, 42–70. doi:10.1080/10106049.2015.1041559
Rana, S. M. S., Habib, S. A., Sharifee, M. N. H., Sultana, N., and Rahman, S. H. (2023). Flood risk mapping of the flood-prone Rangpur division of Bangladesh using remote sensing and multi-criteria analysis. Nat. Hazards Res. 4, 20–31. doi:10.1016/j.nhres.2023.09.012
Roy, B., Penha-Lopes, G. P., Uddin, M. S., Kabir, M. H., Lourenço, T. C., and Torrejano, A. (2022). Sea level rise induced impacts on coastal areas of Bangladesh and local-led community-based adaptation. Int. J. Disaster Risk Reduct. 73, 102905. doi:10.1016/j.ijdrr.2022.102905
Roy, D. C., and Blaschke, T. (2015). Spatial vulnerability assessment of floods in the coastal regions of Bangladesh. Geomatics, Nat. Hazards Risk 6, 21–44. doi:10.1080/19475705.2013.816785
Ryu, S., Hong, S.-E., Park, J.-D., and Hong, S. (2020). An improved conversion relationship between tropical cyclone intensity index and maximum wind speed for the advanced dvorak technique in the northwestern pacific ocean using SMAP data. Remote Sens. 12, 2580. doi:10.3390/rs12162580
Saaty, R. W. (1987). The analytic hierarchy process—what it is and how it is used. Math. Model. 9, 161–176. doi:10.1016/0270-0255(87)90473-8
Saaty, T. L. (2008). Decision making with the analytic hierarchy process. IJSSCI 1, 83. doi:10.1504/IJSSCI.2008.017590
Sadia, H., Sarkar, S. K., and Haydar, M. (2023). Soil erosion susceptibility mapping in Bangladesh. Ecol. Indic. 156, 111182. doi:10.1016/j.ecolind.2023.111182
Saha, S., Sarkar, D., and Mondal, P. (2022). Efficiency exploration of frequency ratio, entropy and weights of evidence-information value models in flood vulnerabilityassessment: a study of raiganj subdivision, Eastern India. Stoch. Environ. Res. Risk Assess. 36, 1721–1742. doi:10.1007/s00477-021-02115-9
Sarkar, D., Saha, S., and Mondal, P. (2022). GIS-based frequency ratio and Shannon’s entropy techniques for flood vulnerability assessment in Patna district, Central Bihar, India. Int. J. Environ. Sci. Technol. 19, 8911–8932. doi:10.1007/s13762-021-03627-1
Sarkar, D., Saha, S., Sarkar, T., and Mondal, P. (2023). Delineation of flood susceptibility zone using analytical hierarchy process and frequency ratio methods: a case study of dakshin dinajpur district, India. J. Indian Soc. Remote Sens. 51, 2447–2465. doi:10.1007/s12524-023-01777-y
Sarker, I. H. (2021). Machine learning: algorithms, real-world applications and research directions. SN Comput. Sci. 2, 160. doi:10.1007/s42979-021-00592-x
Seydi, S. T., Kanani-Sadat, Y., Hasanlou, M., Sahraei, R., Chanussot, J., and Amani, M. (2022). Comparison of machine learning algorithms for flood susceptibility mapping. Remote Sens. 15, 192. doi:10.3390/rs15010192
Shanmuganathan, S. (2016). “Artificial neural network modelling: an introduction,” in Artificial neural network modelling. Editors S. Shanmuganathan, and S. Samarasinghe (Cham: Springer International Publishing), 1–14. doi:10.1007/978-3-319-28495-8_1
Sutradhar, S., Mondal, P., and Das, N. (2021). Delineation of groundwater potential zones using MIF and AHP models: a micro-level study on Suri Sadar Sub-Division, Birbhum District, West Bengal, India. Groundw. Sustain. Dev. 12, 100547. doi:10.1016/j.gsd.2021.100547
Tasnim, K. M., Esteban, M., and Shibayama, T. (2015). “Observations and numerical simulation of storm surge due to cyclone sidr 2007 in Bangladesh,” in Handbook of coastal disaster mitigation for engineers and planners (Elsevier), 35–53. doi:10.1016/C2013-0-12806-1
Vu, V. T., Nguyen, H. D., Vu, P. L., Ha, M. C., Bui, V. D., Nguyen, T. O., et al. (2023). Predicting land use effects on flood susceptibility using machine learning and remote sensing in coastal Vietnam. Water Pract. and Technol. 18, 1543–1555. doi:10.2166/wpt.2023.088
Wang, L., He, Y., Zhang, Y., Wang, L., Jia, H., Zhou, Q., et al. (2022). Disaster assessment for the “Belt and Road” region based on SDG landmarks. Big Earth Data 6, 3–17. doi:10.1080/20964471.2021.1901359
Weather Underground (2022). Hurricane and tropical cyclones: the 36 deadliest tropical cyclones in world history. Weather Undergr. Available online at: https://www.wunderground.com/hurricane/articles/deadliest-tropical-cyclones (Accessed December 4, 2022).
Yariyan, P., Avand, M., Abbaspour, R. A., Torabi Haghighi, A., Costache, R., Ghorbanzadeh, O., et al. (2020). Flood susceptibility mapping using an improved analytic network process with statistical models. Geomatics, Nat. Hazards Risk 11, 2282–2314. doi:10.1080/19475705.2020.1836036
Youssef, A. M., and Pourghasemi, H. R. (2021). Landslide susceptibility mapping using machine learning algorithms and comparison of their performance at Abha Basin, Asir Region, Saudi Arabia. Geosci. Front. 12, 639–655. doi:10.1016/j.gsf.2020.05.010
Youssef, B., Bouskri, I., Brahim, B., Kader, S., Brahim, I., Abdelkrim, B., et al. (2023). The contribution of the frequency ratio model and the prediction rate for the analysis of landslide risk in the Tizi N’tichka area on the national road (RN9) linking Marrakech and Ouarzazate. CATENA 232, 107464. doi:10.1016/j.catena.2023.107464
Keywords: AHP, frequency ratio, ANN, KNN, random forest, sandwip, dacope
Citation: Mamun MMAA, Zhang L, Xuzhe Y, Chen B, Zuo J and Karmakar S (2025) Cyclone surge inundation susceptibility assessment in Bangladesh coast through geospatial techniques and machine learning algorithms: a comparative study between an island and a mangrove protected area. Front. Earth Sci. 13:1554864. doi: 10.3389/feart.2025.1554864
Received: 08 January 2025; Accepted: 25 February 2025;
Published: 18 March 2025.
Edited by:
Qingyuan Zhang, University of Maryland, United StatesReviewed by:
Mohammad Mohinuzzaman, Noakhali Science and Technology University, BangladeshCopyright © 2025 Mamun, Zhang, Xuzhe, Chen, Zuo and Karmakar. This is an open-access article distributed under the terms of the Creative Commons Attribution License (CC BY). The use, distribution or reproduction in other forums is permitted, provided the original author(s) and the copyright owner(s) are credited and that the original publication in this journal is cited, in accordance with accepted academic practice. No use, distribution or reproduction is permitted which does not comply with these terms.
*Correspondence: Li Zhang, emhhbmdsaUBhaXJjYXMuYWMuY24=
Disclaimer: All claims expressed in this article are solely those of the authors and do not necessarily represent those of their affiliated organizations, or those of the publisher, the editors and the reviewers. Any product that may be evaluated in this article or claim that may be made by its manufacturer is not guaranteed or endorsed by the publisher.
Research integrity at Frontiers
Learn more about the work of our research integrity team to safeguard the quality of each article we publish.