 Zhongxu Lu1
 Yang Yang
94% of researchers rate our articles as excellent or good
Learn more about the work of our research integrity team to safeguard the quality of each article we publish.
Find out more
ORIGINAL RESEARCH article
Front. Earth Sci., 25 March 2025
Sec. Solid Earth Geophysics
Volume 13 - 2025 | https://doi.org/10.3389/feart.2025.1553606
To analyze the three basement interfaces of the crust in Guangxi, China (the Crystalline Basement Interface, the Conrad discontinuity, and the Moho discontinuity), seismic and gravity exploration were conducted. First, the depth values of the crustal interfaces, obtained from seismic data within the study area, were used as constraints. Gravity data were then employed to investigate the undulating morphology of the basement surfaces. Second, through gravity field separation techniques, density interface fitting inversion was performed to infer the undulating morphology of the Guangxi Crystalline Basement Interface, the Conrad discontinuity, and the Moho discontinuity. Depth distribution maps of these interfaces were created, and characteristic analyses were carried out. The results show that there is a certain inheritance relationship between the Crystalline Basement Interface, the Conrad discontinuity, and the Moho discontinuity in Guangxi, with the crust being thicker in the northwest and thinner in the southeast (the mantle subsides downward in the northwest and uplifts in the southeast). The spatial attributes of the Guilin-Hezhou mantle subsidence zone and the Yuchengling new mantle amalgamation body were analyzed. Additionally, by combining the detailed field characteristics of wavelet analysis, it is suggested that the crust of Guangxi exhibits a grid-like, framework regional structural pattern, clarifying the distribution laws of major granite belts. These belts develop along the mantle subsidence zones and are controlled by deep faults. The research results can provide important references for studies on deep structures and other related fields in Guangxi.
The South China continent, located at the southeastern edge of the Eurasian Plate, has long been subjected to the collision, subduction, compression, and stretching caused by the interactions among the Eurasian Plate, the Pacific Plate, and the Indo-Australian Plate, as well as intra-continental orogeny and the upwelling of upper mantle material. Its evolution has been accompanied by abundant deep-seated material activities, forming a series of deep faults that cut through the crust along the continental margins, many of which remain seismically active to this day. The Cathaysia Block and the Yangtze Block evolved relatively independently before the Neoproterozoic era, colliding and merging into the South China continent during the Neoproterozoic, with their boundary forming the Jiangnan Orogen. After a long geological evolution throughout the Archean, the South China continent generally underwent metamorphic deformation and large-scale magmatic activity.
To understand the composition and properties of the Earth’s interior and explore plate tectonics and the mechanisms of Earth system dynamics, it is crucial to conduct exploration studies on the fundamental structures of the interfaces between different layers of the crust. Geophysical methods are considered effective for probing the structure of the crust. Investigating the deep crustal structure, structural morphology, and physical properties through geophysical methods is significant for a deeper understanding of the contact and coupling relationship between the Yangtze Block and the Cathaysia Block in South China, especially in Guangxi, where there exists a complex intraplate orogenic zone characterized by multi-mechanism and multi-phase structural evolution, also known as the Neoproterozoic Jiangnan Orogen (Zhang et al., 2013; He et al., 2012). However, there are still many issues concerning its geological structure, structural morphology, and distribution area that require further investigation.
Using geophysical methods to explore the basement interfaces of the crust in Guangxi (Crystalline Basement Interface, Conrad discontinuity, and Moho discontinuity) and to study the undulating morphology of these interfaces can help deepen our understanding of the detailed structure of the South China crust and clarify the characteristics of the tectonic boundaries between the Yangtze and Cathaysia blocks.
Many scholars have conducted geophysical exploration work on the crustal structure and structural deformation processes in South China, such as active-source seismic exploration (Hu et al., 2020), receiver function analysis (Liu et al., 2005; Jiang et al., 2014), body wave tomography (He and Santosh, 2016), surface wave tomography (Lv et al., 2016; Luo et al., 2019; Gao et al., 2022), gravity and magnetic-electric-thermal analysis (Jiang et al., 2016; Han et al., 2016; Yan et al., 2022), and seismic anisotropy studies (Wang et al., 2014; Kong et al., 2016; Shi and Gao, 2022). However, most of these studies primarily used single datasets, leading to inconsistent interpretations of crustal material properties and constraints on tectonic boundaries. Although there is general agreement on the thinning process of the South China crust, primarily due to underplating from deep mantle material upwelling and subsequent Cenozoic compression-stretching (Xu et al., 2014; Huang et al., 2015; Xia et al., 2015), controversies remain regarding the kinematic mechanism between the Yangtze Block, the Cathaysia Block, and the Jiangnan Orogen. One model suggests that the Jiangnan Orogen is part of the eastern margin of the Yangtze Block, with the Cathaysia Block subducting westward beneath the Yangtze Block, creating a “double-basement superposition” crustal structure (Xia et al., 2018). Another model divides the Yangtze Block, the Jiangnan Orogen, and the Cathaysia Block into three distinct tectonic units, proposing clear boundaries between them (Cawood et al., 2013).
Clarifying these issues hinges on the fine depiction of high-resolution crustal interface morphology in South China. Therefore, utilizing geophysical methods to determine the distribution characteristics of crustal basement interfaces holds significant scientific importance. For this purpose, seismic and gravity exploration works were carried out in Guangxi. By using the depth and undulating morphology of the basement surfaces obtained from seismic profiles as constraints and performing density interface inversion on gravity anomalies caused by the basement interfaces, the undulating morphology of the three basement surfaces was obtained. Based on this, gravity exploration data combined with geological information were further analyzed to examine the undulating features of the basement interfaces, intrusive areas of plutons, and crust-mantle interactions. The research results provide important references for fundamental geological studies in Guangxi.
In this study, the seismic profile was laid out starting from Liuzhou, passing through Xiangzhou, Guiping, Rongxian, and Xinyi, and ending at Yangjiang, extending in a southeast direction. This profile crosses the northeast-oriented structures within the study area, spanning a total length of 392 km (Figure 1). The upper crust of this profile is composed of sedimentary cover and a metamorphic crystalline basement with velocity inversion. The sedimentary cover has a thickness of approximately 6–9 km, with velocities ranging from 5.10 to 6.00 km/s, while the metamorphic crystalline basement is about 5–8 km thick, featuring a low-velocity layer at its base with velocities between 6.30 and 5.80 km/s. The total thickness of the upper crust is around 15 km, accounting for roughly half of the total crustal thickness. Within this, the sedimentary cover, comprised of shallowly metamorphosed deposits from the Sinian System to the Lower Paleozoic and sedimentary layers since the Late Paleozoic, occupies more than half of the upper crust’s thickness, which is a primary characteristic of the upper crustal structure in central and southeastern Guangxi.
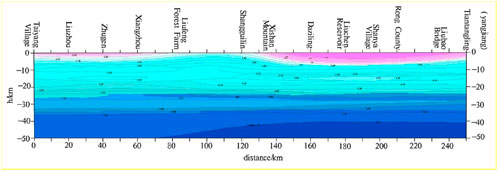
Figure 1. Seismic profile from Liuzhou, Guangxi, to Yangjiang, Guangdong.
The middle crust has a thickness of about 6.5–8.5 km, with velocities ranging from 6.20 to 6.70 km/s. In the southeastern basin beneath Guiping, the middle crust exhibits relatively lower velocities due to the connection with the low-velocity layer at the bottom of the basin. Overall, the middle crust shows a uniform velocity with a positive gradient transition structure. The lower crust consists of a double-layered structure: an upper layer with velocities of 6.90–7.10 km/s and a thickness of 3.2–4.5 km; and a lower layer characterized by an inverted low-velocity gradient with velocities of 7.10 to 6.80 km/s and a thickness of 3.5–7.0 km. The top of the lower crust is buried at an average depth of about 23 km. The Moho discontinuity lies between depths of 29–34 km, showing noticeable undulations, with the lower crust comprising approximately one-third to one-quarter of the total crustal thickness.
Overall, the average velocity of the upper crust along this profile is relatively low, ranging from 6.19 to 6.26 km/s, while the upper mantle Pn velocities are higher, between 8.05 and 8.30 km/s, indicating strong gradient structures below the Moho. Combined with the results of one-dimensional inversion, disruptions in the Moho discontinuity were observed at depths between 42 and 43 km, 76–79 km, near 96 km, near 130 km, and between 206 and 212 km.
This section provides a detailed overview of the seismic exploration conducted in the study, highlighting the structural characteristics and velocity variations across different layers of the crust along the profile. It underscores the importance of these findings in understanding the complex geological structure and tectonic evolution of the region.
Based on the comprehensive velocity model of the crust derived from the seismic profile (Figure 2), the crust in Guangxi can be divided into three major layers from top to bottom, with the formed basement interfaces being the Crystalline Basement Interface (g-interface in Figure 2), the Conrad discontinuity (c-interface in Figure 2), and the Moho discontinuity (M-interface in Figure 2):
(1) The first layer: Upper Crust Layer (Upper Sialic Layer)
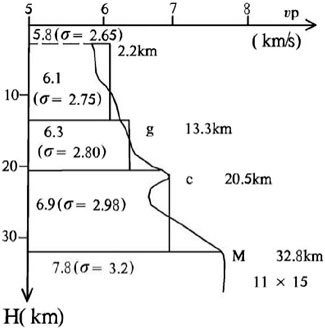
Figure 2. Comprehensive velocity model diagram of the blasting earthquake in Liuzhou.
Lithology: Composed of sedimentary rock layers and shallowly metamorphosed rocks from the Mesoproterozoic to Lower Paleozoic.
Average velocity: Vupper = 5.80 km/s, Average density: δ = 2.65 × 10³ kg/m3.
— Interface: Crystalline Basement Interface (g-interface) —
(2) The second layer: Middle Crust Layer (Lower Sialic Layer)
Lithology: Consists of metamorphic rocks from the Lower Proterozoic to Archean.
Average velocity: Vmiddle = 6.30 km/s, Average density: δ = 2.80 × 10³ kg/m3.
— Interface: Conrad Discontinuity (c-interface) —
(3) The third layer: Lower Crust Layer (Sima Layer)
Lithology: Includes basaltic layers or medium-basic granulites.
Average velocity: Vlower = 6.9 km/s, Average density: δ = 2.9 × 10³ kg/m3.
— Interface: Moho Discontinuity (M-interface) —
Below these layers is the uppermost part of the mantle lithosphere, characterized by:
Average velocity: V = (7.8∼8.15) km/s, Average density: δ = (3.2∼3.35) × 103 kg/m3.
It is worth noting that, since the seismic data analysis process only used geological data for constraints, the ambiguity inherent in the seismic data itself means that the velocities and densities obtained for various layers are not extremely precise and may differ to some extent from actual conditions. In this study, the velocities and densities of various layers derived from seismic data are only used to constrain gravity data. From this perspective, the accuracy of the seismic data is sufficient.
In this study, all gravity data are based on actual measurements. Specifically, the data for the Guangxi region were obtained from gravity survey results conducted between 1978 and 2011 as part of a 1:200,000 scale regional gravity survey. The total area covered by these data within Guangxi is 235,411 km2, with 47,218 high-precision gravity measurement points. These data have been validated by the relevant higher-level administrative department and deemed to be of qualified standard.
For the expanded border areas involving neighboring provinces, data were collected from the National Geological Data Library of China. The total area covered by the neighboring provinces’ data is 138,779 km2, with a total of 25,032 gravity measurement points.
The 1:200,000 scale regional gravity measurement points in Guangxi were surveyed using a free network method, with points generally evenly distributed across the entire region. Points were placed within squares measuring 8 km2, with an inscribed circle used as a reference. Except for one 1:50,000 scale map (Nandan) that was not completed and a few large reservoirs where significant gaps exist, there are no unmeasured areas elsewhere. The average density of measurement points is one point per 4.92 km2. The root mean square (RMS) error for elevation is ±1.65 m, and the RMS error for planimetric position is ±15.03 m. The RMS error for gravity observations at each point is ±0.105 × 10⁻⁵ m/s2, with a total Bouguer anomaly precision of ±0.496 × 10⁻⁵ m/s2 across the region. The free-air gravity RMS error is 0.532 × 10⁻⁵ m/s2.
To better extract information from gravity anomalies, the gravity data underwent Anomaly Separation and Sliding Window Averaging. Additionally, Wavelet Multiscale Analysis was used for data processing and comparative analysis.
The separation of the gravity field aims to remove the regional field, thereby highlighting small-scale local anomalies embedded within the regional anomalies for clearer display and interpretation. The focus is on extracting and interpreting local anomalies to quantitatively infer spatial characteristics of the geological bodies causing these anomalies (Chiluvuru et al., 2020a; Maiti and Chiluvuru, 2024).
This is achieved through filtering techniques. Assuming that the variation in the regional field conforms to a certain function, while local anomaly fields exhibit random variations, the derived regional field represents an approximation of the true regional field. Subtracting the regional field from the observed field yields the residual field, which represents the local field. All these methods can introduce “false anomalies” or “secondary anomalies.” The specific method is selected through experimentation to best approximate the regional field (consistent with the geological features of Guangxi) and minimize “secondary anomalies.”
Separating gravity anomalies can be challenging, especially for vertically stacked anomalies caused by geological bodies at similar depths or of similar scale. In contrast, horizontally stacked regional and local anomalies, or multiple local anomalies, are relatively easier to separate.
The anomaly separation was conducted using the potential field separation module in the RGIS system, employing regularization filtering. The parameter settings for this method are identical to those used in the regularization filtering process.
The sliding window averaging method uses a square window to smooth the total Bouguer gravity anomaly, aiming to separate the gravity fields of density interfaces at different depths and layers. The central point of each window is referred to as the smoothing point, where the average value of anomalies within the window is calculated and assigned to this point. This process helps eliminate random observation errors, calculation errors, or disturbances from small-scale features that are not the target of exploration (Chiluvuru et al., 2020b).
Parameter Selection: The primary parameter is the window size, which is determined based on the grid spacing of data points and the scale of the target anomaly to be smoothed. Specific window sizes are chosen through practical experimentation.
For instance, four different window sizes were applied to the gravity data in Guangxi (16 × 16, 20 × 20, 32 × 32, 40 × 40, and 64 × 64 km). The results exhibit the following characteristics:
Local variations between regional fields are significant, but overall patterns show similarities. Smaller windows highlight local anomalies more prominently.
Residual anomaly patterns across different windows are similar, but their amplitudes differ greatly. Larger windows better reflect large-area anomalies, while smaller windows capture finer details and smaller anomalies with lower amplitudes.
Gravity anomalies encompass cumulative effects from deep and shallow structural layers, lithology, and density inhomogeneities within the crust. Wavelet transforms can decompose these anomalies into corresponding depth-related field sources through calculations at different scales. Thus, wavelet transforms are useful for exploring the spatial distribution of deep-seated source bodies.
Wavelet Transform Process: The order n of the wavelet transform is manually selected based on actual needs. Regardless of the choice of n, low-order wavelet details remain consistent, making this approach advantageous for decomposing gravity anomalies.
Take the Two-Level Decomposition as an Example: If the goal is to decompose the gravity field into “regional field” and “local anomalies,” the following method can be used. Assume a three-level wavelet analysis (n = 3). After wavelet analysis, obtain wavelet details D1f, D2f, D3f, and the third-level approximation A3f. If A3f exhibits smooth regional field characteristics, it is designated as the regional field, and DL = D1f + D2f + D3f represents the local field. If A3f still contains small-scale anomaly information, proceed to a four-level wavelet analysis (n = 4), and check if the fourth-level approximation A4f meets regional field criteria. If so, DL + D4f is the local field, and A4f is the regional field. This process continues until satisfactory decomposition is achieved.
Similarly, multiple decompositions of the gravity field are performed according to geological objectives by combining wavelet details to achieve geologically meaningful anomaly separation.
Relationship Between Wavelet Multiscale Analysis and Grid Spacing: In multi-stage wavelet transforms, the scale of wavelet details increases exponentially by powers of 2. Assuming the grid spacing is ΔΔ and the scale of first-order wavelet detail is L, empirical formulas suggest L = 4△∼8△. Therefore, the scale of second-order wavelet detail is 21L, third-order detail is 22L, fourth-order detail is 23L, and fifth-order detail is 24L, with higher-order approximations having scales much larger than 24L.
Concept of Wavelet Multiscale Analysis (Multiresolution Analysis): This approach involves progressively subdividing function spaces to decompose signals into different hierarchical levels. It links wavelet analysis with multiscale analysis, which can also be understood from the perspective of filter banks. The wavelet transform process is equivalent to passing a signal through a series of low-pass and high-pass filters, resulting in detailed wavelet outputs at various scales.
Function spaces can be hierarchically divided into orthogonal subspaces, as shown in Equation (1), allowing for detailed analysis at multiple scales, as follows:
Assume f(x) is a function in the space V0, then through the binary division of the function space, f(x) can be decomposed into components that belong to two subspace functions V1 and W1, representing the approximation and detail coefficients respectively, as shown in Equation (2):
Here, A1 [f(x)] represents the projection of the function f(x) on to the space V1, known as the approximation of f(x). D1 [f(x)] represents the projection of the function f(x) on to the space W1, reflecting the difference between f(x) in spaces V0 and V1, and is referred to as the detail of f(x).
By further decomposing A1 [f(x)] through binary division and continuing this process hierarchically, we can obtain projections of the function f(x) on to a series of subspace functions. This forms the wavelet expansion of the function f(x), as shown in Equation (3):
By performing wavelet transforms of different orders on gravity anomalies (Figure 3), each wavelet detail can reflect gravity anomaly characteristics at different depths, as well as gravity anomalies caused by regional tectonic events. The intensity of the anomalies, their distribution features, and the zoning characteristics of the anomalies show significant differences. This allows for an understanding of regional tectonic characteristics from different periods.
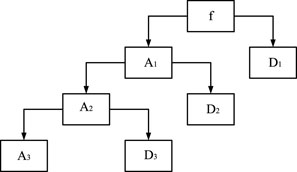
Figure 3. Schematic diagram of wavelet decomposition.
It is worth noting that there are some issues with gravity data after wavelet decomposition. For instance, it is difficult to separate gravity anomalies from the original data’s information. The reason for this issue could be that the scale of wavelet details increases by integer powers of two, leading to a rapid decay in vertical resolution, which results in the phenomenon of information aliasing in the separation results. According to the suggestions by Meng et al. (2022), in this study, appropriate scaling coefficients Ai and Dj were selected based on anomaly morphology and prior information, and Ai and Dj were repeatedly corrected based on computational results until satisfactory outcomes were achieved.
Figures 7–9 were constructed based on the results of anomaly separation. Relevant contents can be found in Chapter 4 “Discussion.”
When conducting geological interpretations, we applied several theories and perspectives that are relatively mature within the geoscience community and incorporated the latest geological data and research findings.
Step One: Determining Geological Causes. The geological causes of gravity anomalies and residual gravity anomalies were identified, and the gravity anomaly patterns associated with hidden rock bodies, altered rock bodies, and inferred concealed faults were analyzed.
Step Two: Anomaly Zoning. By studying the distribution characteristics of anomalies, these anomalies were classified into different zones based on varying anomaly intensities, distribution directions, and shapes. The gravity field of the survey area was placed in a broader context for study and compared with neighboring regions, providing important evidence for geological structural zoning.
Step Three: Linear Structural Study. Based on the linear distribution features of gravity anomalies, geological linear structures were investigated, a geological structural framework was established, and the distribution of fault structures was inferred.
Step Four: Classification of Local Anomalies. By analyzing the characteristics of local anomalies, these anomalies were classified and further divided into distinct local anomalies with specific features. Qualitative interpretation primarily involves making qualitative judgments about the causes of gravity anomalies. Based on previous studies, combined with collected geological, physical property data, aeromagnetic data, geochemical exploration, remote sensing results, and other information, we interpret the geological environment, physical properties, and anomaly characteristics of known geological bodies to infer the causes of gravity anomalies.
Semi-quantitative and quantitative interpretations are based on the analysis of gravity and magnetic anomalies from known geological targets within the survey area. Geophysical characteristic markers for geological bodies were established (such as anomaly intensity, shape, gradient, orientation, scale, distribution features, etc.), and initial geological-geophysical conceptual models were set up. Through semi-quantitative and quantitative forward modeling and fitting calculations (repeated verification and modification of the conceptual model), quantitative descriptions of the spatial distribution characteristics of geological bodies were provided.
The task of quantitative interpretation is to use various quantitative inversion methods to obtain geometric parameters and physical property parameters of relevant sources (target objects or target layers). This includes profile fitting interpretation, density interface inversion calculations, and quantitative calculations of local gravity anomalies.
Quantitative interpretation work mainly focuses on anomalies where corresponding known conditions exist within the survey area. On the basis of qualitative interpretation, significant geological anomalies caused by deep-seated hidden rock bodies and faults are deeply investigated. We utilize measured physical property parameters and known boundary conditions within the area for quantitative or semi-quantitative interpretation, minimizing ambiguity as much as possible.
During the interpretation process, planar and cross-sectional interpretations are combined to complement, reference, and constrain each other. This approach is essential for determining the boundaries of certain geological bodies and studying the undulations and depths of certain interfaces. The resulting interpretations are more credible and substantiated.
Geological interpretation aims to transform these interpretative results into inferred geological bodies or phenomena based on the characteristics of geological-geophysical models of various geological bodies. This is done in conjunction with the geological situation of the working area and around the geological tasks of the survey area. Using basic principles of geology, geological interpretations and inferences are provided that conform to geological principles both spatially and temporally. The focus is on proposing new geological insights, including new proposals, refutations of previous studies, modifications, or supplements to prior understandings, and addressing key geological issues that urgently need resolution within the survey area.
Based on seismic exploration data and combined with gravity exploration data, a windowed moving average method was employed to separate gravity anomalies, thereby obtaining regional gravity anomalies reflecting different depths. According to Chen et al. (2022), the optimal window side length (2 L) is approximately 1.5–2.0 times the average depth of the target layer (H). The window radius was roughly selected based on this relationship and then constrained and corrected using the known depths of various seismic sounding points and the undulating morphology of the basement surface along the profile. Finally, regional anomalies from three window sizes—20 × 20, 40 × 40, and 60 × 60 km—were used to represent gravity anomalies caused by the crystalline basement, Conrad discontinuity, and Moho discontinuity, respectively. The depths of these basement surfaces were calculated using the density interface inversion module in RGIS software.
Based on the above data, the upper mantle density was set to 3.20 × 10³ kg/m3, and the lower crust density was set to 2.98 × 10³ kg/m3. Using the density interface inversion module in RGIS software, the Moho depth was calculated with five iterations and a filter factor of five. The results were compiled into an inferred isobath map of the Moho depth in Guangxi (Figure 4).
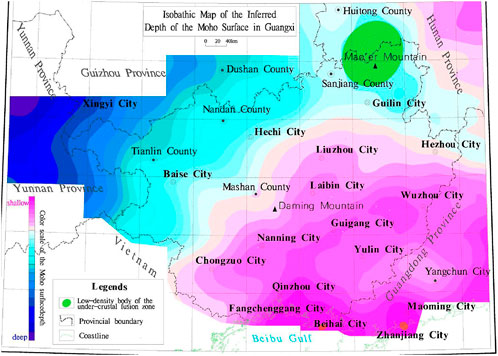
Figure 4. Isobath map of the inferred depth of the Moho discontinuity in Guangxi.
In seismic exploration, the depth of the crystalline basement reference surface is set at 9 km. The calculated density of the crystalline basement is 2.85 × 10³ kg/m3, and the density of the overlying strata (cover layer) is 2.58 × 10³ kg/m3. Using the density interface inversion module in RGIS software, the depth of the Crystalline Basement Interface was calculated with five iterations and a filter factor of five. The results were compiled into an inferred isobath map of the crystalline basement depth in Guangxi (Figure 5).
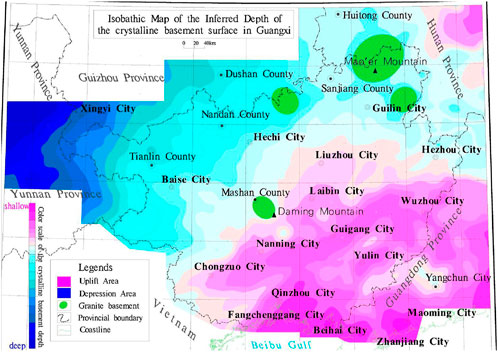
Figure 5. Isobath map of the inferred depth of the crystalline basement interface in Guangxi.
Using a baseline depth value of 20 km, the calculated density for granite is 2.71 × 10³ kg/m3 and for basalt is 2.90 × 10³ kg/m3. The Conrad discontinuity depth was calculated using the density interface inversion module in RGIS software, with five iterations and a filter factor of five. The results were compiled into an inferred depth map of the Conrad surface in Guangxi (Figure 6).
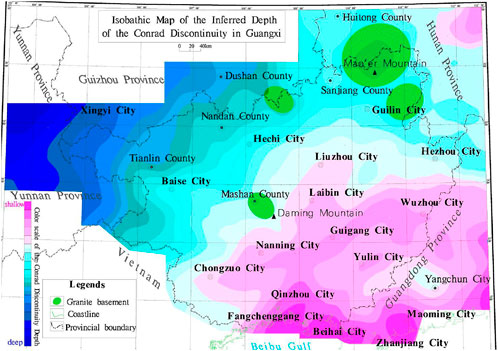
Figure 6. Isobath map of the inferred depth of the Conrad discontinuity in Guangxi.
As mentioned above, the Moho discontinuity is the boundary between the crust and the mantle, the Conrad discontinuity marks the division between granitic and basaltic rock layers, and the crystalline basement represents the interface between deep metamorphic rock systems formed before the Mesoproterozoic and the overlying sedimentary and shallow metamorphic rock systems.
From the inferred three basement structural surfaces, it is evident that the crust in Guangxi is thicker in the northwest and thinner in the southeast. The basement generally exhibits characteristics of uplift along the southeastern coast and subsidence in the northwestern region. Each structural surface shows significant inheritance, with largely consistent morphology.
From the inferred depth map of the Moho discontinuity in Guangxi (Figure 4), it is evident that the central, southern, and southeastern regions of Guangxi exhibit mantle uplift characteristics, while the western and northern regions show subsidence features. The Guilin–Hezhou line forms a subsidence zone.
In addition to the general uplift trend, the Moho discontinuity in Guangxi also displays a prominent northwest-oriented structural characteristic. The Guilin–Hezhou subsidence zone trends northwest (Figure 4), and the northwest-oriented undulations are clearly visible in the western and southern regions of Guangxi. The fourth-order detail fields obtained from wavelet analysis similarly reflect a pronounced northwest orientation of deep structures (higher-order detail fields reveal details of the deep gravity field, Figure 7). The northwest-oriented structural belt in the western region of Guangxi extends southward into the southern region (with anomaly zones trending northwest), and the Guilin–Hezhou line represents a Moho subsidence zone (a distinct northwest-oriented gravity low anomaly zone).
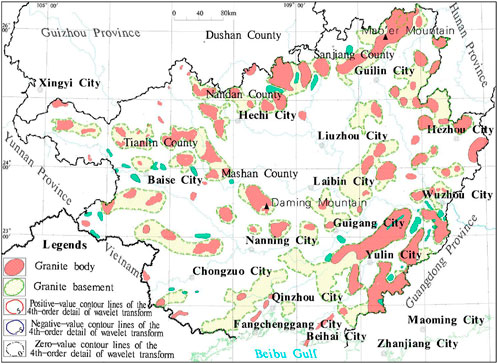
Figure 7. Relationship diagram between the granite belt in Guangxi and the Moho discontinuity basement tectonics reflected by the fourth-order details.
From the inferred depth map of the Moho discontinuity in Guangxi (Figure 4) and the isobath map of the Moho surface around Yuanchengling, it is evident that the Yuanchengling area forms a distinct trapping zone. This trapping zone is located at the intersection of the northeast-southwest Dongkou-Xinhua-Yiyang subsidence belt and the northwest-southeast Guilin-Hezhou subsidence belt, corresponding to two gravity low anomaly zones (Li et al., 2021).
Using gravity anomalies for inference, the northeast-oriented gravity low anomaly zone along the Dongkou-Xinhua line is interpreted as being caused by a lithospheric plate fusion zone beneath the crust, which is a product of the fusion between the upper mantle and the asthenosphere. Based on this interpretation, it is inferred that the gravity low anomaly in the Yuanchengling trap (the subsidence area of the trap) situated on this fusion zone may reflect an upwelling intrusion center of the asthenosphere or a fusion body formed by metasomatic replacement of new mantle material beneath the crust.
Based on this, it is inferred that the gravity low anomaly (the subsidence zone of the trap) in the Yuanchengling trap, situated on this fusion zone, may reflect an upwelling intrusion center of the asthenosphere or a fusion body formed by metasomatic replacement of new mantle material beneath the crust.
The above analysis indicates that the Moho discontinuity might contain fusion areas and zones formed by asthenospheric upwelling. Overall, influenced by both the Pacific and Tethyan tectonic activities, the Moho discontinuity in Guangxi exhibits an uplift trend. As the influence of Tethyan tectonic activity increases, modern northwest-oriented structural belts develop on the Moho discontinuity. The Moho discontinuity shows characteristics such as mantle uplift, northwest-oriented undulations, and the presence of ancient mantle slab remnants and slab fusion zones.
The background for the Conrad discontinuity and crystalline basement is the Moho discontinuity, which inherits its uplift characteristics from mantle uplift. This results in an uplifted area in central, southern, and southeastern Guangxi, with subsidence zones in western and northern Guangxi, as well as along the Guilin–Hezhou line (Figures 5, 6).
The crystalline basement represents the interface between deep metamorphic rock systems and overlying sedimentary and shallow metamorphic rock systems, reflecting the sedimentary basement characteristics of the continental block. The Conrad discontinuity marks the boundary between granitic and basaltic layers, closely related to the undulations of the sedimentary cover. Overall, Figures 5, 6 show that the morphology of these basement interfaces is complex, with varying regional structural forms and multiple localized structures. Notably, distinct trapping zones are formed in areas such as Motianling, Yuanchengling, Duples Ridge, and Mashan, inferred to be regions where hidden granite bodies intrude into the basement structure.
The crust in Guangxi has undergone a long and complex evolutionary process: from the formation of ancient crystalline basement during the Paleoproterozoic (or even Archean) era through various stages including the Sibao period continental block formation, Jinning-Galatian rift trough formation, Hercynian-Indosinian continental formation, to the Yanshan-Himalayan Pacific continental margin activity stage. Tectonic movements have been frequent since the Proterozoic, totaling 21 major events, with the most intense being the Lüliang, Sibao, Galatian, Dongwu, Indosinian, and Yanshan movements. Under the influence of Earth’s internal forces, the continental crust experienced expansion (rifting) and collision (sutures), leading to sedimentary construction, tectonic movements (fold mountain building, faulting), magmatic activities, and metamorphism. The present-day landscapes of the crystalline basement and Conrad discontinuity are the result of prolonged tectonic evolution and superimposed tectonic events.
According to recent studies on the South China continent, there are remnants of early-formed continental crust, including Paleoproterozoic and Archean crystalline basement, with widespread distribution. There is also evidence of Hadean material information. The oldest sedimentary record in Guangxi is the Tian Tangshan Group located in the Yun-Kai Mountains, with a garnet amphibolite SHRIMP zircon Pb207/Pb206 age of 1,817 ± 36 Ma, dating back to the Paleoproterozoic era. Granitic gneiss within the Tian Tangshan pluton contains inherited zircon ages of 2,701.9 ± 13.2 Ma and a weighted average age of 2,397 ± 56 Ma, indicating the presence of Neoarchean-Paleoproterozoic crystalline basement in the Yun-Kai region. The northern Sibao Group in Guangxi formed during the Neoproterozoic (841.7 ± 5.9 Ma), while the southeastern Yangtze block and “Jiangnan Ancient Land” lack Mesoproterozoic basement (Chen et al., 2022). “Jiangnan Ancient Land” is a collisional orogen resulting from arc-continent collisions along the southeastern margin of the Yangtze continent during the Sinian-Neoproterozoic period, not part of the Yangtze basement (Guo et al., 2019). The Yangtze block’s basement remains concealed beneath the Sibao Group. These studies provide important insights into the characteristics of the crystalline basement and Conrad discontinuity.
With the amalgamation of the Yangtze and Cathaysia blocks during the mid-Neoproterozoic, forming a unified South China continental plate, and the subsequent rifting associated with the breakup of the Rodinia supercontinent in the late Neoproterozoic, extension occurred along the Zhejiang-Jiangxi-Hunan-Guangxi region, forming intracontinental rift structures in South China. The Early Paleozoic Guangxi movement (Caledonian period) resulted in intracontinental orogenesis and amalgamation, followed by the Early Mesozoic Indosinian tectonic event, which experienced another intracontinental orogenic event similar in nature, characteristics, and extent to the Early Paleozoic one. This ultimately established the current basic tectonic framework of South China (Wei et al., 2016).
These supercontinent amalgamations, rifts, and collisional orogenesis have shaped the modern tectonic pattern of Guangxi’s continental crust. Based on gravity anomaly zoning characteristics, Guangxi’s continental crust can be divided into five regional tectonic zones, forming the regional tectonic framework of Guangxi’s continental crust basement (Figure 8).
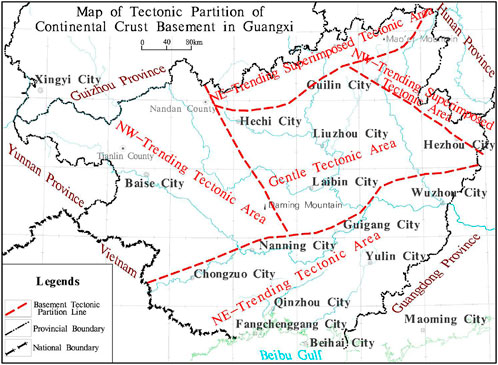
Figure 8. Map of tectonic partition of the continental crust basement in Guangxi.
To achieve better separation results, it is necessary to select an appropriate window radius for anomaly separation. However, from the obtained regional anomalies (especially large-scale gravity low anomalies), some local anomalies still remain within the regional background field. According to forward modeling calculations (including lateral residual density corrections for plutons), when the maximum depth extension of the granite model reaches 10–12 km, most models fail to fully match the measured results—primarily regarding the background field. This indicates the presence of negative-density material at greater depths, inferred to be early-formed in-situ hybrid gneiss-hybrid granite zones, with mid-deep sections containing in-situ granite bodies and crustal-underlying new mantle fusion bodies.
Overall, the crystalline basement, Conrad discontinuity, and Moho discontinuity in Guangxi exhibit a northwest-low southeast-high distribution. The shallow structures are mirror images of deep structures, where deep-seated uplift often controls the formation and development of shallow subsidence; conversely, the rebound of deep subsidence is the root cause of shallow structural uplift. This reflects the gravitational equilibrium compensation during crustal evolution, highlighting the dominant control of deep structures over upper-layer structures. The distribution and localization characteristics of granites in Guangxi are closely related to the deep crustal structural background. Major granite belts predominantly develop along mantle subsidence zones (shallow structural uplift zones) and are controlled by deep faults, which determine their emplacement features.
As shown in Figure 9, the main granite belts in Guangxi largely develop along mantle subsidence zones and are clearly controlled by deep faults. The fourth-order detail gravity low anomaly zones reflect basement subsidence zones, as depicted in Figure 8, showing the relationship between basement subsidence zones and granite belts. Additionally, the macroscopic distribution of element concentration areas such as Sn, W, Cu, Pb, Zn, and Hg in the regional geochemical fields of Guangxi, as well as the distribution of major non-ferrous metals and gold mines, generally aligns with the distribution of granite belts, reflecting the controlling influence of granites on mineral resources in Guangxi.
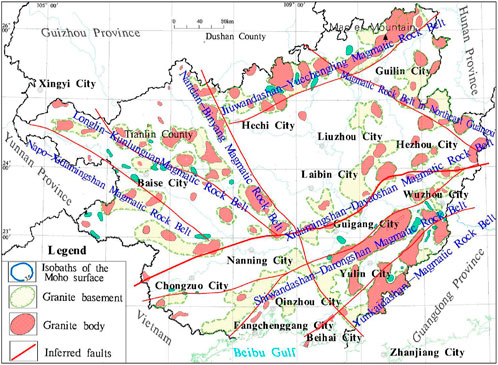
Figure 9. Relationship diagram between the granite belt in Guangxi, the inferred faults, and the Moho discontinuity tectonics.
This study utilized interface depth values from seismic profiles for constraints and inferred the undulating morphology of the interfaces of the crystalline basement, Conrad discontinuity, and Moho discontinuity in Guangxi based on gravity exploration data. Depth inference maps for these three interfaces were created, revealing their significant inheritance characteristics and illustrating the features of the Guangxi crust being thicker in the northwest and thinner in the southeast, with uplift along the southeastern coast and subsidence in the northwest. The main conclusions are as follows:
The Moho discontinuity exhibits a pronounced northwest-oriented distribution feature, forming the Guilin-Hezhou Moho subsidence zone and the Yucheng Ridge newborn mantle fusion body. The crystalline basement and Conrad discontinuity display complex morphologies, but overall, regional structures are stable, forming a grid-like, framework-type regional structural pattern in the Guangxi crust, which can be divided into five major structural zones.
Crust-mantle interactions within the region are closely related to the basement subsidence zones; principal granite belts develop along mantle subsidence zones, and deep faults control the distribution of these granite belts, determining their emplacement characteristics. These insights provide crucial references for research into deep structure, seismology, and fundamental geology in Guangxi.
Mantle subsidence zones are closely linked to crust-mantle interactions. Due to the upwelling of the asthenosphere, there is considerable variation in the thickness of the lithospheric mantle. It is worth investigating whether lithospheric mantle thinning zones and asthenosphere upwelling central areas exist in some large mantle subsidence zones and subsidence trap regions (such as the Guilin-Hezhou subsidence zone, Yucheng Ridge trap area), or if they form large magma chambers within the crust.
The raw data supporting the conclusions of this article will be made available by the authors, without undue reservation.
ZL: Writing–original draft, Writing–review and editing. FY: Writing–original draft, Writing–review and editing. YY: Writing–original draft, Writing–review and editing. HL: Writing–original draft, Writing–review and editing. YM: Writing–original draft, Writing–review and editing.
The author(s) declare that financial support was received for the research, authorship, and/or publication of this article. The research was funded by the Natural Science Foundation of Guangxi (No. Gui Ke AB24010021), the Department Preliminary Project of Guangxi Bureau of Geology and Minerals (No. (2024)67), the Inclusive Supporting Foundation for Qingmiao Talents of Guangxi, and the Basic Ability Improvement Project of Young and Middle-aged Teachers in Universities of Guangxi: Research on Three-Dimensional Forward and Inverse Modeling Methods for Frequency-Domain Controlled-Source Electromagnetic Exploration for Karst (No. 2025KY1442).
The authors declare that the research was conducted in the absence of any commercial or financial relationships that could be construed as a potential conflict of interest.
The author(s) declare that no Generative AI was used in the creation of this manuscript.
All claims expressed in this article are solely those of the authors and do not necessarily represent those of their affiliated organizations, or those of the publisher, the editors and the reviewers. Any product that may be evaluated in this article, or claim that may be made by its manufacturer, is not guaranteed or endorsed by the publisher.
Cawood, P. A., Wang, Y., Xu, Y., and Zhao, G. (2013). Locating South China in Rodinia and gondwana: a fragment of greater India lithosphere? Geology 41, 903–906. doi:10.1130/g34395.1
Chen, C. X., Lv, Q. T., Chen, L., Shi, D., Yan, J., and Ai, Y. (2022). Crustal thickness and composition in the South China Block: constraints from earthquake receiver function. Sci. China Earth Sci. 65, 698–713. doi:10.1007/s11430-021-9858-x
Chiluvuru, R. K., Kesiezie, N., Pathak, B., Maiti, S., and Tiwari, R. K. (2020b). Mapping of basement structure beneath the Kohima Synclinorium, north-east India via Bouguer gravity data modelling. J. Earth Syst. Sci. 129, 56. doi:10.1007/s12040-019-1326-z
Chiluvuru, R. K., Raj, S., Pathak, B., Maiti, S., and Kasturi, N. (2020a). High density crustal intrusive bodies beneath Shillong plateau and Indo Burmese Range of northeast India revealed by gravity modeling and earthquake data. Phys. Earth Planet. Interior 307, 106555. doi:10.1016/j.pepi.2020.106555
Gao, L., Zhang, H., Gao, L., He, C., Xin, H., and Shen, W. (2022). High-resolution vs tomography of South China by joint inversion of body wave and surface wave data. Tectonophysics 824, 229228. doi:10.1016/j.tecto.2022.229228
Guo, L., Gao, R., Shi, L., Huang, Z., and Ma, Y. (2019). Crustal thickness and Poisson’s ratios of South China revealed from joint inversion of receiver function and gravity data. Earth Planet Sci. Lett. 510, 142–152. doi:10.1016/j.epsl.2018.12.039
Han, S., Liu, G. X., and Han, J. T. (2016). Deep electrical structure of jinxian-zherong magnetotelluric profile in SouthSouth China. J jilin univ. Earth Sci. Ed. 46, 1837–1846.
He, C., and Santosh, M. (2016). Crustal evolution and metallogeny in relation to mantle dynamics: a perspective from P-wave tomography of the South China Block. Lithos 263, 3–14. doi:10.1016/j.lithos.2016.06.021
He, C. S., Dong, S. W., Santosh, M., and Chen, X. (2012). Seismic evidence for ageosuture between the Yangtze and Cathaysia blocks, SouthChina. Sci. Rep. 3, 2200. doi:10.1038/srep02200
Hu, R. Z., Wen, H. J., Ye, L., Chen, W. T., Xia, Y., Fan, H., et al. (2020). Metallogeny of critical metals in the southwestern Yangtze block. Chin. Sci. Bull. 65, 3700–3714. doi:10.1360/tb-2020-0274
Huang, R., Xu, Y., Zhu, L., and He, K. (2015). Detailed Moho geometry beneath southeastern China and its implications on thinning of continental crust. J. Asian Earth Sci. 112, 42–48. doi:10.1016/j.jseaes.2015.09.002
Jiang, G. M., Zhang, G. B., and Lv, Q. T. (2014). Deep geodynamics of mineralization beneath the middle-lower reaches of Yangtze river: evidence from teleseismic tomography. Acta Petrol Sin. 30, 907–917.
Jiang, G. Z., Gao, P., and Rao, S. (2016). Compilation of heat flow data in the continental area of China (4th edition). Chin. J. Geophys 59, 2892–2910.
Kong, F., Wu, J., Liu, K. H., and Gao, S. S. (2016). Crustal anisotropy and ductile flow beneath the eastern Tibetan Plateau and adjacent areas. Earth Planet Sci. Lett. 442, 72–79. doi:10.1016/j.epsl.2016.03.003
Li, Q., Bao, L., and Wang, Y. (2021). Accuracy evaluation of altimeter-derived gravity field models in offshore and coastal regions of China. Front. Earth Sci. 9, 722019. doi:10.3389/feart.2021.722019
Liu, Q. Y., Kind, R., and Chen, J. H. (2005). Dislocation structure of the crust-mantle boundary and low-velocity body within the crust beneath the Dabie Shan collision orogen. Sci. China Earth Sci. 48, 875–885.
Luo, S., Yao, H., Li, Q., Wang, W., Wan, K., Meng, Y., et al. (2019). High-resolution 3D crustal S-wave velocity structure of the Middle-Lower Yangtze River Metallogenic Belt and implications for its deep geodynamic setting. Sci. China Earth Sci. 62, 1361–1378. doi:10.1007/s11430-018-9352-9
Lv, J., Xie, Z. J., Zheng, Y., Zha, X., Hu, R., and Zeng, X. (2016). Rayleigh wave phase velocities of South China Block and its adjacent areas. Sci. China Earth Sci. 59, 2165–2178. doi:10.1007/s11430-015-5372-5
Maiti, S., and Chiluvuru, R. K. (2024). A deep CNN-LSTM model for predicting interface depth from gravity data over thrust and fold belts of North East India. J. Asian Earth Sci. 259, 105881. doi:10.1016/j.jseaes.2023.105881
Meng, Q. K., Zhang, W. Z., Gao, W., Shu, Q., Li, R., Xu, G. J., et al. (2022). Property analysis and application of muli-scale wavelet decomposition of gravity potential field. Geophys. Geochem. Explor. 46 (4), 946–954. doi:10.11720/wtyht.2022.2552
Shi, Y. T., and Gao, Y. (2022). Spatial distribution of shear wave splitting of the upper crust in the central South China Block. Chin. J. Geophys 65, 3268–3279.
Wang, C. Y., Chang, L. J., Ding, Z. F., Liu, Q., Liao, W., and Flesch, L. M. (2014). Upper mantle anisotropy and crust-mantle deformation pattern beneath the Chinese mainland. Sci. China Earth Sci. 57, 132–143. doi:10.1007/s11430-013-4675-5
Wei, Z., Chen, L., Li, Z., Ling, Y., and Li, J. (2016). Regional variation in Moho depth and Poisson’s ratio beneath eastern China and its tectonic implications. J. Asian Earth Sci. 115, 308–320. doi:10.1016/j.jseaes.2015.10.010
Xia, S., Shen, Y., Zhao, D., and Qiu, X. (2015). Lateral variation of crustal structure and composition in the Cathaysia block of South China and its geodynamic implications. J. Asian Earth Sci. 109, 20–28. doi:10.1016/j.jseaes.2015.05.010
Xia, Y., Xu, X., Niu, Y., and Liu, L. (2018). Neoproterozoic amalgamation between Yangtze and Cathaysia blocks: the magmatismin various tectonic settings and continent-arc-continent collision. Precambrian Res. 309, 56–87. doi:10.1016/j.precamres.2017.02.020
Xu, T., Zhang, Z. J., and Tian, X. B. (2014). Crustal structure beneath the Middle-Lower Yangtze metallogenic belt and its surrounding areas: constraints from active source seismic experiment along the Lixin to Yixing profile in East China. Acta Petrol Sin. 30, 918–930.
Yan, J. Y., Zhang, Y. Q., and Luo, F. (2022). Isostatic gravity state in South China Block and its geological implication. Acta Geosci. Sin. 43, 744–754.
Keywords: Guangxi, gravity characteristics, basement interfaces, tectonic zoning, lithosphere-asthenosphere interaction
Citation: Lu Z, Yang F, Yang Y, Liao H and Mo Y (2025) Detection and characteristic analysis of the crustal basement interface in Guangxi, China. Front. Earth Sci. 13:1553606. doi: 10.3389/feart.2025.1553606
Received: 31 December 2024; Accepted: 11 March 2025;
Published: 25 March 2025.
Edited by:
Giovanni Martinelli, National Institute of Geophysics and Volcanology, Section of Palermo, ItalyReviewed by:
Yunchou Xu, China University of Geosciences, ChinaCopyright © 2025 Lu, Yang, Yang, Liao and Mo. This is an open-access article distributed under the terms of the Creative Commons Attribution License (CC BY). The use, distribution or reproduction in other forums is permitted, provided the original author(s) and the copyright owner(s) are credited and that the original publication in this journal is cited, in accordance with accepted academic practice. No use, distribution or reproduction is permitted which does not comply with these terms.
*Correspondence: Fuqiang Yang, ZnVxaWFuZ3lhbmdfZ2lzQDE2My5jb20=; Yajun Mo, Z3h3dG15akAxNjMuY29t
Disclaimer: All claims expressed in this article are solely those of the authors and do not necessarily represent those of their affiliated organizations, or those of the publisher, the editors and the reviewers. Any product that may be evaluated in this article or claim that may be made by its manufacturer is not guaranteed or endorsed by the publisher.
Research integrity at Frontiers
Learn more about the work of our research integrity team to safeguard the quality of each article we publish.