 Yan Zhang
 Yitao Hu
 Xiangsheng Zheng2
 Yang Yu
 Haosen Guo
 Meiben Gao
94% of researchers rate our articles as excellent or good
Learn more about the work of our research integrity team to safeguard the quality of each article we publish.
Find out more
ORIGINAL RESEARCH article
Front. Earth Sci., 28 March 2025
Sec. Geohazards and Georisks
Volume 13 - 2025 | https://doi.org/10.3389/feart.2025.1549911
This article is part of the Research TopicHigh-Altitude and Long-Runout Landslide Dynamics: Theory, Methods, and ApplicationsView all 5 articles
Driven by rainfall and excavation, frequent landslides in southwestern China pose a serious threat to lives and property. This study uses advanced small baselines subset-interferometric synthetic aperture radar (SBAS-InSAR) time series analysis method and Sentinel-1 satellite data, combined with numerical simulation analysis, to study the deformation and stability characteristics of the Laoyingpan Village landslide under different rainfall and support measures conditions. The study results indicate that the Laoyingpan Village landslide has a 24° average slope, covering approximately 3.8 × 10⁵ m2 with a volume of about 1.3 × 10⁷ m3 and an “arm-chair” shape oriented at 106°. Excavation and rainfall are key factors impacting stability, causing significant deformation, especially on the left side with translational failure. SBAS-InSAR analysis indicates a maximum subsidence rate of 25 mm/month in lower slope sections. Under extreme rainfall, the stability coefficient dropped from 1.160 to 0.871, transitioning from stable to unstable before stabilizing after 60 h due to submergence. The implementation of anti-slide piles and anchor cables improved stability, reaching a coefficient of 1.745 with optimal parameters, recommending a combined support approach for effective landslide management. The study results can provide useful reference and guidance for the stability analysis and engineering prevention of the landslides.
In recent years, urban development and population growth have led to increasing destruction of the geological environment in urban and surrounding areas due to human engineering activities. This has caused significant geological problems, which have negatively impacted social and economic development, as well as people’s quality of life. These challenges also pose serious difficulties for geological disaster prevention and environmental protection.
In recent years, the rapid development of Synthetic Aperture Radar Interferometry (InSAR) has become an important tool for studying surface deformation through space observation and a major focus of international research. Compared to traditional leveling and GPS surveying technologies, InSAR offers advantages such as high sensitivity, high spatial resolution, and wide coverage, making it particularly effective for detecting large-scale surface deformation with high accuracy (Zhang et al., 2024; Hamdi et al., 2023; Ye et al., 2004; Rosen et al., 2002; Bamler and Hartl, 1998; Gabriel et al., 1989; Vanicek et al., 1980). Synthetic aperture radar interferometry (InSAR) was mainly used to generate digital elevation models and mapping, and to extract three-dimensional surface signals based on phase data and orbital space information of multiple InSAR images acquired from repeated orbits, often used to monitor and predict slope geological hazards (Yan et al., 2024; Wang et al., 2023; Dai et al., 2021; O’Connor et al., 2021; Hamdi et al., 2020; Rosen et al., 2018; Kang et al., 2017; Bianchini et al., 2015). With the emergence of D-InSAR, its application is extended to measuring small surface deformation. As early as 1989, it was proved that the InSAR technology could be used to monitor the surface deformation of centimeter-level and with the rapid development of InSAR technology, the measurement accuracy of deformation has reached 3–5 mm (Wang et al., 2020; Hu et al., 2019; Zhang et al., 2019; Zhang et al., 2017; Gabriel et al., 1989). Massonnet et al. constructed interferograms by combining SAR images obtained by the European Remote Sensing Satellite (ERS-1) before and after earthquakes with topographic information, it is found that the final results were highly consistent with other measurement results. In addition, with the development of InSAR technology, this technology has been gradually applied in the field of landslide monitoring (Massonnet et al., 1993). Achache et al. used the ERS-1 data to monitor a landslide in southern France, and the displacement obtained from SAR was very consistent with the ground measurement (Achache et al., 1996). Huntley used InSAR data to monitor multiple landslides in the Thompson river valley, Canada, and compared other monitoring methods, proving that coherent point analysis and differential stacking of continuous scattering interferograms are suitable for monitoring and identifying landslides (Huntley et al., 2017). In addition, many different scholars have conducted detailed research on the application of SAR technology (Berardino et al., 2002; Ferretti et al., 2000; Rosen et al., 2000; Williams et al., 1998). Due to the limitation of time baseline and space baseline, D-InSAR technology cannot obtain accurate temporal deformation of the surface. The multi-baseline distance D-InSAR method proposed by Usai in 2001 uses the least square method to solve the temporal deformation of the SAR image set (Usai, 2001). On this basis, Beradino et al. proposed the short-baseline set SBAS method to monitor ground deformation in 2002 (Mora et al., 2002). The SBAS-InSAR technology has significant advantages in monitoring large-scale and long-term surface deformation, enabling efficient and accurate acquisition of temporal deformation information of the surface, which is particularly suitable for monitoring geological hazards such as landslides. This technology provides high-resolution spatial and temporal data, effectively capturing minor deformations, especially in slow-moving geological phenomena like landslides, offering continuous monitoring results. Furthermore, compared to other remote sensing technologies (e.g., optical image analysis or LiDAR), the SBAS-InSAR method performs better in handling complex terrain and adverse weather conditions, with stronger adaptability and lower error rates. It is not affected by weather, lighting, or other conditions, making it suitable for monitoring large-scale surface changes, which is particularly crucial for the monitoring of the Laoyingpan Village landslide in Jinyang County in this study. By integrating with geological surveys, SBAS-InSAR technology can provide precise landslide deformation information, offering strong support for addressing research questions.
The causes of landslides are any factors that reduce the safety factor from a stable state to an actively unstable state. These causes are diverse, including both natural and human-induced factors. Natural factors mainly include geological conditions, climate change, rainfall, earthquakes, and topography. For example, the weakening of the geological layers, excessive slope of the mountain, and heavy rainfall may all contribute to landslide occurrence. Human-induced factors include excessive excavation, construction activities, road building, and deforestation, which may compromise the stability of the mountain and trigger landslide disasters (Fang et al., 2022; Fang et al., 2024; Li et al., 2024). The analysis of landslide stability is crucial for the prevention and control of landslide disasters. With the development of landslide stability analysis research, it is gradually developed from qualitative analysis to quantitative analysis. The qualitative analysis methods mainly include the engineering analogy method, natural history analysis method, etc. The semi-quantitative analysis mainly includes graphical methods. Quantitative analysis is divided into deterministic and non-deterministic analysis, deterministic analysis includes limit equilibrium method and numerical analysis. Limit equilibrium methods include the Janbu method (Janbu, 1973), the Bishop method (Bishop and Morgenstern, 1960), the Morgenstern-Price method, etc. Numerical analysis methods include the finite element method (FEM) (Li, 2007), boundary element method (BEM) (Chen et al., 2022), DEM (Chen et al., 2024), Finite difference Method (Jiao et al., 2013; Zhu et al., 2011), etc. Non-deterministic analysis methods include reliability analysis (Zhang et al., 2020), artificial intelligence (Mi and Chen, 2003), neural networks (Wang et al., 2005), etc. On the whole, most of the current studies use field investigation and single method to analyze the whole process of landslide failure, and relatively few studies combine remote sensing to analyze slope deformation and further use numerical method to analyze landslide stability.
The landslide studied in this paper is an old landslide located in Laoyingpan Village, Jinyang County, Sichuan Province, China, which is called Laoyingpan Village landslide. In recent years, pavement cracking and house deformation near the landslide area continue to occur, and the Laoyingpan Village landslide is partially in a state of creep deformation, which seriously threatens the safety of life and property of residents near the landslide.
Therefore, this study aims to investigate the stability changes of the Laoyingpan Village landslide and its impact on the surrounding environment, while exploring the application of SBAS-InSAR technology in monitoring such landslide deformations. The primary objective of this research is to utilize SBAS-InSAR technology to monitor surface deformation in Jinyang County, analyze the deformation trends of the Laoyingpan Village landslide, and assess the landslide’s stability under both natural and rainfall-induced conditions through numerical simulations. Based on the stability analysis, effective mitigation measures for the landslide will be proposed.
Jinyang County is located in the southwest of Sichuan Province, on the eastern edge of Liangshan Yi Autonomous Prefecture, along the north bank of the Jinsha River. The region is characterized by strong erosion and cutting by mountainous rivers, with the mountains influenced by regional geological structures. Most of the mountains run in north-south or northeast directions. The terrain is higher in the west and lower in the east. The highest point, Lion Rock, is 4,076 m above sea level, while the lowest point, Hulu Ping, is 460 m above sea level, creating a relative elevation difference of over 3,600 m. The geographic location of the Laoyingpan Village landslide is shown in Figure 1.
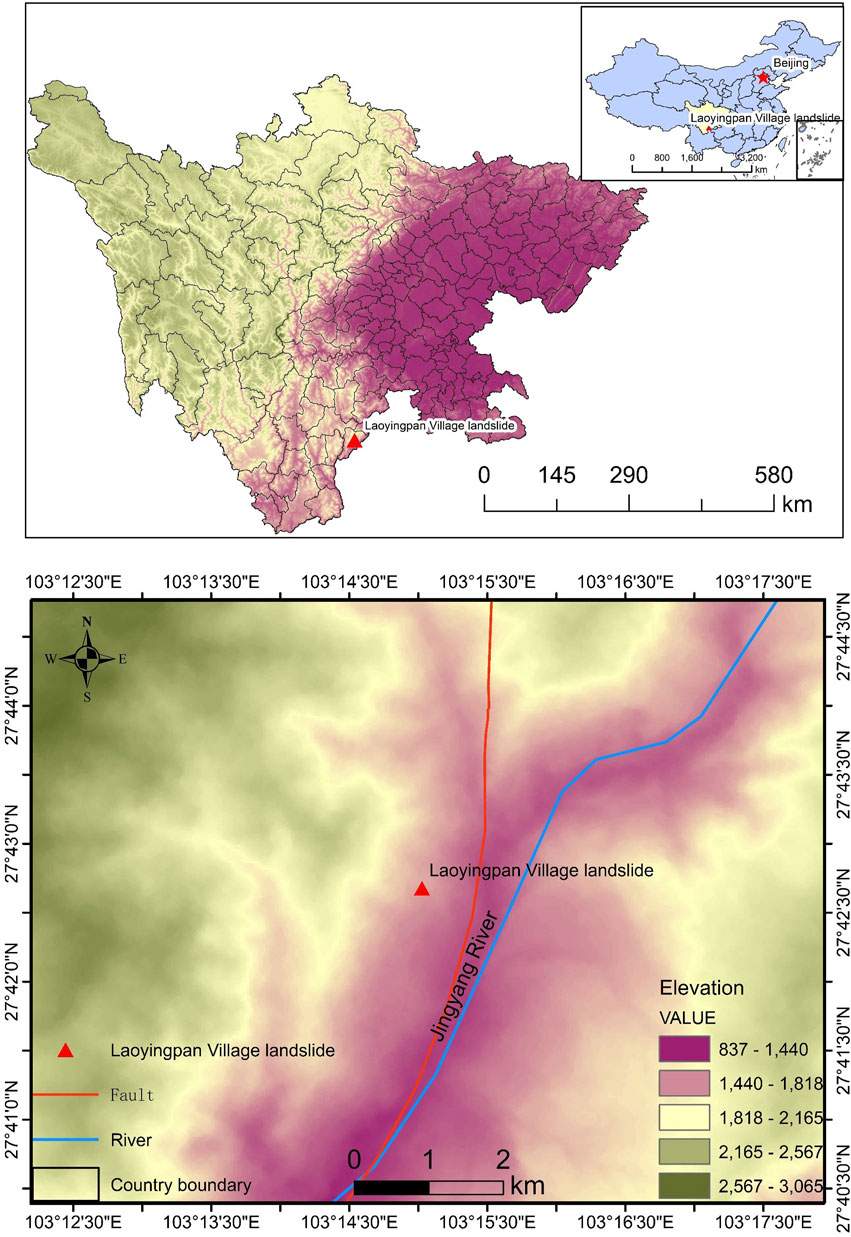
Figure 1. Geographic location of the Laoyingpan Village landslide.
The area is a subtropical humid monsoon climate zone, the overall climate characteristics are warm and cool, the temperature difference between the four seasons is relatively obvious, and the dry or rainy season is distinct. The annual average temperature in the area is 15.7°C. The extreme maximum temperature is 38.6°C, and the extreme minimum temperature is −4.0°C. The annual average precipitation is 788.1 mm, the maximum annual precipitation is 1152.1 mm, and the minimum annual precipitation is 439.0 mm. In general, rainfall is not abundant, and the spatial and temporal distribution of rainfall is not uniform. The rainy season (May to October) rainfall is 700.8 mm, accounting for 88.9% of the total annual rainfall, and the dry season (November to April of the next year) rainfall is 87.3 mm, accounting for 11.1% of the total annual rainfall. The surrounding outcrop strata mainly consist of Quaternary, Permian, Silurian, Ordovician, and Sinian strata, while Carboniferous and Cretaceous strata are missing.
The area is located within the Liangshan Xiaojiang fault zone of the Xichang Liangshan folding zone on the western margin of the Yangtze Craton, marking the junction between the “South-North Sichuan-Yunnan Structural Belt” and the “Hua-Xia Tectonic Style”. It lies near the suture zone between the Eurasian Plate and the Indian Subcontinent Plate, at the central part of the Sichuan-Yunnan-Guizhou-Guangxi Plate, where the primary structural system is the Jinsha River fault zone. This area is part of the secondary collision belt—Xiaojiang fault, which is parallel to the major suture zone of the Green River deep fault.
Surface water in the region mainly consists of the Jinyang River and its tributaries, with the front edge of the landslide located along the Jinyang River. The northern edge of the landslide near Jinyang River has been reinforced with a protective dam, which has reduced the river’s erosive effect on the base of the slope. Several small seasonal runoff gullies are developed on both sides and along the slope body, with no flow observed during the investigation. Groundwater replenishment primarily comes from atmospheric precipitation, followed by snowmelt from the high-altitude mountains. The contribution of irrigation water to groundwater is very limited. The flow paths are short, and once discharged, the water turns into surface water. Groundwater movement is closely linked to the local meteorological and hydrological conditions and is also controlled by geological structures, strata, lithology, topography, and vegetation conditions.
Additionally, the rock and soil bodies are subjected to strong daily temperature fluctuations due to the high-altitude climate, especially in this dry and hot valley area, where physical weathering is intense. The surface rock and soil bodies often develop weathered fissures due to weathering, leading to collapse and landslides under self-weight stress. The sparse vegetation further exacerbates slope morphological changes. During the rainy season, atmospheric precipitation infiltrates the weathered fissures, and when the surface soil becomes saturated, the stability conditions worsen, making it prone to collapse. Prolonged progressive damage severely affects the stability of the slope’s rock and soil bodies. The groundwater movement in the region is characterized by precipitation infiltration as the main source of recharge. The groundwater runoff has short flow paths and is discharged as springs or seepage, eventually converting to surface water. The recharge, runoff, and discharge zones generally overlap, with a large hydraulic gradient and intense water activity.
The Laoyingpan Village landslide is located on the northeast side of the county seat of Jinyang County, on the right bank of the Jinyang river. The overall terrain of the landslide is high in the northwest and low in the southeast. The slope of the landslide ranges from 10° to 55°, with an average slope of 24°. The overall area is about 3.8 × 10⁵ m2, and the overall volume is about 1.3 × 10⁷ m3. The plane shape of the landslide is an “arm-chair”, and the main sliding direction is about 106°.
The Laoyingpan Village landslide can be divided into three areas according to the characteristics of landform, geomorphology, and rock and soil distribution. The front left area is landslide zone Ⅰ, the front right area is landslide zone Ⅱ, and the rear area is landslide zone Ⅲ. The schematic diagram of landslide zoning and longitudinal section of landslide are shown in Figure 2.

Figure 2. Overview and profile of landslide in Laoyingpan village. (a) Overall morphology of Laoyingpan Village landslide, landslide boundary and landslide zoning map. (b) 1–1′ profile. (c) 2–2′ profile.
It can be clearly seen from Figure 2 that there are a large number of residential buildings on the platform at the rear edge of the Laoyingpan Village landslide, with roads and residential areas distributed on the landslide body, and factories distributed on the front edge of the landslide. In addition, there is a Jinyang river passing through the front edge of the Laoyingpan Village landslide, and once the landslide loses stability, there is a risk of forming a barrier dam. It can be seen from the above that the deformation monitoring analysis and stability study of the landslide are very important. Once the landslide is unstable, it will pose a great threat to the life safety and property of the people.
Landslide zone Ⅰ is located on the left side of the landslide region. Its left edge is bounded by a gully, and its right edge is limited by the raised position of micromorphology. The leading edge extends along the slope foot of the Jinyang river bank, the shear outlet is located near the erosion base level, and the trailing edge extends along the steep and slow junction at the rear of the landslide. According to the above-delineated boundary of the landslide zone Ⅰ, the plane shape of the landslide is tongue-type. Landslide zone Ⅰ has less topographic relief, with a slope of about 22°–25°. The rear slope is 45 m high, with a slope of about 40°, which is the sliding wall in landslide zone Ⅰ. The current situation of the slope surface in this area is mainly village houses and farmland, and the vegetation damage is serious, especially in the middle and rear of the landslide zone Ⅰ. This area is the gathering area of Laoyingpan Village, and the houses are densely built, which has a great influence on the stability of the slope.
The landslide zone Ⅱ is located on the right side of the landslide area. The left edge of the landslide is limited by the raised position of the micro landform and the right edge of the landslide is limited by the ridge and gully. The front edge extends along the slope foot of the Jinyang river bank, the shear outlet is located near the erosion base level, and the rear edge extends along the steep and slow junction of the middle and rear of the landslide. According to the boundary delineated above, the plane shape of landslide zone Ⅱ is tongue-type. The slope in the middle and rear of landslide zone Ⅱ is about 40°, which is the sliding wall of landslide zone Ⅱ, and the current situation is woodland. A large platform is developed in the middle of the landslide zone Ⅱ, which is about 170 m in length, 190 m in width, 3.3 × 10⁴ m2 in area, and the overall slope of the platform is about 10°. It is now the gathering area of Laoyingpan Village. The front of the landslide zone Ⅱ is near Jinyang river, and the slope is steep. The slope length is about 140 m, the slope height is about 100 m, and the slope is about 35°. The area is currently forested. The secondary sliding is developed in the middle and front part of landslide zone II, forming a clear arm-chair shaped terrain. The secondary sliding range is about 170 m long, 150 m wide, with an area of 2.3 × 10⁴ m2, and the sliding direction is about 65°, which is the secondary sliding in the residual accumulation body after the overall sliding of the landslide zone II.
The landslide zone Ⅲ is located at the rear of the landslide zone, and its left, right, and trailing edges are limited by the overall boundary of the Laoyingpan Village landslide, while the leading edge is the slope top of the trailing edge of the landslide zones Ⅰ and Ⅱ. According to the above-delineated boundary of zone Ⅲ, the plane shape of the landslide is irregular. The rear part of the landslide zone Ⅲ is connected to a steep wall with a height of about 50 m and a slope of about 50°. The area of landslide zone Ⅲ is relatively flat, mainly cultivated land, with scattered households and houses distributed.
This paper uses Sentinel-1 satellite data from the European Space Agency (ESA), including both Sentinel-1A and Sentinel-1B, to perform InSAR time-series analysis for extracting surface deformation. The Sentinel-1 satellites are part of the European Space Agency’s Copernicus program (formerly known as GMES) for Earth observation, consisting of two satellites equipped with C-band synthetic aperture radar, capable of providing continuous imagery (day and night, and in all weather conditions). The Sentinel-1 spacecraft is designed with a 12-m-long C-band synthetic aperture radar antenna and two 10-m-long solar panels. The “Sentinel-1A” satellite, weighing about 2.3 tons, will be in a sun-synchronous orbit with an orbital period of approximately 96 min. The expected operational life is 7.25 years, with a data storage capacity of 1,410 Gbit and a downlink capacity of 520 Mbit/s in X-band. During this period, the satellite can scan up to 400 km and provide 8,000 Gbit of image data daily. The main data of satellite images in this region are shown in Table 1, the image orbit coverage is shown in Figure 3.
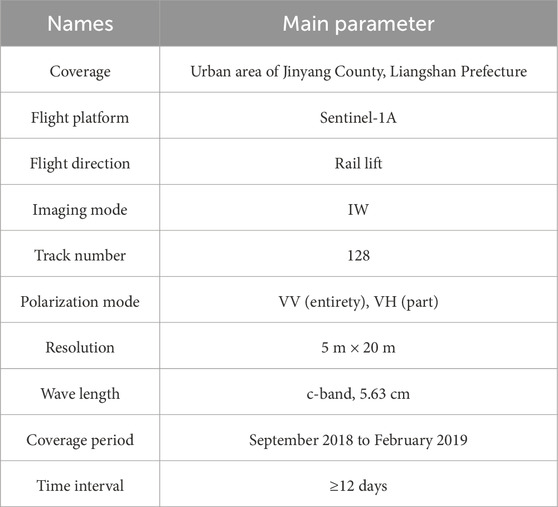
Table 1. Main parameters of Sentinel-1A satellite ascension data of urban area of Jinyang County.
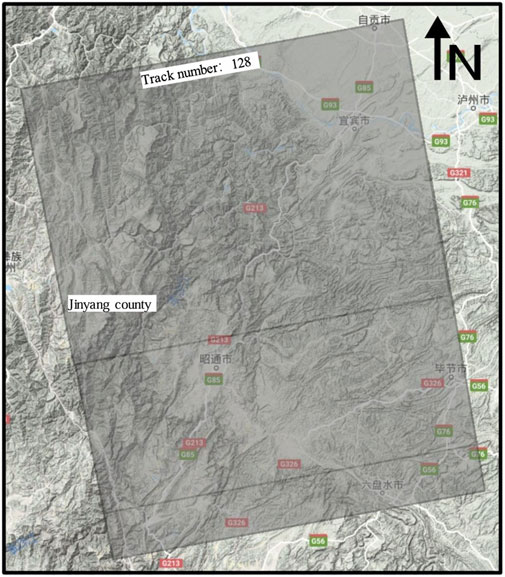
Figure 3. Data coverage map of Sentinel-1A satellite ascension data in urban area of Jinyang County.
The key of SBAS technology is the selection of differential interference pairs, and the selection of appropriate spatial and temporal baselines to reduce or eliminate some of the images that are de-correlated in D-InSAR processing. The specific steps are as follows:
Assuming that there are N+1 SAR images covering the same area acquired according to the time series, the acquired time series of the image can be calculated using Formula 1:
After selecting a SAR image as the main image for registration, the interference pairs that meet the threshold of time baseline and spatial baseline are selected from all free combination differential interference pairs, and M differential interferograms can be obtained using Formula 2:
Taking time
where λ is the radar wavelength,
Since SBAS technology is based on pixel-by-pixel calculation to obtain the deformation of each pixel in the differential interferogram on the time series, the solution model of SBAS technology is introduced by taking a certain pixel as an example. Let the vector composed of the phase of the pixel in all SAR images be the parameter to be obtained using Formula 5:
The vector composed of phase in the unwrapped differential interferogram is the observed parameter as shown in Formula 6:
where
If the main and auxiliary images are arranged in time series, that is,
The above equation system contains M equations with N unknowns, which can be simplified as following Formula 9:
Each row of the matrix A [M*N] corresponds to each interference pair, that is,
If all interference pairs belong to the same subbaseline set, then the rank of matrix A is N (M ≥ N), and its least squares solution is as following Formula 11:
When the baseline set contains multiple subsets, the matrix A is rank deficient and
where U is an M × N orthogonal matrix, the diagonal element of
where
Then the equation
The above equation can be simplified as following Formula 16:
where B is the M × N matrix, matrix element
The SARscape module in remote sensing image soft ENVI is used to preprocess the SAR image data collected from the European Space Agency (ESA) website. First, the data and precision orbit data are imported into SARscape. Then, the common area of the SAR image is viewed and trimmed to make it suitable for the study area and maximize the processing speed of the software, and reduce the amount of data.
Figure 4 shows the specific processing flow chart of SBAS deformation extraction technology. SBAS technology mainly includes the generation of connection graphs, the generation of the interferogram, the de-leveling effect of the interferogram, the completion of adaptive filtering, phase unwinding, orbit refining and re-de-leveling, phase transformation, and deformation, and geocoding.
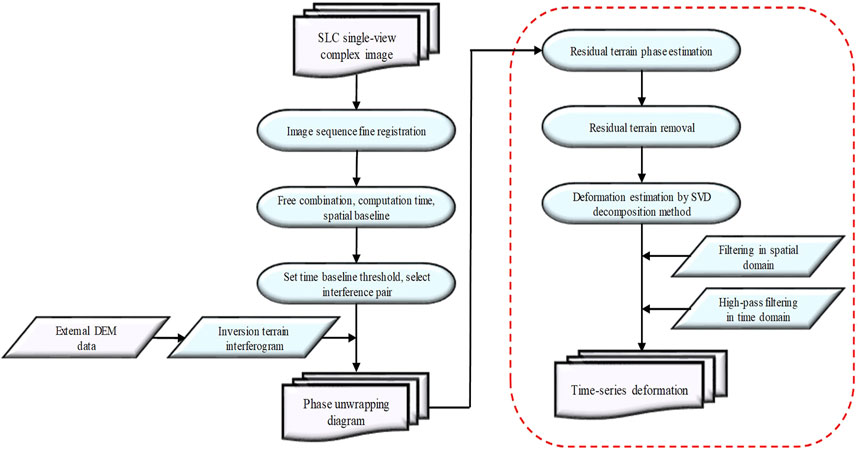
Figure 4. The specific processing flow chart of SBAS deformation extraction technology process.
Based on the above SBAS-InSAR time series analysis method and Sentinel-1A satellite data, after cutting and processing the monitoring range images, the final research area covers about 8 square kilometers of Jinyang County and the whole landslide body, and the altitude covers the range between 1000 m and 1900 m of the landslide body.
The results of surface deformation monitoring in Jinyang County are shown in Figure 5. The maximum average monthly subsidence rate was 25 mm/month, and a total of three slopes with deformation rates exceeding 20 mm/month were identified. All are mainly located in the lower part of the slope, below the county town of Jinyang, with the largest one located in the area of Laoyingpan Village on the northeast side of the county town. The other two sites are smaller in size and are located throughout the slope at the foot of the river valley. The upper part of the slope is relatively stable, but there are isolated points where deformation of less than 10 mm/month occurs. The lower slopes in Jinyang County are less stable, with most showing minor deformation.
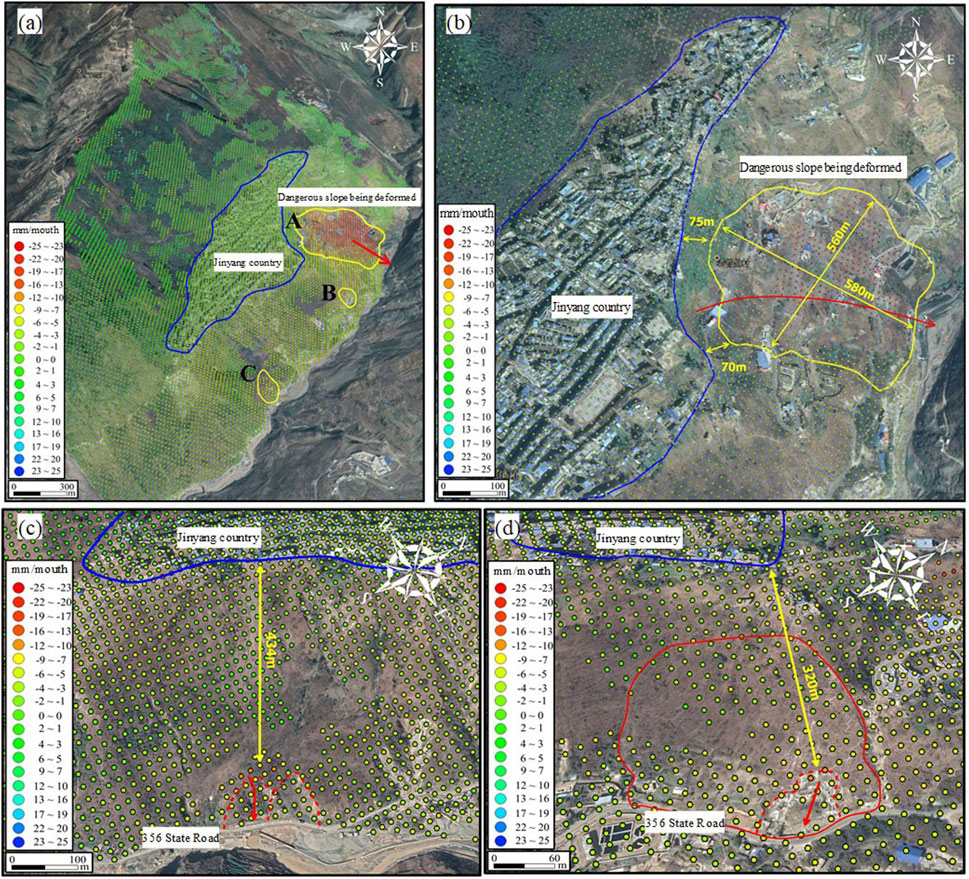
Figure 5. InSAR deformation monitoring results of research area in Jinyang County. (a) Overall map of InSAR deformation monitoring results in Jinyang County research area. (b) Drawings of partial enlargement of InSAR deformation monitoring results of research area A in Jinyang County. (c) Drawings of partial enlargement of InSAR deformation monitoring results of research area B in Jinyang County. (d) Drawings of partial enlargement of InSAR deformation monitoring results of research area C in Jinyang County.
Figure 5B shows the enlargement of the specific deformation in Zone A of Laoyingpan Village and the county seat. The entire deformation area is about 300,000 square meters (about 580 m long and 560 m wide). The maximum deformation rate is 25 mm/month. The deformation is only about 70 m from the nearest point of the county border, which poses a great threat to the stability of the county building.
The specific deformation in Zone B is shown in Figure 5C, where the maximum deformation rate in the zone B reaches 20 mm/month, and the closest distance from the county boundary at this location is approximately 320 m. Although the entire deformation zone is small, the vicinity of this zone basically has a slight deformation, which has a certain impact on the stability of the county building.
The specific deformation in Zone C is shown in Figure 5D, where the maximum deformation rate is 20 mm/month and the closest distance to the county boundary is approximately 434 m. Although the entire deformation zone is relatively small, it still has an impact on the stability of the county buildings.
To further investigate the impact of rainfall on the stability of the Laoyingpan Village landslide, this study primarily uses the SLOPE/W, SIGMA/W, and SEEP/W modules in GeoStudio software for analysis.
To facilitate modeling and calculations, the following basic assumptions were established: (1) The model material is considered a homogeneous and isotropic continuum. (2) The rock and soil mass is treated as an ideal elastoplastic entity, with forces and deformation considered as plane strain problems. (3) Structural stress is excluded, and the initial stress field accounts solely for the gravitational stress of the rock and soil mass. (4) Rainwater evaporation and vegetation absorption are disregarded.
To clarify the applicability of these assumptions to the Laoyingpan Village landslide, it is essential to consider the geological characteristics and environmental conditions of the area. First, treating the model material as a uniform and isotropic continuum is reasonable because the Laoyingpan Village landslide exhibits relatively consistent geotechnical composition, which simplifies the analysis. Second, the ideal elastoplastic model effectively captures the deformation and failure behavior of the Laoyingpan Village landslide under external forces, particularly under plane strain conditions, thus more accurately reflecting the actual conditions. Moreover, focusing solely on gravitational stress in the initial stress field is appropriate, as the gravitational effect is typically the primary factor influencing slope stability. Lastly, it is reasonable to neglect rainwater evaporation and vegetation absorption in the short term, especially during extreme rainfall, as these factors generally have minimal impact on slope stability. In conclusion, these assumptions are applicable for analyzing the Laoyingpan Village landslide and provide a solid foundation for subsequent stability assessments.
According to the remote sensing analysis, the area with the largest deformation is the Laoyingpan Village area. As the middle and rear of the landslide zone Ⅰ, it is the gathering area of Laoyingpan Village with dense housing construction, which has a greater influence on the stability of the slope. Therefore, based on stability analysis software Geo-studio, this paper constructs a model based on longitudinal profile 1–1′ of the landslide. According to the survey data and other relevant data, the calculation model is selected as the slope with 410 m height and 980 m length. Based on the obtained lithological data, the landslide is divided into nine regions: breccia-bearing silty clay, angular gravel soil, gravel-bearing silty clay, fill soil, gravel soil, pebble soil, limestone, dolomite, and shale, among which dolomite, limestone, and shale are the bedrock. The model is shown in Figure 6.
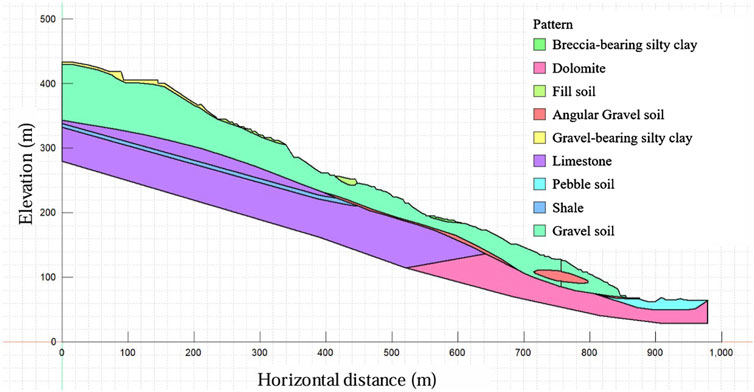
Figure 6. The established numerical calculation model of longitudinal profile 1–1′ of the Laoyingpan Village landslide.
To obtain the relevant parameters of the rock and soil in the landslide mass, soil samples were collected from both the landslide body and the sliding surface through field drilling, and rock samples were taken from the bedrock layer. The soil samples were then subjected to laboratory tests, including the following: the natural moisture content was determined by the drying method, the density was measured by the bottle method, the specific gravity was determined by the water displacement method, the particle size distribution was obtained by sieving, the liquid limit was measured using a Casagrande liquid limit apparatus, and the plastic limit was determined by manually rolling the soil sample into a thread until cracks appeared. Additionally, the compressive strength of the soil was determined by uniaxial compression testing, and the cohesion and internal friction angle were measured using a direct shear test. Meanwhile, the rock samples were tested to obtain natural density, moisture content, uniaxial compressive strength, and shear strength. These tests are crucial for the stability analysis of the landslide slope. Finally, based on the survey data and other relevant information, the physical and mechanical parameters of the rock and soil masses in the Laoyingpan Village landslide are shown in Table 2.
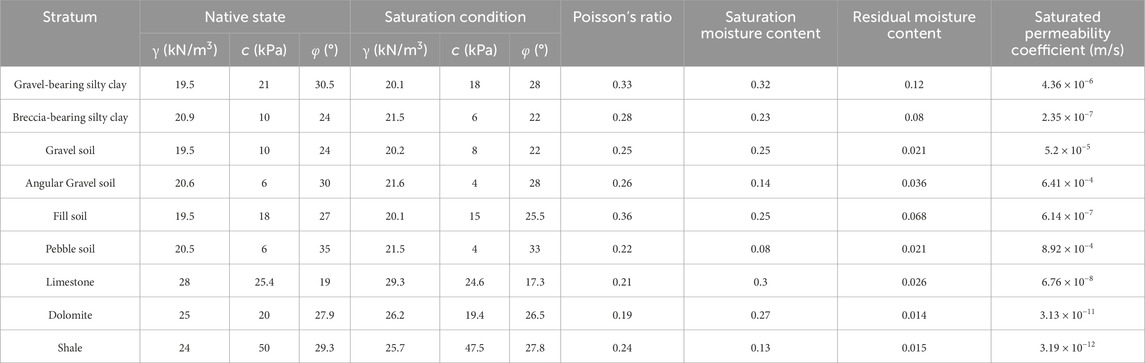
Table 2. Physical and mechanical parameters of the rock and soil mass of the Laoyingpan Village landslide.
In this paper, based on Geo-studio software, the Morgenstern-Price method is used to calculate the slope stability of the Laoyingpan Village landslide in the natural state and rainstorm state, the final stability coefficients results and calculation diagrams are shown in Figure 7.
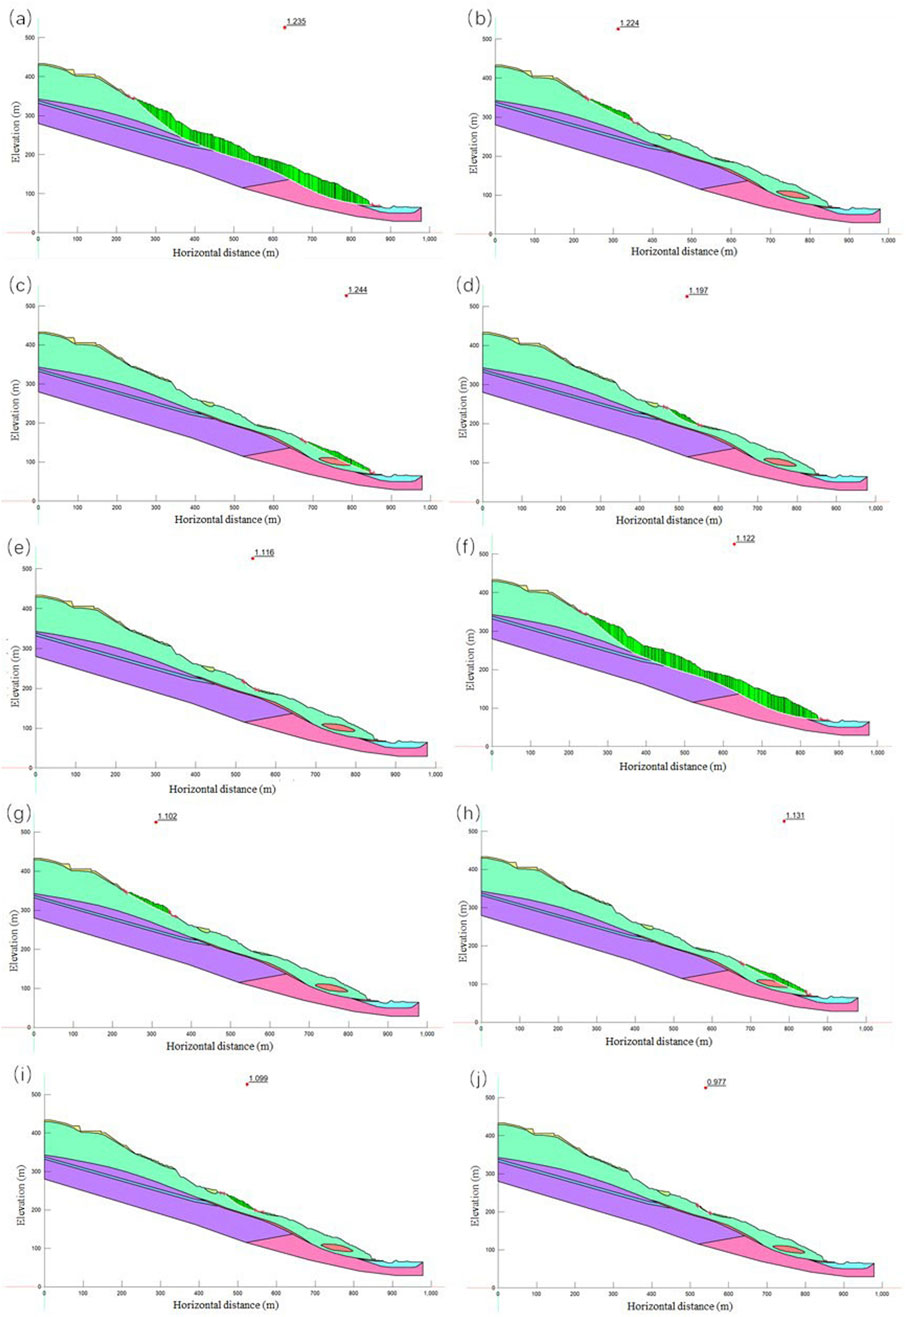
Figure 7. Stability calculation results of the Laoyingpan Village landslide. (a) The entirety slope at natural state. (b) The rear of the slope at natural state. (c) The front of the slope at natural state. (d) The long sliding surface in strong deformation zone at natural state. (e) The short sliding surface in strong deformation zone at natural state. (f) The entirety slope at rainstorm state. (g) The rear of the slope at rainstorm state. (h) The front of the slope at rainstorm state. (i) The long sliding surface in strong deformation zone at rainstorm state. (j) The short sliding surface in strong deformation zone at rainstorm state.
Based on stability calculation results, it can be found that the 1–1′ profile of the Laoyingpan Village landslide is generally stable with stability coefficient 1.235 under natural conditions and basically stable with stability coefficient 1.122 under rainstorm conditions. The stability coefficients under natural conditions of the rear of the slope, the front of the slope, the long sliding surface in strong deformation area are 1.224, 1.224, 1.197, respectively, indicating that they are all in a stable state. While their stability coefficients under rainstorm conditions are 1.102, 1.131, 1.099, respectively, indicating that they are all in a basically stable state. The short sliding surface in strong deformation area is stable with stability coefficient 1.116 under natural conditions and basically stable with stability coefficient 0.977 under rainstorm conditions. From the above analysis, it can be seen that the slope is in a stable to basically stable state under natural conditions, and in a basically stable to unstable state under rainstorm conditions.
Based on the stability calculations for the overall Laoyingpan Village landslide, the stability coefficient of the entire landslide was found to range between 1.235 and 1.122, indicating that the Laoyingpan Village landslide is in a stable to quasi-stable state. However, the stability coefficient of the strong deformation area of the landslide ranges from 1.197 to 0.977, which places it between stable and unstable states. Using the SBAS-InSAR time-series analysis method and Sentinel-1 satellite data, it was determined that the surface deformation rate in the strong deformation area is approximately 20 mm/month. Therefore, this study separately simulates the strong deformation area by extracting its section from the overall Laoyingpan Village landslide profile, as shown in Figure 8A.
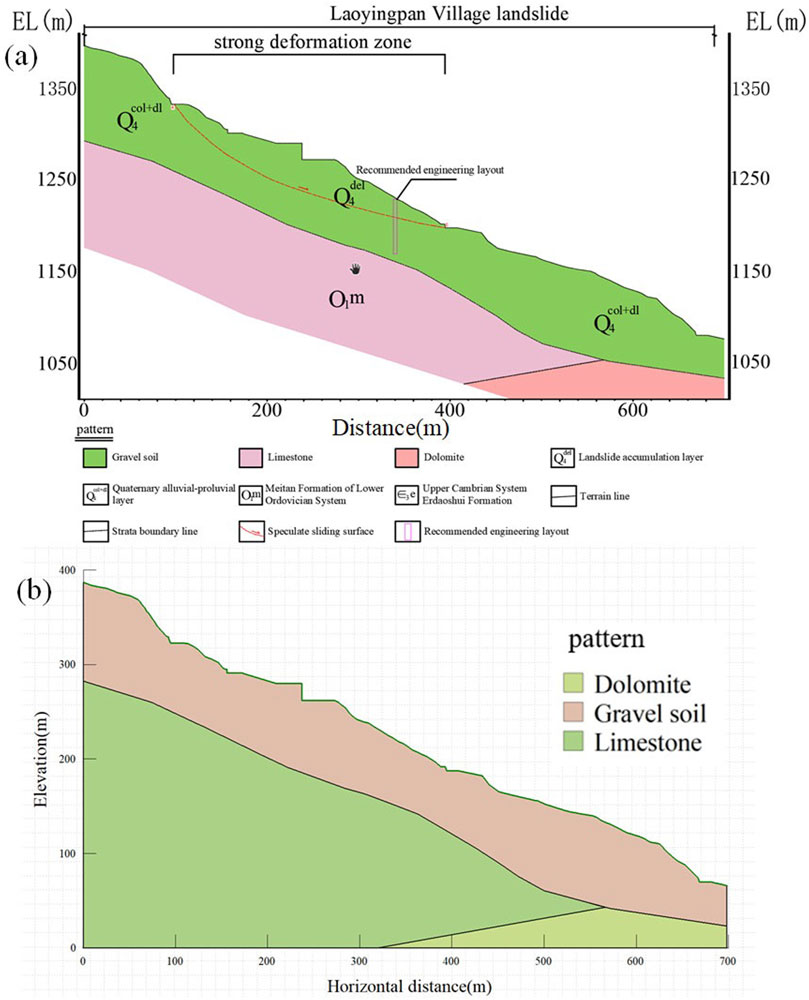
Figure 8. Profile and calculation model of the strong deformation area of the Laoyingpan Village landslide (a) Longitudinal section diagram; (b) Numerical calculation model diagram.
The initial model was established using the SIGMA/W and SLOPE/W modules of the Geo-Studio finite element software, as shown in Figure 8B. The model has a base length of 700 m and a vertical height of approximately 385 m. Quadrilateral computational elements were used, with an element grid area of approximately 1 m2, and the entire slope model was divided into 140,000 elements. The material constitutive model used is an elastoplastic model, and the strength criterion follows the Mohr-Coulomb yield criterion. The boundary conditions were set with fixed X/Y at the bottom, and the X-direction was fixed on both the left and right sides. The landslide model was divided into three main regions: gravelly soil, limestone, and dolomite, with limestone and dolomite serving as the bedrock.
This study primarily focuses on the stability of the strong deformation area of the Laoyingpan Village landslide under extreme rainfall conditions. Stability analysis was performed with a rainfall rate of 33.4 mm/day over a period of 96 h. As the sliding mass consists of fragmented gravelly soil with high permeability, it was assumed to be fully saturated under heavy rainfall conditions. Based on laboratory tests and engineering analogies, the mechanical and hydrological parameters of the various strata were determined, as shown in Table 2.
The calculation results for the strong deformation area of the Laoyingpan Village landslide under extreme weather conditions with heavy rainfall are shown in Figure 9. The impact of rainfall on the landslide primarily manifests as increased gravity in the rock and soil mass after water infiltration, leading to an increase in the downslope force. Additionally, the strata are softened, which reduces their shear strength. From Figures 9, 10, it can be observed that the stability coefficient of the strong deformation area of the Laoyingpan Village landslide decreased from 1.160 to 0.871 under extreme rainfall conditions. As the rainfall duration increased, the strong deformation area transitioned from a stable state to an unstable state. In the first 0–6 h, the stability coefficient ranged from 1.160 to 1.151, indicating a stable state. From 6–30 h, the stability coefficient ranged from 1.151 to 1.036, indicating a quasi-stable state. Between 30–36 h, the stability coefficient decreased from 1.036 to 0.996, indicating a marginally stable state. From 36–96 h, the stability coefficient further decreased from 0.996 to 0.871, indicating an unstable state.
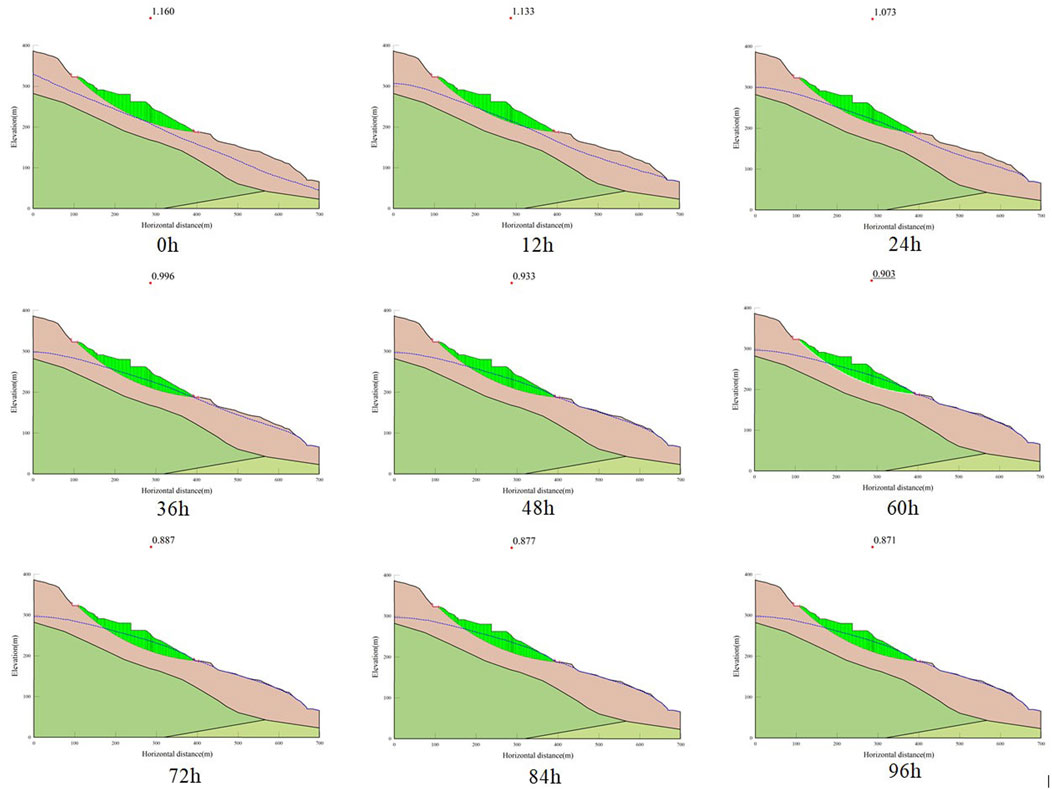
Figure 9. Stability calculation results of the strong deformation area of the Laoyingpan Village landslide under different extreme rainfall durations.
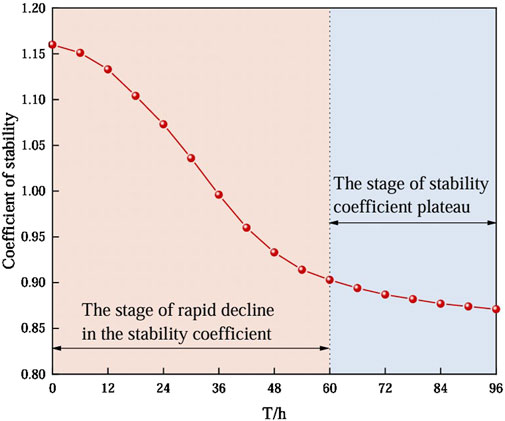
Figure 10. Variation of the stability coefficient for the strong deformation area of the Laoyingpan Village landslide under extreme rainfall conditions from 0 to 96 h.
During the 0–60 h period, the stability coefficient of the strong deformation area continued to decrease. As infiltrated rainwater merged with groundwater, the gas in the soil pores inside the landslide body was entirely expelled, increasing the soil’s weight and continuously reducing its internal friction angle. As the soil inside the landslide became saturated, the ongoing rainfall gradually increased the hydrostatic pressure in the slope’s tension cracks when they filled with water, softening the weak structural planes and further reducing the landslide’s stability coefficient. Between 60–96 h, the landslide’s stability coefficient remained unchanged, as the accumulated rainwater fully submerged the landslide, turning it into an underwater soil mass. At this stage, the heavy rainfall had little additional impact on the landslide’s stability (Wu et al., 2020). Therefore, the changes in the stability coefficient of the strong deformation area under extreme rainfall conditions can be divided into two stages: the first stage involves a rapid decline in the stability coefficient, and the second stage is a plateau where the stability coefficient remains steady.
As a commonly used measure for landslide mitigation, anti-slide piles possess advantages such as strong sliding resistance and minimal disturbance to the slope. Their operating principle involves placing piles within the landslide body to utilize the shear strength and bending capacity of the piles to prevent sliding (Xu et al., 2021). Given the intense deformation in the strong deformation area of the Laoyingpan Village landslide, it is recommended to install anti-slide piles within the area to provide support and ensure the safety of residential areas and roads. When designing the supporting structure, it is necessary to comprehensively compare the active earth pressure of the landslide mass and the residual sliding force to select the most unfavorable conditions for structural design, thereby achieving optimal structural dimensions.
According to the relevant provisions of the “Technical Code for Slope Engineering in Buildings” (GB50330-32013) and the “Geotechnical Engineering Investigation Code” (GB50021-32001), anti-slide piles can be installed in the front part of the strong deformation area. The strong deformation area is approximately 230 m wide, with the anti-slide piles having a cross-section of 1.5 × 2.0 m and a length of about 30 m, spaced 5 m apart, totaling approximately 45 piles, which will be cast using C30 concrete, the cross-section of the anti-slide piles arrangement is illustrated in Figure 11A.
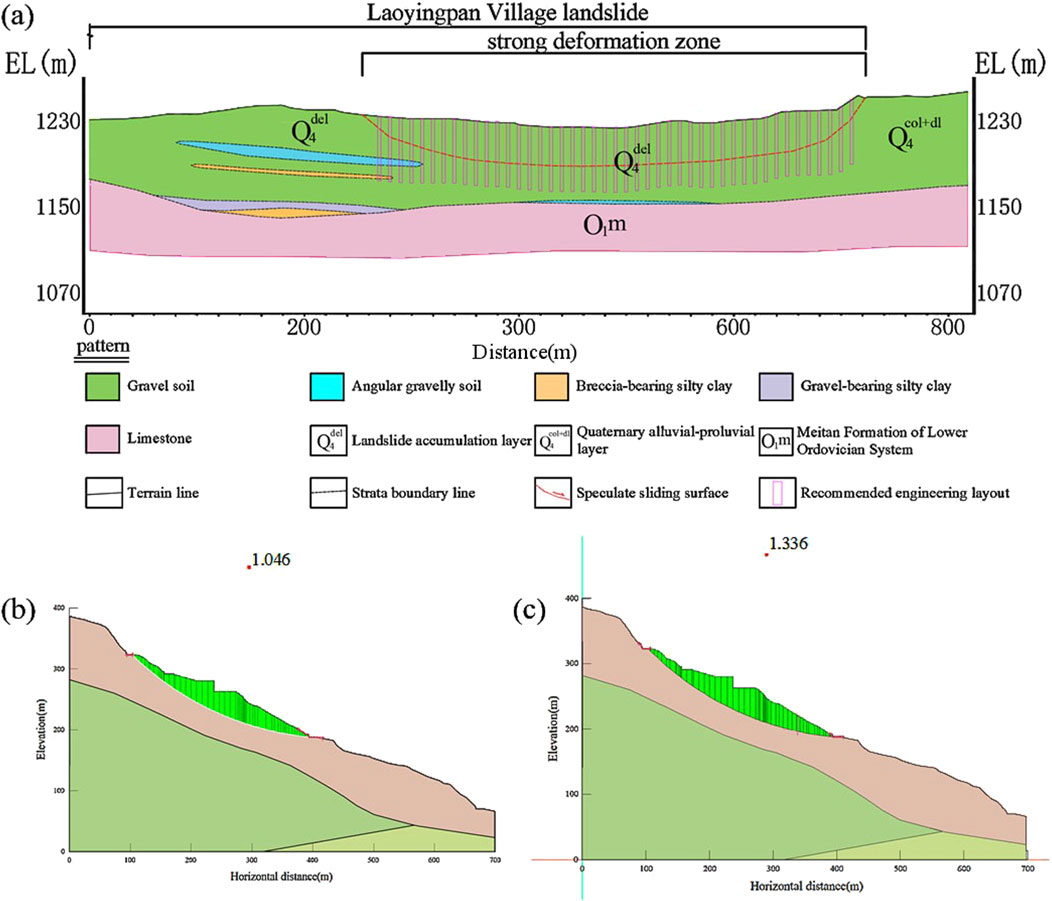
Figure 11. Layout diagram of anti-slide pile in strong deformation area of Laoyingpan Village landslide and comparison diagram of safety factor of anti-slide pile before and after reinforcement. (a) Schematic diagram of the arrangement of anti-slide piles in the strong deformation area of the Laoyingpan Village landslide. (b) Before reinforcement. (c) After reinforcement.
To facilitate the analysis of the enhancing effect of anti-slide piles on the stability of the strong deformation area of the Laoyingpan Village landslide, the stability coefficients before and after landslide mitigation were organized, as shown in Figures 11B, C. As shown in Figures 11B, C, the stability coefficient of the strong deformation area improved after landslide mitigation. Before the installation of anti-slide piles, the slope safety factor was 1.046, indicating an unstable condition. After the installation, the safety factor increased from 1.046 to 1.336, indicating a stable condition. This suggests that the mitigation scheme effectively enhances the stability of the slope.
The principle of using anchor cable to stabilize landslides involves anchoring one end in a stable stratum while connecting the other end to the landslide body. This utilizes the tensile strength of the anchor cable to apply resisting forces against the sliding of the landslide body. Compared to other mitigation methods, anchor cable stabilization offers advantages such as ease of construction, strong adaptability, and cost-effectiveness. This subsection aims to analyze the stability results of landslides under heavy rainfall conditions using different support parameters (spacing and positioning) to reasonably select an optimal range. This will facilitate the design of an effective anchor cable support scheme for evaluating landslide stability.
When using anchor cable for landslide stabilization, the effectiveness varies depending on the position of the anchor cable. To investigate the impact of anchoring positions on the stability of the strong deformation area of the Laoyingpan Village landslide, six support conditions were established: (a) support in the upper part of the strong deformation area; (b) support in the middle part; (c) support in the lower part; (d) support in the middle-lower part; (e) support in the middle-upper part; and (f) support in both the upper and lower parts of the strong deformation area. The length of the anchor cable was kept constant at 60 m, with a spacing of 2 m and an anchoring angle of 20°. The stability coefficients of the landslides at different anchoring positions were calculated using the Morgenstern-Price method, and the results are presented in Figure 12.
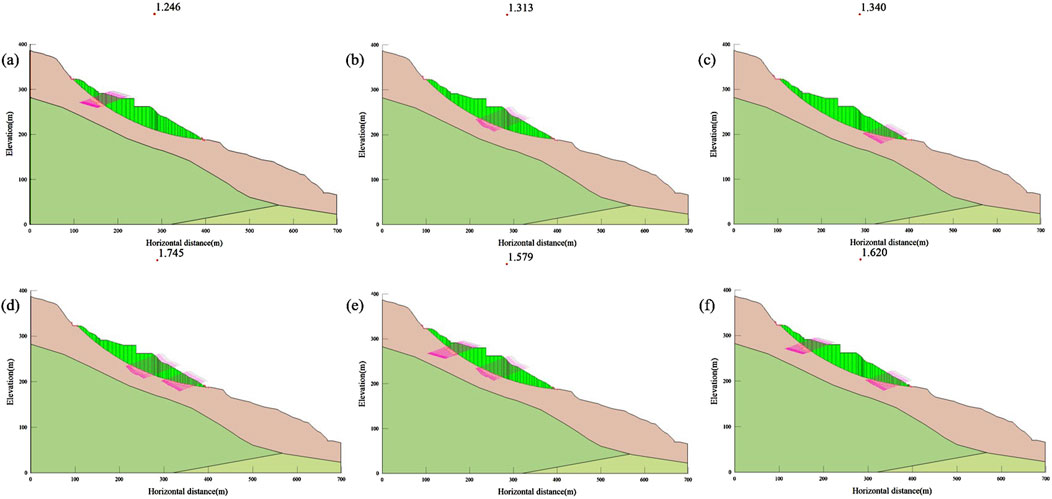
Figure 12. The impact of different support positions on the safety factor. (a) Upper part of the strong deformation area. (b) Middle part of the strong deformation area. (c) Lower part of the strong deformation area. (d) Middle-lower part of the strong deformation area. (e) Middle-upper part of the strong deformation area. (f) Upper and lower parts of the strong deformation area.
Figure 12 indicates that using anchor cable to support the landslide can enhance the stability of the strong deformation area. The effectiveness of anchor cable support in improving the stability of the strong deformation area varies significantly depending on the anchoring position. The increase in the stability coefficients of the strong deformation area, ranked from largest to smallest, is as follows: support in the middle-lower part (Figure 12D) > support in both the upper and lower parts (Figure 12F) > support in the middle-upper part (Figure 12E) > support in the lower part (Figure 12C) > support in the middle part (Figure 12B) > support in the upper part (Figure 12A). Although the landslide in the upper part of the strong deformation area remains stable, its stability coefficient is only 1.246. This is because the upper part of the landslide typically experiences less stress compared to the middle and lower parts, particularly in terms of shear stress. Therefore, while anchoring in the upper part can enhance local stability, the overall reinforcement effect of the anchor cable is limited due to the weaker sliding tendency in this area, resulting in a minimal impact on the stability of the entire landslide and a negligible increase in the stability coefficient.
The influence of supporting the middle and lower parts of the slope on the stability coefficient is similar; however, the deformation and displacement of the soil in the middle part of the landslide are often more pronounced than in the lower part. Additionally, the soil in the middle part is often located near the main sliding zone of the landslide, leading to more complex stress conditions. The stress distribution in the middle part is not as concentrated as in the lower part, making it difficult for the anchor cable’ resisting forces to be effectively transmitted to the sliding surface. The soil in this region undergoes significant deformation, and the depth and effectiveness of the anchor cable are limited. Therefore, even though support in the lower part can enhance local stability, the significant sliding forces and displacement trends in the upper and middle parts of the landslide mean that this support is insufficient to resist the movement of the entire landslide, resulting in a limited overall increase in the stability coefficient. Consequently, in this situation, simply supporting the lower part of the landslide is not effective in enhancing the overall stability of the landslide; comprehensive support for both the upper and middle parts of the strong deformation area is still necessary.
To study the impact characteristics of anchor cable spacing on landslide stability and to determine a reasonable anchor cable spacing, four conditions were established based on literature review and the summary of experiences from existing engineering cases: the anchor cable spacings are 2.0 m, 2.5 m, 3.0 m, and 4.0 m. The anchor cable angle is set at 20°, and the anchor cable length is 60 m. The stability safety factors for the strong deformation area under different anchor cable spacings were obtained through finite element numerical simulations, as shown in Figure 13.
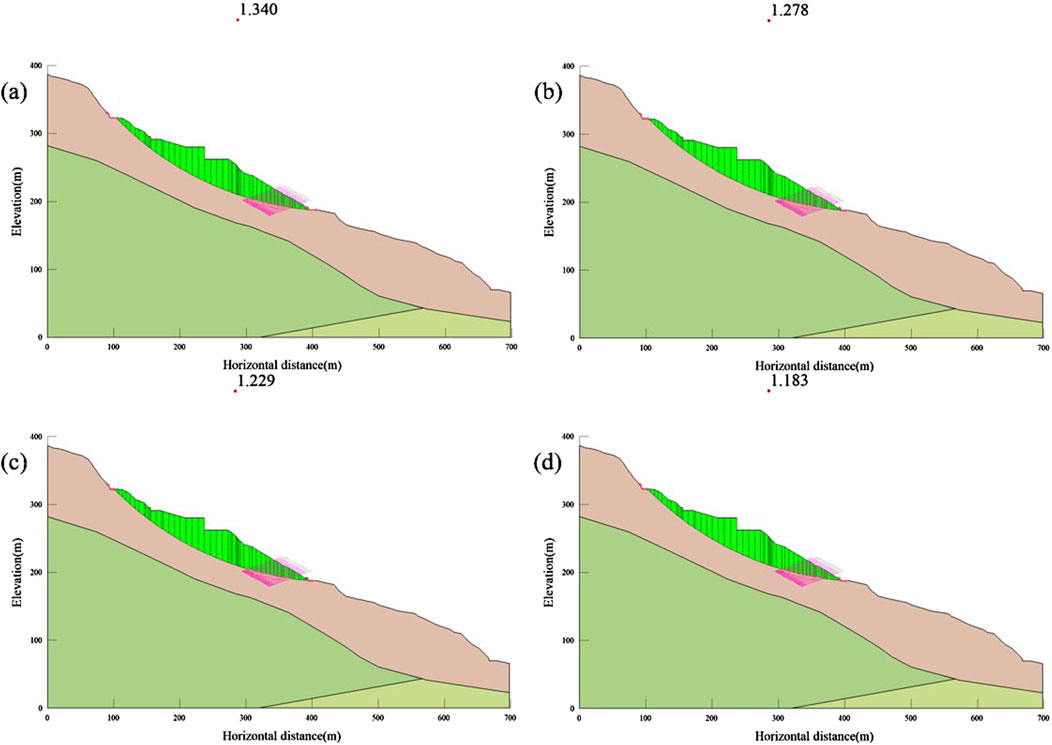
Figure 13. The impact of different anchor cable spacings on the safety factor. (a) 2.0 m (b) 2.5 m (c) 3.0 m (d) 4.0 m.
Figure 13 shows that changing the anchor cable spacing significantly affects landslide stability, with the safety factor decreasing as the spacing increases. When the anchor cable spacing is 2.0 m, the stability factor is 1.340, effectively enhancing slope stability. At 2.5 m, it is 1.278. At 3.0 m, it is 1.229. And at 4.0 m, it is 1.183. When the anchor cable spacing exceeds 2.5 m, the landslide remains stable as the spacing increases, but the overall stability improvement is minimal. Therefore, this project can adopt a spacing of 2.0 m, ensuring safety while considering economic factors.
Based on the analysis of anchor cable spacing and anchoring position, the comprehensive anchor support scheme for the landslide is as follows: the anchor length is 60 m, spacing is 2 m, anchoring angle is 20°, and anchoring position is in the middle to lower part of the landslide. After implementing the optimal anchor support scheme, the landslide’s stability factor is shown in Figure 12D. From Figure 12D, it can be seen that after adopting the optimal anchor support scheme, the safety factor of the slope is 1.745, greater than 1.15, indicating that the slope is in a stable state. Compared to the calculated result of 1.336 for the anti-landslide pile scheme, the anchor scheme is more effective in enhancing slope stability.
This study focuses on the landslide in Laoyingpan Village, Jinyang County, in Southwest China. Using Sentinel-1 radar data and the SBAS-InSAR method, the deformation characteristics of the Laoyingpan Village landslide were analyzed. Additionally, numerical simulation was used to assess the stability of the landslide under natural conditions and during heavy rainfall, as well as to study the stability of the strong deformation area under extreme rainfall conditions, analyzing the relationship between changes in landslide stability and the duration of rainfall. Based on the study of landslide stability under different support conditions, a comprehensive management plan suitable for this landslide is proposed, leading to the following conclusions.
(1) The Laoyingpan Village landslide has an average slope of 24°, encompassing a total area of approximately 3.8 × 10⁵ m2 and a volume of about 1.3 × 10⁷ m3. The landslide’s plane shape is characterized as “arm-chair” with the primary sliding direction oriented at approximately 106°. It can be divided into three areas with different landform and deformation characteristics.
(2) The main factors affecting the stability of the Laoyingpan Village landslide are road construction, slope cutting for housing, and rainfall. The central part of the left side of the landslide exhibits significant deformation, forming a severely deformed area, where shallow surface sliding and collapses occur. The failure mode of this area is translational, and it is in the creep deformation stage.
(3) Based on SBAS-InSAR time series analysis and Sentinel-1A satellite data, the surface deformation monitoring results in Jinyang County indicate a maximum average monthly subsidence rate of 25 mm/month, with three slopes exhibiting deformation rates exceeding 20 mm/month. These areas are primarily situated in the lower sections of the slope beneath the county town, with the most significant deformation observed in Laoyingpan Village, located on the northeast side of the town.
(4) The stability coefficient of the strong deformation area of the Laoyingpan Village landslide decreased from 1.160 to 0.871 under extreme rainfall (I = 33.4 mm/day, t = 96 h), transitioning from stable to unstable as rainfall duration increased. The stability coefficient of the Laoyingpan Village landslide decreased rapidly during the first 0–60 h due to rainwater infiltration and increased hydrostatic pressure, reducing soil stability. From 60–96 h, the coefficient stabilized as the landslide became fully submerged, indicating minimal additional impact from ongoing rainfall.
(5) Compared to before the implementation of measures, the use of anti-slide piles and anchor cable has improved the stability coefficient of the strong deformation zone. Research results on different anchor support parameters indicate that a spacing of 2.0 m, an anchoring angle of 20°, and positioning the anchor cable in the middle-lower section of the landslide yield the best support effect, with the stability coefficient of the strong deformation zone reaching 1.745. It is recommended for the Laoyingpan Village landslide to adopt a combination of anti-slide piles and anchor cable or multi-location anchor support for landslide treatment.
This study only considers the impact of rainfall on the Laoyingpan Village landslide, without taking into account other factors such as excavation or earthquakes. Additionally, the rainfall intensity set in this study may differ from the actual rainfall intensity. This results in certain limitations of the study. Therefore, we suggest that future research could attempt to combine other monitoring technologies (such as geological radar, UAV remote sensing, etc.) to complement and verify the current InSAR and numerical simulation methods. Further studies should focus on the stability of different types of landslide areas and consider more external factors, such as excavation, groundwater changes, earthquakes, etc. Future research could also incorporate long-term meteorological data and more field observations to further improve the understanding of the stability evolution of landslide areas.
The original contributions presented in the study are included in the article/supplementary material, further inquiries can be directed to the corresponding author.
YZ: Data curation, Formal Analysis, Investigation, Writing–original draft. YH: Methodology, Validation, Writing–original draft. XZ: Methodology, Validation, Writing–review and editing. YY: Conceptualization, Formal Analysis, Investigation, Writing–review and editing. HG: Formal Analysis, Methodology, Writing–review and editing. MG: Formal Analysis, Validation, Writing–review and editing.
The author(s) declare that financial support was received for the research and/or publication of this article. This work was supported by the Open Project of State Key Laboratory of Performance Monitoring and Protecting of Rail Transit Infrastructure, East China Jiaotong University (No. HJGZ2022104), the Opening Foundation of Key Laboratory of Landslide Risk Early-warning and Control, Ministry of Emergency Management (No. KLLREC 2022K003), the State Key Laboratory of Geohazard Prevention and Geoenvironment Protection Independent Research Project (No. SKLGP 2022Z008) and the Opening Foundation of Key Laboratory of Landslide Risk Early-warning and Control, Ministry of Emergency Management (No. KLLREC 2022K003).
We would like to thank the fundings and all data providers mentioned above. We sincerely thank the reviewers and editors of the journal for providing helpful comments to improve the manuscript.
The authors declare that the research was conducted in the absence of any commercial or financial relationships that could be construed as a potential conflict of interest.
The author(s) declare that no Generative AI was used in the creation of this manuscript.
All claims expressed in this article are solely those of the authors and do not necessarily represent those of their affiliated organizations, or those of the publisher, the editors and the reviewers. Any product that may be evaluated in this article, or claim that may be made by its manufacturer, is not guaranteed or endorsed by the publisher.
Achache, J., Fruneau, B., and Delacourt, C. (1996). Applicability of SAR Interferometry for Monitoring of Landslides[J]. ers applications. 165–168.
Bamler, R., and Hartl, P. (1998). Synthetic aperture radar interferometry. Inverse Probl. 14, R1–R54. doi:10.1088/0266-5611/14/4/001
Berardino, P., Fornaro, G., Lanari, R., and Sansosti, E. (2002). A new algorithm for surface deformation monitoring based on small baseline differential SAR interferograms. IEEE Trans. Geosci. Remote Sens. 40, 2375–2383. doi:10.1109/tgrs.2002.803792
Bianchini, S., Pratesi, F., Nolesini, T., and Casagli, N. (2015). Building deformation assessment by means of persistent scatterer interferometry analysis on a landslide-affected area: the Volterra (Italy) case study. Remote Sens. 7, 4678–4701. doi:10.3390/rs70404678
Bishop, A. W., and Morgenstern, N. R. (1960). Stability coefficients for earth slopes. Geotechique 10, 129–153. doi:10.1680/geot.1960.10.4.129
Chen, L., Zeng, W., Wang, X., Ye, Y., Ge, Y., Gu, D., et al. (2024). A three-dimensional DEM method for trajectory simulations of rockfall under irregular-shaped slope surface and rock blocks. J. Earth Sci. 35 (1), 306–312. doi:10.1007/s12583-023-1959-3
Cheng, S., Zhang, M., Zhang, X., Wu, B., Chen, Z., Lei, Z., et al. (2022). Numerical study of hydraulic fracturing near a wellbore using dual boundary element method. Int. J. Solids & Struct. 239-240, 111479. doi:10.1016/j.ijsolstr.2022.111479
Dai, C., Li, W., Wang, D., Lu, H., Xu, Q., Jian, J., et al. (2021). Active landslide detection based on sentinel-1 data and InSAR technology in zhouqu county, gansu Province, northwest China. J. Earth Sci. 32, 1092–1103. doi:10.1007/s12583-020-1380-0
Fang, K., Jia, S. X., Tang, H. M., Zhou, R. Z., Kong, Z., Fu, Y. L., et al. (2024). Arching effect in slopes under excavation: classification and features. Eng. Geol. 337, 107563. doi:10.1016/j.enggeo.2024.107563
Fang, K., Tang, H. M., Li, C. D., Su, X. X., An, P. J., and Sun, S. X. (2022). Centrifuge modelling of landslides and landslide hazard mitigation: a review. Geosci. Front. 14 (1), 101493. doi:10.1016/j.gsf.2022.101493
Ferretti, A., Prati, C., and Rocca, F. (2000). Nonlinear subsidence rate estimation using permanent scatterers in differential SAR interferometry. IEEE Trans. Geosci. Remote Sens. 38, 2202–2212. doi:10.1109/36.868878
Gabriel, A. K., Goldstein, R. M., and Zebker, H. A. (1989). Mapping small elevation changes over large areas: differential radar interferometry. J. Geophys. Res. Atmos. 94, 9183–9191. doi:10.1029/jb094ib07p09183
Hamdi, L., Defaflia, N., Fehdi, C., and Merghadi, A. (2020). “InSAR investigation on DRAA-douamis sinkholes in cheria northeastern of Algeria,” in Igarss 2020 - 2020 IEEE international geoscience and remote sensing symposium. Waikoloa, HI, USA, 1034–1037.
Hamdi, L., Defaflia, N., Merghadi, A., Fehdi, C., Yunus, A. P., Dou, J., et al. (2023). Ground surface deformation analysis integrating InSAR and GPS data in the karstic terrain of cheria basin, Algeria. Remote Sens. 15, 1486. doi:10.3390/rs15061486
Hu, F., Lei, J., Chang, L., Wu, J., and Hanssen, R. (2019). Monitoring deformation along railway systems combining multi-temporal InSAR and LiDAR data. Remote Sens. 11, 2298. doi:10.3390/rs11192298
Huntley, D., Bobrowsky, P., Charbonneau, F., Journault, J., Macciotta, R., and Hendry, M. (2017). Innovative Landslide Change Detection Monitoring: Application of Space-borne InSAR Techniques in the Thompson River Valley, British Columbia, Canada. Workshop on World Landslide Forum. Springer, Cham. 219–229.
Janbu, N. (1973). Slope stability computations. Embankment Dam Eng., 47–86. doi:10.1016/0148-9062(75)90139-4
Jiao, Y., Wang, Z., Wang, X., Adoko, A. C., and Yang, Z. (2013). Stability assessment of an ancient landslide crossed by two coal mine tunnels Engineering Geology, 159, 36–44.
Kang, Y., Zhao, C., Zhang, Q., Lu, Z., and Li, B. (2017). Application of InSAR techniques to an analysis of the guanling landslide. Remote Sens. 9, 1046. doi:10.3390/rs9101046
Li, G. H., Hu, Z. H., Wang, D., Wang, L. G., Wang, Y. T., Zhao, L. C., et al. (2024). Instability mechanisms of slope in open-pit coal mines: from physical and numerical modeling. Int. J. Min. Sci. Technol. 34 (11), 1509–1528. doi:10.1016/j.ijmst.2024.10.003
Li, X. (2007). Finite element analysis of slope stability using a nonlinear failure criterion. Comput. Geotechnics 34 (3), 127–136. doi:10.1016/j.compgeo.2006.11.005
Massonnet, D., Rossi, M., Carmona, C., Adragna, F., Peltzer, G., Feigl, K., et al. (1993). The displacement field of the Landers earthquake mapped by radar interferometry. Nature 364 (6433), 138–142. doi:10.1038/364138a0
Mi, H., and Chen, Z. (2003). Application of Genetic algorithm in determining the minimum safety factor of slope stability. Chin. J. Geotechnical Eng. 6, 671–675.
Mora, O., Lanari, R., Mallorqui, J. J., Berardino, P., and Sansosti, E. (2002). “A new algorithm for monitoring localized deformation phenomena based on small baseline differential SAR interferograms,” in IEEE international geoscience and remote sensing symposium (IEEE), 1237–1239.
O’Connor, W., Mider, G., Lawrence, J. A., Agar, S., Mason, P. J., Ghail, R., et al. (2021). An investigation into ground movement on the ventnor landslide complex, UK using persistent scatterer interferometry. Remote Sens. 13, 3711. doi:10.3390/rs13183711
Rosen, P. A., Hensley, S., Joughin, I. R., Li, F. K., and Goldstein, R. M. (2000). Synthetic aperture radar interferometry-invited paper. física de la tierra. 88, 333–382.
Rosen, P., Hensley, S., Joughin, I., Li, F., Madsen, S., Rodriguez, E., et al. (2018). The new landslide inventory of Tuscany (Italy) updated with PS-InSAR: geomorphological features and landslide distribution. Landslides 15, 5–19. doi:10.1007/s10346-017-0861-4
Rosen, P. A., Hensley, S., Joughin, I. R., Li, F., Madsen, S., Rodriguez, E., et al. (2002). Synthetic aperture radar interferometry. Proc. Ieee. 88, 333–382. doi:10.1109/5.838084
Usai, S. (2001). A new approach for longterm monitoring of deformations by differential SAR interferometry.
Vanicek, P., Castle, R. O., and Balazs, E. I. (1980). Geodetic leveling and its applications. Rev. Geophys. 18, 505–524. doi:10.1029/rg018i002p00505
Wang, H., Xu, W., and Xu, R. (2005). Slope stability evaluation using back propagation neural networks. Eng. Geol. 80 (4), 302–315. doi:10.1016/j.enggeo.2005.06.005
Wang, X., Fan, X., Yang, F., and Dong, X. (2020). Remote sensing interpretation method of geological hazards in lush mountainous area. Geomat. Inf. Sci. Wuhan. Univ. 45, 1771–1781.
Wang, X., Yin, J., Luo, M., Ren, H., Li, J., Wang, L., et al. (2023). Active high-locality landslides in mao county: early identification and deformational rules. J. Earth Sci. 34, 1596–1615. doi:10.1007/s12583-021-1505-0
Williams, S., Bock, Y., and Fang, P. (1998). Integrated satellite interferometry: tropospheric noise, GPS estimates and implications for interferometric synthetic aperture radar products. J. Geophys. Res. Solid Earth. 103, 27051–27067. doi:10.1029/98jb02794
Wu, T., Jia, J., Jiang, N., Zhou, C., Luo, X., and Xia, Y. (2020). Model test of deformation evolution and multi factor prediction of anchorage slope stability under rainfall condition. J. Earth Sci. 31, 1109–1120. doi:10.1007/s12583-020-1343-5
Xu, X., Xing, Y., Guo, Z., and Huang, Y. (2021). Stability analysis of rainfall-triggered toe-cut slopes and effectiveness evaluation of pile-anchor structures. J. Earth Sci. 32, 1104–1112. doi:10.1007/s12583-021-1474-3
Yan, Y., Guo, C., Zhang, Y., Qiu, Z., Li, C., and Li, X. (2024). Development and deformation characteristics of large ancient landslides in the intensely hazardous xiongba-sela section of the Jinsha River, eastern Tibetan plateau, China. J. Earth Sci. 35, 980–997. doi:10.1007/s12583-023-1925-y
Ye, X., Kaufmann, H., and Guo, X. (2004). Landslide monitoring in the three gorges area using D-InSAR and corner reflectors. Photogramm. Eng. Remote Sens. 70, 1167–1172. doi:10.14358/pers.70.10.1167
Zhang, Q., Li, Y., Zhang, J., and Luo, Y. (2019). InSAR technique applied to the monitoring of the Qinghai-Tibet Railway. Nat. Hazards Earth Syst. Sci. 19, 2229–2240. doi:10.5194/nhess-19-2229-2019
Zhang, R., Zhang, L., Fang, Z., Oguchi, T., Merghadi, A., Fu, Z., et al. (2024). Interferometric synthetic aperture radar (InSAR)-Based absence sampling for machine-learning-based landslide susceptibility mapping: the three gorges reservoir area, China. Remote Sens. 16, 2394. doi:10.3390/rs16132394
Zhang, Y., Yu, J., Bu, F., and Gao, L. (2017). Application of GF-2 satellite to geological hazard interpretation in loess plateau. Geomat. Spat. Inf. Technol. 40, 31–38.
Zhang, Y., Zhang, Q., Duan, K., Yu, G., and Jiao, Y. (2020). Reliability analysis of deep underground research laboratory in Beishan for geological disposal of high-level radioactive waste. Comput. Geotechnics 118, 103328. doi:10.1016/j.compgeo.2019.103328
Keywords: landslide, deformation analysis, SBAS-InSAR, stability, rainfall, support measures
Citation: Zhang Y, Hu Y, Zheng X, Yu Y, Guo H and Gao M (2025) Analysis of deformation and stability characteristics of a landslide in Southwest China under different rainfall and support conditions. Front. Earth Sci. 13:1549911. doi: 10.3389/feart.2025.1549911
Received: 22 December 2024; Accepted: 11 March 2025;
Published: 28 March 2025.
Edited by:
Yu Zhuang, WSL Institute for Snow and Avalanche Research SLF, SwitzerlandReviewed by:
Kun Fang, Hong Kong University of Science and Technology, Hong Kong SAR, ChinaCopyright © 2025 Zhang, Hu, Zheng, Yu, Guo and Gao. This is an open-access article distributed under the terms of the Creative Commons Attribution License (CC BY). The use, distribution or reproduction in other forums is permitted, provided the original author(s) and the copyright owner(s) are credited and that the original publication in this journal is cited, in accordance with accepted academic practice. No use, distribution or reproduction is permitted which does not comply with these terms.
*Correspondence: Yitao Hu, aHV5aXRhb0BzdHUuY2R1dC5lZHUuY24=
Disclaimer: All claims expressed in this article are solely those of the authors and do not necessarily represent those of their affiliated organizations, or those of the publisher, the editors and the reviewers. Any product that may be evaluated in this article or claim that may be made by its manufacturer is not guaranteed or endorsed by the publisher.
Research integrity at Frontiers
Learn more about the work of our research integrity team to safeguard the quality of each article we publish.