
94% of researchers rate our articles as excellent or good
Learn more about the work of our research integrity team to safeguard the quality of each article we publish.
Find out more
ORIGINAL RESEARCH article
Front. Earth Sci., 01 April 2025
Sec. Atmospheric Science
Volume 13 - 2025 | https://doi.org/10.3389/feart.2025.1549385
 Thaís Andrade da Silva1*
 Izabel Da Silva Andrade1,2*
 Elaine Cristina Araújo1*Thaís Corrêa1,2
 Alex Carlos Pellegrinetti Mendes1
 Flávia Noronha Dutra Ribeiro3
 Maria de Fátima Andrade4
 Eduardo Landulfo1
This study uses in situ measurements, satellite data, and modeling techniques to investigate methane (CH4) emissions from the Caieiras landfill in São Paulo, Brazil. Methane is the second most significant greenhouse gas due to its high heating potential. Previous studies have shown that landfills can be considered the super-emitters of methane. Quantifying its emissions is essential to comprehending the emissions patterns of this emitter, promoting an improvement in data from inventories. Multiple platforms were used to obtain the data and better characterize the landfill. Satellite data from TROPOMI and EMIT were analyzed during the present study to characterize emission feathers. The results showed consistent emissions over 4 years, as shown by the inversions obtained using TROPOMI data. EMIT could identify one plume originating in the landfill dispersed over the city’s populated area. The in situ data were acquired near the Caieiras landfill using a greenhouse gas analyzer with integrated off-axis cavity output spectroscopy (OA-ICOS), a high-precision method to measure gases in the atmosphere. Three campaigns were conducted in 2023 on February 14, July 6, and November 22. The results obtained in all three campaigns showed median concentration values above 2 ppm, reaching values close to 35 ppm. These data were integrated into the AERMOD dispersion model, combined with meteorological data, and estimated methane emission rates, revealing variability of concentrations, where emission rates were 12,974.4 kg/h, 11,284.92 kg/h and 23,472 kg/h, respectively, for 3 days of sampling. The integrated approach in this study promotes valuable insights into landfill emissions and emphasizes targeted strategies for mitigating greenhouse gases. Results support the elaboration of policies to enhance waste management and reduce the climate impact produced by waste.
Methane (CH4) is a potent greenhouse gas that absorbs infrared radiation in the range of 760 nm to 1 mm. Its global warming potential is roughly 28 times greater than carbon dioxide (CO2) over 100 years (NASA-LP DAAC, 2024; Barolet et al., 2016; Dlugokencky and Houweling, 2015; Mønster et al., 2019; SEEG, 2022). Due to its significant impact on the greenhouse effect, comprehending methane’s atmospheric behavior and implications is essential for developing effective climate change mitigation strategies.
Biogenic methane is produced through microbial (anaerobic decomposition), thermogenic (high pressure and temperature), pyrogenic (incomplete combustion), and photolytic (UV radiation on carbohydrate polymers) pathways (Barolet et al., 2016). Among them, microbial anaerobic decomposition is the most important and the core of methane circulation.
The methane cycle is a biogeochemical process that involves both natural and anthropogenic sources of methane production and consumption. Methane is primarily generated through the anaerobic decomposition of organic matter by methanogenic archaea in environments such as wetlands, rice paddies, and the digestive tracts of ruminants. It is also emitted from geological sources, including natural gas deposits and hydrates. Once released into the atmosphere, methane acts as a potent greenhouse gas, significantly contributing to global warming (Schlesinger and Bernhardt, 2020; Kirschke et al., 2013; Seinfeld and Pandis, 2016; Guenther et al., 1995).
Another relevant aspect is the formation of Volatile Organic Compounds (VOCs) during the oxidation cycle of methane (CH4) is a chemical and biochemical phenomenon of significant environmental relevance. In the atmosphere, the oxidation of methane is primarily catalyzed by hydroxyl radicals (OH), generating reactive intermediates such as methanol (CH3OH) and formaldehyde (HCHO), which subsequently participate in photochemical reactions, contributing to the formation of tropospheric ozone (O3) and secondary aerosols. In biological systems, methanotrophic microorganisms oxidize methane via enzymes, producing VOCs as secondary metabolites. These processes, both abiotic and biotic, have significant implications for atmospheric chemistry, air quality, and the global radiative balance. Human activities, such as fossil fuel extraction, livestock farming, and waste management, have substantially altered the natural methane cycle, leading to increased atmospheric concentrations and associated climatic impacts (Schlesinger and Bernhardt, 2020; Seinfeld and Pandis, 2016; Guenther et al., 1995).
Related to anthropogenic activities are the methane super emitters are sources emitting over 3,000 kg/h of (CH4), significantly exceeding average emissions. These hotspots, particularly evident in landfills, have been identified via satellite observations by Zavala-Araiza et al. (2021). In situ monitoring and modeling have further clarified landfill emissions, emphasizing their variability (Maasakkers et al., 2022). In Brazil, methane emissions predominantly originate from agriculture (72%), followed by waste (16%), land use change (9%), and energy and industry sectors (3%) (Mønster et al., 2019).
Landfills are final disposal sites for inorganic and partially biodegraded organic waste (Olaguer et al., 2022; Borba, 2022). Methane production in landfills primarily results from microbial decomposition of solid waste (Barolet et al., 2016; Zavala-Araiza et al., 2021).
Under oxygen-deprived conditions, methanogenic microorganisms degrade organic compounds, converting them into biogas, a gaseous mixture primarily composed of methane (50%–70%) and carbon dioxide (50%–30%), with up to 5% of other gases (NH3, H2S, O2, CO, N2). Methane production is influenced by factors such as waste composition, moisture, temperature, and pH of the environment. It is estimated that landfills and dumps are responsible for approximately 11% of global methane emissions. In sanitary landfills, where operational control is implemented, methane production can be monitored and optimized, allowing for its capture and energy utilization, which can significantly reduce emissions. In contrast, in dumps, the lack of proper management results in uncontrolled methane production, which is directly released into the atmosphere, contributing to the exacerbation of the greenhouse effect (Candiani and Viana, 2017; IPCC, 2021).
Another methane source is the fugitive emissions, that refer to the unintentional release of methane gas into the atmosphere during the extraction, production, and transportation of fossil fuels, such as natural gas, oil, and coal. These emissions often occur due to leaks, venting, or flaring in infrastructure such as pipelines, wells, and storage facilities. Reducing fugitive methane emissions is crucial for mitigating climate change, as it can quickly slow global warming. Key strategies include detecting and repairing leaks, leveraging advanced technology, and enforcing stricter regulations to promote a sustainable energy sector (Alvarez et al., 2018; Lyon, 2016).
Biogas can generate energy in thermoelectric plants, reducing greenhouse gas emissions by preventing methane from being released directly into the atmosphere. Without such facilities, biogas is burned in flares, converting methane to CO2 and water vapor, both contributing to the greenhouse effect. However, gas capture systems are not fully efficient, and part of the methane is still emitted (Reichert, 2007; Borba, 2022; Candiani, 2022).
Methane sinks involve processes that reduce atmospheric methane, primarily through oxidation by hydroxyl radicals (OH) in the troposphere, as described in Equation 1. Increased methane concentrations deplete OH, ultimately converting most methane into carbon dioxide (CO2) (Barolet et al., 2016; Borba, 2022; Reichert, 2007). Conversely, Landfills act as both sources and sinks of methane, as biogas generated from waste can be captured and managed.
The Metropolitan Area of São Paulo (MASP), recognized as the largest urban agglomeration in Latin America, is comprised of the state capital along with 38 additional municipalities. Within this metropolitan region, only 10 municipalities operate landfills. The most significant of these landfills is situated in Caieiras, which encompasses an area of 97,642 km2 and serves as the waste disposal site for at least 11 municipalities, rendering it the largest landfill in terms of both physical size and waste intake, being classified as an exceptional size landfill IX (Barbosa, 2019; Cunha, 2019). The Caieiras landfill, operating since 2002, spans approximately 350 ha and processes an estimated 9,600 tons of waste daily (Candiani and Viana, 2017). Although the landfill is located along Bandeirantes Highway—a major route connecting key import/export hubs and linking the Metropolitan Regions of São Paulo and Campinas—it remains the largest source of methane emissions in the region. Methane recovery at the Caieiras landfill involves a network of pipes with vertical drains that capture biogas and transport it to a purification plant, which separates CH4 from other gases (Candiani, 2022). Figure 1 represents the Metropolitan Area of São Paulo and the city of Caieiras.
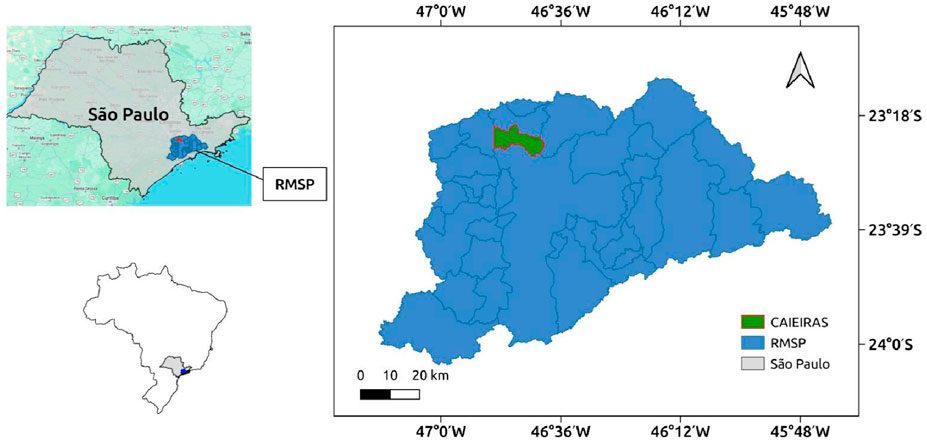
Figure 1. Location of the city of Caieiras, and the Metropolitan Area of São Paulo (MASP) in the state of São Paulo.
In this study, measurements of methane concentration were conducted at several locations near to the Caieiras landfill, including the tourist site Mirante do Cristo, the João Batista Spera Street, and the landfill’s reception area. The Caieiras landfill is situated at latitude 23°20′43.67″S and longitude 46°46′21.48″W. Meanwhile, the Mirante do Cristo can be found at coordinates 23°21′14.73″S (latitude) and 46°45′52.22″W (longitude). Rua João Batista Spera has a latitude of 23°21′0.5″S and a longitude of 46°45′52.09″W. Additionally, the Reception features two registered locations: the first with coordinates 23°20′57.58″S (latitude) and 46°46′45.12″W (longitude), and the second at 23°20′57.45″S (latitude) and 46°46′39.85″W (longitude). These locations are portrayed in Figure 2.

Figure 2. Location of the Mirante do Cristo, the reception of the landfill of Caieiras and a nearby street where the measurements were carried out.
To enhance the assessment of methane emissions from landfills, a methodology was developed to estimate emission rates using in situ concentration measurements collected directly from landfill sites. This approach enables real-time data gathering, thereby improving the accuracy of emission estimates. A critical element of this methodology is the application of an inverse modeling technique.
In situ data collection utilized a greenhouse gas analyzer employing OA-ICOS technology, which features a high-precision optical cavity to extend the optical path length. This enhancement facilitates improved light-gas interactions and optimizes the signal-to-noise ratio for sensitive trace gas assessments. The system’s robustness is augmented by off-axis laser positioning. The primary methodology evaluates transmitted light intensity, while light decay time serves to calibrate mirror reflectivity (ABB Inc, 2024; He et al., 2021).
AERMOD, as endorsed by the U.S. EPA, estimates methane emissions grounded in situ measurements. AERMAP processes topographical data, whereas AERMET integrates ERA5 meteorological data (U.S. EPA, 2018; Matacchiera et al., 2019; ECMWF, 2024). AERMOD simulates pollutant dispersion through a Gaussian distribution, and AERPLOT generates. KMZ files for the visualization of pollutant plumes (Cimorelli et al., 2004; U.S. EPA, 2024a; U.S. EPA, 2024b).
The method entails a systematic process of multiple iterations where simulated concentration profiles generated by the AERMOD system are compared and aligned with actual measurements obtained from a greenhouse gas analyzer. By continuously refining the simulation parameters based on these comparisons, the iterative process significantly increases the precision of the emission rate estimates.
Consequently, this detailed and methodical approach not only strengthens the reliability of methane emissions assessments but also offers valuable insights into the sources and behavior of landfill gas emissions. This, in turn, facilitates more effective management and mitigation strategies for greenhouse gases in the environment.
The Integrated Methane Inversions (IMI) uses the inversion of methane observations from TROPOMI with the GEOS-Chem model to efficiently infer methane emissions in a cloud-based environment. Model
The EMIT (Earth Surface Mineral Dust Source Investigation) instrument uses imaging spectroscopy to measure the absorption characteristics of greenhouse gases such as methane (CH4), in short-wave infrared bands. Installed on the International Space Station (ISS), EMIT measures in sun-lit regions between 52°N and 52°S latitude. The collected data allows us to identify and quantify the point emissions of these gases, using a two-stage methodology: first, an estimate of the total increase in column in parts per million m (ppm m) is generated based on an adapted filter, provided in the products for CH4. Then, highly reliable individual plumes are identified and validated by experts, resulting in products that offer geo-referenced data in an optimized format for the cloud (NASA-LP DAAC, 2024). This methodology allows for the accurate characterization of point sources and includes critical information to monitor greenhouse gases.
According to SEEG (2024), this area is recognized as a methane removal zone due to its landfill operations, which utilize biogas for energy generation. However, this process can fail and generate fugitive emissions. Varon et al. (2022) used IMI to quantify methane emissions in the Permian basin; we applied this method to the Metropolitan Region of São Paulo. Data from the IMI technique paint a more complex picture of methane emission in the landfill area. The inversion suggests that the Caieiras region has a positive methane emission rate. IMI uses different databases for the prior and posterior emissions.
Prior emissions are calculated using data from global inventories, which consider anthropogenic and natural sources. As shown in (Figures 3a–d) during the 4 years that we obtained the inversions for the Metropolitan Region of São Paulo, it is noticeable that the Caieiras region has had consistent emissions over the years. The Caieiras landfill is the green dot at the top left of Figures 3a–d and 4a–d.
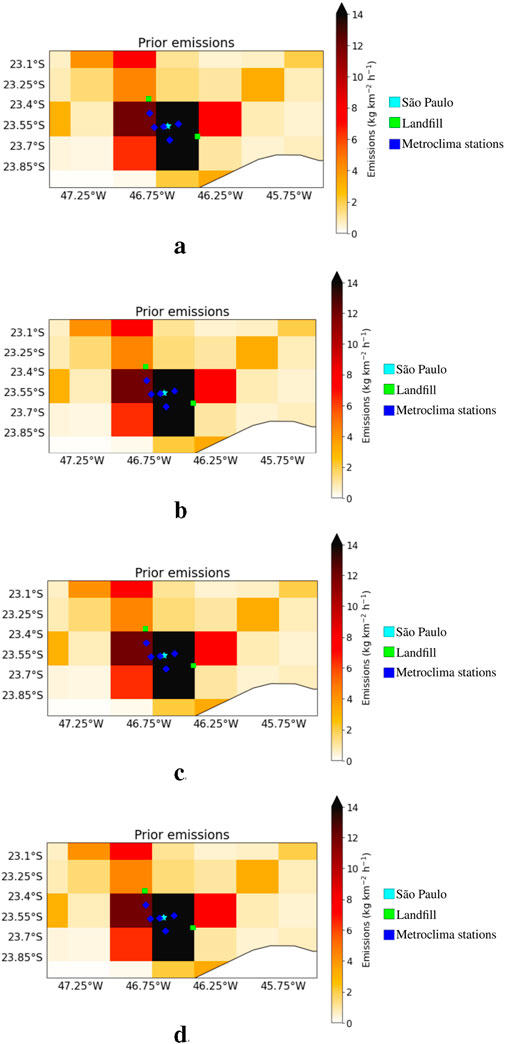
Figure 3. Prior methane emissions over the years. (a) Emissions in 2019. (b) Emissions in 2020. (c) Emissions in 2021. (d) Emissions in 2022.
Unlike prior emissions, posterior emissions are calculated using measured data; TROPOMI data was used in this case. The emissions estimated by the observed data had a similar pattern to that presented by the prior emissions, with the same consistency throughout the years, as shown in Figures 4a–d).
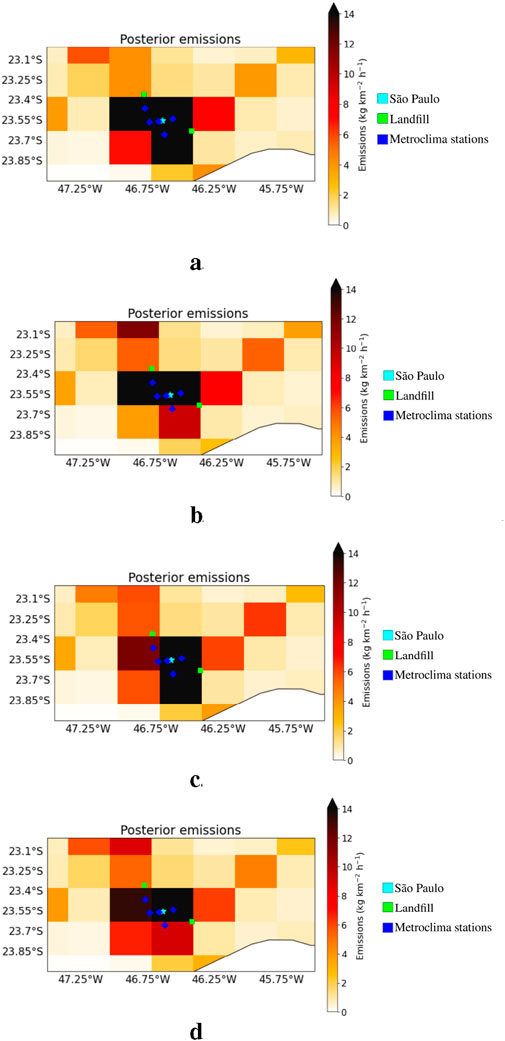
Figure 4. Posterior methane emissions over the years. (a) Emissions in 2019. (b) Emissions in 2020. (c) Emissions in 2021. (d) Emissions in 2022.
The EMIT instrument, installed on the International Space Station (ISS), provides data for monitoring greenhouse gases at regional and global scales. When analyzing the 2023 data, it was found that no information was available for the periods corresponding to the campaigns carried out in situ (February, July, and November of 2023). As an example, we present the data obtained on 4 May 2023 (Figure 5), which shows a methane plume (CH4) detected by the EMIT instrument. The values are expressed in ppm m (parts per million × meter), and the figure highlights the landfill of Caieiras, which is the focus of this study. In the plume region, it is observed that, near the landfill, there are local peaks of methane concentration, suggesting that this area may be a significant source of emissions.
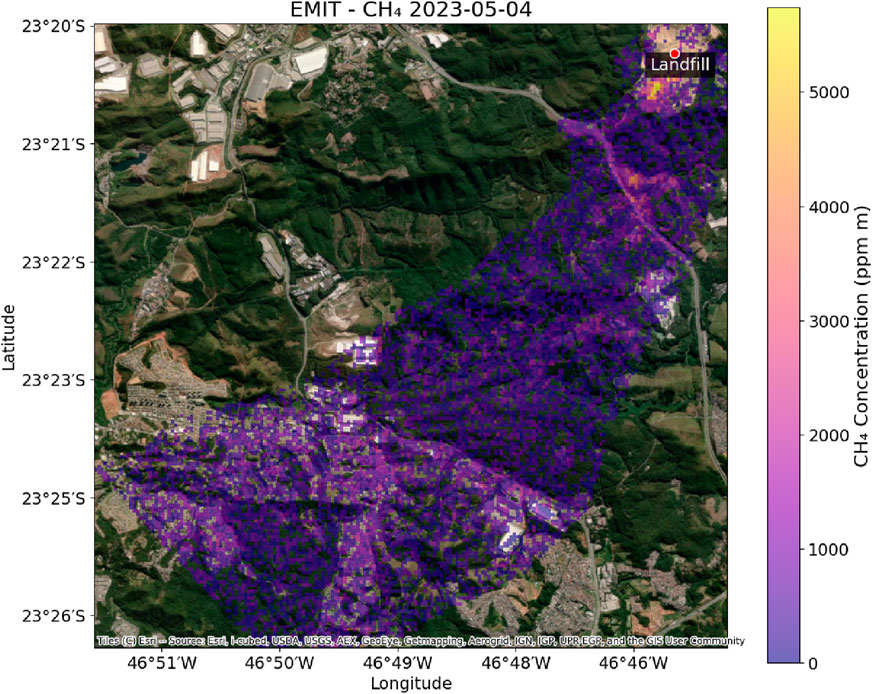
Figure 5. Methane (CH4) concentration (ppm m) detected by the EMIT instrument on 4 May 2023.
At Point one (Figure 6a), the average concentration of methane was observed to exceed 5 ppm. In contrast, at Point two (Figure 6b), methane concentrations increased to 13.34 ppm. This notable rise in concentration, despite the proximity of the two sampling points, can likely be attributed to the loss of linearity in accordance with the Beer-Lambert law at elevated concentrations near the source. In such conditions, the phenomenon of light scattering may restrict the extent of maximum absorption, thereby impacting the accuracy of concentration measurements (Candiani and Silva, 2011).
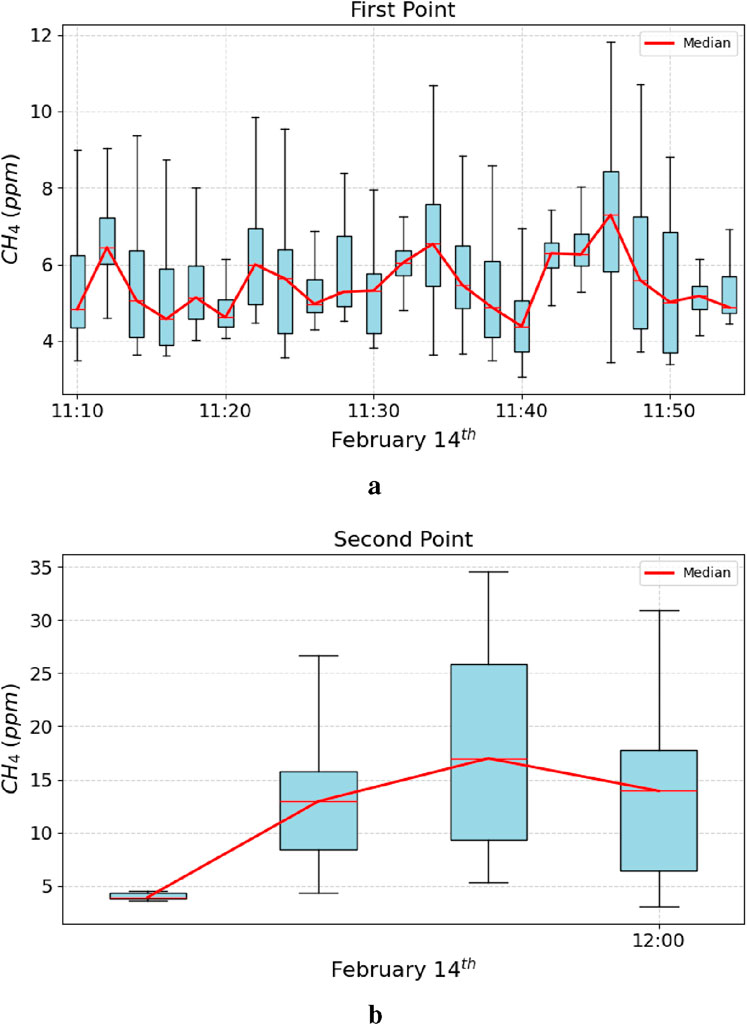
Figure 6. Boxplot of methane (CH4) concentrations, in ppm, for 2-min intervals on February 14, with the median highlighted in red. (a) Recorded at the First Point near the landfill. (b) Recorded at the Second Point near the landfill.
Table 1 presents the statistical data derived from the campaign conducted on 14 February 2023, across various measurement intervals. The metrics reported include the mean, standard deviation, median, and maximum values for each measurement. Notably, the measurement at Point two exhibits a higher standard deviation, indicative of greater variability in concentration levels recorded at this location. This increased variability suggests a more heterogeneous distribution of the measured parameter at Point two compared to other measurement points.
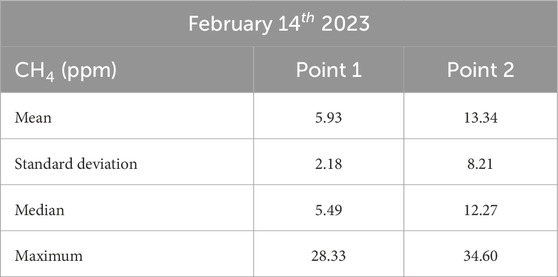
Table 1. Statistical data from the measurement on February
During the period of July 6, measurements taken in proximity to the reception area indicated an average methane concentration of approximately 35 parts per million (ppm) (see Figure 7a). In contrast, at the Mirante do Cristo location, the average methane concentration was recorded at 4.0 ppm (refer to Figure 7b).
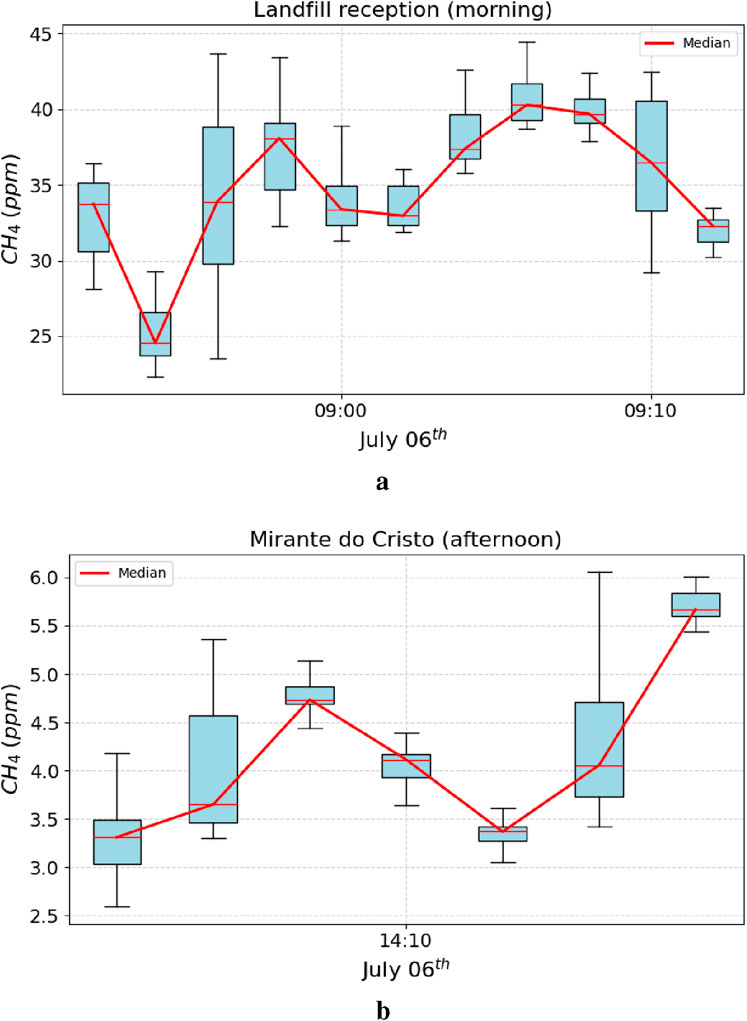
Figure 7. Boxplot of methane (CH4) concentrations, in ppm, for 2-min intervals on July 06, with the median highlighted in red. (a) Recorded at the landfill reception. (b) Recorded at Mirante do Cristo.
Table 2 presents the statistical data for 6 July 2023. A comparative analysis indicates that the standard deviation for the first measurement on this date was significantly lower than that recorded on February 14. This discrepancy can be attributed to a reduced data range, defined as the difference between the maximum and minimum values observed. Notably, at Mirante do Cristo, the standard deviation on July 6 exhibited a pronounced decline, owing to both lower concentration levels and diminished data amplitude.
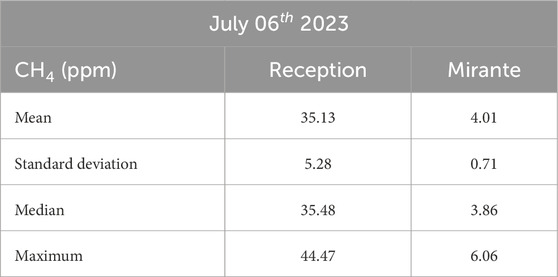
Table 2. Statistical data from the measurement on July
At Mirante do Cristo (Figure 8a), methane concentrations were mostly at expected background levels but later it increased. The average peak concentration was 3.7 ppm, with some values exceeding 6 ppm, around 10:00 and 10:10. Between these peaks, the concentration briefly dips but does not return to the baseline until after 10:30. There are also smaller spikes noted around 09:50, with concentrations slightly over 3 ppm. João Batista Spera Street in Caieiras (Figure 8b), near the landfill, concentrations were unexpectedly high around 11:00, reaching approximately 5–7 ppm despite an overall average close to natural background levels (1.8–2 ppm), shortly after 11:05. The precise reason about the peak concentrations remains uncertain. It could imply an influence of atmospheric conditions, such as wind effects, or a sudden release of emissions. This ambiguity complicates our understanding of the factors contributing to observed concentration levels.
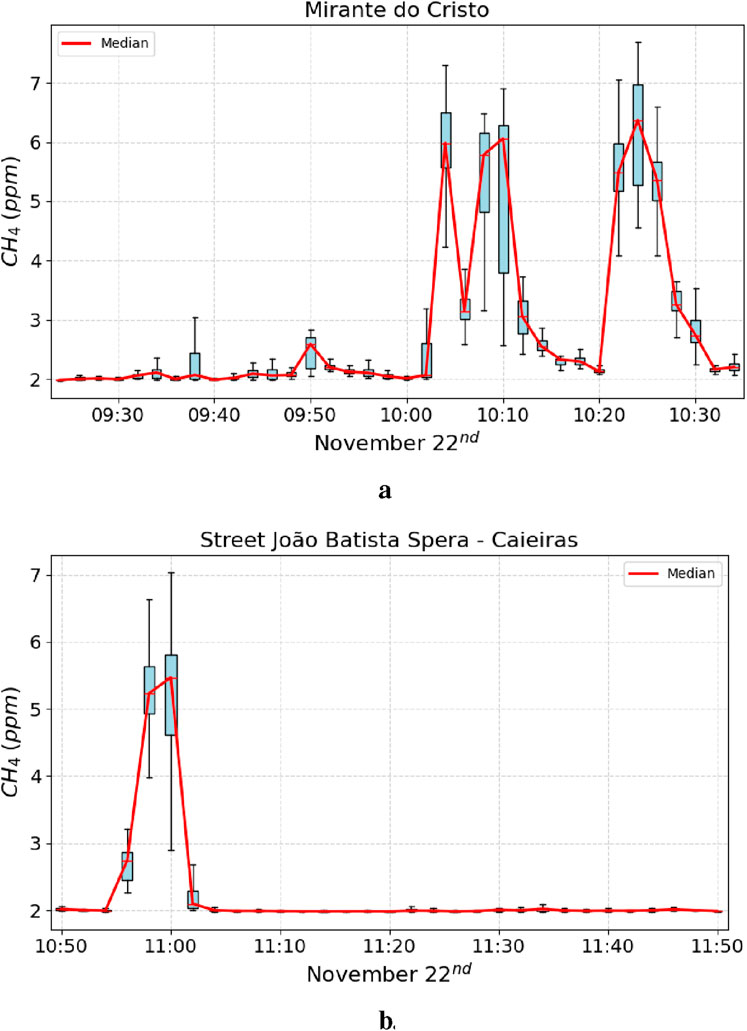
Figure 8. Boxplot of methane (CH4) concentrations, in ppm, for 2-min intervals on November 22, with the median highlighted in red. (a) Recorded at the landfill reception. (b) Recorded at Street João Batista Spera.
On 22 November 2023, a table presenting statistical data (Table 3) was compiled. The observed lower concentrations and diminished variability of the dataset resulted in standard deviations that were notably reduced compared to previously analyzed values.
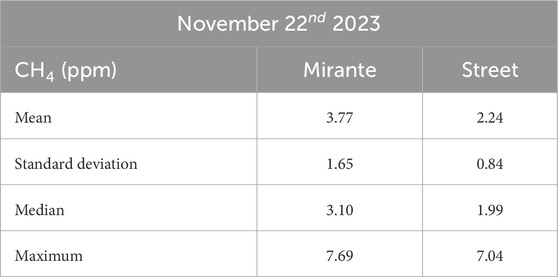
Table 3. Statistical data from the measurement on November
The estimation of emission rates using AERMOD was conducted by integrating hourly wind data sourced from ERA5, alongside fixed parameters that included a roughness coefficient of 0.01, an emission height of 3 m, and a rectangular landfill geometry measuring 1,000 b y 810 m. To enhance the accuracy of the model, the landfill was categorized as an area source type, which is well-supported by existing topographic data, as highlighted by Tartakovsky et al. (2013). Furthermore, daily emission rates were derived from previously recorded concentration levels measured at specific locations, including the landfill reception area. This methodological approach ensures a more precise assessment of emissions associated with the landfill.
In addition to the visual representations, AERPLOT produces a legend corresponding to each range of estimated values in micrograms per cubic meter (
By employing an inverse modeling approach, the emission parameters were progressively modified within the model structure until the estimated concentrations aligned with the measurements obtained from the greenhouse gas analyzer.
On February 14, a reference concentration of 5.5 ppm (denoted as x in white in Figure 9) was measured in proximity to the landfill reception area. Utilizing the AERMOD, the estimated emission rate was calculated to be equivalent to 12,974.4 kg/h. Figure 9 illustrates the output generated by AERPLOT from AERMOD results, depicting the methane plume associated with the modeled scenario, along with a legend detailing the concentration levels produced by the model.

Figure 9. Graphical representation of data obtained from AERPLOT, illustrating the reference concentration point (denoted by the white marker) along with the corresponding legend indicating concentration value ranges in parts per million (ppm), on 14 February 2023.
On July 6, detailed measurements were conducted in both the morning and afternoon to enhance the accuracy of the results. Consequently, it was essential to estimate the emission rates for these periods independently. In the morning session, the reference concentration utilized was the value measured at the landfill reception, which was found to be 35.5 ppm (indicated by the white marker in Figure 10). Following the application of the AERMOD modeling system, the estimated emission rate was determined to be 11,284.92 kg/h.
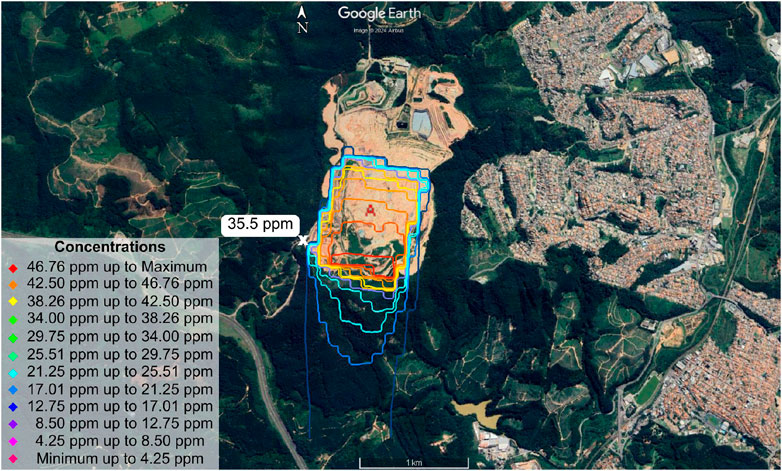
Figure 10. Graphical representation of data obtained from AERPLOT, illustrating the reference concentration point (denoted by the white marker at the landfill reception) along with the corresponding legend indicating concentration value ranges in parts per million (ppm), on 6 July 2023, in the morning.
During the afternoon measurement conducted at Mirante do Cristo, methane concentrations were 3.80 ppm (designated by the white marker in Figure 11). Based on these observations, the estimated emission rate was determined to be 2,271.6 kg/h. Consequently, it can be inferred that the emission rate on July 6 ranged between 2,271 kg/h and 11,285 kg/h.
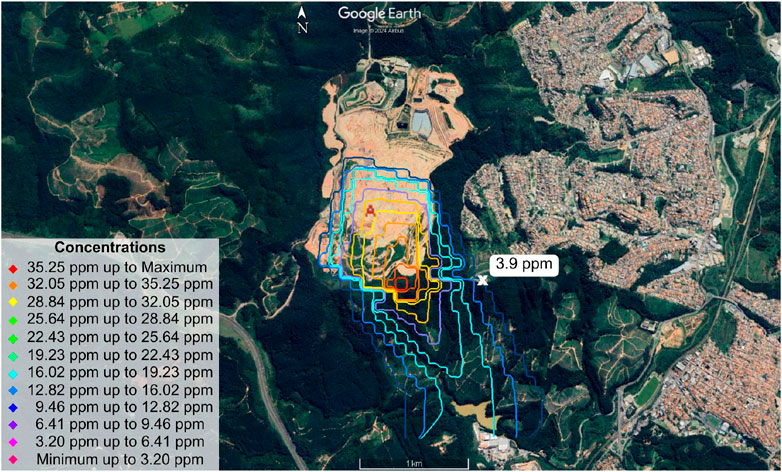
Figure 11. Graphical representation of data obtained from AERPLOT, illustrating the reference concentration point (denoted by the white marker at Mirante do Cristo) along with the corresponding legend indicating concentration value ranges in parts per million (ppm), on 6 July 2023, in the afternoon.
On November 22, the mean concentration measured was 3.17 ppm, denoted as by the white marker in Figure 12. This measurement was taken in close proximity to the landfill reception area, from which it was estimated an emission rate of 23,472 kg/h. These findings are consistent with estimates reported in the relevant literature.
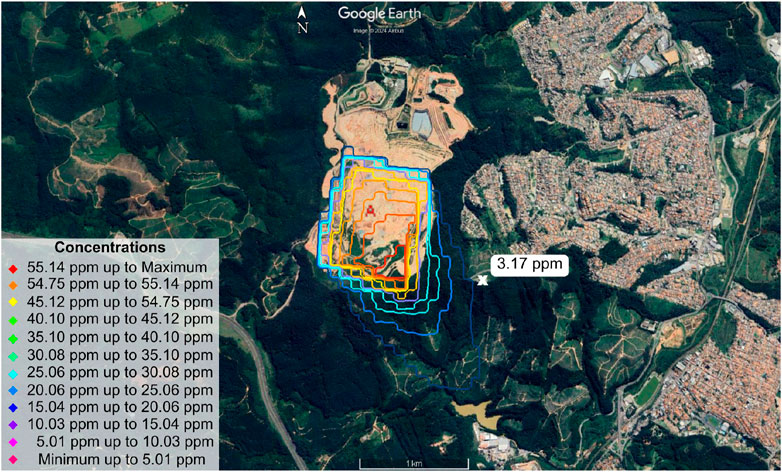
Figure 12. Graphical representation of data obtained from AERPLOT, illustrating the reference concentration point (denoted by the white marker) along with the corresponding legend indicating concentration value ranges in parts per million (ppm), on 22 November 2023.
Fugitive CH4 emissions from landfills are a significant challenge, even for those landfills that are equipped with biogas recovery. In fact, while biogas capture is among the most efficient practices to directly reduce emissions, some portions of methane might be released to the atmosphere due to problems in the collection system or variable conditions in waste compaction and degradation rates of organic matter (IPCC, 2019). Studies such as Bogner et al. (2008), Spokas et al. (2006), and Scheutz et al. (2009) showed that, in landfills, these emissions may take place diffusely making it difficult to accurately quantify them through traditional inventories.
TROPOMI and EMIT remote satellite measurements, complemented by atmospheric modeling, pointed out that part of the CH4 produced in the Caieiras landfill is not captured by combustion and energy recovery. Besides, the in situ measurements presented a general increase in the magnitude and variability of pollutant concentrations with a decrease in distance from the landfill. Methane inversion results contributed to the quantification of methane emissions in the region of the Caieiras landfill. Based on data from the TROPOMI Sentinel-5P, the inversion results indicate that this area has always contributed to methane emissions during the 4 years observed by the IMI. The plume detected by the EMIT platform in May 2023 reinforces evidence of emissions from the landfill and how the emission plume reaches the city. This finding is important to understand the extent and dispersion of methane emissions from landfills.
In situ measurements were conducted in May 2023 at locations under the emission plume detected by EMIT. In situ measurements have a high temporal resolution, per second, which allows for very detailed and precise analysis of methane fluctuations over time. The greatest concern regarding this study was the representativeness in the data in the AERMOD model, as most of the inputs were outdated, insufficiently proximate or instantaneous, or part of a larger dataset without comparison.
One of the main challenges of this research was to ensure the representativeness of the data in the AERMOD model, since many inputs were outdated, not close enough or instantaneous, or did not have a representative data set for comparison. The landfill topography used as input was modeled based on estimates from data available in 2010, since topographic information was not found in recent inventories or reports. As for the meteorological data, only the hourly reanalysis data could be used, while the data measured in situ would involve real-time data. In addition, information on the internal conditions of the landfill, such as source dimensions, was often approximated to meet established expectations.
Besides, the internal conditions of the landfill, such as source dimensions, were usually approximated to meet established expectations. Despite these limitations, the research significantly improves our understanding of how landfills contribute to methane emissions and provides insights into the spatial and temporal behavior of these emissions. The work’s strength comes from the inclusion of new data sources, including those derived from the TROPOMI and EMIT platforms in concert with high-resolution in situ measurements, enabling a differentiation that was not previously possible in the estimation of emission patterns and plume expansions.
In particular, this finding demonstrated that even with a biogas recovery system, landfills in Caieiras remained one of the hotspots regarding methane emissions within that region. Satellite measurements combined by TROPOMI and EMIT, atmospheric modeling and in situ data have allowed a fine analysis of dispersion of CH4 and the finding of possible fugitive emissions, putting into evidence the hypothesis that all the generated biogas might not be effectively captured.
Results like this bring great relevance and can serve as input and guide for future public policies and strategies of methane mitigation, contributing to the improvement of urban solid waste management and the reduction of the climate impact of landfills.
For future research, it is important that there should be involvement of the management and administrative group of the landfills in order to provide data that is much more feasible with better accuracy. Equally, parallel deployments of cutting-edge technologies like real-time sensors and drones would allow for increasing detail, to perform analyses that are increasingly granular on the subject of emissions. Therefore, studies associated with landfill gas emission are composed of an evolving discipline with increasing attention. In the backdrop of findings, there is a dire need for further investigation into the effects of emissions from all primary sources to retard the process of climatic change.
The raw data supporting the conclusions of this article will be made available by the authors, without undue reservation.
TS: Conceptualization, Data curation, Investigation, Methodology, Writing–original draft, Writing–review and editing. IA: Conceptualization, Formal Analysis, Methodology, Validation, Writing–original draft, Writing–review and editing. EA: Conceptualization, Data curation, Investigation, Writing–original draft, Writing–review and editing. TC: Conceptualization, Writing–original draft. AP: Methodology, Software, Writing–original draft. FR: Methodology, Resources, Visualization, Writing–original draft. MA: Funding acquisition, Resources, Writing–review and editing. EL: Project administration, Supervision, Writing–review and editing.
The author(s) declare that financial support was received for the research and/or publication of this article. The authors would like to thank the support of Conselho Nacional de Desenvolvimento Científico e Tecnológico (CNPq) (Grants #131458/2023-0, and #382356/2024-1), Comissão Nacional de Energia Nuclear (CNEN), Fundação Coordenação de Aperfeiçoamento de Pessoal de Nível Superior (CAPES) (Grants #88887.473711/2020-00, #88887.464990/2019-00, #88887.473416/2020-00, and #88887.015521/2024-00), and Fundação de Amparo à Pesquisa do Estado de São Paulo (FAPESP) for financing the research, and LEAL team and Metroclima Project for the support, under FAPESP Grant #2016/18438-0.
The authors declare that the research was conducted in the absence of any commercial or financial relationships that could be construed as a potential conflict of interest.
The author(s) declared that they were an editorial board member of Frontiers, at the time of submission. This had no impact on the peer review process and the final decision.
The author(s) declare that no Generative AI was used in the creation of this manuscript.
All claims expressed in this article are solely those of the authors and do not necessarily represent those of their affiliated organizations, or those of the publisher, the editors and the reviewers. Any product that may be evaluated in this article, or claim that may be made by its manufacturer, is not guaranteed or endorsed by the publisher.
The Supplementary Material for this article can be found online at: https://www.frontiersin.org/articles/10.3389/feart.2025.1549385/full#supplementary-material
ABB Inc (2024). Microportable gas analyzers. GLA131 series: measurement products. Available online at: https://new.abb.com/products/measurement-products/analytical/laser-gas-analyzers/laser-analyzers/lgr-icos-portable-analyzers/lgr-icos-microportable-analyzers-gla131-series (Accessed November 7, 2024).
Alvarez, R. A., Zavala-Araiza, D., Lyon, D. R., Allen, D. T., Barkley, Z. R., Brandt, A. R., et al. (2018). Assessment of methane emissions from the u.s. oil and gas supply chain. Science 361, 186–188. doi:10.1126/science.aar7204
Barbosa, A. (2019). Cidades da grande sp produzem 27 mil toneladas de lixo por dia; veja para onde vão os resíduos. Available online at: https://g1.globo.com/sp/sao-paulo/noticia/2019/04/29/cidades-da-grande-sp-produzem-27-mil-toneladas-de-lixo-por-dia-veja-para-onde-vao-os-residuos.ghtml (Accessed November 7, 2024).
Barolet, D., Christiaens, F., and Hamblin, M. R. (2016). Infrared and skin: friend or foe. J. Photochem. Photobiol. B Biol. 155, 78–85. doi:10.1016/j.jphotobiol.2015.12.014
Bogner, J., Abdelrafie Ahmed, M., Diaz, C., Faaij, A., Gao, Q., Hashimoto, S., et al. (2008). “Waste management,” in Climate change 2007: mitigation. Contribution of working group III to the fourth assessment report of the intergovernmental panel on climate change. Editors B. Metz, O. Davidson, P. Bosch, R. Dave, and L. Meyer (Cambridge: Cambridge University Press), 595–598.
Borba, P. (2022). Avaliação das emissões e dispersões atmosféricas de aterros de disposição final de resíduos na região metropolitana do Rio de Janeiro. Ph.D. thesis. Rio de Janeiro: Faculdade de Engenharia, Universidade do Estado do Rio de Janeiro.
Candiani, G. (2022). Monitoring the process of biodegradation and methabe gas generation in an experimental cell of municipal solid waste in Brazil. Rev. Científica Fac. Educ. Meio Ambiente 13, 114–130. doi:10.31072/rcf.v13i1.907
Candiani, G., and Silva, M. (2011). Analysis of biogas in sanitary landfill caieiras. Semina Ciências Exatas E Tecnológicas 32, 69–77. doi:10.5433/1679-0375.2011v32n1p69
Candiani, G., and Viana, E. (2017). Emissões fugitivas de metano em aterros sanitários. GEOUSP Espaço Tempo (Online) 21, 845–857. doi:10.11606/issn.2179-0892.geousp.2017.97398
Cimorelli, A. J., Perry, S. G., Venkatram, A., Weil, J. C., Paine, R. J., Wilson, R. B., et al. (2004). AERMOD: description of model formulation. North Carolina.
Cunha, C. (2019). Proposta de Índice de Sustentabilidade Operacional de Aterros Sanitários. Ph.D. thesis (Rio de Janeiro: Faculdade de Engenharia, Universidade do Estado do).
ECMWF (2024). The family of ERA5 datasets. Eur. Centre Medium-Range Weather Forecasts. Available online at: https://confluence.ecmwf.int/display/CKB/The+family+of+ERA5+datasets (Accessed November 28, 2024).
Guenther, A., Hewitt, C. N., Erickson, D., Fall, R., Geron, C., Graedel, T., et al. (1995). A global model of natural volatile organic compound emissions. J. Geophys. Res. Atmos. 100, 8873–8892. doi:10.1029/94JD02950
He, Q., Zheng, C., Zheng, K., and Tittel, F. K. (2021). Off-axis integrated cavity output spectroscopy for real-time methane measurements with an integrated wavelength-tunable light source. Infrared Phys. and Technol. 115, 103705. doi:10.1016/j.infrared.2021.103705
IPCC (2019). 2019 refinement to the 2006 IPCC guidelines for national greenhouse gas inventories (intergovernmental panel on climate change). Genebra: Intergovernmental Panel on Climate Change.
IPCC (2021). Climate change 2021: the physical science basis. Intergovernmental Panel on Climate Change. Cambridge: Cambridge University Press.
Kirschke, S., Bousquet, P., Ciais, P., Saunois, M., Canadell, J. G., Dlugokencky, E. J., et al. (2013). Three decades of global methane sources and sinks. Nat. Geosci. 6, 813–823. doi:10.1038/ngeo1955
Lyon, D. R. (2016). “Chapter 3 - methane emissions from the natural gas supply chain,” in Environmental and health issues in unconventional oil and gas development. Editors D. Kaden, and T. Rose (Elsevier), 33–48. doi:10.1016/B978-0-12-804111-6.00003-0
Maasakkers, J. D., Varon, D. J., Elfarsdóttir, A., McKeever, J., Jervis, D., Mahapatra, G., et al. (2022). Using satellites to uncover large methane emissions from landfills. Sci. Adv. 8, eabn9683. doi:10.1126/sciadv.abn9683
Matacchiera, F., Manes, C., Beaven, R., Rees-White, T., Boano, F., Mønster, J., et al. (2019). Aermod as a Gaussian dispersion model for planning tracer gas dispersion tests for landfill methane emission quantification. Waste Manag. 87, 924–936. doi:10.1016/j.wasman.2018.02.007
Mønster, J., Kjeldsen, P., and Scheutz, C. (2019). Methodologies for measuring fugitive methane emissions from landfills – a review. Waste Manag. 87, 835–859. doi:10.1016/j.wasman.2018.12.047
Olaguer, E. P., Jeltema, S., Gauthier, T., Jermalowicz, D., Ostaszewski, A., Batterman, S., et al. (2022). Landfill emissions of methane inferred from unmanned aerial vehicle and mobile ground measurements. Atmosphere 13, 983. doi:10.3390/atmos13060983
Scheutz, C., Kjeldsen, P., Bogner, J., De Visscher, A., Gebert, J., Hilger, H., et al. (2009). Microbial methane oxidation processes and technologies for mitigation of landfill gas emissions. Waste Manag. and Res. 27, 409–455. doi:10.1177/0734242X09339325
Schlesinger, W. H., and Bernhardt, E. S. (2020). “Chapter 3 - the atmosphere,” in Biogeochemistry. Editors W. H. Schlesinger, and E. S. Bernhardt Fourth edition edn. (Academic Press), 51–97. doi:10.1016/B978-0-12-814608-8.00003-7
SEEG (2022). Desafios e Oportunidades para Redução das Emissões de Metano no Brasil. Observatório do Clima. Sistema de Estimativas de Emissões e Remoções de Gases de Efeito Estufa.
Seinfeld, J. H., and Pandis, S. N. (2016). Atmospheric chemistry and physics: from air pollution to climate change. 3 edn. Hoboken, NJ: John Wiley and Sons.
Spokas, K., Bogner, J., Chanton, J., Morcet, M., Aran, C., Graff, C., et al. (2006). Methane mass balance at three landfill sites: what is the efficiency of capture by gas collection systems? Waste Manag. 26, 516–525. doi:10.1016/j.wasman.2005.07.021
Tartakovsky, D., Broday, D. M., and Stern, E. (2013). Evaluation of aermod and calpuff for predicting ambient concentrations of total suspended particulate matter (tsp) emissions from a quarry in complex terrain. Environ. Pollut. 179, 138–145. doi:10.1016/j.envpol.2013.04.023
U.S. EPA (2018). User’s guide for the AERMOD terrain preprocessor (AERMAP). Office of Air Quality Planning and Standards, North Carolina. United States Environmental Protection Agency. Publication No. EPA-454/B-18-004.
U.S. EPA (2024a). Air quality dispersion modeling - preferred and recommended models. U. S. Environ. Prot. Agency. Available online at: https://www.epa.gov/scram/air-quality-dispersion-modeling-preferred-and-recommended-models (Accessed November 7, 2024).
U.S. EPA (2024b). Air quality dispersion modeling - related model support programs. U.S. Environ. Prot. Agency. Available online at: https://www.epa.gov/scram/air-quality-dispersion-modeling-related-model-support-programs (Accessed November 28, 2024).
Varon, D. J., Jacob, D. J., Sulprizio, M., Estrada, L. A., Downs, W. B., Shen, L., et al. (2022). Integrated methane inversion (imi 1.0): a user-friendly, cloud-based facility for inferring high-resolution methane emissions from tropomi satellite observations. Geosci. Model Dev. 15, 5787–5805. doi:10.5194/gmd-15-5787-2022
Keywords: methane, landfills, greenhouse gas analyzer, inverse modelling, atmospheric inversion, satellite data
Citation: Silva TAd, Andrade IDS, Araújo EC, Corrêa T, Pellegrinetti Mendes AC, Ribeiro FND, Andrade MdF and Landulfo E (2025) Landfill methane emission: a case study using inversion methods, satellite and CRDS-based observations. Front. Earth Sci. 13:1549385. doi: 10.3389/feart.2025.1549385
Received: 21 December 2024; Accepted: 10 March 2025;
Published: 01 April 2025.
Edited by:
Pierangela Cristiani, Ricerca Sul Sistema Energetico, ItalyReviewed by:
Worradorn Phairuang, Chiang Mai University, ThailandCopyright © 2025 Andrade da Silva, Da Silva Andrade, Araújo, Corrêa, Pellegrinetti Mendes, Ribeiro, Andrade and Landulfo. This is an open-access article distributed under the terms of the Creative Commons Attribution License (CC BY). The use, distribution or reproduction in other forums is permitted, provided the original author(s) and the copyright owner(s) are credited and that the original publication in this journal is cited, in accordance with accepted academic practice. No use, distribution or reproduction is permitted which does not comply with these terms.
*Correspondence: Thaís Andrade da Silva, dGhhaXMuYW5kcmFkZWRhc2lsdmFAdXNwLmJy; Izabel da Silva Andrade, aXphYmVsLmFuZHJhZGVAdXNwLmJy; Elaine Cristina Araújo, ZWxhaW5lLmMuYXJhdWpvQHVzcC5icg==
Disclaimer: All claims expressed in this article are solely those of the authors and do not necessarily represent those of their affiliated organizations, or those of the publisher, the editors and the reviewers. Any product that may be evaluated in this article or claim that may be made by its manufacturer is not guaranteed or endorsed by the publisher.
Research integrity at Frontiers
Learn more about the work of our research integrity team to safeguard the quality of each article we publish.