 Jie Zhang
 Bin Tan1,2*
 Chaoxu Xia
94% of researchers rate our articles as excellent or good
Learn more about the work of our research integrity team to safeguard the quality of each article we publish.
Find out more
ORIGINAL RESEARCH article
Front. Earth Sci., 21 March 2025
Sec. Geohazards and Georisks
Volume 13 - 2025 | https://doi.org/10.3389/feart.2025.1546716
This article is part of the Research TopicFailure Analysis and Risk Assessment of Natural Disasters Through Machine Learning and Numerical Simulation: Volume IVView all 22 articles
Assessing the lethal resistance levels of buildings during earthquakes is crucial for reducing disaster losses and human casualties. This study proposes a novel model that integrates an improved genetic algorithm (IGA) with an optimized backpropagation neural network (OBPNN) to address data imbalance in classifying building types for lethal resistance levels assessment. The Synthetic Minority Class Oversampling Technique was applied to balance class distributions in the training set by oversampling minority classes. To address overfitting, L2 regularization was combined with a genetic algorithm to optimize the backpropagation neural network (BPNN)'s weights and biases, enhancing global search capability and classification accuracy. Momentum parameters and the Adam optimizer were incorporated to smooth gradient updates, prevent oscillations during training, and accelerate convergence. Additionally, domain adaptation techniques were employed to improve test set performance through feature adaptation, enhancing the model’s robustness under varying data distributions and its generalization ability. The experimental results show that the proposed improved model achieves excellent performance in classifying the level of lethal resistance levels of buildings, with an accuracy of 97% and an AUC value of 1, which indicates that the model’s generalization and discriminative abilities are more excellent.
Assessing the seismic capacity and level of lethal risk of buildings is essential to minimize disaster-related losses and casualties. Accurate categorization of building types and their vulnerability to seismic events is vital in designing effective mitigation strategies. Feng et al. assessed the seismic resilience of urban neighborhoods through the spatial factors of the community (Feng et al., 2007). Ellingwood et al. assessed the building vulnerability of steel frames with welded connections through probability-based uncertainty in response to future building seismic strengthening (Ellingwood, 2001). Yang et al. calculated the damage state of buildings under the influence of 7-degree and 8-degree earthquakes according to the capability spectrum method, based on which they carried out urban seismic planning by classifying urban buildings into four categories, namely, reinforced concrete, masonry, steel frames, and wood structures, and then obtained the probability of the various damage states of the buildings and the seismic damage indices by using the capability spectrum method (Yang et al., 2010). Betti analyzed Romanesque masonry churches by using quasistatic methods to evaluate seismic loads to assess their structural behavior and their seismic vulnerability in their actual state of protection (Betti and Vignoli, 2008). Adhikari performs seismic vulnerability and risk assessment of school infrastructure in a region by identifying and categorizing these structures into a varying number of structure types characterized by vulnerability profiles and describing the representative index structures of the different types for detailed vulnerability quantification (Adhikari et al., 2023). Alothman compares the vulnerability analysis of buildings of different heights exposed to ground motions with different characteristics, three different seismic packages are used to study the seismic performance assessment of frame buildings, and the finite element software Open Sees is used to assess the seismic performance of three multistory RC buildings (Alothman et al., 2023). Li incorporates a Gaussian regression algorithm to propose a nonlinear regression model that can be used to assess the seismic vulnerability of regional hospital and school buildings (Li et al., 2024). Fan (2014) combined with the latest research progress of machine learning algorithms, and proposed a single building seismic damage assessment method based on improved genetic algorithm optimized BP neural network. Taking Sichuan as an example, an assessment model is established by optimizing the BP neural network through the improved genetic algorithm, and the damage levels of different structural types of single buildings in the region are outputted to assess the damage of single buildings under the combined effect of various seismic influencing factors, so as to evaluate the seismic damage of single buildings.
Evaluating the risk of buildings under seismic effects mainly relies on statistical methods. However, with the rapid development of information technology, machine learning methods have shown great efficiency and accuracy in dealing with complex nonlinear problems due to their strong adaptive ability and fault tolerance. In recent years, numerous researchers have realized the great potential of machine learning algorithms and their derived methods in the field of disaster assessment, such as earthquakes, and have conducted related studies (Bergen et al., 2019; Reichstein et al., 2019). Although these studies have achieved significant results in advancing the field of earthquake hazard assessment, they tend to focus on the application of standard machine learning algorithms and fail to adequately address key issues such as data imbalance, overfitting, and insufficient model generalization capabilities. Yu et al. developed a three-layer BPNN earthquake disaster casualty prediction model for earthquake disaster casualty assessment (Yu et al., 2005). Yang, Wu et al. Establishment of BPNN for fast prediction of post earthquake casualties (Yang et al., 2009; Wu et al., 2017). Beyza has developed an artificial intelligence based loss assessment algorithm that can accurately and quickly differentiate between structural and non-structural damage (Gultekin and Dogan, 2024). Chen et al. screened 42 historical earthquake cases and constructed a particle swarm optimization extreme learning machine earthquake fatality prediction model by performing principal component analysis on earthquake related impact indicators (Chen et al., 2024). Kim constructed a simulated dataset using a probabilistic deep neural network model, which replaces the widely used nonlinear static procedure, to improve the accuracy of individual structural response prediction for pre-earthquake loss assessment for assessing regional losses (Kim et al., 2020). Li analyzed the influencing factors of building seismic capacity, determined the basic causal events of the assessment objectives based on the broken tree analysis (FTA), classified and summarized the basic causal events in the FTA model, and constructed the judgment system for building seismic capacity. The weight of each index factor in the system was calculated using the Gini index and the importance of the index was analyzed (Li et al., 2023). However, when dealing with earthquake related data, it is challenging to achieve high accuracy in such assessments due to the inherent category imbalance in real world data, where samples of severely vulnerable buildings are typically small (Nie et al., 2021). This imbalance can significantly hinder the performance of traditional machine learning models, which tend to be biased towards the majority of categories, resulting in suboptimal predictions for the few categories that are critical for disaster risk management.
Although the aforementioned studies have made remarkable progress in the field of seismic hazard assessment, either focusing on the optimization of the model structure, or on the prediction of specific loss types, or on the analysis of influencing factors, few of them have been able to comprehensively address the key issues of data imbalance, model overfitting, and limited generalization ability. These methods mentioned above face many challenges when dealing with large datasets and high-dimensional inputs.
Traditional statistical methods tend to have high computational complexity when dealing with large datasets and have difficulty capturing complex relationships and patterns in the data. In addition, when the inputs are high dimensional, traditional methods can suffer from “dimensionality catastrophe”, which can lead to a dramatic performance degradation. In contrast, machine-learning-based approaches show significant advantages in dealing with such problems.
Specifically, machine learning algorithms, especially deep learning algorithms, have powerful feature extraction and pattern recognition capabilities. They are able to automatically extract useful features from high-dimensional input data and capture nonlinear relationships in the data through complex network structures. This allows machine learning algorithms to maintain high accuracy and efficiency when dealing with large datasets and high-dimensional inputs.
Therefore, to address the above issues, the contribution of this study is as follows:
In this study, an innovative hybrid model is proposed to solve the problems of unbalanced dataset, overfitting, and insufficient model generalization ability in the assessment of building seismic damage by using representative villages in 18 townships, including Calamus Township, Daying Township, Xin’an Township, and Jinji Township, in Anhui Province, as the study area. The model combines genetic algorithm (Holland, 1992; Kramer and Kramer, 2017; Reeves, 2010; Coello, 2000) and OBPNN (Ding et al., 2011; Jin et al., 2000; Li et al., 2012; Chen et al., 2023) to improve classification accuracy and robustness. Genetic algorithms are used to optimize the parameters of the BPNN to avoid falling into local optimal solutions and to improve the global search capability. This combined approach is able to search the parameter space more efficiently when dealing with large datasets, thus finding better model parameters. In addition, to address the problem of unbalanced datasets, we employ the SMOTE technique (Wang et al., 2021; Jeatrakul et al., 2010; Jiang et al., 2016). This technique makes the dataset more balanced in terms of categories by synthesizing minority class samples, which improves the prediction accuracy of the model for minority class samples. We also introduced L2 regularization to reduce the risk of overfitting (Yang and Ma, 2017; Lv and Shen, 2015; Shi et al., 2024). L2 regularization improves the generalization ability of the model by penalizing the sum of squares of the model parameters so that the model will not be overly complex during the training process. Meanwhile, the integration of momentum parameters and Adam optimizer accelerates the model convergence. In addition, the introduction of domain adaptation technology enhances the generalization ability of the model (Fan et al., 2021; Liang et al., 2019; Weiss et al., 2016; Wang and Deng, 2018), which provides a powerful tool for seismic risk assessment and helps to improve the disaster prevention and resilience of urban planning.
Therefore, this machine learning-based approach effectively solves the problems that are difficult to be solved by traditional methods through automatic feature extraction, complex pattern recognition, parameter optimization, and dataset balancing when dealing with large datasets and high-dimensional inputs. This makes machine learning algorithms have a broad application prospect in the field of earthquake hazard assessment.
When a building encounters an earthquake, its lethal resistance levels are determined by a variety of factors. The so-called lethal level is the comprehensive possibility or level of various factors that may cause the death of people after an earthquake in a certain area. The best indicator to describe lethal is the mortality rate caused by the earthquake. The results of various death factors caused by each earthquake are comprehensively reflected in the mortality rate of the disaster area, especially the mortality rate by intensity (Xia et al., 2020). In this paper, considering the comprehensive reasons such as field investigation and lethal resistance levels calculation, based on the field investigation Table 1, we extracted the factors affecting the lethal resistance levels of each type of building according to the adjusting factors in the lethal resistance levels of various types of buildings as shown in the table, including the type of building and roof, structural columns, trap beams, maximum column spacing, and the maximum span of the beams, Maximum floor height, mean value, building age and other eight influencing factors as the input indexes of the model in this paper. And the buildings are classified according to the lethal resistance levels classification shown in the Table 2.
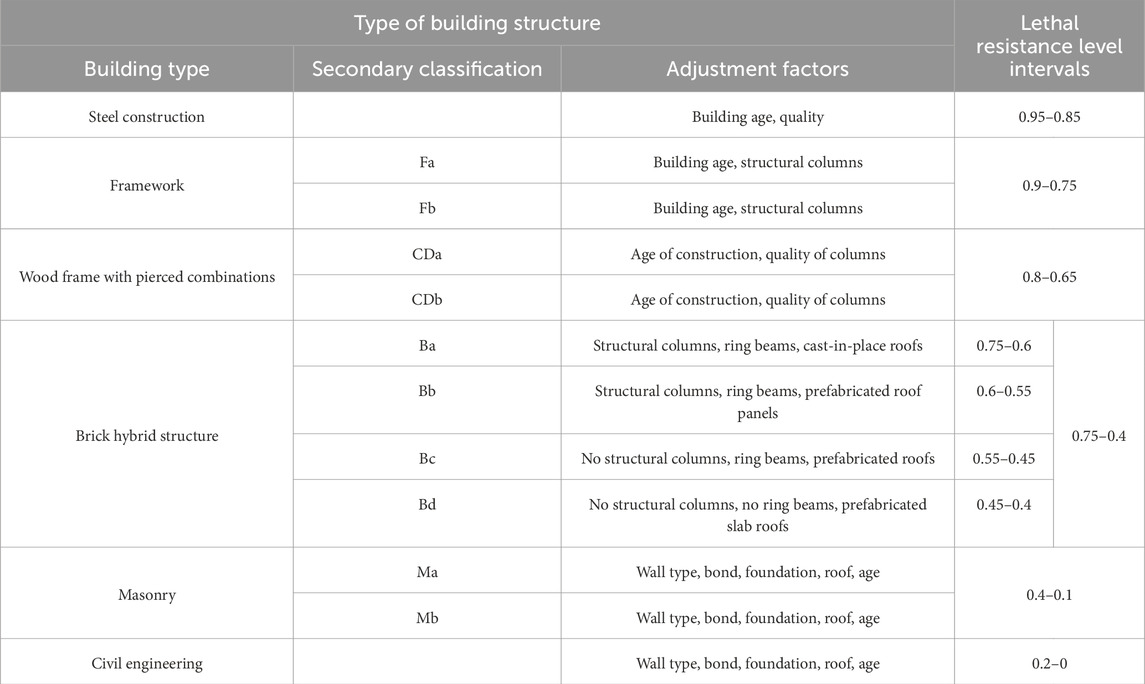
Table 1. Anti lethal resistance levels for various types of buildings.
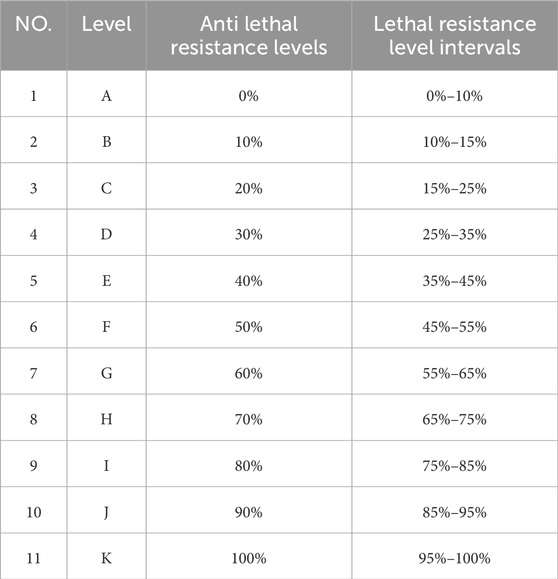
Table 2. Grading of lethal resistance levels.
There are 579,057 buildings in the entire dataset and the lethal resistance levels were categorized into 11 classes of A-K. The lethal resistance levels of the buildings are categorized and calculated with the following methods and formulas:
(1) Calculation of lethal resistance levels at the administrative village (neighborhood committee) level: according to the actual situation of the research sites.
where AL (Anti-lethal) is the lethal resistance levels at the research site, Pi is the proportion of buildings in category i, and Li is the lethal resistance levels (coefficient) for buildings in category i.
(2) Calculation of the lethal resistance levels at the township (street) level: Calculation by combining the lethal resistance levels of the research sites.
Where ALtown is the lethal resistance levels of the township as a whole, ALtownship is the lethal resistance levels of the research site where the township is located, ALcountry1 and ALcountry2 are the lethal resistance levels of the rural research sites of the township, α is the proportion of the population of the township to the population of the entire township, β is the proportion of the rural population to the population of the entire township, and α + β = 1, γ is the proportion of the population of the rural site 1, and δ is the proportion of the population of the rural site 2, and γ + δ = 1. γ is the proportion of population in rural research site 1, δ is the proportion of population in rural research site 2, γ + δ = 1 (Xia et al., 2020).
The BPNN algorithm can only deal with numerical data, and the above influencing factors used to assess the lethality rating are mostly textual data, so this paper synthesizes the relationship between the lethality rating and various types of buildings in Table 1 and quantifies the influencing factors through the quantitative criteria given in Table 3.
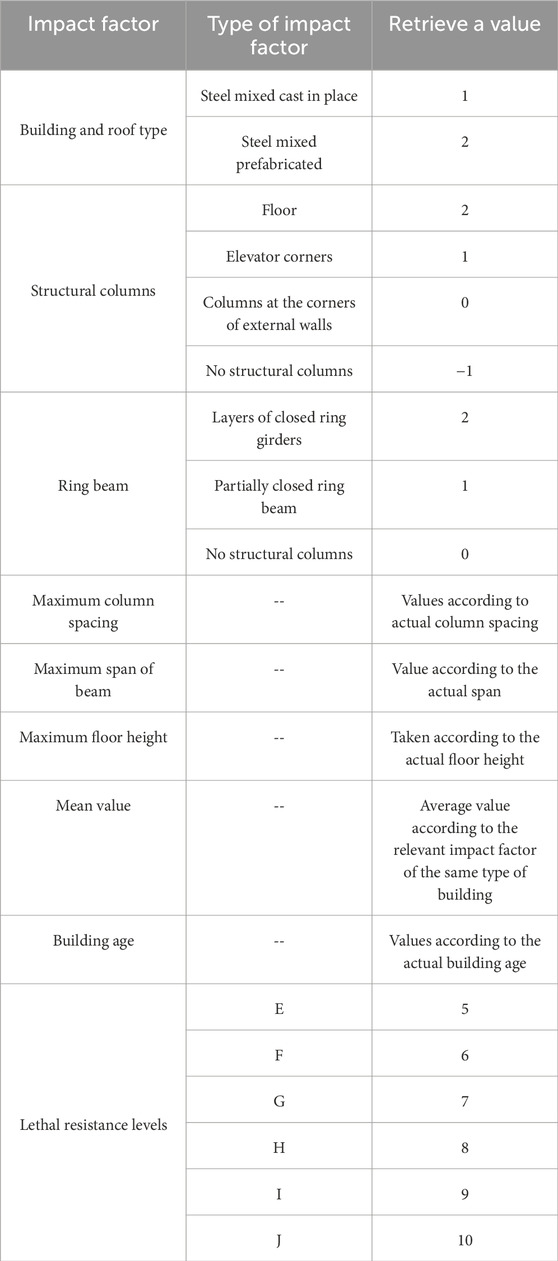
Table 3. Quantitative criteria for impact factors.
After clarifying the above-influencing factors and their quantification criteria, it should be pointed out that although “lethal resistance levels” (with a value ranging from 5 to 10, where 9 represents one of the higher lethal resistance levels) are used as an important index for assessing the structural performance of buildings in this paper, it is not a direct objective of this paper per se. In fact, the core research objective of this paper is to explore and quantify the effects of different building structural features (e.g., building and roof cover types, structural column configurations, ring beam conditions, etc.) on the lethal resistance levels and how these influencing factors combine to contribute to the overall building resistance performance. By deeply analyzing the association between these influencing factors and the lethal resistance levels, we aim to propose strategies and recommendations for improving the structural design of buildings to enhance their disaster resistance. Therefore, the value of 9 (i.e., the higher level in the lethal resistance levels scale) is used more as an assessment benchmark and outcome variable in this study to verify and quantify the validity of our proposed hypotheses and models.
This study is based in Anhui Province, China, and the study area map is shown in Figure 1 From the disaster data investigated and counted by the Anhui Provincial Seismological Bureau, representative data on building structure types of villages and townships in 18 townships in Anhui Province of China, such as Calamus Township, Daying Township, Xin’an Township, and Jinji Township, are collected and collated, and from them, eight influencing factors and seismic-resistant level data are screened out to form the sample data set of this paper, which is used to construct seismic-resistant level for various types of buildings, and part of the sample data are as shown in Table 4. The lethality ratings in the dataset are classified by professional evaluators based on the results of field evaluations at the building sites and by the lethality rating methodology for buildings commonly used in China.
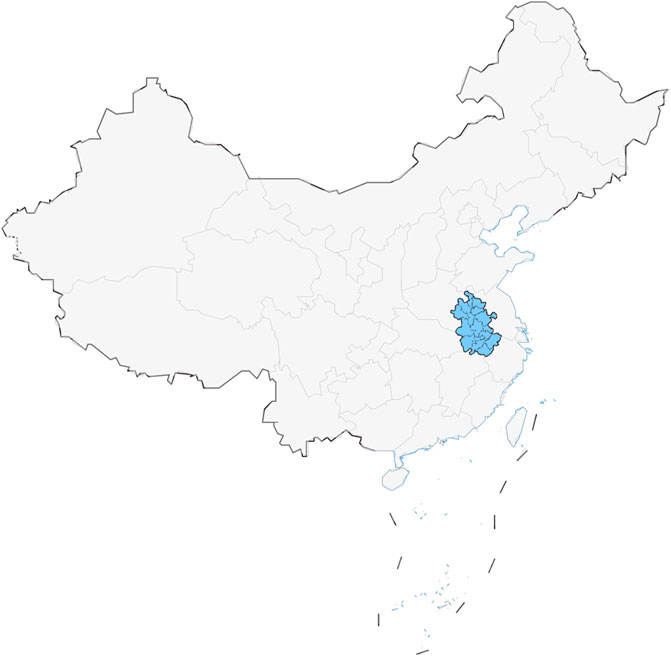
Figure 1. Regional map of anhui province, China.
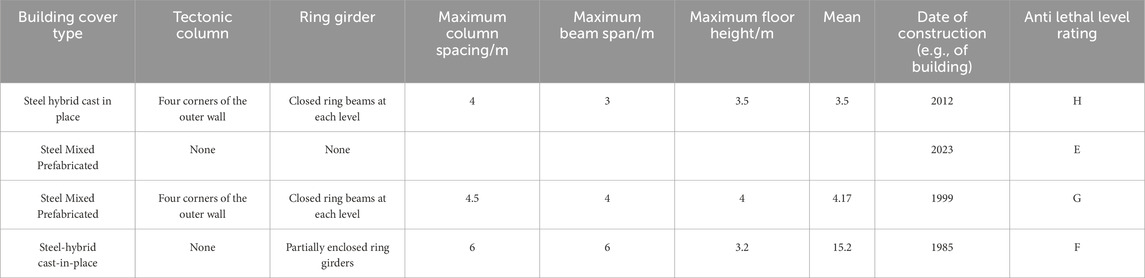
Table 4. Selected sample data for classification of buildings into lethality resistance levels.
Aiming at the problem of limited and unbalanced data sources in seismic hazard risk assessment, this paper adopts a dual strategy to optimize the model: applying the SMOTE technique to increase a few categories of samples in the training set to balance the data distribution, and at the same time, utilizing the domain adaptive technique in the testing set (through the MMD loss function) to achieve adaptive matching of the feature distributions, so as to effectively enhance the model’s generalization ability and prediction accuracy.
In this paper, based on the characteristics of the data source, data enhancement techniques are added to the model, using the SMOTE technique with Feature Adaptation in order to realize the problem of unbalanced class samples in the dataset. In this study, the representative villages and towns are used as examples to optimize the original unbalanced data, and the results after equalization by the SMOTE technique are shown in Table 5.
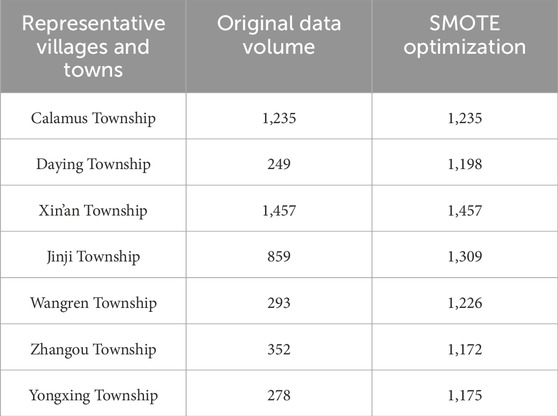
Table 5. Sample dataset equalization.
The SMOTE algorithm generates new samples based on the k nearest neighbors of the minority class samples (commonly k = 5) to ensure the diversity and representativeness of the new samples. By this method, the proportion of samples in the training set is balanced, and the discrimination ability of the classification model on minority classes is significantly improved.
MMD loss optimizes the model by calculating the difference between the source and target domain features and using this difference as part of the loss. During training, the model tries to reduce the difference in distribution between the source and target domains to achieve better feature adaptation.
Due to the different dimensions of the attributes of different influencing factors, there is an order of magnitude difference, which may affect the accuracy of the model output results. For this reason, this paper adopts the data extreme value method to normalize the attributes of each influencing factor and transform them into dimensionless pure values.
In this paper, the dataset is divided into a training set and a test set by randomly disrupting it in the ratio of 8:2 to ensure the generalization ability of the model. Specifically, the split_data_set function first receives the feature set (data_set) and label set (target_set), as well as the division ratio (rate) and whether to disrupt (ifsuf) as parameters. The function randomly disrupts the index of the dataset through the random_number method, thus eliminating the potential effect of data order on the model. Then, the training and test sets are divided according to the given division ratio, where the size of the training set is 1-rate times the size of the whole dataset and the size of the test set is rate times. In this way, the data set is divided randomly and representatively, providing a more reasonable database for model training and testing.
BPNN is a classical feed-forward artificial neural network, which consists of input, hidden, and output layers. It adjusts the weights in the network through the backpropagation algorithm to optimize the prediction performance. BPNN are widely used in the fields of pattern recognition, data classification, and function approximation, with powerful adaptive and nonlinear fitting capabilities.
In the study of this paper, a BPNN is used to evaluate the lethality resistance level of buildings. The network consists of three main parts: the input layer, the hidden layer, and the output layer. The topology of the BPNN is the specific network structure design, and topology is shown in Figure 2.
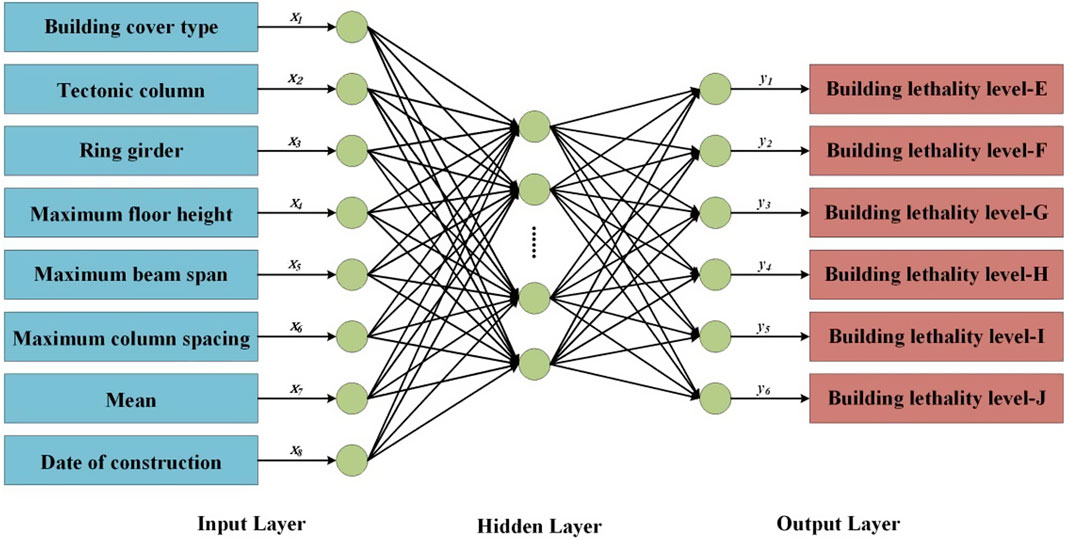
Figure 2. Topology of BPNN.
The number of neurons in the input layer corresponds to the factors related to the lethal resistance level of the building, and a total of eight input nodes are set up, which are: eight factors related to the lethal resistance level of the building, such as building and roof cover type, structural columns, ring beams, maximum column spacing, maximum beam span, maximum storey height, maximum column spacing, the mean value of the maximum span of the beams and the maximum storey height, and the age of the building. These factors are used as inputs to the network for predicting the damage level of the building. The mathematical expressions are given below:
where
The number of nodes in the hidden layer was tuned through repeated experiments and finalized to 17 neurons. Each hidden layer neuron is computed by weighting and activation functions to get the output of that layer. The output of the hidden layer can be expressed as:
where
The number of neurons in the output layer corresponds to the number of states of the building’s damage level, which is set to 5 output nodes, representing the 5 damage levels of the building. The nodes of the output layer represent the predicted damage levels of the building, which can be represented by the following mathematical expression:
Where
In this structure, the connection weight between the input layer and the hidden layer is
And the hidden function between the hidden layer and the input layer is
This activation function is used in this model to compute the probability distribution more consistently and avoid numerical overflow when performing the cross entropy loss function. The final output reflects the prediction of the building damage level, and the network optimizes the weights by backpropagation algorithm to improve the accuracy of the prediction.
The design and selection of the optimizer directly affect the training efficiency and convergence speed of the neural network. In this paper, in order to make the training process of BPNN more stable and efficient, this paper adds the optimizer with momentum to the original BPNN, which accelerates the convergence and reduces the gradient oscillations by introducing the historical gradient information; and through the Adam optimizer, the learning rate of each parameter is adjusted adaptively, which further improves the training efficiency and convergence. In addition, L2 regularization is achieved by setting the weight_decay parameter in the optimizer. For a basic loss function and the weight parameters of the model, the loss function with L2 regularization can be expressed as:
where
GA is a global optimization algorithm that simulates the process of biological evolution and optimizes a population of candidate solutions through operations such as selection, crossover, and mutation to approximate the global optimal solution. It is widely used in solving complex problems with powerful search and optimization capabilities. However, traditional genetic algorithms have limitations in the optimization process, such as fixed crossover and mutation rates, slow convergence, easy to fall into local optimums, lack of domain knowledge guidance and a single way of fitness assessment.
In traditional BPNN, the weight parameters are usually randomly initialized, which may cause the network to easily fall into local optima, especially in non-convex complex loss surfaces. In addition, traditional BPNN relies only on gradient descent for weight updating, which is slow to train and sensitive to initial weights. Therefore, to address the shortcomings in the traditional BPNN, as well as the shortcomings of the traditional genetic algorithm mentioned above, in this paper, the genetic algorithm is used to optimize the weights before the training of the BPNN model, so that the network starts to be trained under a more optimal initial value of the weights, which effectively avoids local optimums and accelerates the convergence of the model, and thus improves the model’s performance and the training effect. The specific improvements are as follows:
In this paper, by dynamically adjusting the crossover rate and variation rate, the parameter search space is increased, and the diversity of weight search is improved. It focuses on local optimization in the later stage, thus improving the convergence speed and global search ability. The formulas are:
Where
Where
In this paper, the cross entropy loss of BPNN is introduced as an evaluation index in the evaluation of fitness, which makes the fitness of each individual in each generation reflect the effect of optimization more accurately, which in turn enhances the optimization efficiency and accuracy and accelerates the convergence of the algorithm. Specifically, the adaptation score of each individual is calculated by the following formula:
where
In this paper, the genetic algorithm is designed to optimize the weight initialization of the neural network, making the optimization results more suitable for neural network training. In addition, the introduction of MMD loss is also designed for the specific needs of neural networks. In this paper, MMD loss is introduced to further improve the generalization effect of the model by dynamically adjusting the mutation rate, which reduces the risk of falling into the local optimum.
The MMD loss is used to constrain the distributional differences between the source and target domains with the following formula:
Where,
After improving the traditional genetic algorithm to optimize the BPNN and further optimizing the neural network, its basic flowchart is shown in Figure 3.
The genetic algorithm searches for suitable network weights by simulating an evolutionary process to bring the model closer to the global optimum before the BPNN is trained. The genetic algorithm first generates a number of individuals in the initialized population, each representing a set of candidate solutions for the neural network weights. By defining a fitness function, the algorithm evaluates the performance of each individual, i.e., the performance of that set of weights on the training data. Then, through selection, crossover, and mutation operations, the genetic algorithm optimizes the weight distribution generation by generation. Individuals with high fitness are preferred, crossover operations fuse the weight information of different individuals, and mutation operations introduce diversity to prevent the algorithm from falling into a local optimum.
Eventually, through several iterations, the genetic algorithm outputs a set of optimized weights that are used in the initial setup of the neural network to accelerate convergence and improve the generalization performance of the model in subsequent training. This combination of IGA and BPNN shows strong advantages in high dimensional nonlinear optimization problems, avoids the blindness of random initialization, and enhances the robustness and prediction ability of the model.
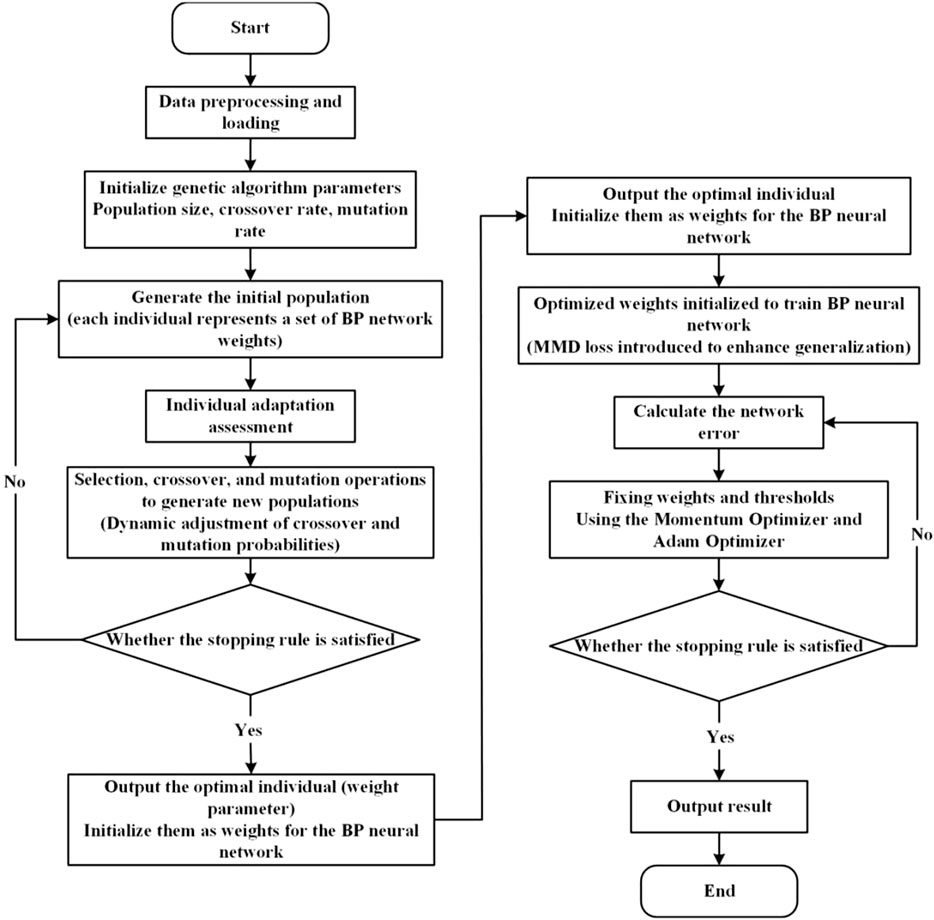
Figure 3. Flowchart of GA-OBPNN.
In order to verify the model reliability, this paper compares the evaluation results of the BPNN Model, OBPNN Model, GA-OBPNN Model, and IGA Combined OBPNN Model on a test set and evaluates the performance of the different models using the results of Accuracy, Loss Ratio, AUC (Area Under the Curve) (ROC Curve) and Confusion Matrix.
Accuracy and loss are important metrics for evaluating the results of a neural network model, and the lower the quasi-loss rate, the better the model’s performance. It is complementary to the accuracy rate and can be calculated by a simple formula. The expressions for accuracy and loss rate are:
Where TP (True Positive) is the true positive, the number of samples in which the positive class was correctly predicted as positive; FP (False Positive) is the false positive: the number of samples in which the negative class was incorrectly predicted as positive; TN (True Negative) is the true negative: the number of samples in which the negative class was correctly predicted as negative; FN (False Negative) False Negative: the number of samples in which the positive class was incorrectly predicted to be negative.
The performance of the four model test sets in terms of accuracy and loss rate is shown below:
Gradual increase of training accuracy: if the training accuracy gradually increases with epoch and eventually stabilizes, it indicates that the model gradually reaches the best learning effect on the training set.
Gradual increase in test accuracy: If the test accuracy gradually increases with training and eventually reaches a high and stable value, this indicates that the model performs well on the test set, which means that the model not only learns well on the training set, but also shows high accuracy on the unseen data (test set).
As can be seen in Figure 4, when training with the BPNN model, the loss rate of both the training and test sets decreases rapidly at the beginning of the training period, and the accuracy increases rapidly, indicating that the model successfully learns the features of the data and gradually fits the training data. However, as the training progresses, after about 100 epochs, the loss rate of the test set starts to increase, while the accuracy stabilizes and does not continue to increase. Meanwhile, the loss rate of the training set is still decreasing with some fluctuations, while the accuracy continues to increase slowly. This situation indicates that the model is overfitting in the late stage of training, i.e., the model is overfitting the training set, but its generalization ability to the test set is decreasing, resulting in a failure to improve the performance of the test set further. Figure 5 illustrates the training results of the OBPNN model. Compared with the BPNN model, the loss rates of both the training and test sets of the OBPNN show a gradual decrease, which indicates that the model alleviates the overfitting problem in the training of the BPNN to a certain extent. In addition, the accuracy performance of the training and test sets is more stable and the overall level is higher than that of BPNN, indicating that the optimized model is more efficient in learning data features. In Figure 6, the training results using the GA-OBPNN model further demonstrate the effectiveness of the optimization. The loss rate of both the training and test sets of this model is decreasing, and the accuracy of the test set is stable above 80%. This shows the effectiveness of the GA algorithm in weight optimization, which improves the convergence speed of the model and enhances the generalization ability to some extent.
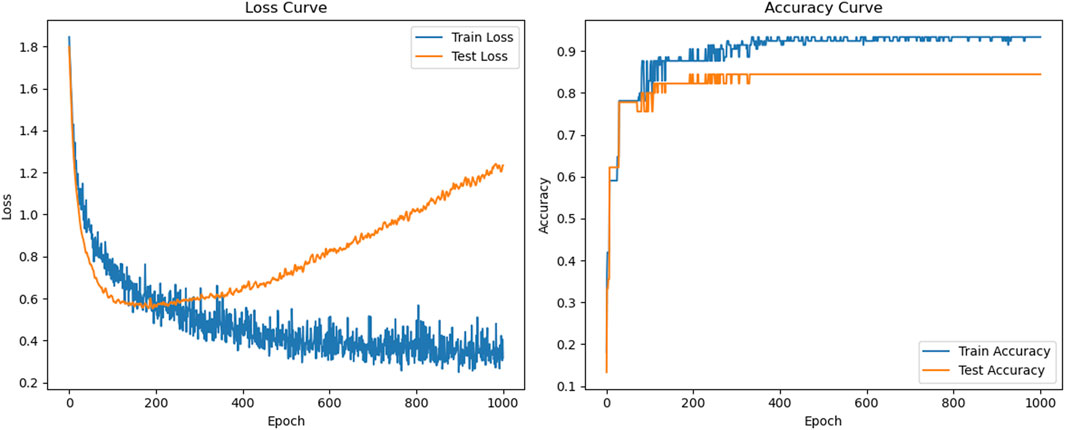
Figure 4. BPNN model loss rate, accuracy curve.
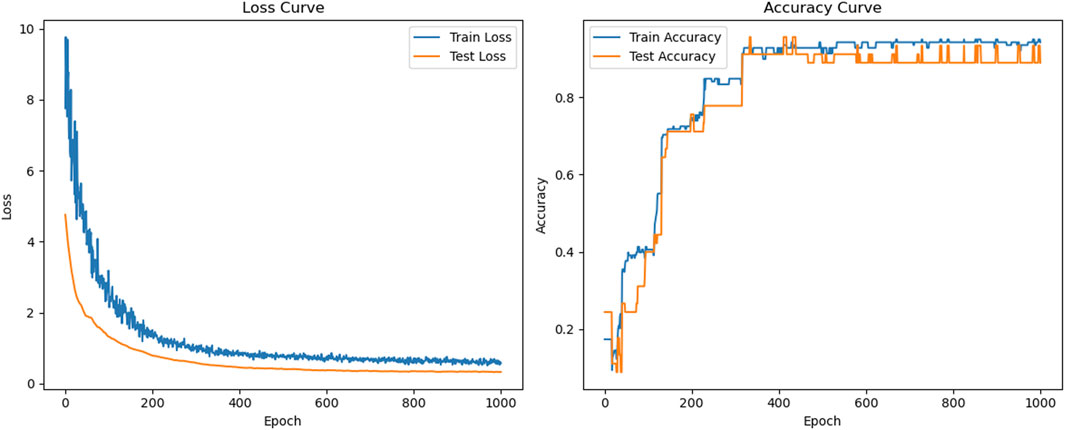
Figure 5. OBPNN model loss rate, accuracy curve.
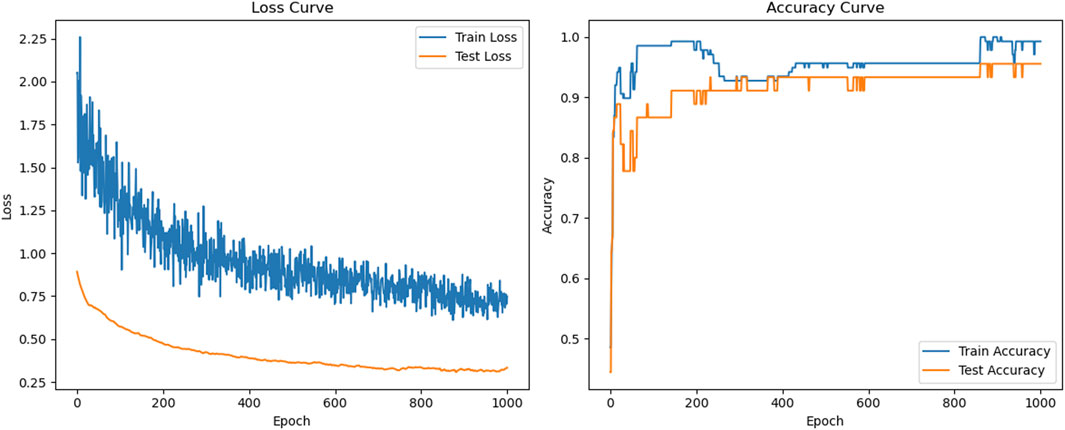
Figure 6. Loss rate, accuracy curve of GA-OBPNN model.
Figure 7 shows the training results of the IGA-OBPNN model. From the figure, it can be seen that the accuracy of the model is greatly improved in both the training and test sets, where the accuracy of the test set reaches 97%, which is even higher than the accuracy of the training set. This indicates that IGA-OBPNN has stronger generalization ability, i.e., the model not only fits the training data well, but also achieves excellent performance on the test data. In addition, compared with GA-OBPNN, IGA further optimizes the model parameters, which makes the training process more stable and effectively avoids the local optimum problem that is prone to occur in the traditional BPNN training process. In summary, compared with the traditional BPNN model, OBPNN and its improved version effectively alleviate the overfitting problem and improve the generalization ability of the model. Among them, GA-OBPNN achieves better results in optimizing the weights, while IGA-OBPNN further improves the convergence stability and accuracy with the best performance. This indicates that the improved model is able to ensure the training performance with stronger generalization ability.
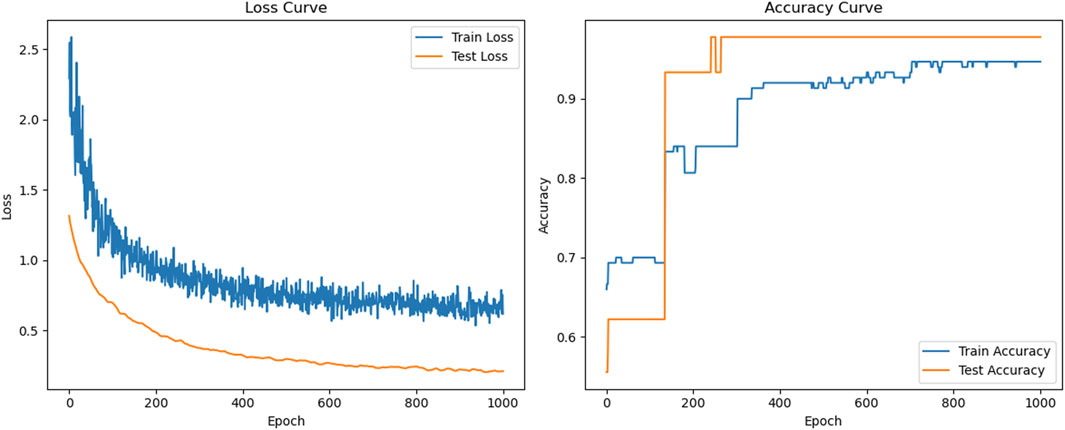
Figure 7. IGA combined with OBPNN model loss rate, accuracy curve.
AUC, which is commonly used to describe the area under the ROC curve, is also known as ROC-AUC. The ROC (Receiver Operating Characteristic) curve is a graphical tool that describes the classification effect of a model.
The ROC curve plots all possible classification thresholds as points on a graph, with the False Positive Rate (FPR) as the horizontal coordinate and the True Positive Rate (TPR) as the vertical coordinate. Rate, TPR). For an ideal classifier, the ROC curve will be as close to the upper left corner as possible, i.e., the True Positive Rate is high and the False Positive Rate is low.
The AUC, on the other hand, is the area under the ROC curve, with a value range between 0.5 and 1. The closer a model’s AUC value is to 1, the better its classification performance.
As can be seen from the comparison results in Figure 8, it can be seen that in the ROC curves of the BPNN and the GA-OBPNN, the recall (Recall) of each category is significantly lower than that of the remaining two models due to the lack of data enhancement of the training data. In particular, in the combined model of IGA and OBPNN, the AUC value is 1, which indicates that the discriminative ability of the model is enhanced and the classification task is more reliable.
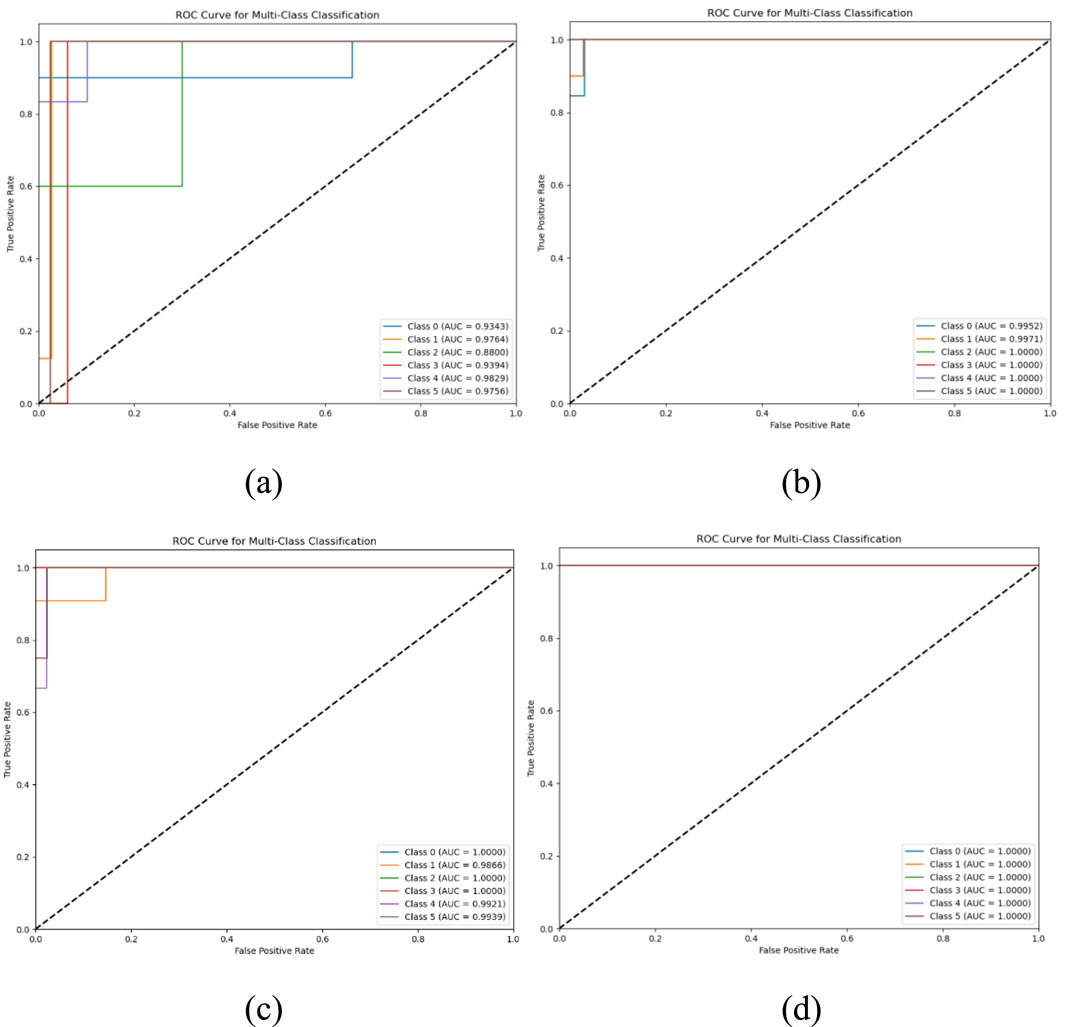
Figure 8. ROC curve. (A) BPNN model, (B) OBPNN model, (C) GA-OBPNN model, (D) IGA combined with OBPNN model.
Confusion matrix is a visualization tool for evaluating the performance of classification models. It is usually represented as a two-dimensional table where the rows represent the actual categories (true labels) and the columns represent the categories predicted by the model. The number in each cell represents the number of samples under the corresponding combination of actual and predicted categories.
The results in Figure 9 show that the performance of the BPNN model has some limitations. Specifically, 1 sample in the category 0 sample was misclassified to category 1. In addition, 3 real samples in the class 2 sample were misclassified to class 3, and 4 samples in class 4 were also misclassified to class 5. These misclassifications indicate that the BPNN model has some difficulties in dealing with categories with similar features and is prone to make wrong judgments between two similar categories. OBPNN model has improved its classification performance, but there are still some misclassification cases. In category 0, there is likewise 1 sample misclassified as category 1; and in category 1, there is also 1 sample misclassified as category 0. In addition, 2 samples in category 4 were misclassified to category 5. Although the optimized model performs better in some aspects, there is still a need to continue to work on handling similar class features. GA-OBPNN model further reduced the number of misclassifications. There was still one sample misclassified as class 1 in class 0, but the number of misclassifications in class 4 has been reduced to one misclassified as class 5. This shows that GA optimization plays a role in improving the model’s ability to distinguish features from similar classes. IGA combined with optimized BPNN model has achieved significant improvement in classification performance. In this model, only one sample in category 1 was misclassified as category 0, which is a significant reduction in the misclassification rate compared to other models. This indicates that the IGA-optimized model performs more accurately on most of the categories, and in particular, it shows a stronger ability in distinguishing similar category features.
This indicates that the IGA combined with optimized BPNN model performs more accurately on most of the categories, especially showing a stronger ability in distinguishing similar category features. This is mainly due to the global and efficient nature of the IGA algorithm in searching for the optimal solution, which enables the BPNN model to better learn the complex features and laws in the data, thus improving the accuracy of classification.
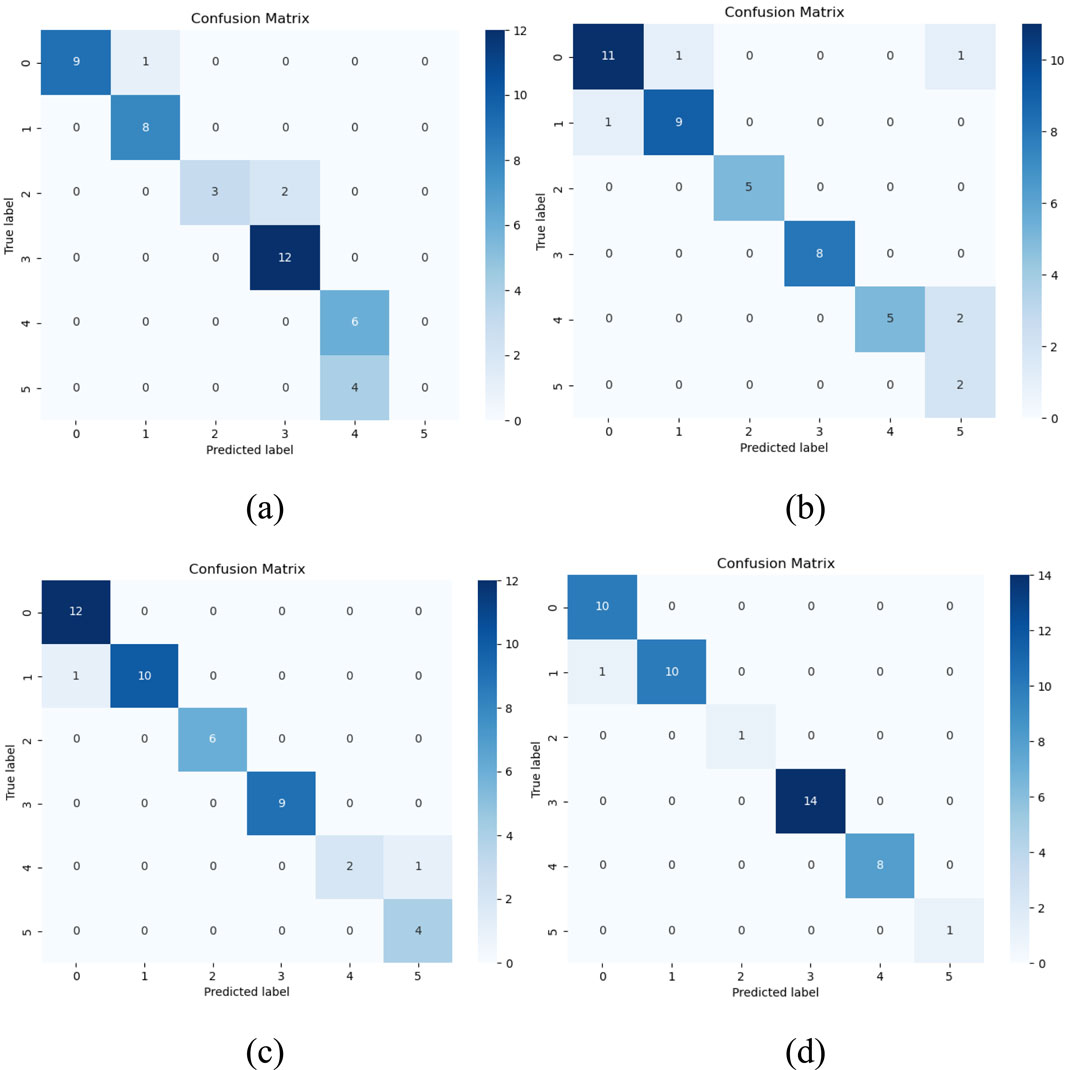
Figure 9. Confusion matrix diagram. (A) BPNN model, (B) OBPNN model, (C) GA-OBPNN model, (D) IGA combined with optimized BPNN model.
This study focuses on proposing a model that combines an improved genetic algorithm with an optimized BP neural network for assessing the lethal resistance levels of various types of buildings. The main contributions and conclusions are as follows:
1. Significant performance improvement: the data imbalance problem is effectively solved by oversampling the training set with a few classes of samples using the SMOTE technique. Combined with the L2 regularization technique reduces the risk of overfitting, which makes the model’s performance on the test set more stable. The experimental results show that the model achieves significant performance improvement in the multi-class classification task, with an accuracy of 97% and an AUC value of 1, which indicates that the model has strong generalization and discriminative abilities.
2. Effective classification of classes: the weights and bias of the BP neural network are optimized using a genetic algorithm to avoid local optimal solutions, which improves the global search ability and classification accuracy of the model. The integration of momentum parameters and Adam optimizer further accelerates the model convergence. The model can effectively classify the llethal resistance levels of buildings into different grades, which provides a scientific basis for earthquake risk assessment.
3. Enhancement of urban planning and disaster prevention and resilience: By deeply analyzing the effects of different building structural features on the lethal resistance levels, this study puts forward strategies and suggestions to improve the structural design of buildings in order to enhance their resilience. The construction and application of this model can help to improve urban planning disaster prevention and resilience, which is of great significance in reducing the damage and casualties of earthquakes.
Despite the remarkable results achieved in this study, there are still some limitations. First, although the hybrid model performs well in handling large datasets and high-dimensional inputs, its relatively high computational complexity may limit real-time applications to some extent. Second, despite the adoption of various techniques to optimize the model performance, the specific performance of the model may still be affected by the quality of the dataset, feature selection, and other factors in practical applications. In addition, this study mainly focuses on some townships in Anhui Province, and the generalizability and cross-regional applicability of the model need to be further verified. Future research can explore more efficient computational methods, expand the coverage of the dataset, and deeply optimize the model parameters to further enhance the model’s practicality and accuracy.
The data analyzed in this study is subject to the following licenses/restrictions: This dataset is confidential data of Anhui Earthquake Bureau and cannot be disclosed. Requests to access these datasets should be directed to JZ.
JZ: Conceptualization, Data curation, Methodology, Writing–original draft, Writing–review and editing. BT: Investigation, Project administration, Writing–review and editing. CX: Supervision, Writing–review and editing. WY: Software, Writing–review and editing. YT: Validation, Writing–review and editing. BM: Formal Analysis, Validation, Writing–review and editing.
The author(s) declare that financial support was received for the research, authorship, and/or publication of this article. This research was funded by National Natural Science Foundation of China, grant number 42207532, China Earthquake Emergency and Information Youth Project, grant number CEAEDEM202311 and 2024 China Earthquake Emergency Youth Project, grant number CEAEDEM20240207.
We thank the National Natural Science Foundation of China, the China Earthquake Emergency Response and Information Youth Program and the 2024 China Earthquake Emergency Youth Program for supporting this study, and the staff of the Anhui Provincial Seismological Bureau for their help with this study.
The authors declare that the research was conducted in the absence of any commercial or financial relationships that could be construed as a potential conflict of interest.
The author(s) declare that no Generative AI was used in the creation of this manuscript.
All claims expressed in this article are solely those of the authors and do not necessarily represent those of their affiliated organizations, or those of the publisher, the editors and the reviewers. Any product that may be evaluated in this article, or claim that may be made by its manufacturer, is not guaranteed or endorsed by the publisher.
Adhikari, R. K., D'Ayala, D., Fernandez, R., Yamin, L., Nassirpour, A., P Vatteri, A., et al. (2023). GLOSI taxonomy: a tool for ‘seismic risk assessment’oriented classification of school buildings. Int. J. Disaster Risk Reduct. 87, 103594. doi:10.1016/j.ijdrr.2023.103594
Alothman, A., Mangalathu, S., Al-Mosawe, A., Alam, M. M., and Allawi, A. (2023). The influence of earthquake characteristics on the seismic performance of reinforced concrete buildings in Australia with varying heights. J. Build. Eng. 67, 105957. doi:10.1016/j.jobe.2023.105957
Bergen, K. J., Johnson, P. A., de Hoop, M. V., and Beroza, G. C. (2019). Machine learning for data-driven discovery in solid Earth geoscience. Science 363, eaau0323. doi:10.1126/science.aau0323
Betti, M., and Vignoli, A. (2008). Modelling and analysis of a Romanesque church under earthquake loading: assessment of seismic resistance. Eng. Struct. 30, 352–367. doi:10.1016/j.engstruct.2007.03.027
Chen, J., Liu, Z., Yin, Z., Liu, X., Li, X., Yin, L., et al. (2023). Predict the effect of meteorological factors on haze using BP neural network. Urban Clim. 51, 101630. doi:10.1016/j.uclim.2023.101630
Chen, S. J., Liu, Z. W., Zhou, H., et al. (2024). Research on prediction of earthquake death toll based on PCA-PSO-ELM model. J. Geodesy Geodyn. 44, 105–110.
Coello, C. A. (2000). An updated survey of GA-based multiobjective optimization techniques. ACM Comput. Surv. (CSUR) 32, 109–143. doi:10.1145/358923.358929
Ding, S., Su, C., and Yu, J. (2011). An optimizing BP neural network algorithm based on genetic algorithm. Artif. Intell. Rev. 36, 153–162. doi:10.1007/s10462-011-9208-z
Ellingwood, B. R. (2001). Earthquake risk assessment of building structures. Reliab. Eng. and Syst. Saf. 74, 251–262. doi:10.1016/s0951-8320(01)00105-3
Fan, C. N., Liu, P., Xiao, T., et al. (2021). A review of depth domain adaptation: general and complex cases. J. Automation 47, 515–548.
Fan, C. X. (2014). Urban earthquake damage assessment model based on improved RBF neural network. Harbin: Harbin Institute of Technology.
Feng, Q. M., Sun, Z., Yan, F., Wu, Y., and Gao, J. (2007). Model of fuzzy synthetic evaluation on seismic resistance capacity of urban communities. World Earthq. Eng. 23, 1–5. doi:10.3969/j.issn.1007-6069.2007.01.001
Gultekin, B., and Dogan, G. (2024). A novel approach to discriminate between structural and non-structural post-earthquake damage in RC structures. Adv. Civ. Eng. 2024, 6027701. doi:10.1155/2024/6027701
Holland, J. H. (1992). Genetic algorithms. Sci. Am. 267, 66–72. doi:10.1038/scientificamerican0792-66
Jeatrakul, P., Wong, K. W., and Fung, C. C. (2010). “Classification of imbalanced data by combining the complementary neural network and SMOTE algorithm, Neural Information Processing,” in Models and applications: 17th international conference, ICONIP 2010. Sydney, Australia, 22-25 November 2010.
Jiang, K., Lu, J., and Xia, K. (2016). A novel algorithm for imbalance data classification based on genetic algorithm improved SMOTE. Arabian J. Sci. Eng. 41, 3255–3266. doi:10.1007/s13369-016-2179-2
Jin, W., Li, Z. J., Wei, L. S., et al. (2000). “The improvements of BP neural network learning algorithm, WCC 2000-ICSP 2000,” in 2000 5th international conference on signal processing proceedings. 16th world computer congress, USA, 21-25 Aug. 2000.
Kim, T., Song, J., and Kwon, O. S. (2020). Pre-and post-earthquake regional loss assessment using deep learning. Earthq. Eng. and Struct. Dyn. 49, 657–678. doi:10.1002/eqe.3258
Li, J., Cheng, J., Shi, J., and Huang, F. (2012). “Brief introduction of back propagation (BP) neural network algorithm and its improvement,” in Advances in computer science and information engineering, 2, 553–558. doi:10.1007/978-3-642-30223-7_87
Li, S. Q., Qin, P. F., and Li, Y. R. (2024). Seismic vulnerability analysis of hospitals and school buildings considering the Gaussian regression algorithm. J. Build. Eng. 97, 110799. doi:10.1016/j.jobe.2024.110799
Li, Y., Wang, W., Tan, B., and Wang, H. (2023). Evaluation of building seismic capacity based on improved naive bayesian algorithm. Int. J. Geophys. 2023, 1–15. doi:10.1155/2023/8532542
Liang, H., Fu, W. L., and Yi, F. J. (2019). “A survey of recent advances in transfer learning,” in Proceedings of the 2019 IEEE 19th international conference on communication technology. Xi' an, China, 16-19 Oct. 2019, (IEEE).
Lv, W., and Shen, C. (2015). Convergence analysis of neural network inverse iterative algorithm with L2 regularization term. Information Technology and Informatization, 183–184.
Nie, G. Z., Xia, Z. X., Fan, X. W., et al. (2021). Study on the lethality level of buildings based on historical seismic data. Geoscience 56, 1250–1266.
Reichstein, M., Camps-Valls, G., Stevens, B., Jung, M., Denzler, J., Carvalhais, N., et al. (2019). Deep learning and process understanding for data-driven Earth system science. Nature 566, 195–204. doi:10.1038/s41586-019-0912-1
Shi, S., Hu, K., Xie, J., Guo, Y., and Wu, H. (2024). Robust scientific text classification using prompt tuning based on data augmentation with L2 regularization. Inf. Process. and Manag. 61, 103531. doi:10.1016/j.ipm.2023.103531
Wang, M., and Deng, W. H. (2018). Deep visual domain adaptation: a survey. Neurocomputing 312, 135–153. doi:10.1016/j.neucom.2018.05.083
Wang, S., Dai, Y., Shen, J., and Xuan, J. (2021). Research on expansion and classification of imbalanced data based on SMOTE algorithm. Sci. Rep. 11, 24039. doi:10.1038/s41598-021-03430-5
Weiss, K., Khoshgoftaar, T. M., and Wang, D. D. (2016). A survey of transfer learning. J. Big Data 3, 9. doi:10.1186/s40537-016-0043-6
Wu, H. Y., Wu, X. Y., and Li, H. W. (2017). Research on rapid assessment of earthquake death toll based on neural network. Bull. Sci. Technol. 33, 241–244.
Xia, C., Nie, G., Fan, X., Zhou, J., Li, H., and Pang, X. (2020). Research on the rapid assessment of earthquake casualties based on the anti-lethal levels of buildings. Geomatics, Nat. Hazards Risk 11 (1), 377–398. doi:10.1080/19475705.2019.1710581
Yang, F., Zhang, B. Z., and Yan, L. L. (2009). System of earthquake casualty assessment based on BP neural network. Technol. Earthq. Disaster Prev. 4, 428–435.
Yang, H., and Ma, J. H. (2017). Research on regularized parameter solving method. Comput. Meas. Control 25, 226–229.
Yang, J., Liu, M., and Xu, N. (2010). Seismic damage assessment of buildings and urban seismic planning based on capability spectrum. China J. Saf. Sci. 20, 18–24. doi:10.16265/j.cnki.issn1003-3033.2010.11.003
Keywords: genetic algorithm, Back Propagation, Synthetic minority class oversampling Technique, building lethality resistance Levels, Earthquake
Citation: Zhang J, Tan B, Xia C, Yan W, Tao Y and Ma B (2025) A model for assessing lethal resistance levels of various buildings based on improved genetic algorithm + BP neural network optimization. Front. Earth Sci. 13:1546716. doi: 10.3389/feart.2025.1546716
Received: 17 December 2024; Accepted: 24 February 2025;
Published: 21 March 2025.
Edited by:
Peng Zeng, Chengdu University of Technology, ChinaReviewed by:
Antonio Giovanni Iaccarino, University of Naples Federico II, ItalyCopyright © 2025 Zhang, Tan, Xia, Yan, Tao and Ma. This is an open-access article distributed under the terms of the Creative Commons Attribution License (CC BY). The use, distribution or reproduction in other forums is permitted, provided the original author(s) and the copyright owner(s) are credited and that the original publication in this journal is cited, in accordance with accepted academic practice. No use, distribution or reproduction is permitted which does not comply with these terms.
*Correspondence: Bin Tan, dGFuYmluYWFAMTYzLmNvbQ==
Disclaimer: All claims expressed in this article are solely those of the authors and do not necessarily represent those of their affiliated organizations, or those of the publisher, the editors and the reviewers. Any product that may be evaluated in this article or claim that may be made by its manufacturer is not guaranteed or endorsed by the publisher.
Research integrity at Frontiers
Learn more about the work of our research integrity team to safeguard the quality of each article we publish.