 Xiaoping Zhou
 Shifang He2
94% of researchers rate our articles as excellent or good
Learn more about the work of our research integrity team to safeguard the quality of each article we publish.
Find out more
ORIGINAL RESEARCH article
Front. Earth Sci., 19 March 2025
Sec. Hydrosphere
Volume 13 - 2025 | https://doi.org/10.3389/feart.2025.1542367
This article is part of the Research TopicWater and Ecological System: Response, Management, and Restoration-Volume IIView all 14 articles
Human activity and climate change have significantly modified the hydrological processes of groundwater. In coal mining areas, dewatering operations have become more influential than climate change, making human activity the primary factor impacting groundwater systems. However, it remains unclear to what extent climate change affects groundwater levels under such strong human influence. This research examines the impact of El Niño Southern Oscillation (ENSO) on groundwater levels, using data from the Pansan Coal Mine in Huainan, China as a case study. We employ wavelet analysis to study four groundwater level time series and investigate the impacts of ENSO and precipitation. The study results indicate that, in cases of groundwater over-exploitation, significant regions in the Continuous Wavelet Transform of groundwater levels decrease significantly. However, despite the substantial drops in groundwater levels caused by mining activities, a distinct resonance period with precipitation and ENSO remains evident in the Cross Wavelet Transform. Human activities have not altered the resonance frequencies between groundwater levels and either precipitation or ENSO. Precipitation correlates with porous groundwater levels on an annual scale and with karst groundwater levels on both annual and inter-annual scales. ENSO significantly impacts Quaternary groundwater levels on annual and inter-annual scales, and it affects Neogene and karst groundwater levels on inter-annual scales. Conducting-water structures serve as the primary pathways for transmitting precipitation and ENSO signals. The findings and methodologies presented in this study can help managers and scientists in enhancing groundwater resource management, sustainable utilization and water disaster prevention amid future climate uncertainties.
Groundwater serves as a crucial water resource in coal mining operations, and it is also a disaster that threatens the safe mining of coal (Wang et al., 2012; Xue et al., 2023). Comprehending the fluctuations in groundwater levels, along with their periodic patterns and trends, plays a crucial role in addressing water resource management and disaster prevention effectively. This understanding is instrumental in predicting future variations in groundwater resources (Liesch and Wunsch, 2019). The periodic monitoring of groundwater levels resulting from oscillatory climatic systems serves as a valuable resource to enhance long-term forecasting capabilities (Rust et al., 2018). While long-term records of groundwater levels are rare, they hold significant importance in supplying the essential data required to assess changes in the resource over time (Liesch and Wunsch, 2019). Consequently, there has been a growing emphasis on studying the influence of long-term periodic fluctuations in groundwater levels attributed to climatic teleconnections. Numerous authors have reported these fluctuations in recent years (Gurdak et al., 2007; Holman et al., 2011; Tremblay et al., 2011; Perez-Valdivia et al., 2012; Dong et al., 2015; Neves et al., 2019).
However, both climate change and human activities have significantly altered hydrological processes (Zhang et al., 2016). The increased magnitude and frequency of climate change since the early 20th century have complicated the relationship between climate change and groundwater systems (IPCC, 2012). El Niño Southern Oscillation (ENSO) is a major interannual climate phenomenon that significantly influences weather and climate patterns around the globe (Brönnimann et al., 2007; Kuss and Gurdak, 2014; Chang et al., 2019). Therefore, ENSO has been selected as the climate change factor in this study.
In numerous locations worldwide, human activities have intensified to the point where they exceed the influence of climate change, making human activity the dominant factor affecting groundwater systems (Hao et al., 2016). Groundwater over-exploitation is the main factor leading to the change of groundwater hydrological process (Salameh, 2008; Li et al., 2013; Pophare et al., 2014; Qian et al., 2018; Li et al., 2022). Groundwater over-exploitation, particularly in areas like China’s Yangtze River Delta Plain (Wang et al., 2015; He et al., 2021; Xu et al., 2021), Huaibei Plain (Li and Gao, 2004; Zhu, 2013), and major coal mining areas (Xue and Zhang, 2016; Yin et al., 2016), has led to significant declines in groundwater levels and even land subsidence (Wang et al., 2013; Liu et al., 2019; Xue et al., 2022). The interplay between over-exploitation and climate change further complicates hydrological processes. Despite these challenges, research on the relationship between groundwater levels in such aquifers and climate patterns remains limited. This knowledge gap hampers the government’s ability to effectively manage groundwater resources and prevent mine water disasters.
This project aims to investigate the periodicities of four over-exploited groundwater level time-series recorded in various aquifers, and to assess the potential effects of precipitation and climatic teleconnections (ENSO) on groundwater using wavelet analysis. The monitoring wells, situated in the Pansan Coal Mine in Huainan City, China, observe different confined aquifers and types (porous and karst).
The study area is situated in the Panji District, northwest of Huainan City, Anhui Province, which comprises Panyi, Paner, Pansan and Zhuji Coal Mines. For this study, Pansan Coal Mine was chosen due to the availability of complete groundwater level data. The area is located in the Huaihe River alluvial plain, with a flat terrain and an elevation ranging from 18 to 22 m and abundant coal resources that have been mined since the 1980s. Stratigraphic sections include Sinian (Z), Cambrian (Є), Ordovician (O), Carboniferous (C), Permian (P, with coal-bearing strata), Palaeogene (E), Neogene (N), and Quaternary (Q) strata. The main outcropping strata is Quaternary deposits, occasionally with Cambrian and Sinian outcrops in the northern region (Figure 1).
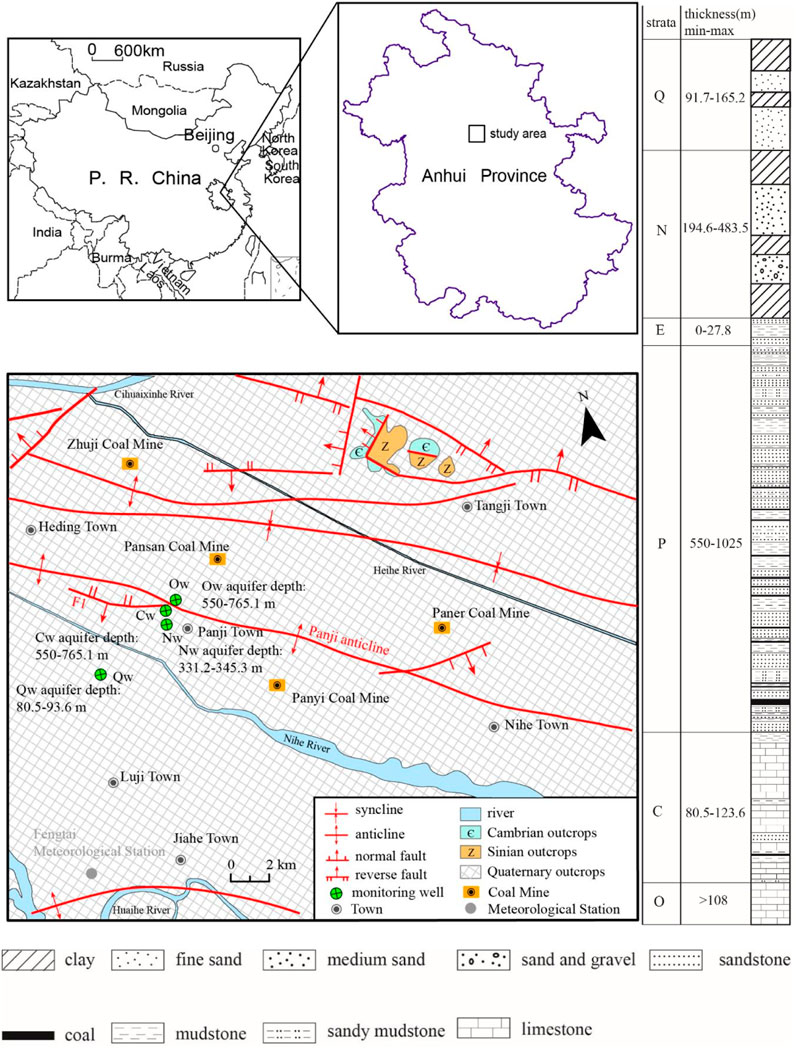
Figure 1. Location of groundwater monitoring wells and comprehensive stratigraphic column.
Pansan Coal Mine is located on the western part of the southern limb of the Panji Anticline within the Huainan Synclinorium, adjacent to the Panyi Mine. The overall structure is a monocline, with the strata trending in a NWW-SEE direction. The dip angle of the strata generally ranges from 5° to 10°, showing a trend of being steeper near the surface and gentler at greater depths. In some local sections, due to the influence of Fault F1, the dip angle increases to 30°–50°, and in some cases, the strata are even vertical. As a result of regional north-south compressional forces, secondary synclines and anticlines have developed within the coalfield.
The study area is located in the Huaihe River basin with its main water system being the Huaihe River and its tributary, the Mud River. It falls under a subtropical monsoon climate zone characterized by long winters and summers, and short springs and autumns, with distinct four seasons. The average annual temperature is 15.1°C, with an average of 2,298 h of sunshine per year. The annual average precipitation is 905.6 mm, with the highest recorded at 1,558 mm in 1991 and the lowest at 347 mm in 2001. Precipitation is mainly concentrated in the months of June to September. The average frost-free period lasts for 215.5 days per year.
The groundwater system comprises karst groundwater found in Cambrian, Ordovician, and Carboniferous strata, as well as porous groundwater distributed within loose Neogene and Quaternary sediments. These aquifers are distributed throughout the study area. The Quaternary aquifer group primarily receives recharge from vertical infiltration of atmospheric precipitation and surface water, with lateral recharge from rivers during the rainy season. In their natural state, the water levels fluctuate with seasonal variations, with the primary discharge methods being evaporation and artificial extraction. During the dry season, surface river water replenishes the aquifers. The Neogene aquifer is primarily replenished laterally through runoff. In its natural state, there is no hydraulic connection between the upper and lower aquifers. Under the influence of coal mining, groundwater is discharged into the mine through mining-induced fractures and underground boreholes. The development of karst fractures in limestone is uneven; near the outcrop in the northern area, the karst fractures are more developed, and the water-bearing capacity is strong. At the base of the Taiyuan Formation, a mudstone and aluminous mudstone aquitard exists, which under natural conditions limits the hydraulic connection between the Carboniferous and Ordovician aquifer groups. These aquifers primarily receive lateral recharge from runoff, and the discharge occurs through mining operations and drainage to the mine via fault fracture zones. To ensure safe mining operations and prevent water inrush accidents from high water pressure, groundwater is pumped to lower the water level. This process primarily involves extracting Neogene porous groundwater (monitoring well Nw), Carboniferous karst groundwater (monitoring well Cw), and Ordovician karst groundwater (monitoring well Ow), all of which impact the safety of coal mining. Additionally, Quaternary porous groundwater (monitoring well Qw) is extracted for production purposes.
The monthly precipitation data were acquired from the Fengtai meteorological stations of the National Climate Centre (http://data.cma.cn/). Monthly ENSO indices were determined by calculating the average sea surface temperature (SST) anomalies within the region spanning 5°N-5°S and 120–170°W. Monthly data for the ENSO teleconnection pattern were downloaded from the Climate Prediction Center of the National Weather Service website (http://www.cpc.ncep.noaa.gov). The Pansan coal mine began operations in 1992, and groundwater level data from January 2005 to December 2022 was collected. The four monitoring wells with the longest observation periods were selected for this study. The essential details of four monitoring wells are presented in Table 1. The mean monthly groundwater level was calculated by taking the arithmetic average of either three or six observations made during that month (three observations from January to April and October to December; six observations from May to September). Figure 2 displays the monthly precipitation sequences and the data for mean monthly groundwater levels.

Table 1. Groundwater monitoring wells.
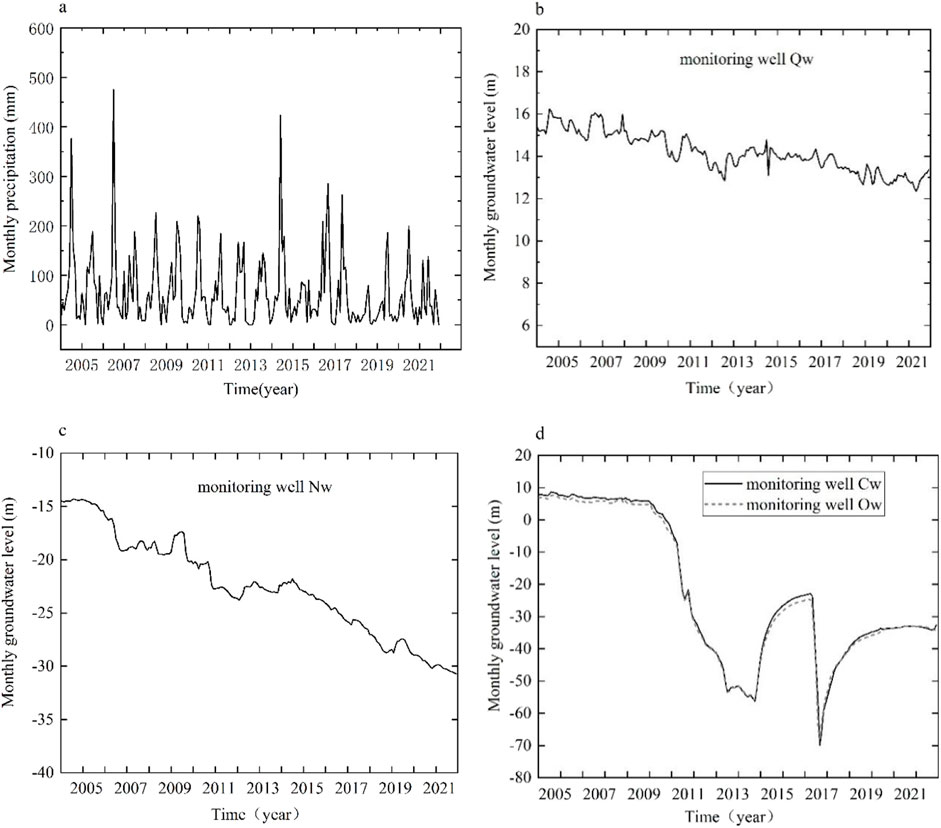
Figure 2. Monthly precipitation data and monthly groundwater level data from January 2005 to December 2022. (a) Monthly precipitation data, (b) Groundwater level in Quaternary pore aquifer (Qw), (c) Groundwater level in Neogene pore aquifer (Nw), (d) Groundwater levels in Carboniferous and Ordovician karst aquifer (Cw and Ow).
Figure 2 depicts a substantial decline in both porous groundwater and karst groundwater levels, with karst aquifers experiencing a maximum groundwater level difference of nearly 80 m. The underlying karst aquifer beneath the A coal seam is abundant in water, with initial groundwater levels of 17.11 m for the Carboniferous aquifer and 17.73 m for the Ordovician aquifer. The karst water pressure is particularly high. A stable aquiclude, with a thickness ranging from 9 to 21.8 m, separates the A coal seam from the karst water. However, the elevated water pressure and the potential connectivity of mining-induced fractures may lead to a water inrush accident in the coal mine. Therefore, the primary groundwater control measure for karst aquifers in the mine is to reduce water levels and pressure. This is achieved through the construction of underground boreholes for dewatering the karst water, thereby maintaining the water level within a safe range. This measure is a long-term water control strategy, requiring the continuous discharge of large volumes of karst water daily. Due to the lack of data on the volume of water discharged, a quantitative analysis cannot be performed at present. So human activities, such as groundwater extraction and mine dewatering, these activities greatly disrupt the groundwater flow system.
Wavelet analysis is a robust technique widely utilized in various domains for analyzing non-stationary time series like hydrological, atmospheric, other geophysical time series. It provides an efficient method to expand time series into time-frequency space, allowing for the identification of localized intermittent periodicities (Grinsted et al., 2004). A wavelet series represents a square-integrable function by utilizing an orthonormal series based on a wavelet. One of the most frequently applied time-frequency transformations is the Continuous Wavelet Transform (CWT). A wavelet function, represented as
In this context (Equation 1), we define the Morlet wavelet function using the following parameters: α for scale expansion, τ for dimensionless time shift, t for dimensionless time,
This equation defines the Morlet wavelet function (Equation 2), with
In this equation (Equation 3), the symbol “*” represents the complex conjugate.
The e-folding time is chosen to ensure that the wavelet power
When two Continuous Wavelet Transforms (CWTs) are analyzed together, the result is a Cross Wavelet Transform (XWT), which reveals the common power and represents the continuous wavelet cross-correlation in the time-frequency domain (Gedalof and Smith, 2001; Grinsted et al., 2004). The Cross Wavelet Transform (XWT) for two time series,
In this equation (Equation 4), the symbol “*” signifies the complex conjugate. The cross-correlation coefficients can be expressed as
Equation 5, S denotes a smoothing operator, while I and R represent the imaginary and real components of
The study area is located in eastern China, where ENSO (El Niño-Southern Oscillation) significantly influences precipitation patterns by altering the global atmospheric circulation. During the El Niño phase, the West Pacific Subtropical High generally shifts southward, weakening the monsoon and leading to reduced precipitation in eastern China. In contrast, during the La Niña phase, the West Pacific Subtropical High strengthens and moves northward, enhancing the southeast monsoon and bringing more precipitation to eastern China. ENSO also affects the timing and intensity of the monsoon system, further altering the spatial and temporal distribution of precipitation. El Niño events often trigger droughts or floods in the southern regions, while La Niña events are associated with increased drought risk in the north and a higher risk of flooding in the south.
To gain deeper insights into the fluctuations of precipitation, ENSO, and groundwater levels, we conduct an analysis of their oscillations using Continuous Wavelet Transform (CWT), as depicted in Figure 3. In the continuous wavelet plot, the colored shading corresponds to the wavelet magnitude, as illustrated in the color bar. The areas enclosed by thick black contours are designated as significant regions, with the thick black contour indicating the 5% significance level compared to red noise. We also highlight the Cone of Influence (COI), where edge effects remain relevant, using a lighter shade, signifying that wavelet analysis within the COI has been taken into account.
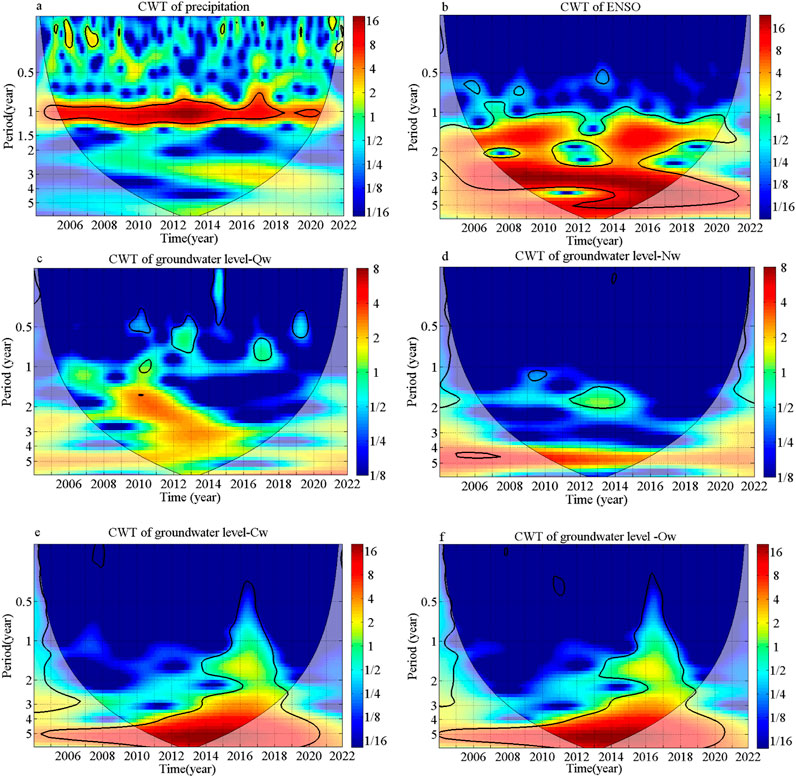
Figure 3. The continuous wavelet transform for precipitation, ENSO and groundwater levels: (a) CWT plot of precipitation; (b) CWT plot of ENSO; (c) CWT plot of groundwater level Qw; (d) CWT plot of groundwater level Nw; (e) CWT plot of groundwater level Cw; (f) CWT plot of groundwater level Ow.
For the precipitation, a typical yearly cycle is observed (Figure 3A). For the ENSO, the periodicities of 1–5 years are observed (Figure 3B). In contrast to the precipitation and the ENSO, the porous groundwater levels cannot be observed with continuous significant region. The periodicities of 0.5-year (2010-2011, 2013 and 2020), 1-year (2011) and 2-year (2012-2015) are observed for Qw and Nw (Figures 3C, D). However, the significant regions are very small and not the global maximum. For the karst aquifers, the power spectra of Cw and Ow are very similar, the periodicities of 1.5- and 5-year are observed for Cw and Ow (Figures 3E, F), with 5-year being the global maximum. The 5-year cycle is consistently present in a significant region, although a substantial portion of it falls outside the Cone of Influence (COI). This is primarily because the recorded time span is relatively short in comparison to the duration of the cycle.
As the dominant mode of global climate change, the ENSO is the primary factor influencing variability in global precipitation patterns (Dai et al., 1997). Groundwater is mainly supplied by atmospheric precipitation. To better understand the effects of how ENSO impacts the groundwater level, it is crucial to comprehend the relationship between ENSO and precipitation.
Figure 4 illustrates the cross-wavelet transform of precipitation and ENSO. In the cross-wavelet plot, the relative phase relationships are indicated by arrows. Arrows pointing to the right represent an in-phase relationship, signifying positive correlation, while arrows pointing to the left represent an anti-phase relationship, indicating negative correlation.
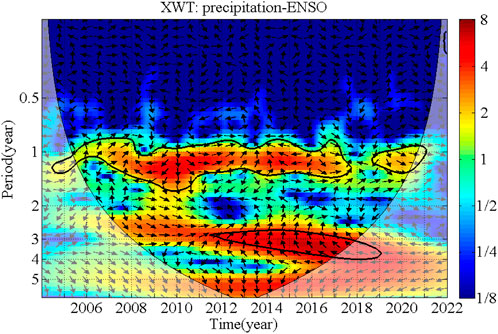
Figure 4. The cross wavelet transform between precipitation and ENSO.
A continuous significant region at the 1-year time scale is observed, enclosed by a thick black contour, except during 2018 and 2019 (Figure 4). Significant regions within the COI during 2012–2018 are observed at a 3-year time scale. In the significant areas of the cross-wavelet plots, the phase angle exhibits quicker changes within the 1-year periodicity band, while it shifts more gradually within the 3-year periodicity band. The findings indicate that precipitation in the study region is correlated with ENSO on both annual and interannual (3-year) time scales.
Figure 5 illustrates the cross-wavelet transform between groundwater levels and precipitation. In Figure 5A, the cross-wavelet between precipitation and Quaternary groundwater levels (Qw) shows a continuous significant region at the 1-year time scale spanning 2006 to 2018. Figure 5B shows the cross-wavelet transform between precipitation and Neogene groundwater levels (Nw), highlighting a significant region concentrated at the 1-year scale from 2009 to 2013, where an in-phase relationship suggests a complete positive correlation between the variables. In Figure 5C, the cross-wavelet between precipitation and Carboniferous groundwater levels (Cw) displays three intermittent significant regions: at 1-year scales during 2007–2009, 2011–2013, and 2016–2018; at a 3-year scale from 2015 to 2018 with an anti-phase relationship; and at a 5.5-year scale from 2013 to 2015 with an in-phase correlation. Similarly, Figure 5D shows the cross-wavelet between precipitation and Ordovician groundwater levels (Ow), revealing three intermittent significant regions: at 1-year scales during 2007–2008, 2011–2015, and 2016–2018; at a 3-year scale from 2015 to 2018 with an anti-phase correlation; and at a 5.5-year scale from 2013 to 2015 with an in-phase correlation. The results showed that precipitation is correlated with porous groundwater level on annual time scales and with karst groundwater level on annual and inter-annual (3- and 5.5-year) time scales.
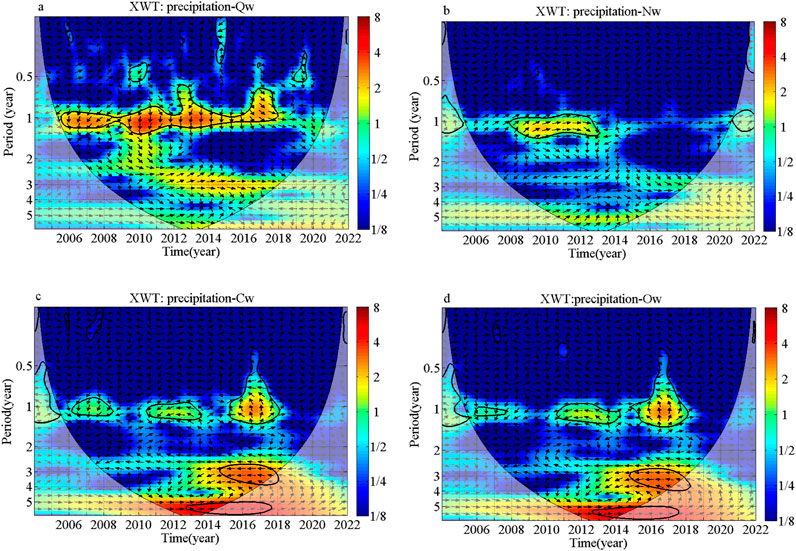
Figure 5. The cross wavelet transform between precipitation and groundwater levels: (a) XWT plot of precipitation and groundwater level Qw; (b) XWT plot of precipitation and groundwater level Nw; (c) XWT plot of precipitation and groundwater level Cw; (d) XWT plot of precipitation and groundwater level Ow.
The cross wavelet analyses of ENSO and groundwater levels are shown in Figure 6. The cross-wavelet transform between ENSO and Quaternary groundwater levels (Qw) (Figure 6A) reveals distinct intermittent significant regions at the 1-year time scale during 2007–2008, 2010–2012, and 2014–2016. The periodicities of 2.5- and 3-year are distributed in 2008–2011 and 2011-2016 respectively, with 3-year being the global maximum. The cross-wavelet analysis between ENSO and Neogene groundwater levels (Nw) (Figure 6B) reveals three clusters of significant regions at different time scales: 1.5-year (2007–2017, 2020), 2.8-year (2008–2011) within the COI, and 5-year (2011–2017), with an in-phase correlation. The 5-year time scale represents the global maximum. For the karst groundwater, the significant regions in the power spectra are very similar (Figures 6C, D). The cross-wavelet analysis between ENSO and Carboniferous groundwater levels (Cw) (Figure 6C) reveals significant regions at a 1.5-year time scale during the periods 2008–2012 and 2014–2019. The periodicities of 3- and 5-year within the COI are distributed in 2009–2018 and 2011-2016 respectively, and 5-year is the global maximum. For the Ordovician groundwater level (Ow), Same as the Carboniferous groundwater level, the wavelet spectrum shows three periods of 1.5-, 3- and 5-year too (Figure 6D). The significant regions are identical to those of the Carboniferous groundwater level, except for the period of 1.5-year (2010–2011, 2014–2019). Thus, ENSO influences Quaternary groundwater levels on both annual and inter-annual time scales, while its impact on Neogene, Carboniferous, and Ordovician groundwater levels occurs primarily on inter-annual time scales.
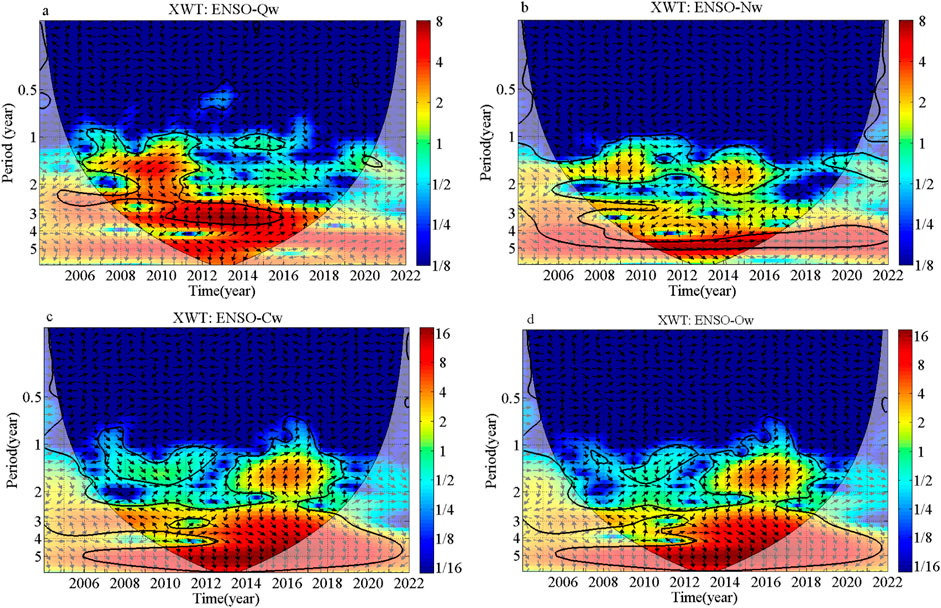
Figure 6. The cross wavelet transform between ENSO and groundwater levels: (a) XWT plot of ENSO and groundwater level Qw; (b) XWT plot of ENSO and groundwater level Nw; (c) XWT plot of ENSO and groundwater level Cw; (d) XWT plot of ENSO and groundwater level Ow.
The Continuous Wavelet Transform study revealed a significant regions reduction in over-exploited groundwater level (Figure 3). In its natural state, groundwater levels exhibit distinct significant regions and periods in CWT plots (Liesch and Wunsch, 2019; Neves et al., 2019). Cross Wavelet Transform results show that both precipitation and ENSO climate patterns continue to impact groundwater levels at Pansan Coal Mine, with varying effects over different time scales.
Regarding precipitation and groundwater levels, there are noteworthy regions of wavelet correlation at a 1-year time scale for both porous and karst groundwater levels. Additionally, when analyzing the cross-wavelet transform between precipitation and karst groundwater level, intermittent significant regions emerge at 3-year and 5.5-year time scales. Therefore, precipitation significantly impacts porous groundwater levels on an annual time scale and influences karst groundwater levels on both annual and interannual time scales. For the ENSO and groundwater levels, all groundwater levels show resonance period beyond the 1-year cycle, in addition to the 1-year period observed in the Quaternary groundwater level. ENSO has a significant impact on Quaternary groundwater levels at both annual and inter-annual time scales, while it influences Neogene groundwater levels and karst groundwater primarily on inter-annual time scales.
The Cross Wavelet Transform analysis shows similar resonance periods and significant regions between karst groundwater levels and precipitation, ENSO (Figures 5C, D). Considering the geological conditions, monitoring wells Cw and Ow are located in the Panji anticline and F1 fault tectonic belt (Figure 1). Stratigraphic data from boreholes reveal that the water-conducting fault (F1) intersects with Ordovician limestone, indicating a hydraulic connection between the Carboniferous and Ordovician karst groundwater due to tectonic water conduction. Furthermore, the consistent changes in Cw and Ow groundwater levels further support this conclusion (Figure 2D). Consequently, precipitation and ENSO signals can rapidly influence over-exploited karst aquifers through this water-conducting structure.
In summary, excessive groundwater extraction can significantly lower groundwater levels, especially in karst aquifers deeper than 400 m, causing drops of over 80 m. This reduction shrinks the significant regions in Continuous Wavelet Transform plots over the recorded time span. Groundwater levels, however, remain sensitive to precipitation and ENSO signals. Despite the impact of human extraction activities on groundwater, the resonance periods between precipitation, ENSO, and groundwater levels remain unchanged. Even in cases of over-exploited groundwater, precipitation and ENSO signals can infiltrate the aquifer through pores, fractures, and structures.
This research utilized wavelet analyses to examine four groundwater level time series from the heavily exploited Pansan Coal Mine. The objective was to evaluate the potential effects of precipitation and the El Niño-Southern Oscillation (ENSO) on long-term variations in groundwater levels. The main findings and conclusions of the study can be summarized as follows:
(1) The Continuous Wavelet Transform reveals that the Quaternary groundwater level exhibits periodicities of 0.5- and 1-year, while the Neogene groundwater level has a 2-year periodicity. However, due to groundwater over-extraction, these periods are only observed in isolated years, with limited significant regions. Karst water exhibits periodicities of 1.5- and 5-year, with the 5-year being the dominant period with the highest power concentration.
(2) Cross Wavelet Transform analysis reveals strong correlations between groundwater and precipitation across various periodicities. Precipitation is correlated with porous groundwater levels annual time scale and with karst groundwater levels on both annual and inter-annual (3- and 5.5-year) time scales.
(3) Cross Wavelet Transform reveals significant correlations between groundwater levels and ENSO at various time scales. The Quaternary groundwater level shows periodicities of 1-, 2.5-, and 3-year, while the Neogene groundwater level exhibits periodicities of 1.5-, 2.8-, and 5-year. The Carboniferous and Ordovician groundwater levels resonate with ENSO at the same periods of 1.5-, 3-, and 5-year. ENSO strongly influences the Quaternary groundwater level annual and inter-annual time scales, and the Neogene and karst groundwater levels at inter-annual time scales.
(4) The Carboniferous and Ordovician aquifers are hydraulically connected, allowing both precipitation and ENSO signals to simultaneously reach these aquifers through conducting-water structure.
The raw data supporting the conclusions of this article will be made available by the authors, without undue reservation.
XZ: Conceptualization, Software, Validation, Visualization, Writing–original draft, Writing–review and editing. SH: Formal Analysis, Investigation, Writing–review and editing. HS: Validation, Writing–original draft, Writing–review and editing. WG: Funding acquisition, Project administration, Writing–original draft, Writing–review and editing.
The author(s) declare that financial support was received for the research, authorship, and/or publication of this article. This research was funded by China Geological Survey (Grant No. DD20221732, DD20230116), and by Science and Technology Project of Jiangxi Provincial Water Resources Department, China (Grant No. 202425YBKT19), and by Nanchang Institute of Technology Student Innovation and Entrepreneurship Training Program Projects (Grant No. S202311319006, 202411319004).
SH was employed by the Huaihe Energy Group.
The remaining authors declare that the research was conducted in the absence of any commercial or financial relationships that could be construed as a potential conflict of interest.
The author(s) declare that no Generative AI was used in the creation of this manuscript.
All claims expressed in this article are solely those of the authors and do not necessarily represent those of their affiliated organizations, or those of the publisher, the editors and the reviewers. Any product that may be evaluated in this article, or claim that may be made by its manufacturer, is not guaranteed or endorsed by the publisher.
Brönnimann, S., Xoplaki, E., Casty, C., Pauling, A., and Luterbacher, J. (2007). ENSO influence on Europe during the last centuries. Clim. Dynam. 28 (2–3), 181–197. doi:10.1007/s00382-006-0175-z
Chang, X., Wang, B., Yan, Y., Hao, Y., and Zhang, M. (2019). Characterizing effects of monsoons and climate teleconnections on precipitation in China using wavelet coherence and global coherence. Clim. Dynam. 52, 5213–5228. doi:10.1007/s00382-018-4439-1
Dai, A., Fung, I. Y., and Genio, A. D. D. (1997). “Surface observed global land precipitation variations during 1900–1988,”J. Clim., 10. 2943–2962. doi:10.1175/1520-0442(1997)010<2943:SOGLPV>2.0
Dong, L., Shimada, J., Kagabu, M., and Fu, C. (2015). Teleconnection and climatic oscillation in aquifer water level in Kumamoto plain, Japan. Hydrol. Process. 29 (7), 1687–1703. doi:10.1002/hyp.10291
Gedalof, Z., and Smith, D. J. (2001). Interdecadal climate variability and regime-scale shifts in Pacific North America. Geophys. Res. Lett. 28, 1515–1518. doi:10.1029/2000GL011779
Grinsted, A., Moore, J. C., and Jevrejeva, S. (2004). Application of the cross wavelet transform and wavelet coherence to geophysical time series. Nonlinear Proc. geoph. 11 (5/6), 561–566. doi:10.5194/npg-11-561-2004
Gurdak, J. J., Hanson, R. T., McMahon, P. B., Bruce, B. W., McCray, J. E., Thyne, G. D., et al. (2007). Climate variability controls on unsaturated water and chemical movement, high plains aquifer, USA. Vadose Zone J. 6 (2), 533–547. doi:10.2136/vzj2006.0087
Hao, Y., Zhang, J., Wang, J., Li, R., Hao, P., and Zhan, H. (2016). How does the anthropogenic activity affect the spring discharge? J. Hydrol. 540, 1053–1065. doi:10.1016/j.jhydrol.2016.07.024
He, L., Hou, M., Chen, S., Zhang, J., Chen, J., and Qi, H. (2021). Construction of a spatio-temporal coupling model for groundwater level prediction: a case study of Changwu area, Yangtze River Delta region of China. Water Supply 21 (7), 3790–3809. doi:10.2166/ws.2021.140
Holman, I. P., Rivas-Casado, M., Bloomfield, J. P., and Gurdak, J. J. (2011). Identifying non-stationary groundwater level response to North Atlantic ocean-atmosphere teleconnection patterns using wavelet coherence. Hydrogeol. J. 19, 1269–1278. doi:10.1007/s10040-011-0755-9
Intergovernmental Panel on Climate Change (IPCC) (2012). “Summary for policy makers,” in Managing the risks of extreme events and disasters to advance climate change adaptation. Editor C. B. Field (Cambridge: Cambridge University Press).
Kriechbaumer, T., Angus, A., Parsons, D., and Casado, M. R. (2014). An improved wavelet-ARIMA approach for forecasting metal prices. Resour. Policy. 39, 32–41. doi:10.1016/j.resourpol.2013.10.005
Kuss, A. J. M., and Gurdak, J. J. (2014). Groundwater level response in U.S. principal aquifers to ENSO, NAO, PDO, and AMO. J. Hydrol. 519, 1939–1952. doi:10.1016/j.jhydrol.2014.09.069
Li, F., Feng, P., Zhang, W., and Zhang, T. (2013). An integrated groundwater management mode based on control indexes of groundwater quantity and level. Water Resour. manage. 27, 3273–3292. doi:10.1007/s11269-013-0346-8
Li, H., Du, X., Lu, X., and Fang, M. (2022). Analysis of groundwater overexploitation based on groundwater regime information. Ground water 61 (5), 692–705. doi:10.1111/gwat.13285
Li, Y., and Gao, G. (2004). Ground subsidence in areas of loose porous aquifers. Acta Geol. Sin. – Engl. 78, 829–837. doi:10.1111/j.1755-6724.2004.tb00203.x
Liesch, T., and Wunsch, A. (2019). Aquifer responses to long-term climatic periodicities. J. Hydrol. 572, 226–242. doi:10.1016/j.jhydrol.2019.02.060
Liu, J., Song, Z., Lu, Y., Bai, Y., Qian, W., Kanungo, D. P., et al. (2019). Monitoring of vertical deformation response to water draining–recharging conditions using BOFDA-based distributed optical fiber sensors. Environ. Earth Sci. 78, 406. doi:10.1007/s12665-019-8409-7
Neves, M. C., Jerez, S., and Trigo, R. M. (2019). The response of piezometric levels in Portugal to NAO, EA, and SCAND climate patterns. J. Hydrol. 568, 1105–1117. doi:10.1016/j.jhydrol.2018.11.054
Perez-Valdivia, C., Sauchyn, D., and Vanstone, J. (2012). Groundwater levels and teleconnection patterns in the Canadian Prairies. Water Resour. Res. 48 (7). doi:10.1029/2011WR010930
Pophare, A. M., Lamsoge, B. R., Katpatal, Y. B., and Nawale, V. P. (2014). Impact of over-exploitation on groundwater quality: a case study from WR-2 Watershed, India. J. Earth Syst. Sci. 123, 1541–1566. doi:10.1007/s12040-014-0478-0
Qian, J., Peng, Y., Zhao, W., Ma, L., He, X., and Lu, Y. (2018). Hydrochemical processes and evolution of karst groundwater in the northeastern Huaibei plain, China. Hydrogeol. J. 26, 1721–1729. doi:10.1007/s10040-018-1805-3
Rust, W., Holman, I., Corstanje, R., Bloomfield, J., and Cuthbert, M. (2018). A conceptual model for climatic teleconnection signal control on groundwater variability in Europe. Earth Sci. Rev. 177, 164–174. doi:10.1016/j.earscirev.2017.09.017
Salameh, E. (2008). Over-exploitation of groundwater resources and their environmental and socio-economic implications: the case of Jordan. Water Int. 33 (1), 55–68. doi:10.1080/02508060801927663
Torrence, C., and Compo, G. P. (1998). A practical guide to wavelet analysis. Bull. Am. Meteorol. Soc. 79(1), 61–78. doi:10.1175/1520-0477(1998)079<0061:apgtwa>2.0.co;2
Tremblay, L., Larocque, M., Anctil, F., and Rivard, C. (2011). Teleconnections and interannual variability in Canadian groundwater levels. J. Hydrol. 410, 178–188. doi:10.1016/j.jhydrol.2011.12.019
Wang, F., Miao, L., and Lu, W. (2013). Sand creep as a factor in land subsidence during groundwater level recovery in the southern Yangtze River delta, China. Bull. Eng. Geol. Environ. 72, 273–283. doi:10.1007/s10064-013-0474-7
Wang, G., Zhang, D., Feng, J., Chen, M., and Shan, W. (2015). Land subsidence due to deep groundwater withdrawal in northern Yangtze River Delta area. Eng. Geol. Soc. Territ. (5), 125–129. doi:10.1007/978-3-319-09048-1_25
Wang, Y., Yang, W., Li, M., and Liu, X. (2012). Risk assessment of floor water inrush in coal mines based on secondary fuzzy comprehensive evaluation. Int. J. Rock Mech. Min. Sci. 52, 50–55. doi:10.1016/j.ijrmms.2012.03.006
Xu, S., Chen, H., Wang, G., Huang, J., Che, Z., Gong, Y., et al. (2021). Analysis on mechanism of geosuture in henglin area, changzhou city, jiangsu Province. East China Geol. 42 (1), 93–99. (in Chinese). doi:10.16788/j.hddz.32-1865/P.2021.01.011
Xue, W., Hou, E., Zhao, X., Ye, Y., Tsangaratos, P., Ilia, I., et al. (2023). Discriminant analysis of water inrush sources in the weibei coalfield, shaanxi Province, China. Water 15, 453. doi:10.3390/w15030453
Xue, Y., Chen, H., Kong, F., Li, Z., Qiu, D., Chen, Q., et al. (2022). Land subsidence calculation model under the coupling effect of groundwater and coal mining. Earth Sci. Inf. 15, 2689–2701. doi:10.1007/s12145-022-00855-y
Xue, Y., and Zhang, Y. (2016). Land subsidence and land fissures in the southern Yangtze River Delta. East China Geol. (1), 1–9. (in Chinese). doi:10.16788/j.hddz.32-1865/P.2016.01.001
Yin, S., Han, Y., Zhang, Y., and Zhang, J. (2016). Depletion control and analysis for groundwater protection and sustainability in the Xingtai region of China. Environ. Earth Sci. 75, 1246. doi:10.1007/s12665-016-6044-0
Zhang, J., Hao, Y., Hu, B. X., Huo, X., Hao, P., and Liu, Z. (2016). The effects of monsoons and climate teleconnections on the Niangziguan karst spring discharge in North China. Clim. Dynam. 48, 53–70. doi:10.1007/s00382-016-3062-2
Keywords: coal mine groundwater, over-exploited, climate change, Enso, precipitation, wavelet transform
Citation: Zhou X, He S, Sang H and Ge W (2025) Response of groundwater levels to ENSO under the influence of mining. Front. Earth Sci. 13:1542367. doi: 10.3389/feart.2025.1542367
Received: 09 December 2024; Accepted: 28 February 2025;
Published: 19 March 2025.
Edited by:
Qiang Liu, Beijing Normal University, ChinaReviewed by:
Ramanathan Alagappan, Jawaharlal Nehru University, IndiaCopyright © 2025 Zhou, He, Sang and Ge. This is an open-access article distributed under the terms of the Creative Commons Attribution License (CC BY). The use, distribution or reproduction in other forums is permitted, provided the original author(s) and the copyright owner(s) are credited and that the original publication in this journal is cited, in accordance with accepted academic practice. No use, distribution or reproduction is permitted which does not comply with these terms.
*Correspondence: Weiya Ge, Z2V3eUBtYWlsLmNncy5nb3YuY24=
Disclaimer: All claims expressed in this article are solely those of the authors and do not necessarily represent those of their affiliated organizations, or those of the publisher, the editors and the reviewers. Any product that may be evaluated in this article or claim that may be made by its manufacturer is not guaranteed or endorsed by the publisher.
Research integrity at Frontiers
Learn more about the work of our research integrity team to safeguard the quality of each article we publish.