 Xudong Wang
 Nansheng Qiu3*
 Cong Chen
94% of researchers rate our articles as excellent or good
Learn more about the work of our research integrity team to safeguard the quality of each article we publish.
Find out more
ORIGINAL RESEARCH article
Front. Earth Sci., 19 March 2025
Sec. Geochemistry
Volume 13 - 2025 | https://doi.org/10.3389/feart.2025.1541669
The exploration of natural gas in the Baiyun Sag of the Pearl River Mouth Basin (PRMB), South China Sea have attracted extensive attentions in recent years. However, considerable controversy remains regarding the origin and main source rocks for the discovered natural gas in this area. In this study, we established a quantitative method for distinguishing the origin and source rock of natural gas by combining geochemical indicators and chemical kinetics. The results show that the natural gas in the Well Y5 block on the northern slope of Baiyun Sag was of thermogenic origin and are mainly derived from Paleogene source rocks with minor contribution of natural gas generated by oil cracking below layer ZH440. The crude oil cracking gas accounts for approximately 6%. The mixture of kerogen degradation gas with a small amount of crude oil cracking gas caused an inversion in the carbon isotope sequence of ethane and propane. The natural gas in the well Y5 area was mainly generated from delta and shallow lake source rocks after 11 Ma. The findings suggest that natural gas was accumulated in shallow, high-quality reservoirs in the early stage and deep, tight reservoirs in the late stage.
The kinetics of hydrocarbon generation from organic matter represents a pivotal research direction in the exploration and development of oil and gas resources, aiming to elucidate the dynamic mechanisms underlying the conversion of organic matter within source rocks into hydrocarbons during geological processes. Generally speaking, there exist certain differences in the types of oil and gas resources generated from different types of organic matter, which can be broadly categorized into three main types: Type I organic matter, with aquatic organisms as a significant source, primarily generates oil; Type II organic matter, encompassing both aquatic and terrestrial plant sources, produces both oil and gas, exhibiting a characteristic of early oil and late gas generation; and Type III organic matter, primarily derived from terrestrial plants, predominantly generates gas (Tissot and Welte, 1984). Furthermore, during the process of hydrocarbon formation from organic matter, as kerogen undergoes thermal cracking, the early-formed liquid hydrocarbons also undergo crude oil cracking under thermal action, producing a certain amount of secondary cracked gaseous hydrocarbons (Horsfield et al., 1992; Behar et al., 1992). These secondary cracked gaseous hydrocarbons differ from the natural gas directly generated from kerogen cracking in terms of hydrocarbon composition and carbon isotope signatures (Prinzhofer and Huc, 1995). Clarifying the composition of both within oil and gas reservoirs holds significant importance for oil and gas exploration.
The chemical kinetic theory introduced by Maier (Maier and Zimmerly, 1924) and Allred (Allred, 1966) was applied to the dry distillation process of shale oil and coal in the early stage of the development of chemical kinetic theory. Since the 1970s, chemical kinetic theory has been widely used to study the generation process of hydrocarbons from kerogen in source rocks (Tissot and Welte, 1984). Research on the kinetics of hydrocarbon generation from organic matter (OM) has gone through three stages (basic understanding, rapid development, and in-depth understanding), with research progressing from establishing the model and optimizing the parameters to applying the model in the evaluation of oil and gas resources and finally to studying the hydrocarbon generation kinetics of single compounds along with the influence of the uncertainty in kinetic parameters on the results in geologic applications (Wang et al., 2011; Wang et al., 2023; Pepper and Corvi, 1995). At present, four types of kinetic models are commonly used: the overall reaction model (Wang et al., 2023), the Friedman reaction model (Klomp and Wright, 1990; Dieckmann, 2005; Zhang et al., 2009), the sequential reaction model (Behar et al., 1992; Behar et al., 2008), and the parallel reaction model (Ungerer, 1990; Burnham et al., 1995).
After consideration of factors including the principle and accuracy of the model and the difficulty in applying the model, we selected the parallel first-order reaction model for use in this study. The applicability and practicability of a limited number of parallel first-order reaction models have been demonstrated (Lu et al., 1997). The isotope fractionation kinetic model is based on the hydrocarbon generation kinetic model and, when combined with the geologic background, can be used to clarify the mechanism of natural gas accumulation and gas source (Cramer et al., 2001; Zou et al., 2006; Li et al., 2011; Zhang et al., 2015; Jiang et al., 2022; Zhu et al., 2008).
The Baiyun Sag is located in the deep-water area of the northern continental slope of the South China Sea. The Baiyun Sag is a secondary structural unit inside the Zhu II Depression of the Pearl River Mouth Basin (PRMB) (Figure 1). The Baiyun Sag has greatly variable water depth and can be divided into four sub-sags: the Baiyun main sub-sag, the west sub-sag, the east sub-sag, and the south sub-sag (Jiang et al., 2022; Jiang et al., 2021). It has the most complete Mesozoic and Cenozoic strata in PRMB. The deep-water area of the Baiyun Sag is dominated by natural gas (Zhang et al., 2014; Wang et al., 2022) with considerable amount of oil. The natural gas is mainly of thermogenic origin. The commercial gas reservoirs in the Baiyun Sag are mainly found in the northern part of the Baiyun main sub–sag, the Panyu low uplift, and the nose-shaped structural belt from wells W3-4 to H29 in the eastern part of the Baiyun main sag (Figure 1). The majority of natural gas pools stratigraphically occurs in the lower Oligocene Zhujiang Formation, and some natural gas accumulations are also found in the Well H19 block of the shallower Miocene Hanjiang Formation and Yuehai Formation. Condensate reservoirs with high gas-to-oil ratios occur in the northern part of the Baiyun main sag to the Panyu low uplift. While condensates with lower gas-to-oil ratios were discovered in wells W3-4, H28, and H29 in the eastern part of the Baiyun main sub-sag. In addition, the condensates in these two areas have different maturation levels.
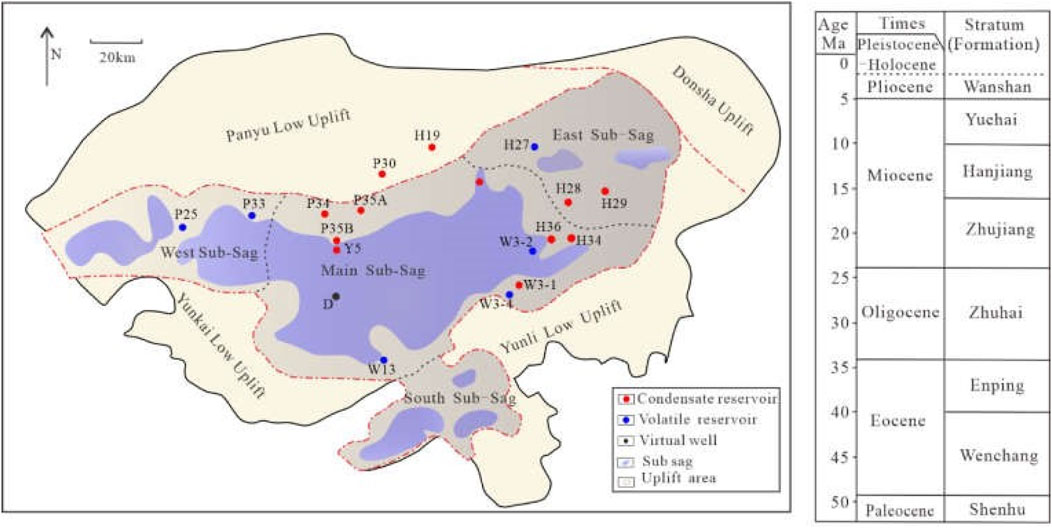
Figure 1. Geological map showing the location of the Baiyun sag, the schematic structural units and the stratigraphic column showing the lithology and age of cenozoic formations.
There is a lack of research on the gas generation characteristics of the main gas source rocks in this area along with the contributions of different gas sources to gas accumulation. Multiple sets of source rocks in the Paleogene Wenchang–Enping Formation have reached the mature and overmature stages due to the high heat flow and high geothermal gradient in Baiyun Sag (Mi et al., 2018a; Peng et al., 2023; Mi et al., 2018b); these source rocks generate a complete oil and gas sequence of light oil, kerogen degradation gas, and crude oil cracking gas. However, substantial disputes remain regarding the contributions of different source rocks to gas accumulation in the study area (Zhu et al., 2012; Pang et al., 2018; Long et al., 2020; Ping et al., 2019). These different opinions arise mainly because relatively few exploratory wells have encountered Paleogene mudstone in this area, and there is a lack of drilling data on source rocks. In addition, the study area is located in the ocean–continent transition zone, which contains various types of coal measures and lacustrine source rocks; there is a lack of systematic research on the gas generation characteristics of different types of source rocks.
The gas reservoir in Well Y5 is a typical reservoir in the northern slope of Baiyun Sag. The gas-bearing intervals are the lower section of the Zhujiang Formation, the Zhuhai Formation, and the top of the Enping Formation. The lithology is mainly fine sandstone, coarse sandstone, medium sandstone, and siltstone. Well Y5 shows the existence of two natural gas accumulation systems: the upper system is a shallow atmospheric reservoir formation system (reservoirs ZJ490–ZH420, depth = 3910–4790 m); and the lower system is a deep overpressure reservoir formation system (reservoirs ZH440–EP210, depth = 4790–5113 m). The inconsistency in reservoir pressure indicates that these two systems have different natural gas origins and reservoir formation histories.
In this study, we took the well Y5 area as an example site for the analysis of the genetic types and sources of natural gas. First, various geochemical indicators were used to distinguish the sources of natural gas, and we established a quantitative method for identifying the origin of natural gas based on the carbon isotope sequences of the gas. A chemical kinetic model of natural gas generation and isotope fractionation data were then used to clarify the gas source and time of reservoir formation.
Seven samples, including four source rock samples (Table 1) and three crude oil samples, were obtained from the Pearl River Mouth Basin for hydrocarbon generation experiments. The OM type of the two source rock samples from the wells W13 and W3-4 was type II1, and the gas produced was a mixture of kerogen degradation gas and crude oil cracking gas. The OM types of the source rocks from wells P33 and H36 were type II2 and type II1–II2, respectively, and the gas produced was mainly kerogen degradation gas. Different types of gas source rocks were selected to provide a basis for establishing a chart for determining the genesis of natural gas. A normal crude oil sample (F14) from the semi-deep lacustrine facies of the Wenchang Formation, a heavy oil sample (F7) from the shallow lacustrine facies to semi-deep lacustrine facies of the Zhujiang Formation, and a condensate oil sample (Y25) from the shallow lacustrine facies of the Zhujiang Formation were selected.
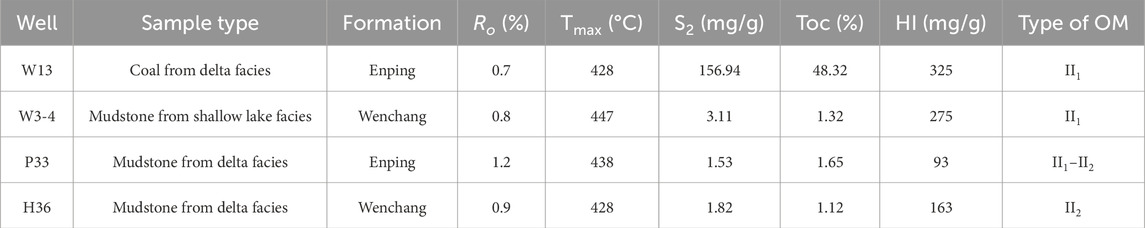
Table 1. Basic geochemical parameters of the samples.
We designed and carried out a thermal simulation in a gold tube under variable pressure to reflect the true process of hydrocarbon generation under geologic conditions. The simulation included a total of 12 pressures (60–115 MPa in intervals of approximately 5 MPa), and the temperature was increased from 200°C to 600°C at a heating rate of 2°C/h or 20°C/h. The pressure fluctuation was less than 0.5 MPa, and the temperature fluctuation was less than 1°C. One autoclave was removed at every temperature point with a temperature interval of approximately 25°C, and the gold tube in the autoclave was taken out while it was cooling. The gold tube was placed into the vacuum system to release gas into the vacuum system, and the gas was collected for the determination of gas composition and isotopic composition. The gas composition was analyzed using an Agilent 7890N gas chromatograph with a Porplot Q column (30 m × 0.25 mm × 0.25 μm) and nitrogen as the carrier gas. The heating program was set to maintain a constant temperature of 50°C for 2 min followed by a heating rate of 4°C/min to 180°C and maintaining a constant temperature of 180°C for 15 min. The isotopic composition was analyzed using a Delta V Advantage gas chromatograph–isotope mass spectrometer with a Porplot Q chromatographic column (30 m × 0.32 mm × 0.25 μm) and helium as the carrier gas. The heating program was set as follows: the initial temperature of 40°C was maintained for 3 min followed by heating at 10°C/min to 180°C and maintaining the temperature at 180°C for 10 min. The error in the experimental results was controlled within ±0.3‰.
The molecular composition of the gas samples was analyzed at State Key Laboratory of Petroleum Resources and Engineering using an Agilent 7890 gas chromatograph, which was equipped with both a flame ionization detector and a thermal conductivity detector. For this analysis, four columns featuring 1/8-inch nickel tubing were employed to separate individual hydrocarbon gas components ranging from C1 to C5. These columns included a 2-foot section of 12% UCW982 on PAW 80/100 mesh, a 15-foot section of 25% DC200 on PAW 80/100 mesh, a 10-foot Hayesep column with 80/100 mesh, and a 10-foot Molecular Sieve 13 × 45/60 mesh column. The GC oven temperature was initially maintained at 70°C for 5 min, then increased to 180°C at a rate of 15°C/min, and held at 180°C for an additional 15 min. Corrections were made for both oxygen and nitrogen in all gas compositions.
Stable carbon isotope values were determined using a Thermo Delta V mass spectrometer interfaced with a Thermo Trace GC Ultra gas chromatograph, both located at State Key Laboratory of Petroleum Resources and Engineering. Here, individual hydrocarbon gas components (C1–C4) and CO2 were separated on a gas chromatograph utilizing a fused silica capillary column (PLOT0, 27.5 m × 0.32 mm × 10 μm). These components were then converted into CO2 in a combustion interface and injected into the mass spectrometer. The GC oven temperature was programmed to increase from 33°C to 80°C at 8 °C/min, then to 250°C at 5 °C/min, with the final temperature maintained for 10 min. Gas samples were analyzed in triplicate, and the stable carbon isotopic values are reported using the δ-notation in per mil (‰) relative to the Vienna Peedee Belemnite standard (VPDB). The precision for individual components in the molecular δ13C analysis is ±0.5%. Stable hydrogen isotopes were measured using a GC/TC/RMS mass spectrometer at State Key Laboratory of Petroleum Resources and Engineering, which comprises a Trace GC Ultra gas chromatograph interfaced with a micropyrolysis furnace (operating at 1450°C) in line with a Finnigan MAT253 isotope ratio mass spectrometer. Gas components were separated on an HP-PLOT O column (30 m × 0.32 mm × 20 μm) using helium as the carrier gas at a flow rate of 1.5 mL/min. After high-temperature thermal conversion, gases were cracked into H2 and injected into the mass spectrometer. Split injection was used for methane with a ratio of 1:7 and a constant temperature of 40°C, while non-split injection was used for ethane and propane. The temperature program for the GC oven was as follows: an initial temperature of 40°C held for 4 min, increased to 80°C at 10 °C/min, then to 140°C at 5 °C/min, and finally heated to 260°C at 30 °C/min. The pyrolysis oven temperature was maintained at 1450°C to convert gas components into C and H2, with the H2 subsequently analyzed by the mass spectrometer. The stable hydrogen isotopic ratio (δ2H) values are reported using the δ-notation in per mil (%) relative to the standard mean ocean water (VSMOW). The reproducibility and precision of isotope values are expected to be ±3%.
The parallel first-order reaction model assumes that the hydrocarbon generation process of OM is composed of N parallel first-order reactions (Lu et al., 1997). The activation energy, pre–exponential factor, and original hydrocarbon generation potential of OM corresponding to each reaction are given by Ei, Ai, and Xi0 (i = 1, 2, 3, … , N), respectively. When a certain reaction time t is reached, the amount of hydrocarbon generation of the ith reaction is Xi, and
where Ki is the reaction rate constant of the ith hydrocarbon generation reaction, which can be obtained according to the Arrhenius formula:
Under laboratory conditions, the pyrolysis of OM is carried out at a constant rate of temperature increase. Assuming that this rate of temperature increase is D in °C min–1, we have
Combining the above formulas, the hydrocarbon generation amount of the ith reaction can be obtained as follows:
The total hydrocarbon generation amount of N parallel first-order reactions X is then given by\
Based on a comparison of existing isotope kinetic models (Lu et al., 2006), the isotope kinetic model based on the Cramer III model is ideal for quantitatively describing isotopic fractionation in geologic applications. In this isotope kinetic model, 12CH4 and 13CH4 are regarded as two different products, and their kinetic parameters are calculated separately. In the Cramer III model, the formation of methane is regarded as the result of n first-order reactions. For each reaction, the generation rates of 12CH4 and 13CH4 are different:
The carbon isotope ratio model of cumulatively produced methane is written as
where ki12c and ki13c are the rate coefficients for 12CH4 and 13CH4 generation in the ith reaction, respectively; ci12c and ci13c are the cumulative 12CH4 and 13CH4 production amounts at time t of the ith reaction, respectively; and fi012c and fi013c are the hydrocarbon generation potentials of 12CH4 and 13CH4 in the ith reaction, respectively, and are equal to the product of the corresponding reaction fraction and the total hydrocarbon generation potential. For the determination of chemical kinetic parameters, it is first necessary to establish an objective function with constraints and then perform variable-scale optimization.
Figures 2, 3 show the curves of the conversion rates of methane and total gas (C1–5) components and the variations of carbon isotope value of methane with temperature. As the degree of thermal maturity increased, the conversion rate of OM to methane and total hydrocarbon gas components (C1–5) gradually increased. Moreover, the carbon isotope value of methane first decreased and then increased with the thermal evolution of OM.
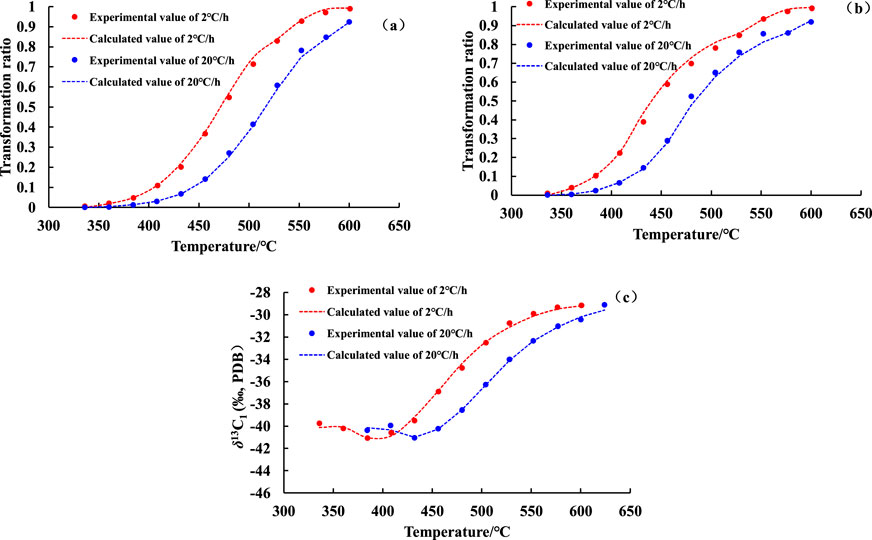
Figure 2. Transformation ratios of methane (A) and C1–5 (B) and carbon isotope values (C) of pyrolysis gas from coal measure source rock in well W13 as functions of temperature.
Figure 3. Transformation ratios of methane (A) and C1–5 (B) and carbon isotope values (C) of pyrolysis gas from mudstone in well W3-4 as functions of temperature.
The transformation ratios and the carbon isotope values of methane and C1–5 calculated by the hydrocarbon generation kinetic model and the Cramer III model, respectively, are shown as functions of temperature in Figures 2, 3. The model results are in agreement with the experiment data, reflecting the feasibility of applying the kinetic models of hydrocarbon generation and isotope fractionation in subsequent geologic applications. The kinetic parameters of 12CH4, 13CH4, and C1–5 derived from the pyrolysis of different samples are shown in Figures 4, 5. The activation energy of the 12CH4 generation reaction is slightly lower than that of 13CH4, resulting in isotopic fractionation during the CH4 generation process. In addition, because methane is the ultimate product of the hydrocarbon generation reactions, some methane originates from the cracking of heavy hydrocarbon gas (C2–5); thus, the activation energy of methane generation is higher than that of C1–5 generation.
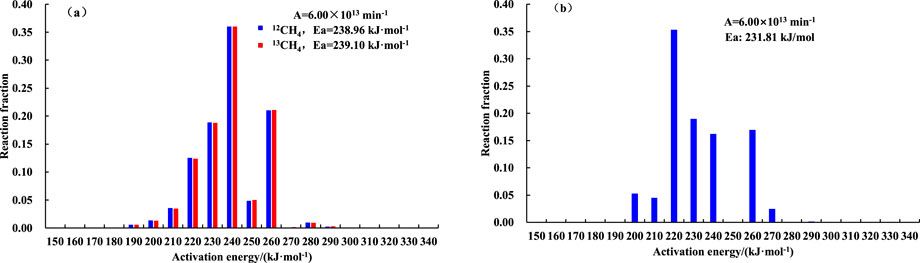
Figure 4. Distributions of activation energy for hydrocarbon generation for coal from well W13: (A) methane and (B) C1–5.
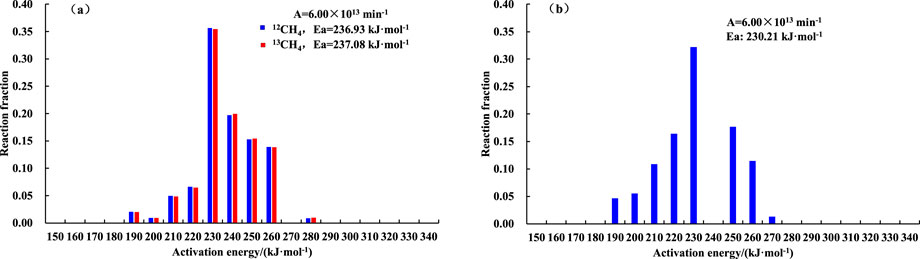
Figure 5. Distributions of activation energy for hydrocarbon generation for mudstone from well W3-4: (A) methane and (B) C1–5.
Prinzhofer and Huc (1995) proposed a method for identifying the genesis of natural gas based on the molecular ratio of ethane to propane and their different carbon isotope values (Prinzhofer and Huc, 1995). In this study, we conducted thermal simulations of kerogen degradation gas and crude oil cracking gas and then revised the discriminant chart for kerogen degradation gas and crude oil cracking gas. As shown in Figure 6A, the gas from source rocks (mixed gas produced by the primary degradation of kerogen and secondary cracking of oil) showed a small carbon isotope gap (−6‰ < δ13C2–δ13C3 < 0‰) and a high content ratio [ln (C2/C3) > 0.5] between ethane and propane. The carbon isotope gap between ethane and propane remained stable as the content ratio increased. The crude oil cracking gas showed a large carbon isotope gap (δ13C2–δ13C3 < −6‰) and a low content ratio [ln (C2/C3) < 0.6] between ethane and propane, and the carbon isotope gap decreased with increasing content ratio. The geochemical characteristics of natural gas in the well Y5 area are generally consistent with the characteristics of gas generated from the thermally simulated source rock, suggesting a mixture of kerogen degradation gas and crude oil cracking gas.
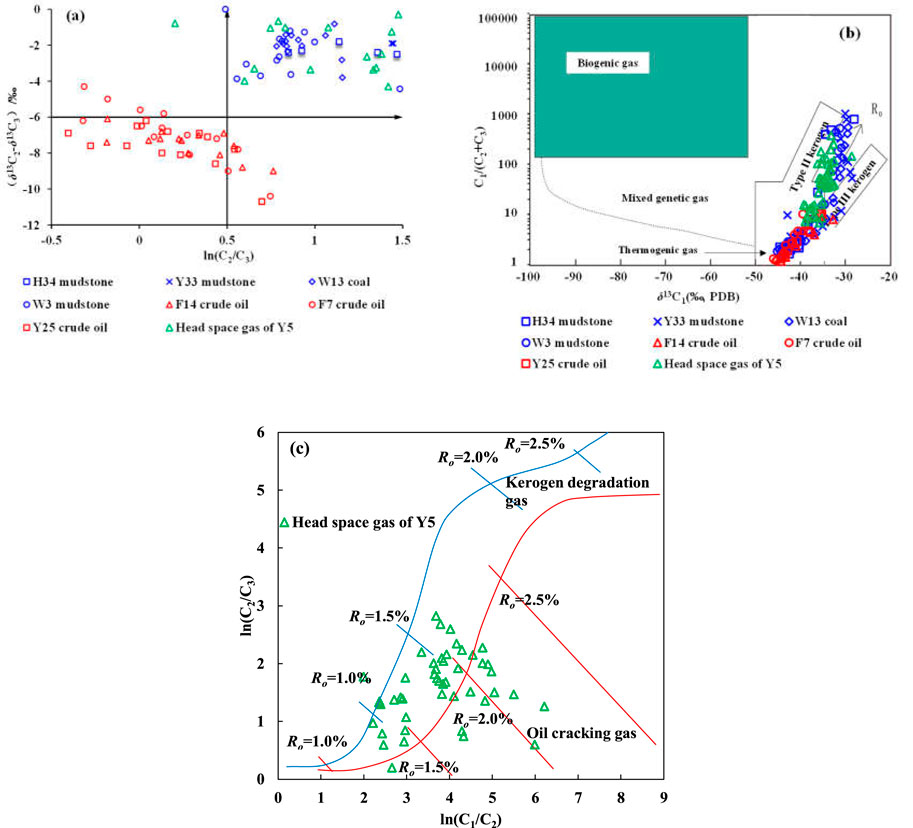
Figure 6. Discrimination between the genetic types of natural gas: (A) ln (C2/C3) vs (δ13C2–δ13C3); (B) δ13C1 vs C1/(C2+C3); and (C) ln (C1/C2) vs ln (C2/C3).
The chart for distinguishing between natural gas sources based on the relationship between C1/(C2+C3) and δ13C1 (Whiticar, 1999) in well Y5 is shown in Figure 6B. The data points of crude oil cracking gas are all located in the lower left corner of the chart, which corresponds to thermogenic gas with a low C1/(C2+C3) ratio (<50) and a light carbon isotope value of methane (−35‰ < δ13C1 <−50‰). Kerogen degradation gas has the same characteristics as crude oil cracking gas with low maturity. However, in the stage of high maturity, kerogen degradation gas exhibits a high C1/(C2+C3) ratio and heavy methane carbon isotope value, clearly different from those of crude oil cracking gas. The characteristics of kerogen degradation gas in the mature and over-mature stages and the natural gas in well Y5 lie between those of typical Type II and Type III kerogen degradation gas.
Based on the above analysis, the natural gas in well Y5 is a mixture of kerogen degradation gas and crude oil cracking gas. The primary gas component requires further confirmation. Li et al. (2021a) reported that due to differences in the structures of kerogen degradation gas and crude oil cracking gas along with their different generation activation energies, the C2/C3 ratio of crude oil cracking gas is lower than that of kerogen degradation gas; moreover, the C1/C2 ratios of crude oil cracking gas in the low/medium maturity (Ro < 1.0%) and over maturity (Ro > 2.0%) stages are smaller than those of kerogen degradation gas at the same stages of evolution (Li J. et al., 2021). As shown in Figure 6C, the natural gas in the well Y5 area is mainly kerogen degradation gas, and a small amount of overmature natural gas in the layers below ZH440 exhibits characteristics of crude oil cracking gas.
Dai. (1992) established the relationship between the carbon isotope value of methane and maturity based on statistical data (Dai, 1992). Oil-type gas and coal-type gas follow the formulas δ13C1 = 15.80logRo–42.20 and δ13C1 = 14.12logRo–34.39, respectively. Using these formulas, the maturity of the source rocks can be calculated from the carbon isotope value of methane. As shown in Figure 7, the Ro values calculated using the coal-type gas formula are consistent with or slightly higher than those of the source rocks; this is because some natural gas originates from the source rock, which is in the center of the sag and is more mature. However, the Ro values calculated using the oil-type gas formula are higher than those of the source rock, and the Ro values calculated for layers below ZH440 are between 4% and 8%, which are inconsistent with the geologic conditions of the study area. Ultraviolet fluorescence observation revealed the presence of cracking residual asphalt in the reservoir pores of well Y5, demonstrating that a certain amount of crude oil was charged in the early stage of hydrocarbon accumulation and cracked into gas in the later stage. In summary, the natural gas in the well Y5 area on the northern slope of Baiyun Sag is mainly kerogen degradation gas with a small amount of crude oil cracking gas.
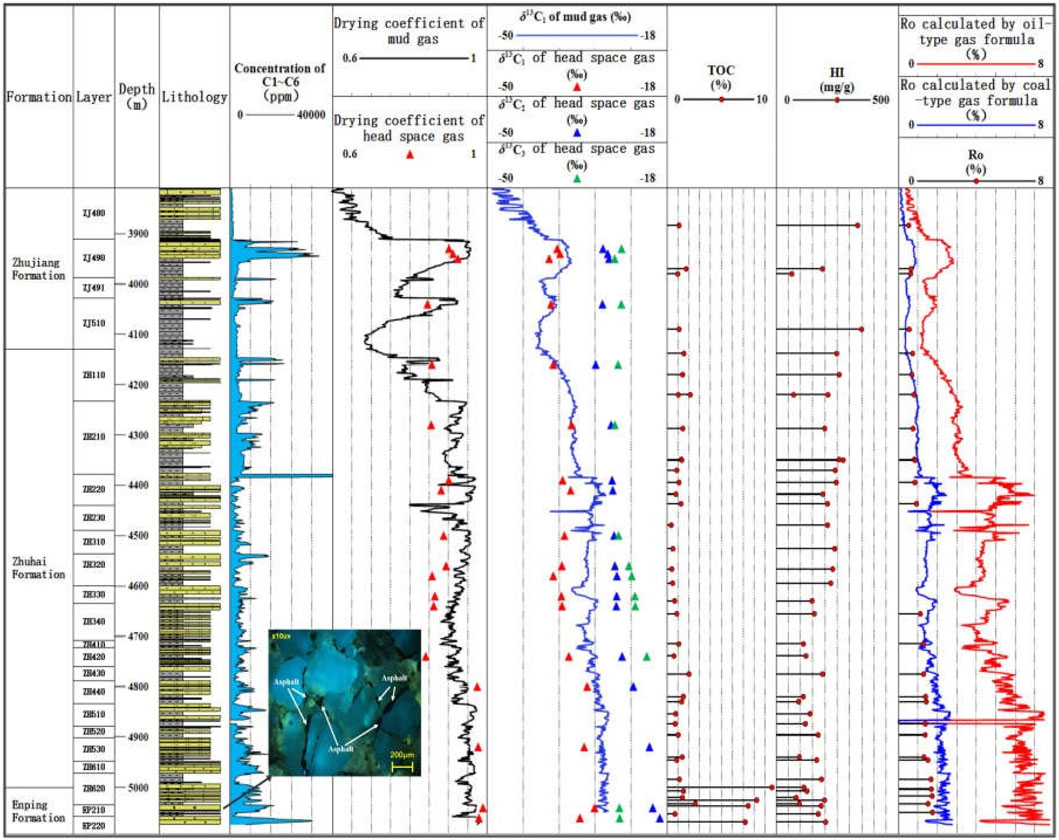
Figure 7. The geochemical profile of well Y5 showing the variations of chemical and carbon isotope compositions of natural gas and typical geochemical characteristics.
In general, the gas compositions will change during the primary and secondary migrations or re-migration and re-trapping, but the degrees of change are different due to different geological conditions. When the transport channel is a dense layer system, the fractionation of components and isotopes is obvious. On the contrary, when the transport channel is an efficient transport channel such as a fault or high permeability formation, the fractionation is weak (Li W. B. et al., 2021; Xia and Tang, 2012). As shown in Figure 6, according to the classic discrimination charts, the head space gas of Y5 is mainly kerogen cracking gas. At the same time, the head space gas matches the characteristics with kerogen degradation gas from hydrocarbon generation experiments well and is significantly different from crude oil cracking gas. So, the gas compositions change very slightly during migration in this area, which is related to an efficient fault transport system (Peng et al., 2016). As a result, it is reasonable to distinguish the origin of natural gas based on the characteristics of gas generated from thermal simulation experiments.
Some of the natural gas in well Y5 has the characteristic of δ13C2 > δ13C3 (Figure 7), whereas the thermal simulations indicated a normal carbon isotope sequence (Figures 8A, B). Dai reported that mixed gas sources are the main reason for the reversal of natural gas isotopic sequences (Dai, 1992). In this study, we calculated the isotopic composition of a mixture of Y33 source rock pyrolysis gas (representing kerogen degradation gas) and F14 crude oil cracking gas. We found that the mixing of kerogen degradation gas and crude oil cracking gas could lead to the reversal of the isotopic sequence of ethane and propane but did not affect the isotopic sequence of methane and ethane. We also found that a higher gas maturity corresponded to a lower the proportion of crude oil cracking gas required to cause the reversal. For example, when the Ro values were 1.22% and 2.30%, the reversal of the ethane and propane isotopic sequence occurred at mixing ratios of kerogen degradation gas to crude oil cracking gas of 2:1 and 15:1, respectively (Figure 8C). According to method of maturity calculation reported by Dai (1992), the maturity of natural gas in the layers below ZH440 in well BY5-2 ranged from 2.0% to 2.5% with an average of 2.3%. Therefore, we can conclude that the ratio of kerogen cracking gas to crude oil cracking gas was approximately 15:1.
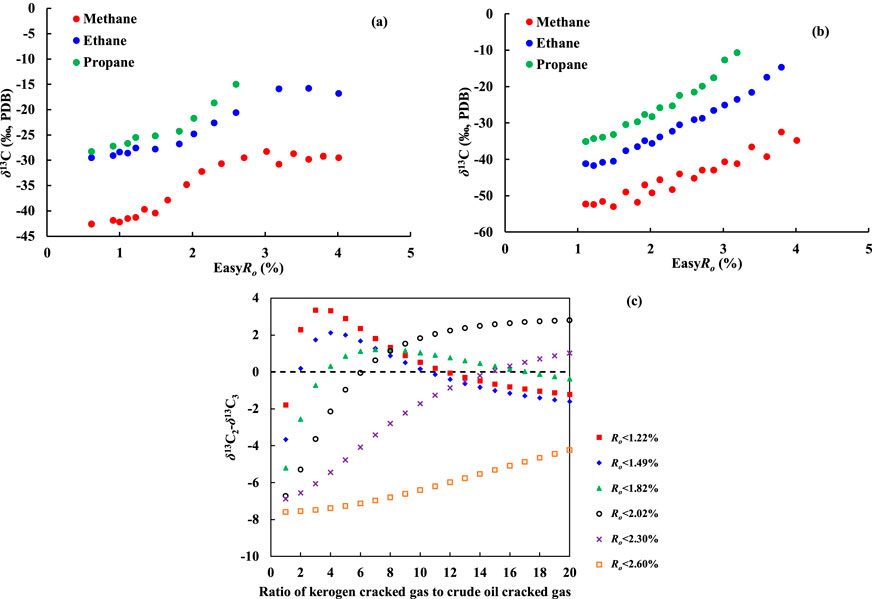
Figure 8. Isotopic characteristics of single-source gas and mixed gases based on thermal simulation: (A) carbon isotope sequence of kerogen degradation gas; (B) carbon isotope sequence of oil cracking gas; (C) reversal of the ethane and propane isotope sequence caused by the mixing of kerogen degradation and crude oil cracking gases with different maturities.
By combining the carbon isotope kinetic parameters of methane with information on the thermal history of wells Y5 and D (Figure 9), we plotted the carbon isotope values of natural gas generated accumulatively over time (Figure 10). The homogenization temperature of the saline inclusions associated with the gas-washed oil inclusions with blue fluorescence in well Y5 was 170°C–180°C, which corresponds to a start time of natural gas charging of 11 Ma (Figure 9A). As shown in Figure 10, during the thermal evolution of OM, the carbon isotope value of natural gas gradually became heavier. Since 11 Ma, the carbon isotope value of methane generated from the source rocks in the Enping Formation and Wenchang Formation ranged from −42‰ to −28‰, consistent with the carbon isotope value of methane in well Y5. This indicates that the natural gas in well Y5 mainly originated from delta to shallow lacustrine facies source rocks. The drying coefficient of natural gas increased gradually moving from shallow to deep, and the carbon isotope value gradually became heavier. This indicates that the high-quality reservoirs in the relatively shallow layer accumulated natural gas generated in the early stage, whereas the tight reservoirs in the deeper layer mainly accumulated natural gas generated in the late stage.
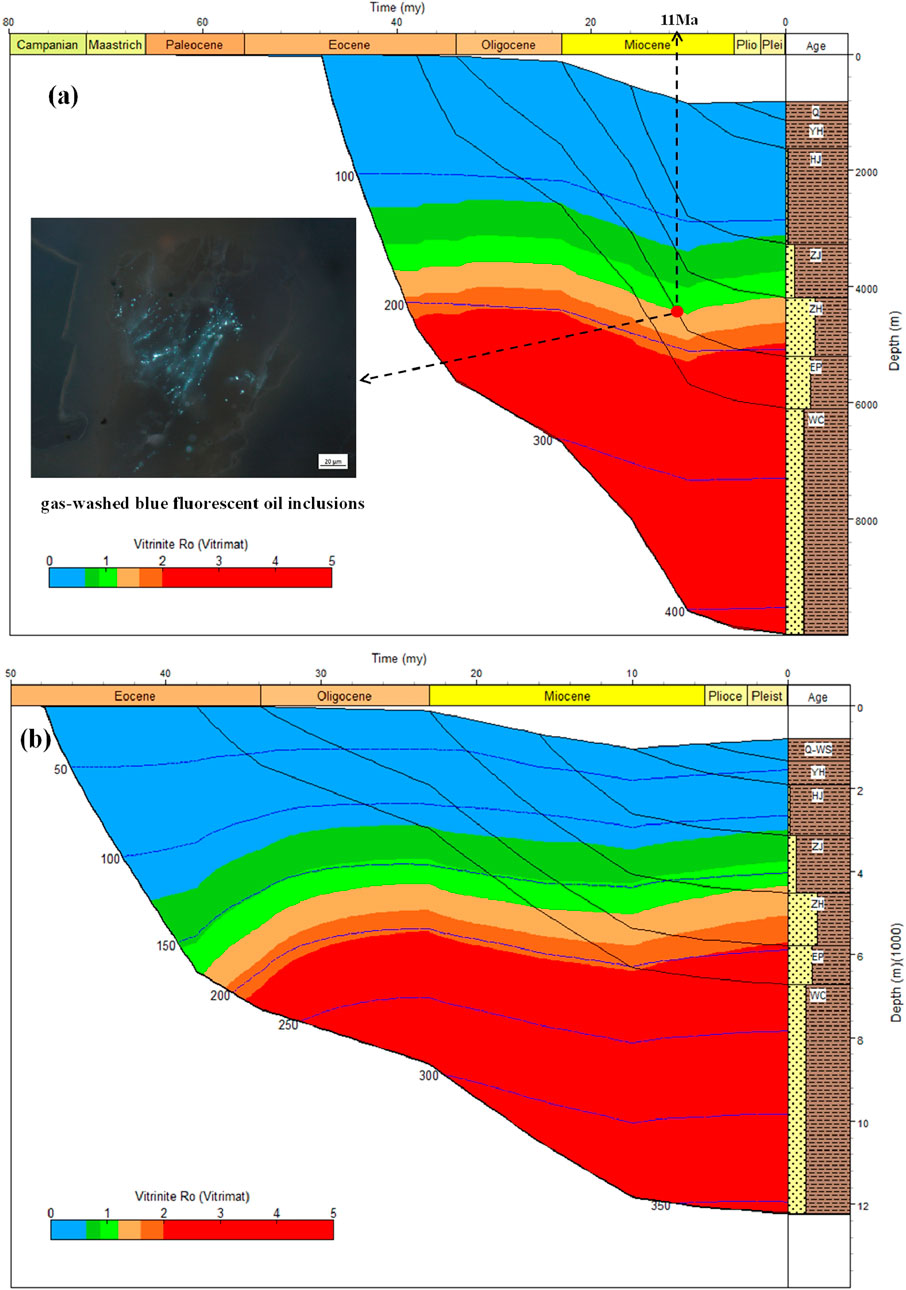
Figure 9. Sedimentary burial history and thermal history of the north slope of Baiyun Sag: (A) well Y5 and (B) well D, a virtual well located on the center of the main sub-sag.

Figure 10. Carbon isotope values of methane generated at different geologic times: (A) methane generated from the coal measures in the Enping Formation; and (B) methane generated from the lacustrine source rock in the Wenchang formation.
The research content discussed above indicates that the natural gas encountered in the current Y5 well area of the Baiyun Sag is thermogenic kerogen pyrolysis gas. In the deep stratigraphic regions below the ZH440 horizon, there is a minor contribution from secondary cracking gas of crude oil, and it clarifies that the primary source of the natural gas in Well Y5 is deltaic and shallow lacustrine source rocks. Early exploration in the study area primarily focused on well placement around the sag edges, with the geochemical characteristics of natural gas in related zones all indicating gas origins from Enping Formation deltaic source rocks, shallow lacustrine source rocks, and Wenchang Formation shallow lacustrine source rocks (Jiang et al., 2022; Cui et al., 2009). Earlier sedimentological studies suggested that extensive deep-to semi-deep lacustrine source rocks were deposited in the Wenchang Formation of the Baiyun Sag, potentially serving as the main source of oil and gas in this region (Mi et al., 2008; Li et al., 2024; He et al., 2009). However, previous explorations did not discover oil and gas derived from deep lacustrine source rocks. Well Y5 is located in the subsidence center of the Wenchang Formation period in the Baiyun Sag. Seismic and geophysical analyses indicate (Li et al., 2024; Guo et al., 2024) that the deep Wenchang Formation strata in this area consist of relatively high-quality semi-deep lacustrine source rocks with strong hydrocarbon generation potential, capable of supplying hydrocarbons to the overlying sandstone reservoirs of the Zhuhai and Zhujiang formations. However, based on the current research findings in this paper, the geochemical characteristics of the natural gas encountered in Well Y5 are basically consistent with those from earlier wells drilled at the sag edges. It is determined that the natural gas in the Baiyun Sag does not originate from deep-to semi-deep lacustrine source rocks, but mainly from widely distributed deltaic or shallow lacustrine source rocks. This understanding essentially reverses the exploration strategy in the study area from oil prospecting to gas field searching. The genetic type of natural gas in Well Y5 confirms that the contribution of secondary cracking gas resources in the gas reservoirs throughout the sag is quite limited. There are volcanic diapir structures in the main and deep parts of the Baiyun Sag’s depression. During the 23.8 Ma period, affected by the Baiyun Movement, volcanic magma erupted in the deep parts of the sag (Zhang et al., 2024; Cai et al., 2021), causing intense secondary alteration to the early paleoreservoirs in the middle-deep layers and leading to widespread destruction. Based on such research conclusions, the distribution of ancient oil reservoirs and secondary cracking gas reservoirs produced by the cracking of ancient oil reservoirs in the Baiyun Sag today is extremely limited. Therefore, oil and gas exploration in this area should continue along the early direction towards the shallow layers at the edges of the sag to search for late high-to over-mature natural gas. The early paleoreservoirs in the middle-deep layers within the sag may have correspondingly lower exploration potential.
Based on data from thermal simulations, we revised the discriminant chart for distinguishing between natural gas genetic type, and the natural gas sources in the well Y5 area on the northern slope of Baiyun Sag were clarified by combining the thermal simulation results and a carbon isotope kinetic model. The key findings are summarized as follows:
The natural gas in well Y5 on the northern slope of Baiyun Sag is mainly kerogen degradation gas with a small amount of crude oil cracking gas in the layers below ZH440. The ratio of kerogen cracking gas to crude oil cracking gas is approximately 15:1. The mixing of these two types of natural gas resulted in the reversal of the isotopic sequences of ethane and propane, and a higher gas maturity corresponds to a lower proportion of crude oil cracking gas required for the reversal to occur.
Based on the existence of oil with blue fluorescence in well Y5, gas washing occurred at 11 Ma. The isotopic values of gas generated since 11 Ma from the Enping Formation coal measures and Wenchang Formation shallow lake mudstones ranged from −44.3‰ to −29‰, consistent with the actual isotopic composition of natural gas in well Y5. These results indicate that high-quality reservoirs in the relatively shallow layer accumulated natural gas generated in the early stage, whereas the tight reservoirs in the deeper layer mainly accumulated natural gas generated in the late stage.
The original contributions presented in the study are included in the article/supplementary material, further inquiries can be directed to the corresponding authors.
XW: Conceptualization, Data curation, Writing–original draft, Writing–review & editing. NQ: Funding acquisition, Resources, Writing–original draft. XZ: Methodology, Project administration, Writing–original draft. GP: Supervision, Validation, Writing–original draft. CC: Investigation, Methodology, Writing–original draft. YZ: Data curation, Project administration, Validation, Visualization, Writing–original draft.
The author(s) declare that financial support was received for the research, authorship, and/or publication of this article. The Major Science and Technology Project of China National Offshore Oil Corporation during the “14th Five-Year Plan” under contact No. KJGG2022-0103-03.
Authors XW, XZ, GP, CC and YZ were employed by Shenzhen Branch of China National Offshore Oil Corporation (CNOOC) Co., Ltd. Authors XW, XZ, GP, CC and YZ were employed by CNOOC Deepwater Development.
The remaining authors declare that the research was conducted in the absence of any commercial or financial relationships that could be construed as a potential conflict of interest.
The authors declare that this study received funding from the Major Science and Technology Project of China National Offshore Oil Corporation during the “14th Five-Year Plan” under contact No. KJGG2022-0103-03. The funder had the following involvement in the study: data collection.
The author(s) declare that no Generative AI was used in the creation of this manuscript.
All claims expressed in this article are solely those of the authors and do not necessarily represent those of their affiliated organizations, or those of the publisher, the editors and the reviewers. Any product that may be evaluated in this article, or claim that may be made by its manufacturer, is not guaranteed or endorsed by the publisher.
Allred, V. D. (1966). Shale oil developments: kinetics of oil shale pyrolysis. Chem. Eng. Prog. (United States) 62, 8.
Behar, F., Kressmann, S., Rudkiewicz, J. L., and Vandenbroucke, M. (1992). Experimental simulation in a confined system and kinetic modelling of kerogen and oil cracking. Org. Geochem. 19 (01), 173–189. doi:10.1016/0146-6380(92)90035-v
Behar, F., Lorant, F., and Lewan, M. (2008). Role of NSO compounds during primary cracking of a Type II kerogen and a Type III lignite. Org. Geochem. 39, 1–22. doi:10.1016/j.orggeochem.2007.10.007
Burnham, A. K., Schmidt, B. J., and Braun, R. L. (1995). A test of the parallel reaction model using kinetic measurements on hydrous pyrolysis residues. Org. Geochem. 23, 931–939. doi:10.1016/0146-6380(95)00069-0
Cai, G. F., Zhang, X. T., Peng, G. R., Wu, J., Liu, B. J., Bai, H. J., et al. (2021). Neogene volcanism and tectonics along the yangjing-yitong’ansha fault zone in the northern south China Sea margin. Geotect. Metallogenia 45 (01), 40–52. doi:10.16539/j.ddgzyckx.2021.01.004
Cramer, B., Faber, E., Gerling, P., and Krooss, B. M. (2001). Reaction kinetics of stable carbon isotopes in natural gas-insights from dry, open system pyrolysis experiments. Energy Fuels 15, 517–532. doi:10.1021/ef000086h
Cui, J., He, J. X., Zhou, Y. Z., and Cui, S. S. (2009). Origin of nature gas resource potential of oil and gas in Baiyun sag, Pearl River Mouth Basin. Nat. Gas. Geosci. 20 (01), 125–130.
Dai, J. X. (1992). Identification of various alkane gases. Sci. China. 35, 1246–1257. doi:10.3321/j.issn:1006-9240.1992.02.003
Dieckmann, V. (2005). Modelling petroleum formation from heterogeneous source rocks: the influence of frequency factors on activation energy distribution and geological prediction. Mar. Pet. Geol. 22, 375–390. doi:10.1016/j.marpetgeo.2004.11.002
Guo, W., Xu, G. F., Liu, B. J., Xiang, X. H., Liu, D. Q., and Zhang, Bo. (2024). Structure-sedimentary response relationship of Wenchang Formation in Baiyun sag, Pearl River Mouth basin. Earth. Sci. 47 (07), 2433–2453. doi:10.3321/j.issn.1000-2383.2022.7.dqkx202207011
Horsfield, B., Schenk, H. J., Mills, N., and Welte, D. H. (1992). An investigation of the in-reservoir conversion of oil to gas: compositional and kinetic findings from closed-system programmed-temperature pyrolysis. Org. Geochem. 19 (01), 191–204. doi:10.1016/0146-6380(92)90036-w
He, J. X., Chen, S. H., Liu, H. L., and Liu, S. L. (2009). Natural gas genetic types and source rocks in the northern slope of Baiyun Sag to Panyu Low Uplift in Pearl River Mouth Basin. Acta Petrolei Sinica 30(01), 16–21. doi:10.3321/j.issn:0253-2697.2009.01.003
Jiang, J., Li, J., Wang, Y., Chen, X., Wang, M., Lu, S., et al. (2022). Characterization of pyrolysis kinetics of continental shale: comparison and enlightenment of the parallel reaction model and the overall reaction model. Front. Earth. Sci. 10. doi:10.3389/feart.2022.879309
Jiang, W., Li, Y., Yang, C., and Xiong, Y. (2021). Organic geochemistry of source rocks in the Baiyun sag of the Pearl River Mouth basin, south China Sea. Mar. Pet. Geol. 124, 104836. doi:10.1016/j.marpetgeo.2020.104836
Klomp, U. C., and Wright, P. A. (1990). A new method for the measurement of kinetic parameters of hydrocarbon generation from source rocks. Org. Geochem. 16, 49–60. doi:10.1016/0146-6380(90)90025-u
Li, C. H., Wang, J. H., Liu, B. J., Su, A., Xu, D. H., Luo, Q. Y., et al. (2024). Types and distribution of the Paleogene sedimentary facies in Baiyun depression of Pearl River Mouth basin. Acta. Sedimentol. Sin. 32 (06), 1162.
Li, J., Wang, X., Hou, L., Chen, C., Guo, J., Yang, C., et al. (2021a). Geochemical characteristics and resource potential of shale gas in Sichuan Basin, China. J. Nat. Gas. Geosci. 06, 313–327. doi:10.1016/j.jnggs.2021.10.002
Li, J. J., Lu, S. F., Wu, W., Xue, H. T., Xu, Q. X., Geng, J., et al. (2011). Water role and its influence on hydrogen isotopic composition of natural gas during gas generation. Acta. Geol. Sin. 85 (05), 1203–1210. doi:10.1111/j.1755-6724.2011.00251.x
Li, W. B., Lu, S. F., Li, J. Q., Wei, Y., Feng, W., Zhang, P., et al. (2021b). Geochemical modeling of carbon isotope fractionation during methane transport in tight sedimentary rocks. Chem. Geol. 566, 120033. doi:10.1016/j.chemgeo.2020.120033
Long, Z. L., Chen, C., and Ma, N. (2020). Geneses and accumulation characteristics of hydrocarbons in Baiyun sag, deep water area of Pearl River Mouth basin. China. Offshore. Oil. Gas. 32, 36–45. doi:10.11935/j.issn.1673-1506.2020.04.004
Lu, S. F., Chen, X., and Fu, X. T. (1997). Chemical kinetic models of the hydrocarbon generation by coal organic matter in the taibei seg and its initial application. Acta. Sedimentol. Sin. 02, 126–129.
Lu, S. F., Li, J. J., Xue, H. T., Huang, G. Y., and Xu, L. H. (2006). Comparison of fraction models of carbon isotope. Nat. Gas. Ind. 07, 1–4.
Maier, C. G., and Zimmerly, S. R. (1924). Chemical dynamics of the transformation of the organic matter to bitumen in oil shale. Univ. Utah Bull. 14, 62–81. doi:10.3969/j.issn.1671-5888.2006.05.019
Mi, L. J., Zhang, G. C., Shen, H. L., Liu, Z., Guo, R., Zhong, K., et al. (2008). Eocene-lower Oligocene sedimentation characteristics of Baiyun sag in the deep water area of Pearl River Mouth basin. Acta. Pet. Sin. 29 (01), 29–34. doi:10.3321/j.issn:0253-2697.2008.01.005
Mi, L. J., Zhang, Z. T., Pang, X., Liu, J., Zhang, B., Zhao, Q., et al. (2018b). Main controlling factors of hydrocarbon accumulation in Baiyun Sag at northern continental margin of South China Sea. Pet. Explor. Dev. 45, 963–973. doi:10.1016/s1876-3804(18)30100-9
Mi, L. J., Zhang, Z. T. Z., Pang, X., Liu, J., Zhang, B., Zhao, Q., et al. (2018a). Main controlling factors of hydrocarbon accumulation in Baiyun Sag at northern continental margin of South China Sea. Pet. Explor. Dev. 45 (05), 963–973. doi:10.1016/s1876-3804(18)30100-9
Pang, X., Ren, J. Y., Zheng, J. Y., Liu, J., Yu, P., and Liu, B. J. (2018). Petroleum geology controlled by extensive detachment thinning of continental margin crust: a case study of Baiyun sag in the deep-water area of northern South China Sea. Pet. Explor. Dev. 45 (01), 29–42. doi:10.1016/s1876-3804(18)30003-x
Peng, G. R., Chen, C., Long, Z. L., Zhang, L. L., Wang, X. D., Ma, Y., et al. (2023). Organic matter enrichment mechanism of different types of source rock in the Baiyun sag. Acta. Geol. Sin. 97 (12), 4164–4178. doi:10.19762/j.cnki.dizhixuebao.2023265
Peng, H. J., Pang, X. Q., and Lu, H. B. (2016). Quantitative evaluation of control of faults on hydrocarbon accumulation and play fairway prediction in Zhu 1 depression of Pearl River Mouth Basin. Geoscience 30 (6), 1318–1328. doi:10.3969/j.issn.1000-8527.2016.06.014
Pepper, A. S., and Corvi, P. J. (1995). Simple kinetic models of petroleum formation. Part I:oil and gas generation from kerogen. Mar. Pet. Geol. 12 (3), 291–319. doi:10.1016/0264-8172(95)98381-e
Ping, H., Chen, H., and Zhai, P. Q. (2019). Petroleum charge history in the Baiyun depression and Panyu lower uplift in the Pearl River Mouth Basin, northern South China Sea: constraints from integration of organic geochemical and fluid inclusion data. AAPG. Bull. 06, 103. doi:10.1007/s11707-017-0675-7
Prinzhofer, A. A., and Huc, A. Y. (1995). Genetic and post-genetic molecular and isotopic fractionations in natural gases. Chem. Geol. 126 (03), 281–290. doi:10.1016/0009-2541(95)00123-9
Ungerer, P. (1990). State of the art of research in kinetic modelling of oil formation and expulsion. Org. Geochem. 16, 1–25. doi:10.1016/0146-6380(90)90022-r
Wang, C., Zeng, J., Zhang, G., and Yin, X. (2022). Formation processes of gas condensate reservoirs in the Baiyun Depression: insights from geochemical analyses and basin modeling. Gas. Sci. Eng. 100, 104464. doi:10.1016/j.jngse.2022.104464
Wang, F. Y., Feng, W. P., and Pang, X. Q. (2023). Key problems and solutions in quantitative analysis of hydrocarbon generation, expulsion, migration and accumulation in whole petroleum system. Acta Pet. Sin. 44, 1434–1444. doi:10.7623/syxb202309003
Wang, M., Lu, S. F., Dong, Q., Xue, H. T., and Huang, L. M. (2011). Comparison on hydrocarbon generation kinetic models. J. China. Univ. Petroleum Ed. Nat. Sci. 35, 12–18. doi:10.3969/j.issn.1673-5005.2011.03.003
Whiticar, M. J. (1999). Carbon and hydrogen isotope systematics of bacterial formation and oxidation of methane. Chem. Geol. 161, 291–314. doi:10.1016/s0009-2541(99)00092-3
Xia, X. Y., and Tang, Y. C. (2012). Isotope fractionation of methane during natural gas flow with coupled diffusion and adsorption/desorption. Geochimica. et. Cosmochimica. Acta 77, 489–503. doi:10.1016/j.gca.2011.10.014
Zhang, C., Luo, D., and Wei, C. (2015). Controlling factors of natural gas accumulation in the amu darya basin, central Asia. Oil. Gas. Geol. 36 (05), 766–773. doi:10.11743/ogg20150507
Zhang, G., Yang, H., Chen, Y., Ji, M., and Sun, Y. (2014). The Baiyun Sag: a giant rich gas-generation sag in the deepwater area of the Pearl River Mouth Basin. Nat. Gas. Ind. 34 (11), 11–25. doi:10.3787/j.issn.1000-0976.2014.11.002
Zhang, X., Jong, W. D., and Preto, F. (2009). Estimating kinetic parameters in TGA using B-spline smoothing and the Friedman method. Biomass. Bioenerg. 33, 1435–1441. doi:10.1016/j.biombioe.2009.06.009
Zhang, Y. Z., Qi, J. F., and Wu, J. F. (2024). Cenozoic faults systems and its geodynamics of the continental margin basins in the northern of South China Sea. Earth. Sci. 44 (02), 603–605. doi:10.3799/dqkx.2018.542
Zhu, J., Shi, H., Pang, X., Zhang, Z., Long, Z. L., Liu, B., et al. (2012). Discussion on natural gas generation and giant-medium size gas field formation in Baiyun sag. Nat. Gas. Geosci. 23, 19–27.
Zhu, J. Z., Shi, H. S., He, M., Pang, X., Yang, S., and Li, Z. (2008). Origins and geochemical characteristics of gases in LW3-1-1 well in the deep Sea region of Baiyun sag, Pearl River Mouth basin. Nat. Gas. Geosci. 19, 229–233.
Keywords: Baiyun sag, thermal simulation, chemical kinetics, carbon isotope composition, natural gas genesis
Citation: Wang X, Qiu N, Zhang X, Peng G, Chen C and Zhang Y (2025) Quantitative assessment of the genetic types and sources of natural gas in well Y5 of the north slope of Baiyun sag. Front. Earth Sci. 13:1541669. doi: 10.3389/feart.2025.1541669
Received: 08 December 2024; Accepted: 11 February 2025;
Published: 19 March 2025.
Edited by:
Ramanathan Alagappan, Jawaharlal Nehru University, IndiaReviewed by:
Li Zhensheng, Hefei University of Technology, ChinaCopyright © 2025 Wang, Qiu, Zhang, Peng, Chen and Zhang. This is an open-access article distributed under the terms of the Creative Commons Attribution License (CC BY). The use, distribution or reproduction in other forums is permitted, provided the original author(s) and the copyright owner(s) are credited and that the original publication in this journal is cited, in accordance with accepted academic practice. No use, distribution or reproduction is permitted which does not comply with these terms.
*Correspondence: Xudong Wang, cmRjMTAwODZAMTYzLmNvbQ==; Nansheng Qiu, MTA0NTQ0OTAxMUBxcS5jb20=
Disclaimer: All claims expressed in this article are solely those of the authors and do not necessarily represent those of their affiliated organizations, or those of the publisher, the editors and the reviewers. Any product that may be evaluated in this article or claim that may be made by its manufacturer is not guaranteed or endorsed by the publisher.
Research integrity at Frontiers
Learn more about the work of our research integrity team to safeguard the quality of each article we publish.