 Bo Wang1,2
 Jie Liu
 Sumera Anwar
 Zhaoye Wu
- 1Anhui Provincial Geological Environment Monitoring Center, Hefei, Anhui, China
- 2Anhui Provincial Geological Disaster Emergency Technical Guidance Center, Hefei, Anhui, China
- 3Anhui Provincial Meteorological Observatory, Hefei, Anhui, China
- 4Department of Botany, Government College Women University Faisalabad, Faisalabad, Pakistan
Rainfall-induced geological disasters are widespread in the Jianghuai region of China, endangering human lives and socioeconomic activities. Anhui Province, a hotspot for these disasters, warrants a thorough analysis of the temporal and spatial distribution of geological disasters and their correlation with rainfall for effective forecasting and warning. This study divides Anhui Province into the Dabie Mountains, southern Anhui Mountains, and other areas based on different background conditions, and establishes effective rainfall threshold warning models for each. We reconstructed the collection of geological disaster precipitation records and rainfall data in Anhui from 2008 to 2023. Using binary logistic regression, we analyzed the correlation between rainfall factors and geological disasters, selected the optimal effective rainfall attenuation parameters for the study area, and determined the critical effective rainfall for different warning levels. Results show: (1) Landslides and collapses are the main types, mostly occurring in high altitude areas like the Dabie and southern Anhui Mountains, and are concentrated in the rainy season of June - July each year; (2) Rainfall is the main inducer, with both single heavy rainfall processes and sustained rainfall influencing geological disaster occurrence, mostly through their combined effect; (3) Effective rainfall is significantly correlated with the day of and previous 8 days rainfall. The optimal attenuation coefficients in the Dabie Mountains, southern Anhui Mountains, and other regions are 0.60, 0.66, and 0.61, respectively. The study shows that setting fine tuned critical rainfall threshold models for different regions is better than a province wide threshold. With a 79% forecast accuracy, it can provide a scientific basis for geological disaster meteorological risk forecasting and warning in Anhui Province.
1 Introduction
Geological disasters—such as landslides, rockfalls, and debris flows—refer to the destruction, displacement, or instability of geological bodies within the Earth’s crust or on its surface, caused by geological environmental changes due to natural conditions or human activities. These changes disrupt human life, production, and the environment (Zhang et al., 2023). Geological disasters are characterized by their sudden onset, difficulty in observation, and rapid evolution, all of which increase the complexity of prediction (Froude and Petley, 2018; Grahn and Jaldell, 2017; Guzzetti et al., 2012). In recent years, global climate change has intensified extreme and unpredictable weather events, further increasing the frequency, scale, and severity of such disasters (Wang et al., 2023). According to the 2022 Global Assessment Report (GAR 2022) published by the United Nations Office for Disaster Risk Reduction, over 10,000 people die worldwide due to disasters each year, and the Asia-Pacific region loses an average of 1.6% of its GDP annually because of disasters. Therefore, establishing an effective multi-hazard early warning system is urgently needed to reduce the potential casualties and property losses caused by impending disasters.
Geological disasters are nonlinear, complex systems influenced by diverse factors, including topography, hydrology, geology, soil properties, vegetation, and human activities (Zhang et al., 2024; Li et al., 2020). Research on geological disaster prediction can be broadly categorized into three approaches: physical models, statistical models, and machine learning models. Physical models simulate geotechnical displacement to estimate key parameters governing disaster initiation and progression (Li et al., 2020). For instance, Saito (1965) developed a physical model to predict slope displacement, identifying an inverse relationship between time-to-failure and strain rate. Qin et al. (2006) introduced a cusp catastrophe model, highlighting that slope stability depends on the stiffness ratio and uniformity index of the medium, with periodic rainfall exacerbating instability by increasing material uniformity or brittleness and reducing stiffness. Rashid et al. (2020) employed the Scoops 3D model to assess landslide risk along Pakistan’s Karakoram Highway, successfully estimating the volume of potential slope failures. Bai et al. (2019) investigated the effects of temperature and saturation on energy dissipation and soil-water characteristic curves in geomaterials. By incorporating concepts such as particle entropy and temperature, Bai et al. (2019) established a thermo-hydro-mechanical constitutive model for geomaterials. Although physical models provide high theoretical accuracy, their application is often constrained by the need for detailed monitoring data and specific experimental conditions.
In recent years, statistical and machine learning models have emerged as mainstream approaches in geological disaster prediction (Li et al., 2020). These methods typically perform mathematical and statistical analyses on historical disaster records, precipitation data, and remote sensing information across long time series to infer future disaster development and assess regional disaster probability (Lee et al., 2014; Rosi et al., 2016). Since the 1970s, Campbell (1974) introduced the concept of critical cumulative rainfall for landslide prediction, while Crozier (1985) proposed rainfall thresholds for rainfall-induced landslides by analyzing daily and antecedent rainfall data. The critical effective cumulative rainfall method remains widely utilized (Peruccacci et al., 2017). Brunetti et al. (2025) successfully used the power-law threshold model to define the thresholds for cumulative precipitation and precipitation duration for landslides in 26 regions of Italy. Marjanović et al. (2018) used decision tree models to analyze short - and medium - term critical cumulative rainfall thresholds for landslides in mountainous areas of Serbia. In western China, researchers have developed landslide early warning models based on rainfall duration, intensity, and cumulative effective rainfall, proposing optimal thresholds for specific regions (Tang et al., 2013; Liu et al., 2024). Experts in Hunan Province have implemented a landslide risk forecasting system based on critical rainfall thresholds, achieving effective results in flood-season meteorological services (Chen et al., 2014; Chen et al., 2024). With the rapid development of artificial intelligence, machine learning methods have been introduced into geological disaster prediction research. Li et al. (2023) integrated fully connected conditional random fields into U-Net for loess landslide research, improving remote sensing segmentation quality and successfully extracting landslide boundary and diameter information. Wei et al. (2024) combined logistic regression, gradient boosted decision trees, and other machine learning models with interferometric synthetic aperture radar (InSAR) to propose an improved landslide susceptibility assessment method, with the logistic regression model performing best in regional and small scale landslide dynamic susceptibility evaluation. Li et al. (2020) and Zhu et al. (2024) used deep belief networks and multi temporal InSAR to identify and analyze deformation of unstable slopes around reservoirs, and explored the response of different deformation types to rainfall and water level fluctuations. Overall, the combination of InSAR technology and machine learning solutions has become a frontier hotspot in geological disaster research.
Rainfall is among the most critical triggers of geological disasters, contributing to over 90% of such events (Bai et al., 2014). As rainfall increases, the risk of debris flows and landslides in mountainous regions rises accordingly (Casagli et al., 2023). Despite substantial progress, current research on geological disaster prediction faces several unresolved challenges. First, during the slope failure process, rainfall intensity and distribution vary dynamically over time. The triggering effect of rainfall results from the combined influence of both current and antecedent precipitation. However, Zhu et al. (2024) used annual average rainfall as a static parameter in their analysis, which may limit accuracy due to the lack of high-resolution rainfall data. Second, the spatial and temporal heterogeneity of rainfall and local topography leads to strong regional specificity in empirical rainfall thresholds. Although modeling techniques such as multiple linear regression (Jibson, 2007), power regression (Huang et al., 2022), and logistic regression (Coull and Agresti, 2000) offer valuable insights, the applicability of their derived critical rainfall values in different regions—particularly under the climatic conditions of China’s Jianghuai region during the Meiyu season—remains uncertain.
To address the aforementioned issues, we developed a comprehensive precipitation database for geological disasters and applied logistic regression to reframe the prediction task as a binary classification problem. In calculating cumulative effective rainfall, we tested various attenuation coefficients and optimal impact durations to enhance model accuracy and robustness. The primary objectives and contributions of this study are as follows:
1. This study represents one of the few systematic analyses of the spatiotemporal distribution of geological disasters and corresponding critical rainfall thresholds in the Meiyu climate zone of China’s Jianghuai region.
2. By accounting for varying rainfall patterns and geological conditions, we applied logistic regression to identify the optimal attenuation coefficients and impact durations for cumulative effective rainfall calculations.
3. We established critical rainfall thresholds corresponding to different meteorological risk warning levels for geological disasters and validated their effectiveness in extreme plum rain years and typhoon events, thereby demonstrating the feasibility of the proposed early warning framework.
The article is organized as follows: After describing the study area, we introduce data sources, methods, and evaluation criteria (Section 2). Next, we analyze the temporal and spatial distribution of geological disasters under different rainfall conditions and explore regional cumulative effective rainfall thresholds using logistic regression (Section 3). This is followed by a discussion of the obtained thresholds (Section 4), including their advantages and limitations, and concluding remarks (Section 5).
2 Materials and methods
2.1 Overview of the study area
Anhui Province is located in the Yangtze River Delta region of East China, defined by geographical coordinates ranging from 116.5° to 119.5° E longitude and 29.5°–31.2° N latitude, encompassing a total area of approximately 140,100 km2. The region’s complex topography includes the Yangtze and Huai Rivers, which divide Anhui into three distinct geographical regions: Huaibei, the Yangtze-Huaihe River area, and the Jiangnan area.
The Huaibei region is predominantly flat, while the central and eastern parts of the Yangtze-Haine River area are characterized by hilly terrain. The Dabie Mountain area lies to the west, and the Southern Anhui Mountain Area contributes the majority of the Jiangnan area (Figure 1a). The Dabie and Southern Anhui Mountain regions exhibit elevations exceeding 800 m, with the highest peak in this region being more than 1,750 m above sea level.
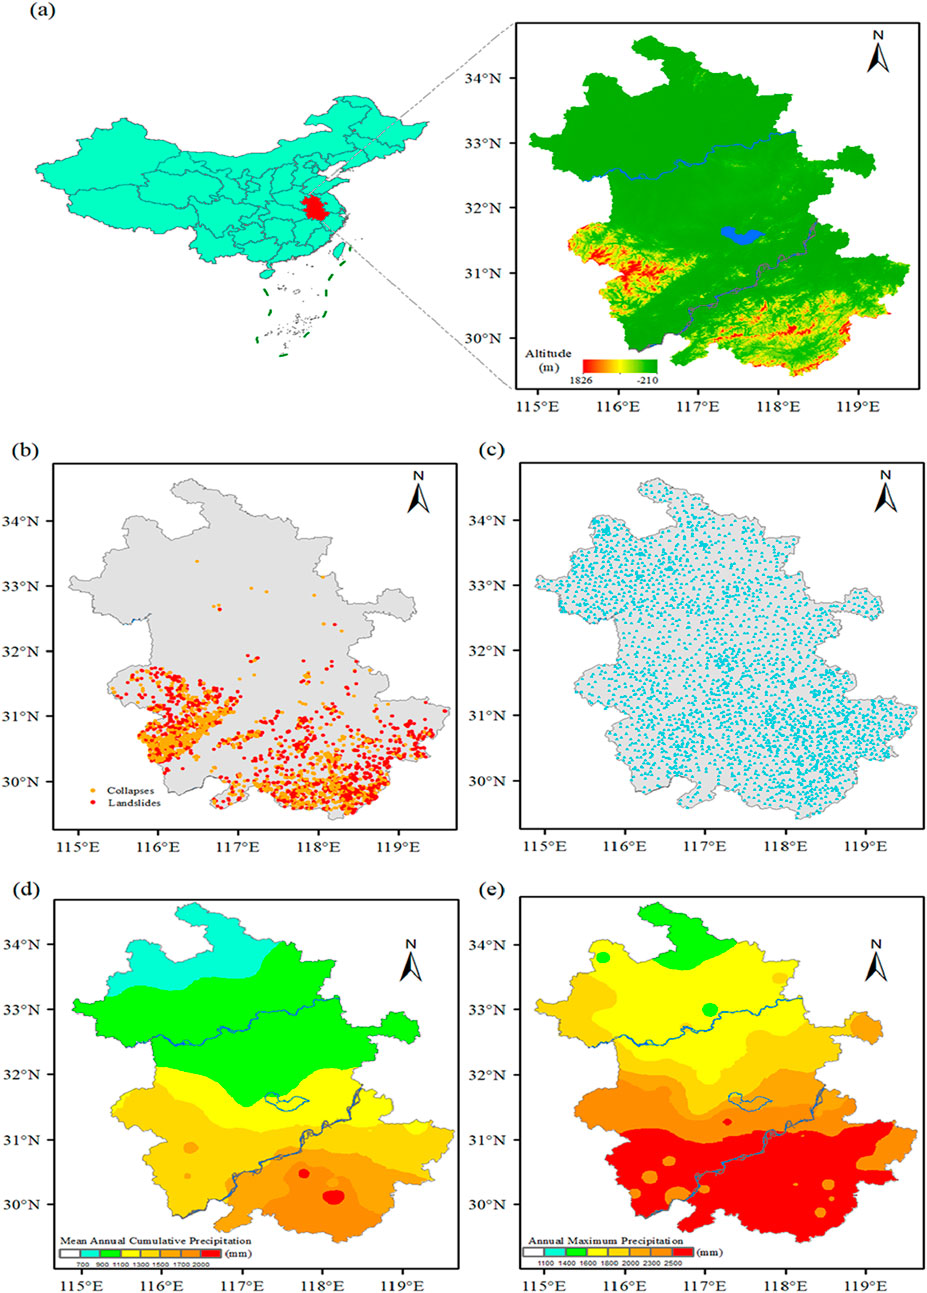
Figure 1. (a) Location and elevation of Anhui Province, (b) Distribution of all rainfall-type geological disasters from 2008 to 2023, (c) Locations of 2,952 meteorological stations in Anhui Province used in this paper, (d) Distribution of cumulative average precipitation in Anhui Province from 1991 to 2020 based on the last 30 years of climate data, (e) Distribution of cumulative maximum precipitation.
The geological framework of Anhui is significantly shaped by the Tethys and the Pacific tectonic domains, resulting in prominent fault structures such as major deep faults, large faults, ductile shear zones, and thrust structures, which govern the distribution and evolution of tectonic units at various levels. Notable examples include the Lu’an deep fault and the Tanlu deep fault zone. The lithology of Anhui primarily comprises metamorphic, carbonate, and magmatic rock series dating back to the late Archean epoch, with a typical thickness of 3–8 km and evidence of substantial weathering (He et al., 2019).
Anhui is situated within a climatic transition zone between subtropical and warm temperate climates, and its northern and southern regions experience pronounced climatic variability. Precipitation exhibits distinct latitudinal zonal distribution characteristics, with annual rainfall measuring between 700 and 900 mm in Huaibei, 1,000 to 1,300 mm in the central and eastern segments between the Yangtze River and the Huai River, and exceeding 1,300 mm in the elevated regions of the Dabie Mountains and Jiangnan (Tang et al., 2024). The interplay of abundant rainfall, unique geology, and increased human activities has led to frequent geological disasters and challenges, such as ground subsidence in the Huaibei Plain, karst collapse in regions such as Tongling, and mining-related collapses in coal extraction zones (Figure 1c) (Liu et al., 2023).
2.2 Data collection and processing
2.2.1 Geological disaster data
The geological disaster data used in this paper was collected from 1 January 2008, to 31 December 2023, and was obtained from materials reported monthly by local grassroots governments to the Anhui Provincial Environmental Monitoring Center. This dataset includes location names of disaster occurrences specified to villages, exact disaster occurrence times precise to the hour, disaster types such as landslides, rockfalls, debris flows, ground collapses, and ground cracks, disaster levels (small, medium, large, and extra-large), and casualty and economic loss assessments.
2.2.2 Precipitation data
The precipitation data used in this study consists of hourly observations from all meteorological stations within the research area, covering the same period as the geological disasters. This data was obtained from Anhui Province’s meteorological department. The stations are spread across the entire study region. We used the data quality control codes from the dataset to remove outliers and questionable data points, ensuring the reliability of the precipitation data. After this rigorous quality control process, we compiled a comprehensive precipitation catalog relevant to geological disasters.
2.2.3 Processing of research data
2.2.3.1 Enrichment of geological disaster dataset
The original geological disaster data set contains 5,205 records, but the longitude and latitude information for disaster points was missing from 2008 to 2015. To address this, the longitude and latitude coordinates were supplemented using village-level location names in the dataset, referencing the Tiandi map. The location accuracy is within 0.01°. The query address is https://map.tianditu.gov.cn/.
2.2.3.2 Expansion of the meteorological network
The meteorological observation network in Anhui Province has gradually improved since 2008. In 2008, there were 467 meteorological observation stations of various types in the province. By 2023, this number increased to 2,952 stations, providing an average horizontal resolution of 6.89 km. Figure 1c illustrates the distribution of meteorological observation stations across the province. Hourly data from these stations were collected and aggregated to generate daily precipitation data.
2.2.3.4 Data interpolation
Meteorological stations were selected based on geographical proximity to the disaster site as the primary criterion. The nearest meteorological station was required to be within 0.1° of the disaster site. In cases where there were no nearby meteorological stations or if data were missing, precipitation data were interpolated with inverse distance weighting interpolation method using the China Meteorological Administration Land Data Assimilation System. This system integrates multiple data sources, including ground observation data, satellite observation products, and numerical forecast products, through data assimilation and fusion technology. It has a temporal resolution of 1 h and a spatial resolution of 0.0625° (Long et al., 2019).
2.2.3.5 Identification of rainfall-induced geological disasters
In order to refine the dataset and exclude samples influenced by anthropogenic activities, specific criteria have been established for the identification of rainfall-induced geological disasters. A disaster is categorized as rainfall-induced if any of the following conditions are satisfied: (1) cumulative rainfall on the day of the disaster, as well as the four preceding days; (2) cumulative rainfall recorded 5–10 days prior to the event; (3) rainfall occurring on at least 3 days, including the day of the disaster and the 4 days prior, with at least 1 day registering measurable precipitation; (4) precipitation documented on a minimum of 3 days within the five to 10 days preceding the disaster, again with rainfall occurring on at least one of those days. Through the application of these criteria, a total of 3,785 records of rainfall-induced geological disasters (approximately 76% of the dataset) were identified, alongside 1,167 records of non-rainfall-induced geological disasters.
2.2.3.6 Dataset creation of geological disaster
The occurrence of geological disasters was framed as a binary classification problem, where P = 1 indicates a disaster and P = 0 indicates no disasters. The stimulating effect of precipitation on geological disasters was analyzed for 3–4 days leading up to each disaster (Zhou et al., 2022). This analysis generated P = 0 samples from these periods for rainfall threshold analysis.
2.3 Method for constructing cumulative effective rainfall model based on logistic regression
2.3.1 Binary logistic regression
To predict geological disasters, rainfall factors across various time periods were used as independent variables, while the occurrence of disaster served as the dependent variable. The non-linear relationship between these variables necessitated using a binary logistic regression model (El-Habil, 2012).
Binary logistic regression requires a Logit transformation of the target probability, mapping the probability value from the range of (0, 1) to the range of (−∞, +∞). This transformation avoids the structural issues associated with the linear probability model (Jiang et al., 2017),
Assuming that a geological disaster event (Y) has an independent variable (X), the probability of the event occurring is P, and the probability of not occurring is 1-P,
The linear regression model is expressed as:
Logit transformation:
By combining Formula 1 and Formula 2, we can establish the relationship between probability (P) and independent variable (X).
Based on Formula 3, we derive the binary classification (m) logistic regression model formula for the independent variables:
In Formula 4, β0 is the constant term, βi is the regression coefficient of the independent variable Xi, which can be obtained by the maximum likelihood method.
2.3.2 Calculation of effective rainfall and screening of key parameters
To more accurately assess the cumulative impacts of precipitation on geological disasters, the concept of effective rainfall has been introduced. Effective rainfall (RA) considers the contributions of rainfall on disaster days (R0) as well as previous rainfall, adjusted by an attenuation factor. The formula for effective rainfall is as follows (Liu et al., 2024):
Where RA is the cumulative effective rainfall before the geological disaster, Ri is the daily rainfall on the ith day before the disaster occurred, K is the attenuation coefficient accounting for the diminishing impact of rainfall over time, and n is the number of days considered in the calculation.
Accurate determination of rainfall attenuation coefficient (K) and rainfall process days (n) is crucial to calculating effective rainfall (Conte and Troncone, 2012). Prior studies have suggested values for K and n depending on regional geological, hydrological, and climatic conditions. For example, Crozier (1985) used K = 0.84 with n = 10 in a landslide study in Southern California. Similarly, Tang et al. (2013) determined K = 0.6 with n = 4 for geological disasters in Chongqing, China.
In this study, a binary logistic regression analysis was conducted to determine the optimal values of K and n for Anhui Province. Using SPSS software, rainfall data from 14 days before the disaster were analyzed to identify correlations with geological disasters. Results indicated that rainfall on the day of the disaster (R0) had the most significant impact, followed by the rainfall on the two preceding days (R1 and R2). Rainfall from 8 days prior to the disaster up to the day of the disaster (n = 8) was found to have a significant correlation with disaster occurrence, while rainfall beyond this period showed no significant correlation.
To further refine the model, Anhui Province was divided into three regions: Dabie Mountain Area, Southern Anhui Mountain Area, and other areas. The K was optimized for each region through binary logistic regression under a 95% confidence level. A fixed step size of 0.01 was used to determine the optimal K, with values of 0.6, 0.66, and 0.61 selected for the Dabie Mountain Area, Southern Anhui Mountain Area, and other areas, respectively.
2.4 Performance evaluation metrics
The performance of the binary classification model was assessed using confusion matrices (Zheng et al., 2024), which included accuracy (ACC) (Formula 6), recall rate (TPR) (Formula 7), false positive rate (FPR) (Formula 8), and false negative rate (FNR) (Formula 9). In the confusion matrix, samples where geological disasters actually occurred were positive samples, and samples where geological disasters did not occur were negative samples. Positive samples predicted as positive samples are labeled true positives (TP), while those predicted as negative samples are false negatives (FN). Negative samples that are predicted as positive samples are referred to as false positives (FP) and those predicted as negative are termed true negatives (TN). The metrics ACC, TPR, FPR, and FNR are calculated as follows:
3 Results
3.1 Rainfall climate background
Analysis of the 30-year (1991–2020) climate data for Anhui Province reveals significant variation in annual average precipitation and maximum annual precipitation across the region, with a general increasing trend from north to south. The annual average precipitation in the Dabie Mountain area and along the Yangtze River in the south exceeds 1,300 mm (Figures 1d, e). The southern Anhui mountainous areas receive between 1,500 and 1700 mm, with some locations like Huangshan and Jiuhuashan recording even higher amounts of 2,449 mm and 2,135 mm, respectively. Maximum annual precipitation in the southern sections of the Yangtze River and Huaihe River can exceed 2000 mm, with the southern Dabie Mountain area receiving between 2,500 and 3,492 mm (Figure 1e). The highest recorded precipitation was 3,492 mm in Huangshan in 2016, followed by 3,166 mm in Jiuhuashan in 1999. The maximum annual precipitation in the southern Dabie Mountain area and the southern Anhui mountainous areas is approximately twice that of the northern areas of the Yangtze River, Huaihe River, and the Huaibei region.
Significant yearly rainfall events occurred in 2016 and 2020 (Figure 2c). The extreme precipitation that occurred in 2016, spanning July 1 to July 5, was characterized by prolonged, intense rainfall in the southern region between the Yangtze River and Huaihe River. The year 2020 experienced the longest plum rain period, lasting up to 60 days from June 2 to July 31, marking the longest and most widespread in history. This rain event resulted in the shift of the rain belt from north to south.
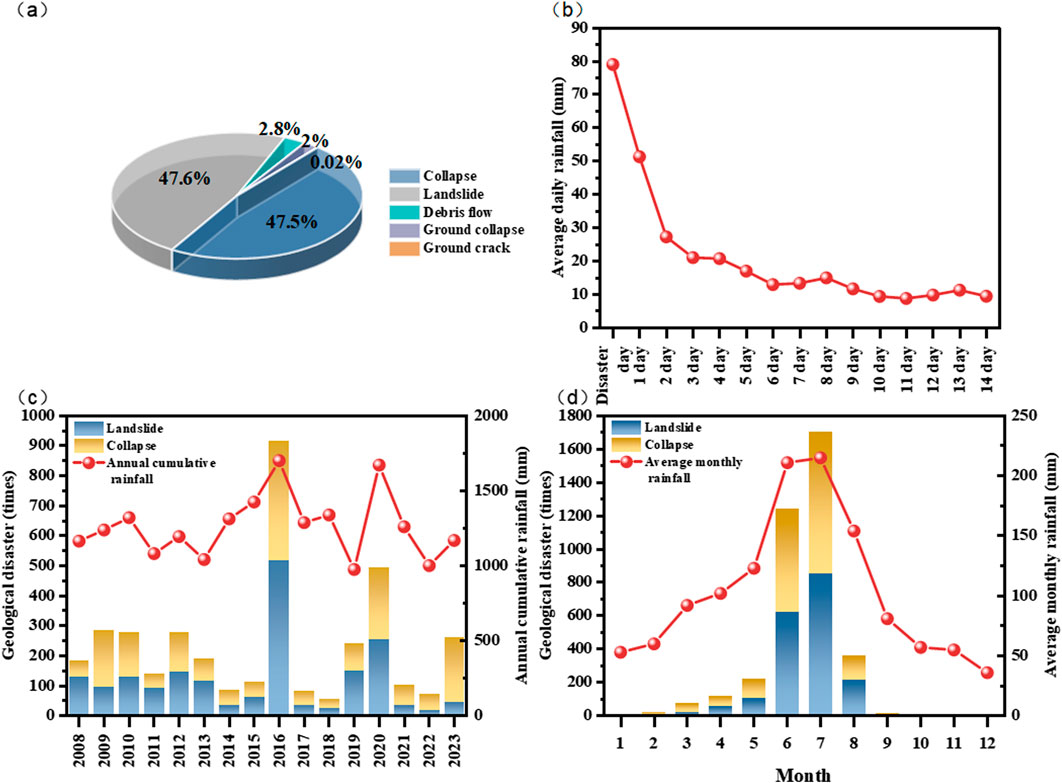
Figure 2. (a) Percentage of each type of geologic hazard; (b) average daily rainfall on the day of occurrence of geologic hazards and in the previous period; (c) annual cumulative rainfall and the number of occurrences of geologic hazards; (d) average monthly rainfall and the number of occurrences of geologic hazards.
Monthly precipitation in Anhui Province mainly occurs during the flood season (May to August), particularly in June and July, with totals exceeding 210 mm in these months (Figure 2d). This period coincides with the plum rain season, characterized by consecutive rainy days and the highest frequency of heavy rainfall events. Rainfall levels decrease sharply after October, entering a prolonged dry season until the following year.
3.2 Temporal and spatial distribution characteristics of rainfall-induced geological hazards
Anhui Province experiences various geological disasters, including collapses, landslides, mudslides, and ground collapses. Collapses and landslides are predominant, occurring 2,472 and 2,480 times, respectively, and together account for over 95% of the total incidents (Figure 2a).
The spatial distribution of rainfall-induced geological disasters reveals significant patterns, with occurrences notably concentrated in the Dabie Mountain region and the Jiangnan area along the Yangtze River (Figure 1b). Conversely, a lower frequency of incidents is observed in the northern regions nestled between the Yangtze River and the Huai River, particularly in the Huaibei area. This distribution is closely aligned with the spatial characteristics of both annual average rainfall and maximum rainfall across Anhui Province (Figures 1d, e), thus supporting the validity of the screening criteria proposed in this study. In addition to the Dabie Mountains and the southern Anhui mountainous zone, there is also a marked density of geological disasters in the hilly regions adjacent to the Yangtze River and the central and eastern areas situated between the Yangtze and Huai Rivers. Furthermore, areas surrounding major water systems, such as the Huaihe River, Yangtze River, and Chaohu Lake, show a heightened frequency of geological disasters. These distributional patterns suggest a robust relationship between the occurrences of geological disasters, topographical features, and the development of local water systems.
Annually, an average of 325 rainfall-induced geological disasters occur in Anhui Province, indicating substantial pressure on meteorological risk warning services pertaining to geological hazards. The examination of the annual distribution curve reveals two pronounced peaks in instances for the years 2016 and 2020, with 917 and 494 occurrences, respectively (Figure 2c). This trend correlates with the overall distribution of annual rainfall. Notably, the precipitation patterns of 2016 and 2020 were distinct; intense, concentrated heavy rain events characterized the former, while the latter exhibited prolonged, continuous rainfall. Both precipitation types—intensive and continuous—serve as critical mechanisms that induce a heightened incidence of geological disasters, with rainstorm stimulation identified as a significant contributing factor.
An analysis of monthly distributions indicates that the peak periods for geological disasters correspond closely with the flood season in Anhui (May to August) (Figure 2d), reinforcing the positive correlation between rainfall levels and the frequency of geological disasters. July registers the highest precipitation, followed closely by June, with both months experiencing rainfall exceeding 210 mm. In these months, geological disaster occurrences numbered 1,244 and 1,705, respectively, constituting 7.8% of the total annual incidents, which is significantly higher than the occurrence rates in other months.
3.3 Analysis of disaster-inducing rainfall levels and rainy-day characteristics
Rainfall data for the day of the disaster (R0) and the preceding 14 days (R1, R2, and so on) indicate an increase in daily rainfall intensity as the disaster approaches. Four days before the event, daily rainfall averaged approximately 80 mm, decreasing to 20 mm on the disaster day itself (Figure 2b). Notably, rainfall during this period showed irregular variations around 10 mm prior to the spike, with no discernible patterns until the disaster approached.
According to national standards for precipitation levels, rainfall was categorized as extremely heavy (R ≥ 250 mm), very heavy (100 ≤ R < 250 mm), rainstorm (50 ≤ R < 100 mm), heavy (25 ≤ R < 50 mm), moderate (10 ≤ R < 25 mm), and light rain (0.1 ≤ R < 10) (Table 1). The rainfall recorded on the day of the geological disaster and the preceding day was significantly higher than in other observed periods. During the disaster, 80.1% of disaster sites experienced moderate or heavier rain. This percentage increased to 92.2% when considering rainfall either on the day of the disaster or the preceding day. Moreover, 71% of disaster sites experienced heavy rain or above on the day of the disaster, with 86.9% achieving the same rainfall magnitude when considering the day prior. Additionally, 58.6% of disaster sites were subjected to torrential rain on the day of the event, which increased to 74.1% when included the day before. Furthermore, 31.6% of sites experienced heavy rainstorms and extremely heavy rainstorms on the disaster day, while this figure rose to 42.9% when considering the previous day.
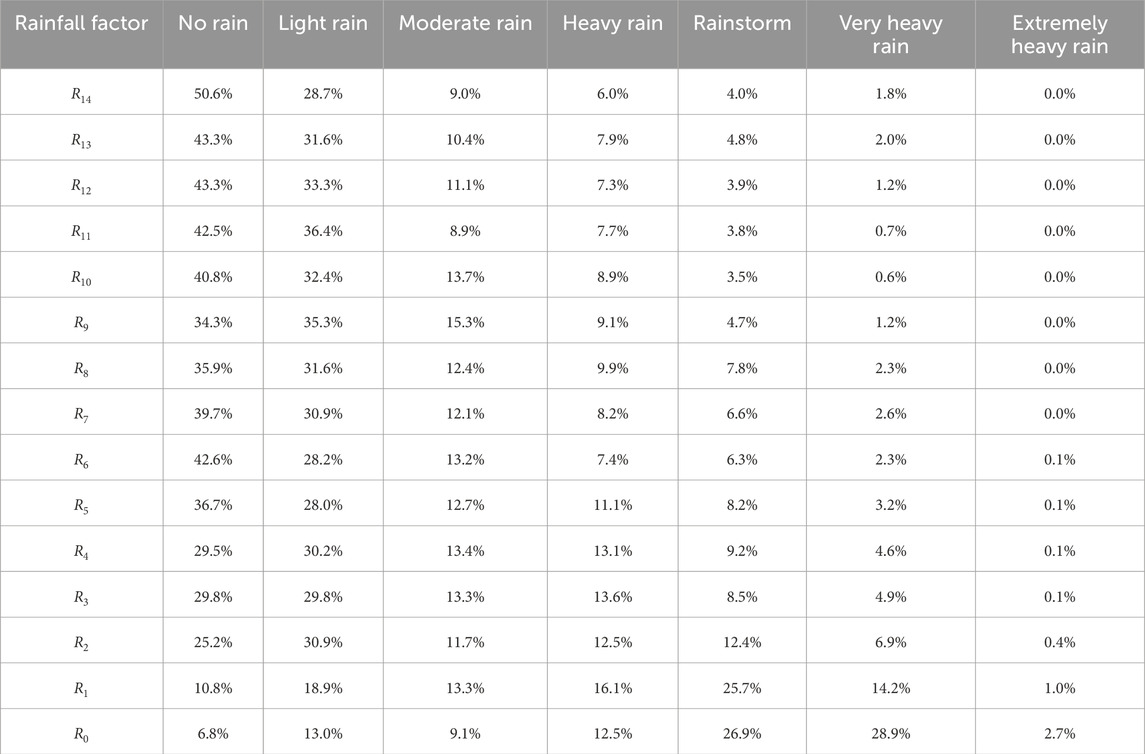
Table 1. Statistics on the percentage of rainfall intensity on the day of the disaster and the 1st to 14th days before the disaster.
Rain-day frequency also played a critical role. Analysis revealed that 78.8% of geological disaster sites experienced eight or more rainy days within the 14 days before the disaster. Integrating both rainfall intensity and frequency, geological disaster points in Anhui Province were categorized into four distinct types:
(1) Heavy rain type: Disasters predominantly triggered by recent heavy rainfall (on the disaster day and the previous day).
(2) Long rain type: Disasters significantly impacted by prolonged periods of rainfall, with minimal association with heavy rain.
(3) Mixed type: Disasters influenced by a combination of continuous rainfall and recent heavy rain.
(4) Other type: Disasters showing no substantial relationship with either recent heavy rainfall or ongoing rainfall. The heavy rain type, long rain type, mixed, and other types accounted for 16.1%, 20.8%, 58.0%, and 5.1% of total disasters (Table 2). The mixed type dominated, accounting for more than half of the occurrences, emphasizing the combined role of intense and prolonged rainfall in disaster causation.
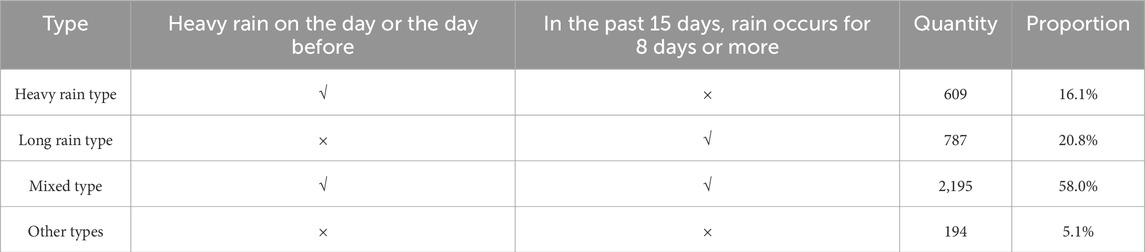
Table 2. Classification of rainfall-induced forms.
3.4 Analysis of disaster-causing rainfall threshold
3.4.1 Effective rainfall parameters
The results in Table 3 show that the regression coefficient and Wald test value were the highest for rainfall on the day of the disaster (R0), confirming its significant effect on geological disaster occurrence. The regression coefficients for rainfall on the first two preceding days (R1 and R2) were also substantial, though progressively lower than R0. Rainfall contributions decreased over time, with rainfall from 9 to 14 days prior (R9 to R14) showing no significant correlation at the 0.05 confidence level. Based on these findings, rainfall from 8 days prior to the disaster up to the day of the disaster (n = 8) was included in calculating effective rainfall.
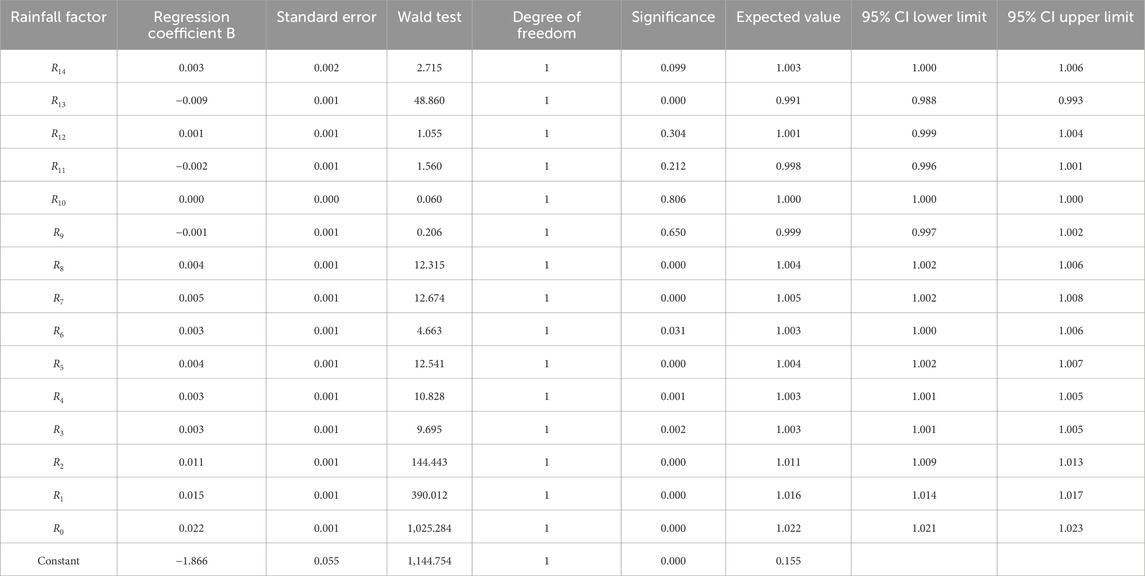
Table 3. Results of dichotomous logistic regression analysis.
In order to obtain the optimal attenuation coefficient (K) for different regions, the whole province of Anhui was divided into three parts: Dabie Mountain Area (Figure 3a), Southern Anhui Mountain Area (Figure 3b), and other areas (Figure 3c). Using the binary logistic regression method, the effective rainfall within the sliding calculation range was modeled with a fixed step size of 0.01 and 0 < K ≤ 1 at a confidence level of 95%. The prediction accuracy, recall rate, and false alarm rate of the model under different attenuation coefficients were statistically analyzed. Considering the stability comprehensively, the K selected for Dabie Mountain Area, Southern Anhui Mountain Area, and other areas were 0.6, 0.66, and 0.61, respectively.
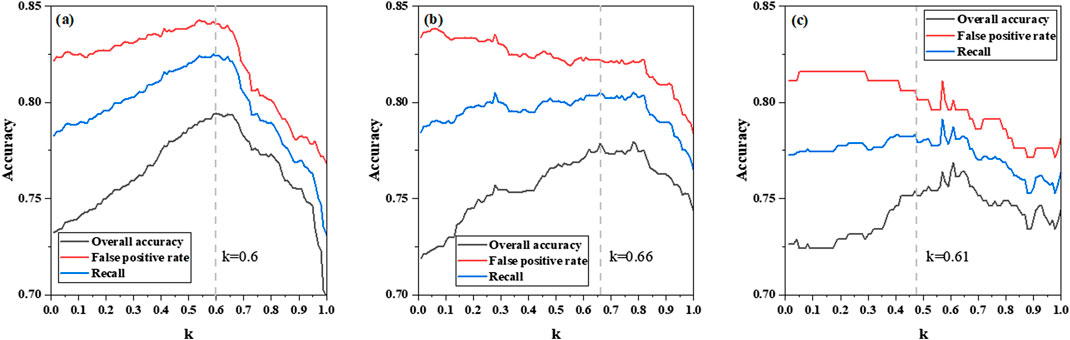
Figure 3. Binary logistic model predictors of effective rainfall under different attenuation coefficients for (a) the Dabie mountain area, (b) the Southern Anhui Mountain area, and (c) other areas.
3.4.2 Rainfall threshold for geological disaster risk warnings
Based on the effective rainfall and optimal effective rainfall parameters (K, n), a geological disaster risk warning model was constructed for Anhui province. The probability of geological disasters was calculated by substituting these parameters into the effective rainfall Formula 5.
Following the guidelines in the national standard “Geological Hazard Meteorological Risk Warning Specification” and related research (Xing et al., 2021), the effective rainfall thresholds corresponding to the probabilities of geological disaster occurrence of 25%, 50%, 70%, and 90% was determined. These thresholds were used to define four warning levels: blue (25%), yellow (50%), orange (70%), and red (90%), to show geological disaster meteorological risk in Anhui Province. The effective rainfall and geological disaster probability curves drawn from the probability formula are given in Table 4.
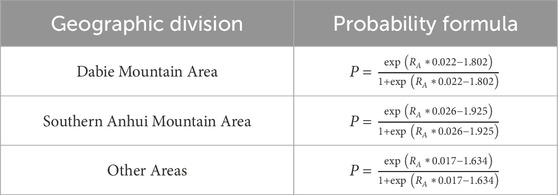
Table 4. Formula for the probability of occurrence of rainfall-type geologic hazards.
The rainfall thresholds that trigger disaster warnings varied by region (Figure 4). In the Dabie Mountain area, these thresholds were set at 32 mm, 83 mm, 122 mm, and 185 mm, corresponding to the blue, yellow, orange, and red warning levels, respectively. In the southern Anhui mountainous region, the thresholds were 32 mm, 75 mm, 108 mm, and 160 mm. Meanwhile, other areas have thresholds of 32 mm, 96 mm, 146 mm, and 225 mm for the same warning levels.
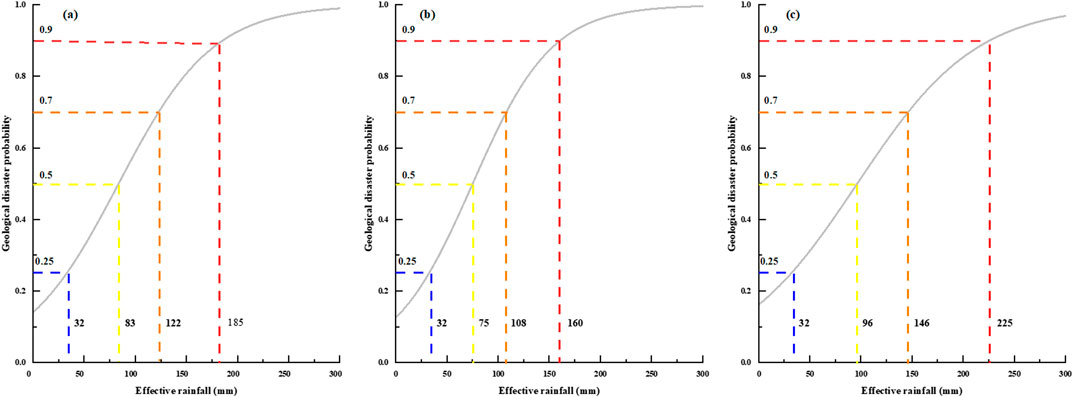
Figure 4. Probability curves of occurrence of geologic hazards in different regions and the amount of disaster-causing rainfall at various warning levels, (a) Dabie Mountains, (b) Southern Anhui Mountain Area, and (c) Other areas.
Thresholds are significantly lower in mountainous areas than low-altitude areas, indicating weaker disaster resistance in mountainous areas. For example, the southern Anhui mountainous area has the smallest disaster-causing rainfall threshold due to the higher cumulative average annual rainfall, making it the region most prone to geological disasters in Anhui Province. The Dabie mountain area has a slightly higher threshold than Southern Anhui, indicating relatively stronger resistance to disaster.
4 Discussion
4.1 Comparative analysis of regional disaster-causing rainfall thresholds and a single threshold
Separate regional effective rainfall threshold early warning models (hereinafter referred to as regional models) were established for Dabie Mountain area, southern Anhui Mountain area, and other regions in Anhui Province, and compared with the provincial effective rainfall threshold early warning model (hereinafter referred to as the single model). The results (Figure 5) show that overall for the province, the regional model achieved 78.6% prediction accuracy, 81.4% recall rate for geological hazard samples, with 23.8% false alarm rate and 18.6% missed detection rate. Compared with the single model, the regional model improved prediction accuracy by 1.5%, increased recall rate by 1.3%, while reducing false alarm rate and missed detection rate by 1.6% and 1.3% respectively. At regional level, the regional models consistently outperformed the single model, which we attribute to two main reasons: First, regional differences in stratigraphic lithology and soil characteristics directly affect rainfall infiltration rates and geotechnical stability. For instance, Dabie Mountain area is dominated by skeletal soils (Wang, 2019), which contain abundant rock fragments or gravels, exhibiting poor water retention, strong permeability, and susceptibility to shallow sliding surfaces. In contrast, the red soils in southern Anhui Mountains demonstrate higher water retention capacity (Wei et al., 2019), requiring higher effective rainfall to trigger instability. The regional model accordingly uses K = 0.66 for southern Anhui (higher than other regions) to better reflect the slow drainage characteristics of red soils, while K = 0.61 for Dabie Mountains matches rapid infiltration features. A unified model with fixed attenuation coefficients might misestimate local rainfall-induced responses. Second, as described in Section 2.1, Anhui Province exhibits significant north-south precipitation differences - Dabie Mountain area receives over 1,300 mm annual precipitation compared to merely 700 mm in Huaibei Plain (Figure 1d). Using uniform thresholds (e.g., 122 mm orange alert) tends to cause under-reporting in low-precipitation areas and over-alerting in high-precipitation regions. Establishing geographically differentiated disaster-triggering rainfall thresholds enables more refined early warning capabilities for geological hazards, allowing more precise quantification of the “memory effect” of historical rainfall.
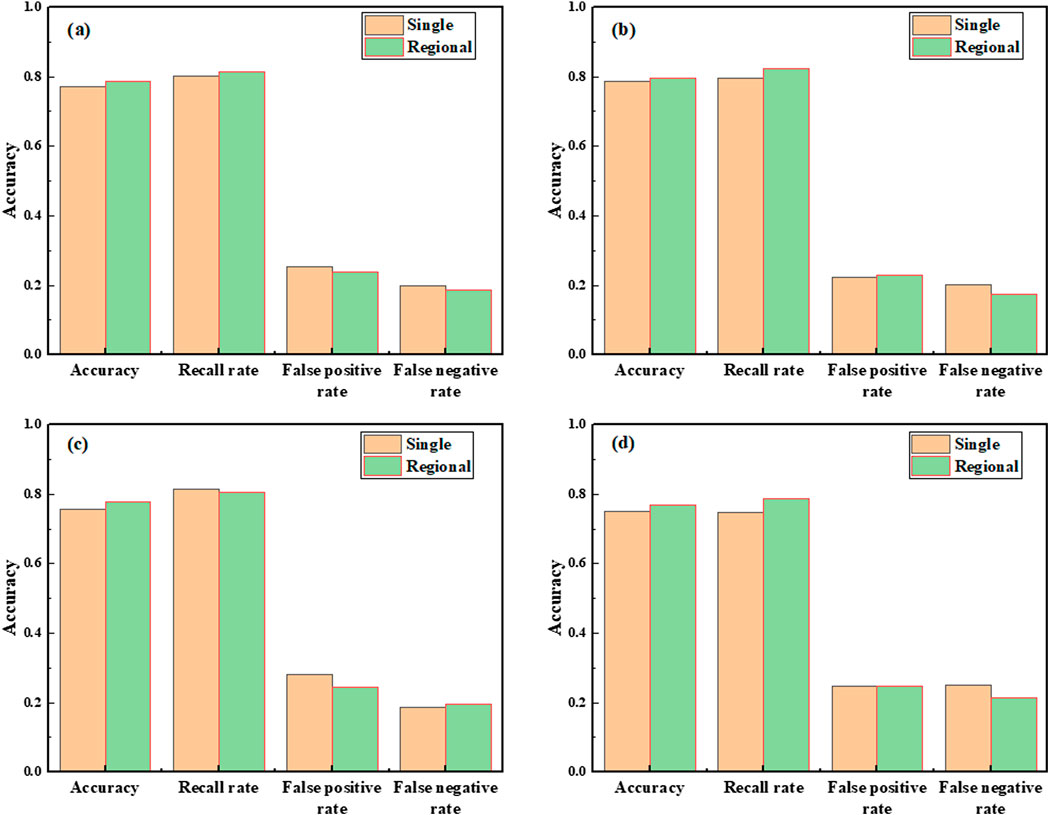
Figure 5. Comparison between the regional effective rainfall threshold warning model and (a) single model Province, (b) Dabie Mountains, (c) Southern Anhui Mountains, and (d) Other areas.
4.2 Verification of the effective rainfall threshold warning model in different climate years
To analyze the impact of interannual climate variability on threshold models, this study calculated confusion matrices for the regional model in 2016 (Figure 6b), 2020 (Figure 6c), and 2023 (Figure 6d). Both 2016 and 2020 were anomalously wet years but with distinct rainfall patterns, while 2023 had cumulative rainfall close to the multi-year average under normal climate conditions. The results show: In 2016, the model achieved 75.2% prediction accuracy, 72.9% recall rate for geological hazard samples, with 21.8% false alarm rate and 27.1% missed detection rate; In 2020, the model attained 72.9% accuracy, 72.2% recall rate, 26.5% false alarm rate, and 27.8% missed detection rate; In 2023, the model demonstrated significantly better performance with 86.9% accuracy, 98.5% recall rate, 20.2% false alarm rate, and 1.5% missed detection rate. The model exhibited markedly superior performance in 2023 with stable rainfall compared to the anomalous years 2016 and 2020, showing both higher accuracy and lower false alarm rates. In 2016, Anhui Province experienced concentrated torrential rains (e.g., 452 mm daily rainfall in Huangshan), with rainfall intensity far exceeding historical averages. This caused rapid accumulation of effective rainfall (RA) surpassing thresholds. Such short-duration intense rainfall may trigger shallow landslides, but the model’s rainfall attenuation rate (selected based on historical data) failed to adequately respond to transient infiltration effects, resulting in elevated false alarms (21.8%). In contrast, the 2020 plum rain season lasted 60 days, with continuous rainfall maintaining long-term saturation of geotechnical materials. However, the model neglected the cumulative creep damage effect, leading to increased missed detections (27.8%). Similar findings were reported in studies of the Apennines in Italy. Melillo et al. (2016) found that traditional attenuation coefficients failed to account for rapid response mechanisms of storm-triggered shallow landslides, resulting in 12% higher false alarm rates in heavy rainfall years (e.g., 2014) compared to normal years. Rosi et al. (2016) demonstrated in Slovenia that statistical models showed 22% increased false alarms when extreme annual rainfall exceeded the 95th historical percentile, as training datasets inadequately represented extreme precipitation scenarios. Notably, the higher false alarm rate in 2016 compared to 2020 indicates greater misclassification of non-hazard samples as hazards. This occurs because negative samples in our study were defined as 4 days prior to hazard events, and intermittent heavy rainfall within 3–4 days could still generate high effective rainfall values in non-hazard samples, leading to excessive false alarms. We conclude that intermittent heavy rainfall episodes have greater impact than sustained stable rainfall on the model’s precision in predicting hazard timing. Future research should optimize the attenuation coefficient as a time-dependent function, dynamically adjusted with soil moisture data, to mitigate model errors caused by episodic storms and interannual climate variability.
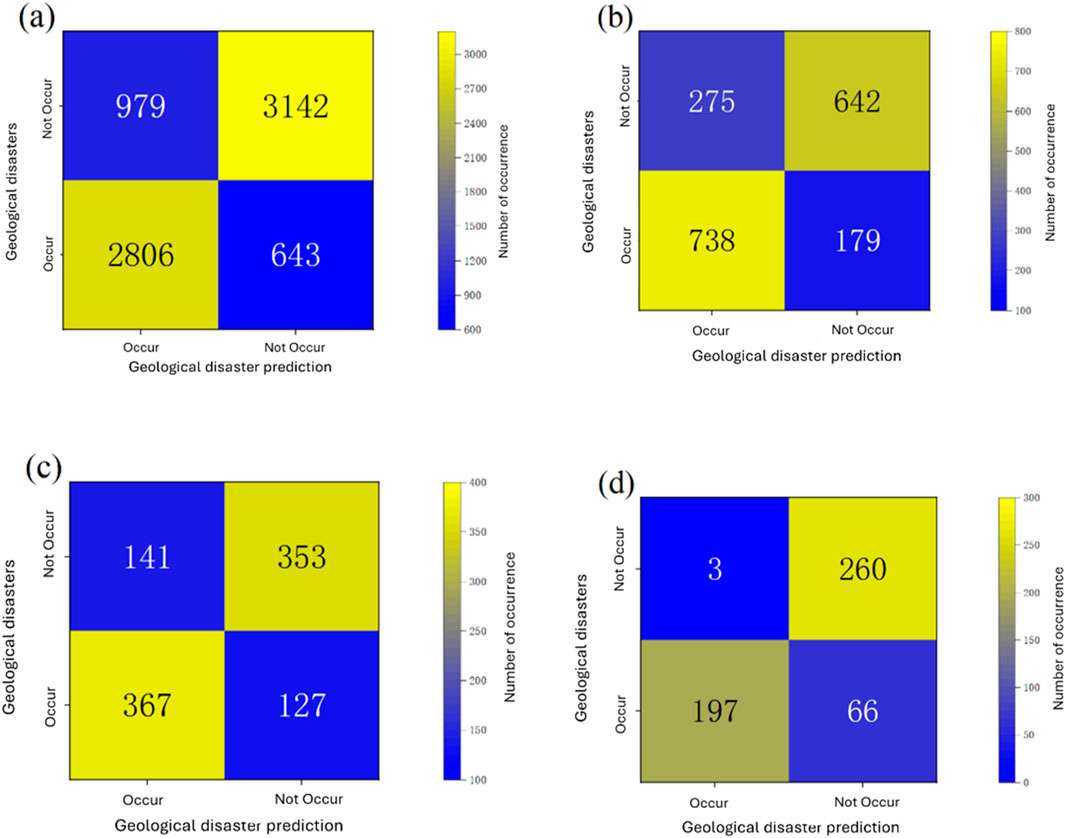
Figure 6. Effective rainfall threshold model forecast confusion matrix for (a) 2008–2023 for all years, (b) 2016 with consecutive concentrated heavy rainfall processes, (c) 2020 with the historically longest number of days of sustained rainfall, and (d) 2023 with smooth climatic characteristics and rainfall close to the normative yearly average.
4.3 Retrospective risk warning of typhoon heavy rainfall processes
Typhoon-induced heavy rainfall frequently triggers geological hazards such as landslides, collapses, and debris flows (Chen and Petley, 2005). From August 9 to 11, 2019, influenced by Typhoon Lekima, Anhui Province experienced an extreme rainfall event. The southern Anhui mountainous area recorded 48 geological hazards on August 10 and 15 on August 11. Two representative hazard sites (DX01, DX02) were selected to evaluate the prediction capability of the threshold model throughout the rainfall time series. DX01: Located in Jiuhua Village, Jingzhou Township, Jixi County, Xuancheng City, Anhui Province, experienced a landslide on August 10. DX02: Located in Qidu Wang Village, Meilin Town, Ningguo City, Xuancheng, suffered a landslide on August 11. Using rainfall data corresponding to hazard timings, the effective rainfall threshold model was applied to compute daily landslide probabilities combined with warning levels (Figure 7). During initial weak precipitation, model predictions remained below the blue warning level. As rainfall intensified starting August 9, the probability curve approached the blue warning threshold. On August 10, torrential rainfall (>200 mm) elevated the warning level directly to red, coinciding with the DX01 landslide. Despite weakening rainfall intensity on August 11 due to inland surface friction effects, DX02 still received 91.1 mm rainfall (Chen et al., 2025). The cumulative effective rainfall threshold model maintained a red warning level by accounting for antecedent precipitation, accurately predicting the subsequent landslide. This case demonstrates that concentrated typhoon rainfall drove rapid accumulation of effective rainfall, with warning levels escalating abruptly with increasing precipitation. The model successfully captured the critical threshold-crossing process preceding hazard events, validating the effectiveness of the effective rainfall-based threshold approach. The logistic regression-based cumulative effective rainfall model performed exceptionally in Typhoon Lekima, highlighting the synergy between its dynamic cumulative mechanism and regionalized threshold adaptation. Our regionalized attenuation coefficient approach (e.g., southern Anhui K = 0.66) shares conceptual similarities with Li et al.’s strategy of dynamically adjusting thresholds through multi-level similarity factors in SMAT typhoon rainfall modeling (Li and Zhao, 2009). While the model achieved satisfactory performance using daily rainfall data in this case, it should be noted that typhoon precipitation efficiency differs fundamentally from mei-yu front, localized convection, and squall line systems, with distinct spatiotemporal distribution patterns. Future studies should employ higher spatiotemporal resolution rainfall data to test model robustness across diverse heavy precipitation systems.
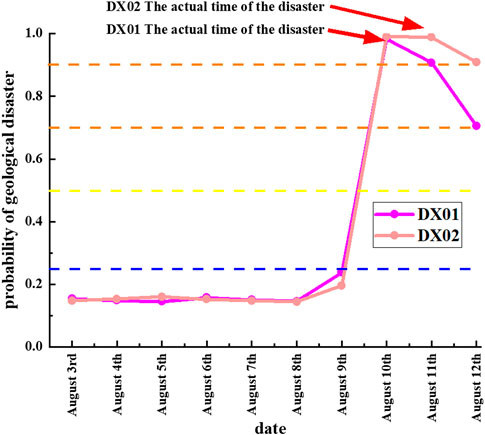
Figure 7. Actual forecast test of effective rainfall threshold model for geologic hazard.
4.4 Limitations and prospects
While the study provides significant insights, several limitations must be addressed. For example, the sparse distribution of meteorological stations in mountainous areas may introduce errors. The vertical spatial variation in rainfall is not fully accounted for. The criteria for identifying rainfall-induced geological disasters involve some degree of subjectivity despite efforts to adhere to scientific rigor. Moreover, fixed effective rainfall thresholds may only partially capture the regional differences in rainfall climate characteristics across Anhui Province. Future research should focus on refining regional disaster-causing rainfall thresholds by incorporating additional factors such as altitude, land surface types, soil properties, and evapotranspiration conditions. Regional studies on the Dabie Mountain and southern Anhui mountainous areas will help enhance the precision of forecasting models.
5 Conclusion
This study analyzed geological disaster and rainfall data from Anhui Province over the past 15 years (2008–2023), focusing on the temporal and spatial distribution of disasters and their relationship with rainfall. The optimal parameters of effective rainfall were identified Using binary logistic regression, and disaster-causing rainfall thresholds were established for meteorological risk warning levels. The key findings are as follows:
(1) Landslides and collapses account for 95% of geological disasters in Anhui Province, predominantly occurring in the Dabie Mountain and southern Anhui mountainous areas. June and July are the peak months, contributing approximately 78% of the annual disaster occurrences.
(2) Rainfall-induced disasters constitute 76% of all geological disasters, triggered mainly by continuous rainfall and rainstorm mixed events (58%), multi-day continuous rainfall (21%), and single rainstorm events (16%).
(3) Rainfall on disaster day exhibits the highest correlation with geological disasters, but the correlation diminishes over time and becomes negligible beyond 8 days.
(4) The effective rainfall attenuation coefficients for the Dabie Mountains, southern Anhui mountainous area, and other regions are 0.6, 0.66, and 0.61, respectively.
(5) The regional effective rainfall threshold model outperforms a single threshold model, achieving a forecast accuracy of 79%. This model is suitable for predicting and warning of rainfall-induced geological disasters across Anhui Province.
Data availability statement
The original contributions presented in the study are included in the article/supplementary material, further inquiries can be directed to the corresponding author.
Author contributions
BW: Conceptualization, Data curation, Formal Analysis, Writing – original draft. JL: Methodology, Conceptualization, Formal Analysis, Software, Writing – original draft. GL: Methodology, Project administration, Supervision, Writing – review and editing. PG: Project administration, Supervision, Writing – review and editing. SA: Visualization, Writing – review and editing. ZW: Data curation, Formal Analysis, Writing – original draft. ML: Data curation, Formal Analysis, Writing – original draft. DL: Project administration, Writing – original draft.
Funding
The author(s) declare that financial support was received for the research and/or publication of this article. This research was funded by the Anhui Public Welfare Geological Project administered jointly by the Anhui Provincial Department of Natural Resources and Anhui Provincial Department of Finance, entitled “Investigation and Prevention Methods for Meiyu-Induced Geological Hazards (Collapses, Landslides and Debris Flows) in Anhui Province (no. 2023-g-1-22); Anhui Provincial Meteorological Bureau Innovation and Development Project “Research on the Applicability of Attention Mechanism Deep Learning Model in Short-term Precipitation Forecasting” (no. CXM202301); The Innovation and Development Project of China Meteorological Administration “Application of the FengLei Large Model in Short-term Nowcasting of Landslide Meteorological Risks” (no. CXFZ2025Q008).
Conflict of interest
The authors declare that the research was conducted in the absence of any commercial or financial relationships that could be construed as a potential conflict of interest.
Generative AI statement
The author(s) declare that no Generative AI was used in the creation of this manuscript.
Publisher’s note
All claims expressed in this article are solely those of the authors and do not necessarily represent those of their affiliated organizations, or those of the publisher, the editors and the reviewers. Any product that may be evaluated in this article, or claim that may be made by its manufacturer, is not guaranteed or endorsed by the publisher.
References
Bai, B., Yang, G. C., Li, T., and Yang, G. S. (2019). A thermodynamic constitutive model with temperature effect based on particle rearrangement for geomaterials. Mech. Mater. 139, 103180. doi:10.1016/j.mechmat.2019.103180
Bai, S., Wang, J., Thiebes, B., Cheng, C., and Yang, Y. (2014). Analysis of the relationship of landslide occurrence with rainfall: a case study of Wudu County, China. Arab. J. Geosci. 7, 1277–1285. doi:10.1007/s12517-013-0939-9
Brunetti, M. T., Gariano, S. L., Melillo, M., Mauro, R., and Silvia, P. (2025). An enhanced rainfall-induced landslide catalogue in Italy. Sci. Data 12, 216. doi:10.1038/s41597-025-04551-6
Campbell, R. H. (1974). Debris flows originating from soil slips during rainstorms in Southern California. Q. J. Eng. Geol. Hydrogeology 7 (4), 339–349. doi:10.1144/GSL.QJEG.1974.007.04.04
Casagli, N., Intrieri, E., Tofani, V., Gigli, G., and Raspini, F. (2023). Landslide detection, monitoring and prediction with remote-sensing techniques. Nat. Rev. Earth & Environ. 4 (1), 51–64. doi:10.1038/s43017-022-00373-x
Chen, H., and Petley, D. N. (2005). The impact of landslides and debris flows triggered by Typhoon Mindulle in Taiwan. Quarterly Journal of Engineering Geology and Hydrogeology 38 (3), 301–304. doi:10.1144/1470-9236/04-077
Chen, J., Yao, R., Wen, Q., Tang, J., He, Z., and Cao, H. (2014). Hazard rainfall threshold analysis of rainfall-induced geological disasters in Hunan province. J. Catastrophology 29 (2), 42–47. doi:10.3969/j.issn.1000-811X.2014.02.010
Chen, L., Ma, Z., and Fei, J. (2025). How different is tropical cyclone precipitation over land and ocean? npj Clim. Atmos. Sci. 8, 70. doi:10.1038/s41612-025-00970-9
Chen, X., Wu, S., and Wu, J. (2024). Characteristics and formation mechanism of Land use conflicts in northern Anhui: a Case study of Funan county. Heliyon 10, e22923. doi:10.1016/j.heliyon.2023.e22923
Conte, E., and Troncone, A. (2012). Simplified approach for the analysis of rainfall-induced shallow landslides. J. Geotech. Geoenviron. Eng. 138, 398–406. doi:10.1061/(ASCE)GT.1943-5606.0000577
Coull, B. A., and Agresti, A. (2000). Random effects modeling of multiple binomial responses using the multivariate binomial logit-normal distribution. Biometrics 56 (1), 73–80. PMID: 10783779. doi:10.1111/j.0006-341x.2000.00073.x
El-Habil, A. M. (2012). An application on Multinomial logistic regression model. Pak. J. Stat. Oper. Res. 8, 271–291. doi:10.18187/pjsor.v8i2.234
Froude, M. J., and Petley, D. N. (2018). Global fatal landslide occurrence from 2004 to 2016. Nat. Hazards Earth Syst. Sci. 18 (8), 2161–2181. doi:10.5194/nhess-18-2161-2018
Grahn, T., and Jaldell, H. (2017). Assessment of data availability for the development of landslide fatality curves. Landslides 14 (3), 1113–1126. doi:10.1007/s10346-016-0775-6
Guzzetti, F., Mondini, A. C., Cardinali, M., Fiorucci, F., Santangelo, M., and Chang, K. T. (2012). Landslide inventory maps: New tools for an old problem. Earth-Science Rev. 112 (1-2), 42–66. doi:10.1016/j.earscirev.2012.02.001
He, H., Hu, D., Sun, Q., Zhu, L., and Liu, Y. (2019). A landslide susceptibility assessment method based on GIS technology and an AHP-weighted information content method: a case study of southern Anhui, China. ISPRS Int. J. Geo-Information 8, 266. doi:10.3390/ijgi8060266
Huang, F., Chen, J., Liu, W., Huang, J., Hong, H., and andChen, W. (2022). Regional rainfall-induced landslide hazard warning based on landslide susceptibility mapping and a critical rainfall threshold. Geomorphology 408, 108236. doi:10.1016/j.geomorph.2022.108236
Jiang, W., Rao, P., Cao, R., Tang, Z., and Chen, K. (2017). Comparative evaluation of geological disaster susceptibility using multi-regression methods and spatial accuracy validation. J. Geogr. Sci. 27, 439–462. doi:10.1007/s11442-017-1386-4
Jibson, R. W. (2007). Regression models for estimating coseismic landslide displacement. Eng. Geol. 91 (2-4), 209–218. doi:10.1016/j.enggeo.2007.01.013
Lee, M. L., Ng, K. Y., Huang, Y. F., and Li, W. (2014). Rainfall-induced landslides in Hulu Kelang area, Malaysia. Nat. Hazards 70, 353–375. doi:10.1007/s11069-013-0814-8
Li, B., and Zhao, S. (2009). Experimental study on establishing typhoon rainstorm prediction models using SMAT. Meteorol. Mon. 35 (6), 3–12. doi:10.7519/j.issn.1000-0526.2009.06.001
Li, H., He, Y., Xu, Q., Deng, J., Li, W., Wei, Y., et al. (2023). Sematic segmentation of loess landslides with STAPLE mask and fully connected conditional random field. Landslides 20, 367–380. doi:10.1007/s10346-022-01983-8
Li, H., Xu, Q., He, Y., He, Y., and Li, S. (2020). Modeling and predicting reservoir landslide displacement with deep belief network and EWMA control charts: a case study in Three Gorges Reservoir. Landslides 17, 693–707. doi:10.1007/s10346-019-01312-6
Liu, S., Du, J., Yin, K., Zhou, C., Huang, C., Jiang, J., et al. (2024). Regional early warning model for rainfall induced landslide based on slope unit in Chongqing, China. Eng. Geol. 333, 107464. doi:10.1016/j.enggeo.2024.107464
Liu, Y., Huang, X., Zhang, Z., and Qi, X. (2023). Spatiotemporal dynamics and anthropogenic drivers of geological hazard prevention efficiency in China. Cities 143, 104607. doi:10.1016/j.cities.2023.104607
Long, D., Bai, L., Yan, L., Zhang, C., Yang, W., Lei, H., et al. (2019). Generation of spatially complete and daily continuous surface soil moisture of high spatial resolution. Remote Sens. Environ. 233, 111364. doi:10.1016/j.rse.2019.111364
Marjanović, M., Krautblatter, M., Abolmasov, B., Đurić, U., Sandić, C., and Nikolić, V. (2018). The rainfall-induced landsliding in Western Serbia: a temporal prediction approach using Decision Tree technique. Eng. Geol. 232, 147–159. doi:10.1016/j.enggeo.2017.11.021
Melillo, M., Brunetti, M. T., Peruccacci, S., Gariano, S. L., and Guzzetti, F. (2016). Rainfall thresholds for the possible landslide occurrence in Sicily (Southern Italy) based on the automatic reconstruction of rainfall events. Landslides 13, 165–172. doi:10.1007/s10346-015-0630-1
Peruccacci, S., Brunetti, M. T., Gariano, S. L., Melillo, M., Rossi, M., and &and Guzzetti, F. (2017). Rainfall thresholds for possible landslide occurrence in Italy. Geomorphology 290, 39–57. doi:10.1016/j.geomorph.2017.03.031
Qin, S., Jiao, J., and Li, Z. (2006). Nonlinear evolutionary mechanisms of instability of plane-shear slope: catastrophe, bifurcation, chaos and physical prediction. Rock Mech. Rock Eng. 39, 59–76. doi:10.1007/s00603-005-0049-4
Rashid, B., Iqbal, J., and Su, L.-J. (2020). Landslide susceptibility analysis of Karakoram highway using analytical hierarchy process and scoops 3D. J. Mt. Sci. 17 (7), 1596–1612. doi:10.1007/s11629-018-5195-8
Rosi, A., Peternel, T., Jemec-Auflič, M., Komac, M., Segoni, S., and Casagli, N. (2016). Rainfall thresholds for rainfall-induced landslides in Slovenia. Landslides 13, 1571–1577. doi:10.1007/s10346-016-0733-3
Saito, M. (1965). “Forecasting the time of occurrence of a slope failure,” in Proc. 6 th Int. Conf. Soil Mechanics and Foundation Eng, 537–541. doi:10.1253/jcj.33.677
Tang, H., Fang, J., and Yuan, J. (2024). Climate change and Land Use/Land Cover Change (LUCC) leading to spatial shifts in net primary productivity in Anhui Province, China. PLOS ONE 19, e0307516. doi:10.1371/journal.pone.0307516
Tang, H., Wei, L., Tang, Y., and Gao, B. (2013). Correlation analysis and prediction model for rainfall-induced landslide in Chongqing area. Chin. J. Geol. Hazard Control (4), 16–22. doi:10.16031/j.cnki.issn.1003-8035.2013.04.012
Wang, B. (2019). Soil erodibility K values and its distribution in Anhui province. Sci. Soil Water Conservation 17 (06), 132–139. doi:10.16843/j.sswc.2019.06.017
Wang, F., Harindintwali, J. D., Wei, K., Shan, Y., Mi, Z., Costello, M. J., et al. (2023). Climate change: Strategies for mitigation and adaptation. Innov. Geosci. 1 (1), 100015–100061. doi:10.59717/j.xinn-geo.2023.100015
Wei, W., Feng, X., Yang, L., Chen, L., Feng, T., Chen, D., et al. (2019). The effects of terracing and vegetation on soil moisture retention in a dry hilly catchment in China. Science of the Total Environment 647, 1323–1332. doi:10.1016/j.scitotenv.2018.08.037
Wei, Y., Qiu, H., Liu, Z., Huangfu, W., Zhu, Y., Liu, Y., et al. (2024). Refined and dynamic susceptibility assessment of landslides using InSAR and machine learning models. Geosci. Front. 15 (6), 101890. doi:10.1016/j.gsf.2024.101890
Xing, X., Wu, C., Li, J., Li, X., Zhang, L., and He, R. (2021). Susceptibility assessment for rainfall-induced landslides using a revised logistic regression method. Nat. Hazards 106, 97–117. doi:10.1007/s11069-020-04452-4
Zhang, S., Tan, S., Zhou, J., Sun, Y., Ding, D., and Li, J. (2023). Geological disaster susceptibility evaluation of a random-forest-weighted deterministic coefficient model. Sustainability 15 (17), 12691. doi:10.3390/su151712691
Zhang, X., Zhang, M., Liu, X., Terfa, B. K., Nam, W. H., Gu, X., et al. (2024). Review on the progress and future prospects of geological disasters prediction in the era of artificial intelligence. Nat. Hazards 120, 11485–11525. doi:10.1007/s11069-024-06673-3
Zheng, Z., Zhang, K., Wang, N., Zhu, M., and He, Z. (2024). Machine learning–based systems for early warning of rainfall-induced landslide. Nat. Hazards Rev. 25 (4), 04024027. doi:10.1061/NHREFO.NHENG-1993
Zhou, J., Tang, M., Xu, Q., Wu, H., and Wang, X. (2022). Early warning model of rainfall-induced landslide in Chongqing of China based on rainfall threshold. Mt. Res. 40 (6), 847–858. doi:10.16089/j.cnki.1008-2786.000718
Keywords: geological disasters, spatiotemporal distribution, effective rainfall, disaster-causing rainfall, early warning guidance
Citation: Wang B, Liu J, Liu G, Gao P, Anwar S, Wu Z, Li M and Li D (2025) Spatiotemporal analysis and threshold modeling of rainfall-induced geological disasters in Anhui Province. Front. Earth Sci. 13:1541242. doi: 10.3389/feart.2025.1541242
Received: 07 December 2024; Accepted: 31 March 2025;
Published: 17 April 2025.
Edited by:
Bing Bai, Beijing Jiaotong University, ChinaReviewed by:
Haijun Qiu, Northwest University, ChinaYang Gaosheng, Shanxi Agricultural University, China
Copyright © 2025 Wang, Liu, Liu, Gao, Anwar, Wu, Li and Li. This is an open-access article distributed under the terms of the Creative Commons Attribution License (CC BY). The use, distribution or reproduction in other forums is permitted, provided the original author(s) and the copyright owner(s) are credited and that the original publication in this journal is cited, in accordance with accepted academic practice. No use, distribution or reproduction is permitted which does not comply with these terms.
*Correspondence: Jie Liu, bGl1amllQGFtby5tb2Jp