 Li Dan
 Wu Kui*
- Cnooc Research Institute Ltd., Beijing, China
Introduction: With the gradual reduction in conventional exploration and the gradual improvement of hydraulic fracturing technology, the exploration of tight oil and gas has gradually become general. Marine carbonate rocks are developed in the lower Paleozoic Ordovician in the eastern margin of Ordos Basin. According to the drilling results, the minerals in this area are mainly calcite and dolomite, and the secondary minerals are halite, anhydrite, quartz, feldspar and clay minerals. Core experiment reveals that the reservoir is tight, with porosity between 2 and 6% and permeability less than 2mD. Relationship between lithology and porosity established by conventional logging interpretation is not consistent with the results of gas logging, so it is impossible to accurately determine the reservoir location.
Method: The research in this paper is to interpret lithologic profile based on mineral X-ray diffraction data, to accurately evaluate pore type and permeability based on borehole electrical imaging and multipole array acoustic logging, and to interpret gas saturation by using the Archie formula with variable cementation index.
Results and discussion: This method improves the interpretation accuracy of geophysical logging methods for tight reservoirs in this block, and plays a key role in favorable evaluation of reservoir sweet spots.
1 Introduction
The block L is an unconventional hydrocarbon exploration block of CNOOC. The exploration and development of Carboniferous and Permian tight sandstone gas and deep coalbed methane in the upper Paleozoic are important (Zhu G. et al., 2022; Guo et al., 2024; Yu et al., 2024; Zhang et al., 2023; Kang et al., 2024). At present, the exploration in these two fields comes to an end (Xu et al., 2024; Zhu Y. et al., 2022; Qi et al., 2023). The marine carbonate rock is developed in the lower Paleozoic of this block. The carbonate rock of the Ordovician Majiagou Formation is in unconformable contact with the Benxi Formation of the upper Paleozoic. The weathered crust reservoirs are developed in the upper combination, and mound beach reservoirs are developed in the middle and lower combination (Yang et al., 2011; Yao et al., 2015; He et al., 2022; Fu et al., 2021). The gas bearing indications have been seen in drilling and have certain exploration potential. The Cambrian and Ordovician Majiagou Formation middle and lower assemblages both developed laminated argillaceous dolomite, which is an effective high-quality source rock with good hydrocarbon supply conditions. The adjacent ShenMu gas field drilled the undersalt carbonate rock in 2022, of which the open flow test of single well MT1 reached 3.5 × 10⁵ m3/d (Zhou et al., 2023). Liu et al. (2024) introduced in detail the types and characteristics of favorable sub-salt dolomite reservoirs in Ordos Basin, and gave detailed classification schemes of different types of reservoirs. Fu et al. (2023) and Meng et al. (2023) introduced the reservoir forming mode of well MT1 in detail, introduced the geological background of the well from source reservoir cap, and described the progress of carbonate acid fracturing technology. Jiang et al. (2022) analyzed the reservoir lithology of this section through conventional logging curves, and introduced the rapid interpretation of lithology by using envelope and cluster analysis through density curves and neutron curves. Lai et al. (2020) and Wang et al. (2020),Wang et al. (2021),Wang et al. (2022) classified the lithofacies of the fifth member of Majiagou Formation in the basin in detail by using conventional curves and electrical imaging data (Farouk et al., 2024a; Farouk et al., 2025; Farouk et al., 2024b).
In this paper, through conducting experiment data on drilled cores and combining them with conventional logging data, a rapid lithology interpretation method based on artificial intelligence algorithms is established. By processing borehole resistivity imaging logging data, the porosity spectrum and porosity curve are obtained to evaluate the effectiveness and connectivity of reservoir pores. By processing array acoustic logging data, the Stoneley waveform is obtained to further evaluate reservoir permeability parameters. Through the core rock resistivity experiment, the Archie formula with a variable m parameter is established to optimize the interpretation of gas saturation. Through the above processing methods, the experimental results and imaging logging are applied to the LITCR (logging interpretation for tight carbonate reservoirs), which improves the logging interpretation accuracy of conventional logging curves and is more conducive to LITCR.
2 Regional overview
2.1 Geological overview
The Ordos Basin is a large multicycle craton basin featuring a relatively simple structure. The basin can be divided into six structural units, namely the Yimeng Uplift, Western complex structural belt, Tianhuan Depression, Yishan slope, Jinxi flexure zone, and Weibei uplift. Block L is structurally located in the Jinxi flexure zone on the eastern margin of the Ordos Basin,as shown in Figure 1 (Qi et al., 2024). The Middle Ordovician Majiagou Formation in this block experienced three major transgression-regression cycles and was divided into six members. Among them, the first, third, and fifth members of the Majiagou Formation are regressive sedimentary cycles, mainly developing gypsum salt rock and carbonate rock. The second, fourth, and sixth members are transgressive sedimentary cycles, mainly developing carbonate deposits. The sixth of Majiagou Formation at the top of the block is eroded. The fifth members of Majiagou Formation develop multi-frequency cycles, and thick gypsum salt rock is developed during the regression period. The strata of the Majiagou Formation in the upper part contact the overlying Carboniferous strata in an unconformable manner, and a set of karst weathering crust reservoir is developed. From the lower salt to the fourth member of the Majiagou Formation, a set of reef beach facies dolomite reservoir is developed. The main target reservoir is dolomite in limestone. The porosity of dolomite in this block is from 2% to 6%, the permeability is lower than 0.1 mD, and there is no natural productivity, so transformation is required (Tan et al., 2024a; Tan et al., 2024b).
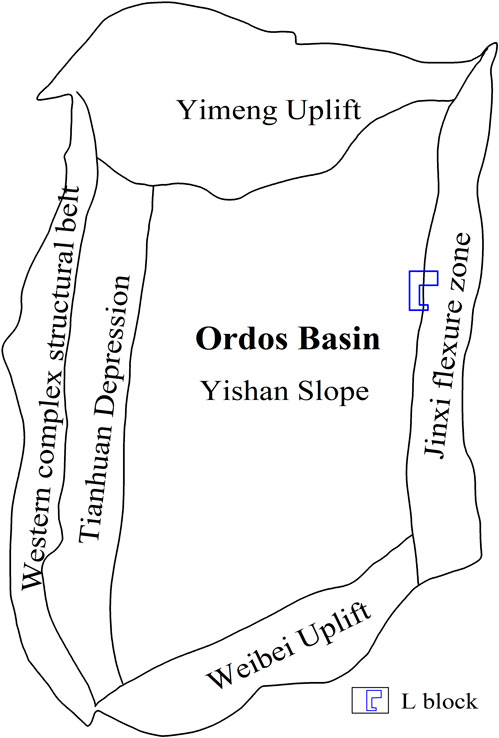
Figure 1. Overview map of Ordos basin and L work area location.
2.2 Reservoir characteristics
The carbonate reservoir of the Majiagou Formation has complex mineral types. As shown in Table 1, X-ray diffraction analysis of core samples reveals that the main mineral components of carbonate rocks are calcite and dolomite, while the secondary minerals include halite, anhydrite, quartz, feldspar, and clay minerals. As depicted in the Figure 2, based on core observation and scanning photos under the microscope, the pores can be classified as dissolved cave,anhydrite-moldic pore, fractures, crystal pores and so on. Some fractures can be observed to be filled with calcite in the reservoir. The reservoir has poor physical properties, with porosity ranging from 2% to 6% and permeability less than 1 millidarcy. The types of reservoir minerals are influenced by the sedimentary environment. Calcite and dolomite are the main minerals in the transgression stage, while gypsum rock, salt rock, and argillaceous dolomite are the main minerals in the regression stage.
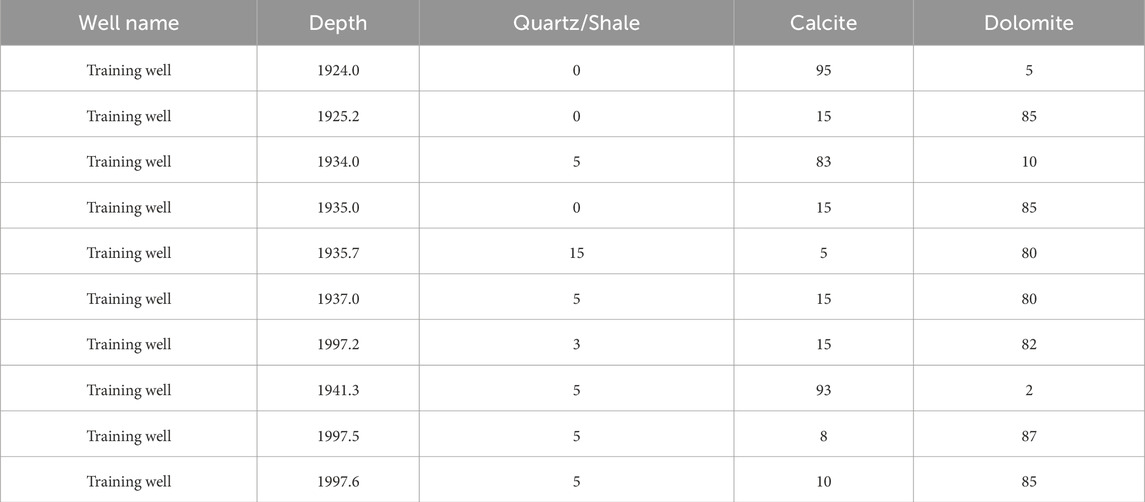
Table 1. Core X-ray diffraction mineral analysis.
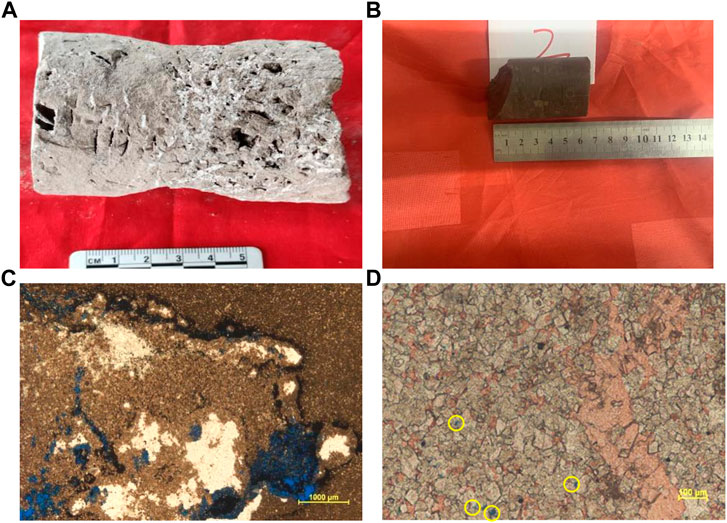
Figure 2. Core and microscopic photos of tight carbonate reservoirs in Zone L. (a) Dissolved cave,L-B, 2453.5-24534.3 m; (b) Anhydrite-moldic pore,L-A,1989-1995 m; (c) Fractures,L-B, 2410.2 m; (d) Crystal pores,L-B, 2420.3 m.
3 Methodology
To enhance the accuracy of LITCR, researchers have conducted method research from three aspects: lithology, physical properties, and gas-bearing properties. 1. Employing artificial intelligence lithology interpretation based on core experimental data to replace the traditional mineral optimization method for rapid identification of rock properties. 2. Utilizing pore structure evaluation technology based on borehole resistivity imaging logging to replace conventional porosity interpretation and provide detailed explanations of pore types and structures (Khoshbakht et al., 2012; Brekke and Roenitz, 2021; Mazdarani et al., 2023). Applying permeability evaluation technology based on array acoustic logging to replace the traditional porosity-permeability model calculation and improve the accuracy of physical permeability evaluation (Winkler et al., 1989; Tang and Cheng, 1996). 3)Adopting variable parameter fluid evaluation technology based on core experiments to replace the traditional Archie formula interpretation model and enhance the accuracy of gas saturation evaluation parameters. The specific research idea flow is shown in Figure 3.
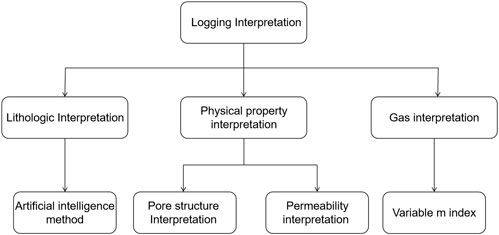
Figure 3. Flow chart of logging evaluation technology for tight carbonate reservoir.
3.1 Artificial intelligence lithology interpretation based on core experiment
For the conventional logging lithology LITCR, researchers typically use the mineral optimization method for logging interpretation. This method relies on the logging response equation of rocks and minerals, as shown in Table 2. In the process of use, it only depends on the quality of the logging data, not refers to core experimental data. To a certain extent, it cannot obtain results of experimental correction. The fast lithology interpretation technology based on neural network algorithm, through the data analysis of the core experimental X-ray diffraction minerals and the measured well logging curve, establishes the correlation between the X-ray diffraction experimental mineral content and the logging curve, and extends the learning results to the logging interpretation application of the measured well for fast lithology identification and interpretation.
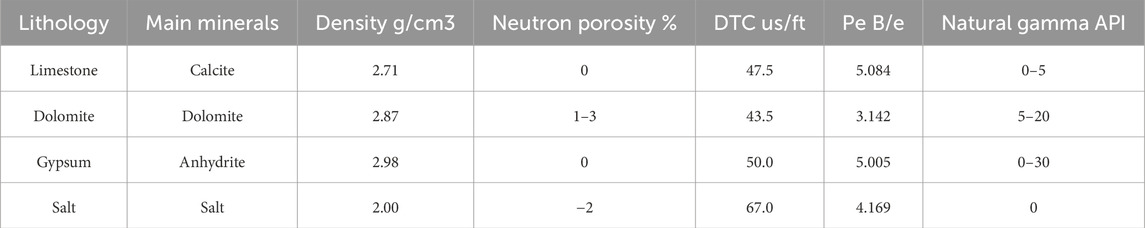
Table 2. Carbonate logging response in theory.
Multiple rock samples from the Majiagou Formation in well A of L area were subjected to X-ray diffraction experiments, and the experimental results are shown in Table 1. By using a small number of samples from this well as a learning well, the network relationship between lithologic content and logging curve is established. After training and learning, the application can finally obtain the rapid interpretation results of lithology, as shown in Figure 4. The first to ninth tracks are conventional logging curves and two-dimensional electrical imaging maps. The 10th track is the calculation result of the mineral optimization method. The 11th track is the calculation result of the neural network. The 12th track is the rapid lithologic interpretation result calculated by the neural network.
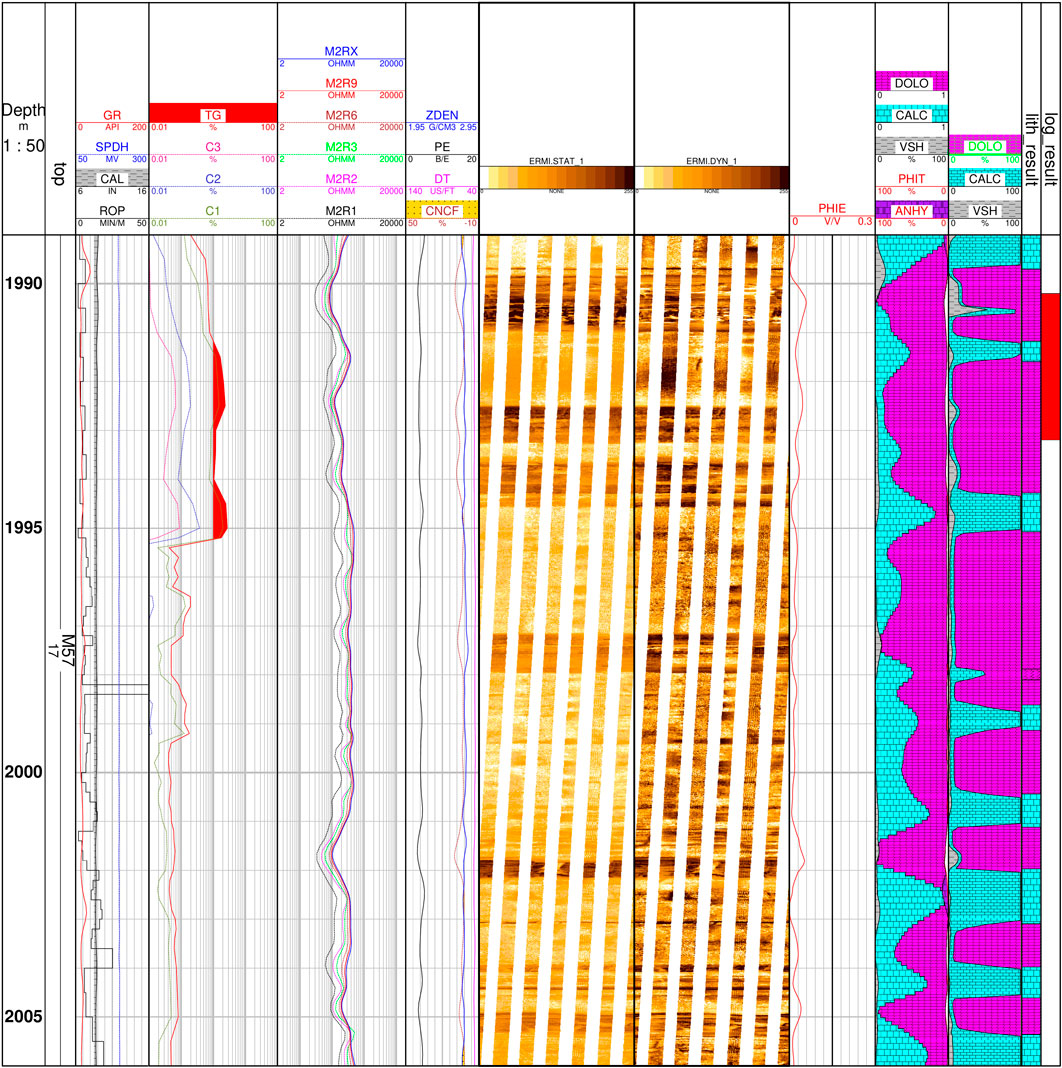
Figure 4. Fast interpretation chart of logging lithology based on Artificial Intelligence.
3.2 Physical property evaluation
The reservoir physical property evaluation established through conventional logging interpretation can characterize the ability of reservoir fluid. In tight carbonate rocks, favorable reservoirs are described by the effectiveness and connectivity of reservoir pores. The porosity spectrum and pore connectivity evaluation based on electrical imaging logging have higher accuracy in LITCR compared to the porosity evaluation based on conventional logging. The permeability evaluation based on acoustic imaging logging have more precision in LITCR compared to the Por-Perm relationship based on conventional logging. As a result, they are often more widely applied.
3.2.1 Porosity evaluation based on borehole electrical imaging
For tight carbonate reservoirs, borehole resistivity imaging logging is used to analyze porosity effectiveness by the porosity spectrum technology. Additionally, secondary porosity and face rate are further quantitatively characterized to form a fine interpretation of the reservoir and improve the vertical resolution and interpretation accuracy of porosity. The electrical imaging porosity spectrum technology is based on the Archie formula and dense sampling of electrical imaging logging, as shown in Equation 1. Through the circumferential change of resistivity, the circumferential change of porosity can be analyzed. Then, through analysis in the frequency domain, the primary and secondary pores of the formation can be distinguished and evaluated. In heterogeneous formations, considering the porosity changes in different directions around the well can help evaluate the effectiveness and connectivity of the pores and calculate the face rate. The technology of identifying different pore types based on electrical imaging logging images can quantify the contribution of connected pores, evaluate pore connectivity, and describe pore geometry.
Fractured reservoirs are developed at 2,450–2,460 m in well L-B, as shown in Figure 5. The eighth channel is the electrical imaging full sidewall image, the ninth channel is the sidewall fracture image extracted by pore effectiveness analysis, the 10th channel is the porosity spectrum, and the 11th channel is the conventional porosity calculation and face rate calculation porosity respectively. The porosity related parameters calculated by electrical imaging have higher vertical and circumferential resolution and a better evaluation effect on connectivity.
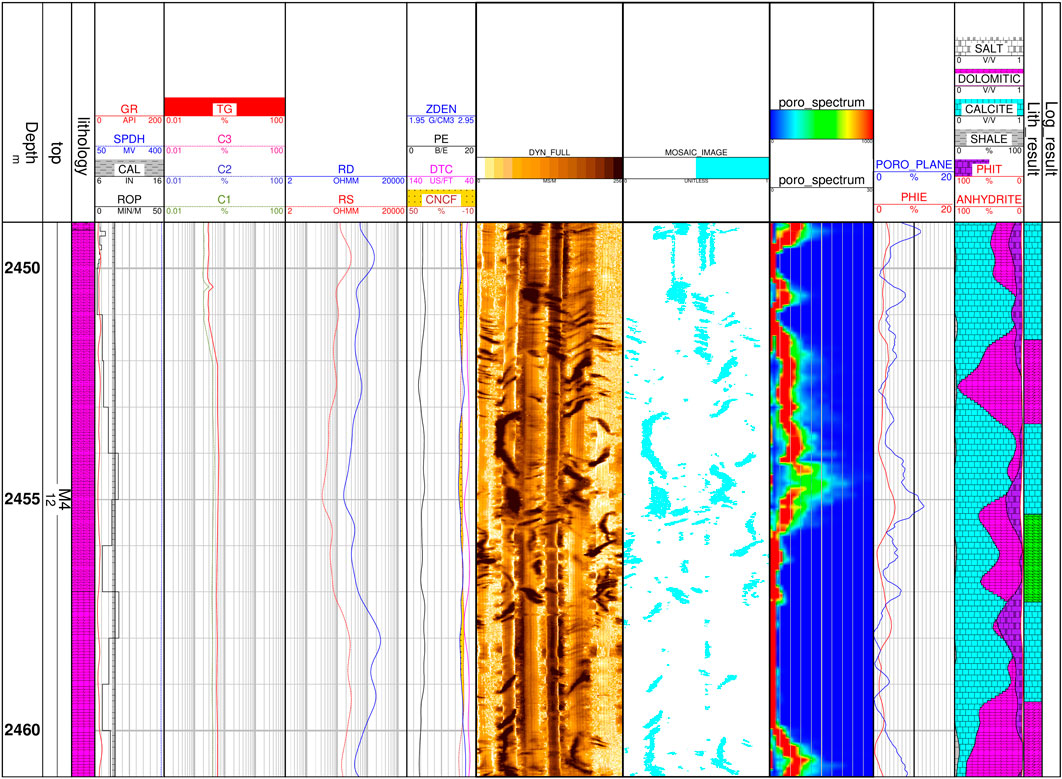
Figure 5. Fine evaluation results of porosity based on electrical imaging logging.
3.2.2 Permeability evaluation based on array acoustic wave
For low porosity and low permeability reservoirs, the accuracy error of permeability interpretation by the conventional logging porosity-permeability relationship may be two orders of magnitude. The overburden pressure porosity and permeability experiment was carried out on the tight carbonate rocks in block L. The experimental results are shown in Figure 6. The relationship between porosity and permeability is shown in Equation 2.
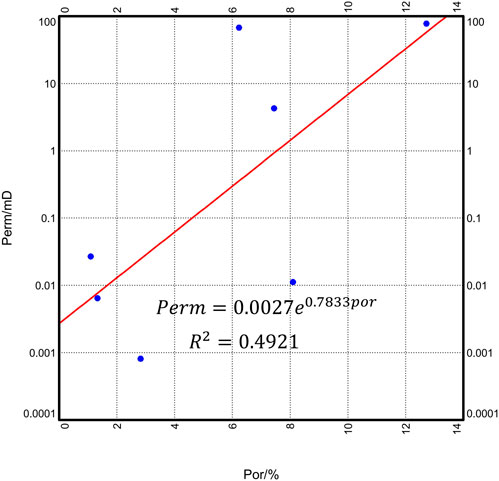
Figure 6. Permeability interpretation pore-perm fitting diagramfrom experiment.
The correlation coefficient
By controlling the minimum error between theoretical calculation and actual measurement, the permeability is inversed, and the permeability accuracy is improved by 1 - 2 orders of magnitude.
Stoneley wave permeability inversion is performed for well L-B, as shown in Figure 7. The eighth channel is acoustic two-dimensional imaging, the ninth channel is conventional interpretation porosity and experimental porosity, and the 10th channel is porosity and permeability model permeability, core permeability, and Stoneley wave inversion permeability. The porosity-permeability model permeability and core permeability, Stoneley wave permeability and core permeability are intersected at discrete points, as shown in Figure 8. The two standard errors are respectively 0.04424 and 0.01349, which verifies that Stoneley wave inversion has higher permeability accuracy.

Figure 7. Fine evaluation results of permeability based on Stoneley wave inversion.
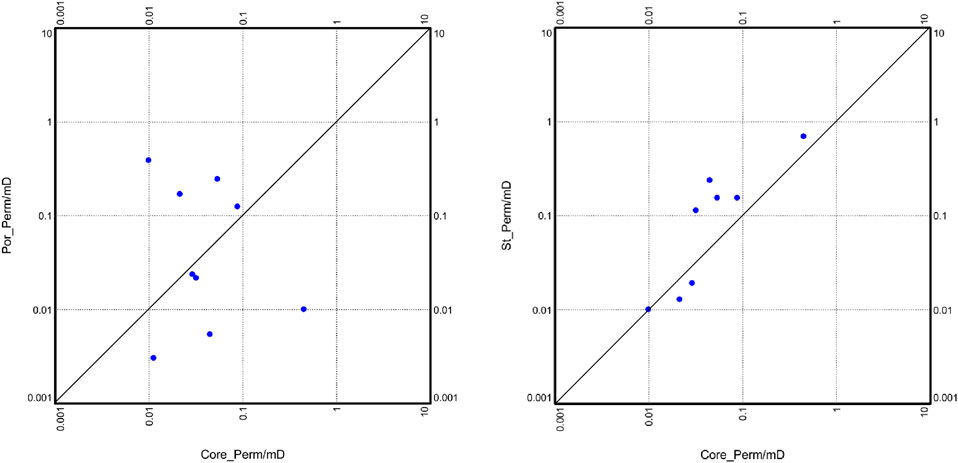
Figure 8. Comparison of interpretation accuracy between conventional permeability interpretation (left) and Stoneley wave inversion (right).
3.3 Evaluation of variable index fluid based on core experiment
Due to the characteristics of low porosity and permeability, the traditional Archie formula is not very effective in evaluating the fluid properties of tight carbonate rocks. The L-A well in this area conducts a rock resistivity experiment on the core of the dolomite reservoir. The resistivity is measured by changing the rock water saturation, and then the rock-electrical parameters of each rock sample are calculated. The data are shown in Table 3. In this chapter, two methods of fluid quantitative evaluation are compared, and the accuracy of the two methods is compared through the qualitative identification technology of imaging logging and the total hydrocarbon curve of gas logging. The conventional Archie formula calculates the gas saturation through the rock-electrical parameters a, b, m, n obtained from the rock resistivity experiment, as shown in Formula 1. The variable index Archie method considers that the parameters a and b of rock electrical parameters have little change, and m is most susceptible to porosity. Therefore, m is fitted as the relevant formula of porosity to participate in the calculation of gas saturation. The fitting results of M and porosity in this area are shown in Figure 9. The relationship of parameter m and the porosity is shown in Equation 4, and the R2 is 0.98.
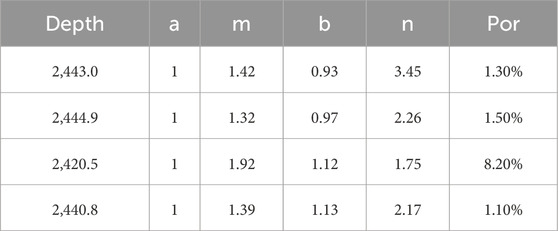
Table 3. Rock-electrical parameters experiment data.
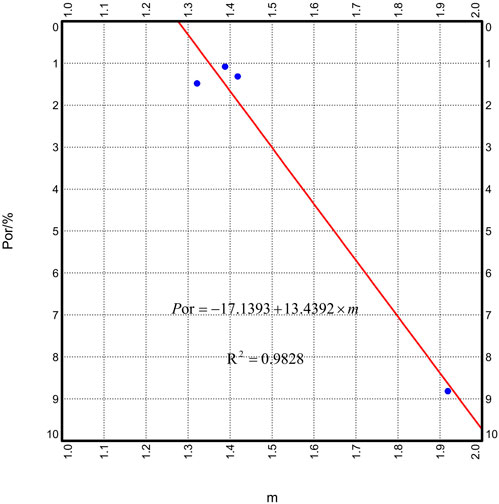
Figure 9. Relationship diagram between variable rock-electrical parameters m and porosity.
Finally, combined with the total hydrocarbon curve of gas logging, the optimal fluid evaluation method of tight carbonate rock is given by comparing the two methods.
As shown in Figure 10, the eighth channel is the porosity and saturation channel. The blue curve is the water saturation calculated by the Archie formula, the red curve is the water saturation calculated by the variable index Archie formula, and the ninth channel is the apparent resistivity spectrum analysis of electrical imaging logging. The gas saturation interpreted at 2410 m and 2420 m is close to that interpreted by the gas bearing layer and gas water layer, respectively. The characteristics of the electrical imaging spectrum peak also have the corresponding characteristics of the gas layer and gas water layer. In the 2440 m section, the Archie formula is interpreted as the gas bearing layer and gas water layer, the variable index Archie formula is interpreted as the gas water layer, and the characteristics of the electrical imaging spectrum peak are interpreted as the gas water layer, which verifies the correctness of the variable index Archie formula.

Figure 10. Fine interpretation and qualitative verification of gas saturation.
4 Discussion
For the tight carbonate reservoir in Block L, we have studied and applied imaging logging series and core experimental data to finely calibrate the logging interpretation. Comparing the interpretation results of conventional logging methods with new results, we have found the following new advances: 1)Conduct rapid lithology interpretation based on artificial intelligence algorithms through core experiments. 2)Obtain porosity spectrum and porosity curve from borehole resistivity imaging logging data to evaluate the effectiveness and connectivity of reservoir pores. 3)Obtain Stoneley wave through array acoustic logging data and invert reservoir permeability parameters. 4)Establish the Archie formula with variable m parameter through core rock resistivity experiments to optimize the interpretation of gas saturation.
5 Conclusion
This study fine tuned the results of conventional logging interpretation through core experiments and imaging logging processing, improving the accuracy of logging interpretation. This method is mainly applied to unconventional reservoirs, including tight sandstones and tight carbonate rocks. For unconventional reservoirs, the application of more advanced instruments and methods can achieve precise interpretation.
Data availability statement
The original contributions presented in the study are included in the article/supplementary material, further inquiries can be directed to the corresponding authors.
Author contributions
LD: Conceptualization, Data curation, Formal Analysis, Funding acquisition, Investigation, Methodology, Project administration, Resources, Software, Supervision, Validation, Visualization, Writing–original draft, Writing–review and editing. WK: Conceptualization, Data curation, Formal Analysis, Funding acquisition, Investigation, Methodology, Project administration, Resources, Software, Supervision, Validation, Visualization, Writing–review and editing. QY: Conceptualization, Data curation, Formal Analysis, Funding acquisition, Investigation, Methodology, Project administration, Resources, Software, Supervision, Validation, Visualization, Writing–review and editing. YS: Conceptualization, Data curation, Formal Analysis, Funding acquisition, Investigation, Methodology, Project administration, Resources, Software, Supervision, Validation, Visualization, Writing–review and editing.
Funding
The author(s) declare that financial support was received for the research and/or publication of this article. This work was financially supported by the technology project of China National Offshore Oil Corporation, titled “Reservoir Formation Conditions and Exploration Key Technologies for Bauxite and Ordovician in the Eastern Margin of the Ordos Basin” (KJZH-2023-2104). The funder was not involved in the study design, collection, analysis, interpretation of data, the writing of this article, or the decision to submit it for publication.
Conflict of interest
Authors LD, WK, QY, and YS were employed by Cnooc Research Institute Ltd.
Generative AI statement
The author(s) declare that no Generative AI was used in the creation of this manuscript.
Publisher’s note
All claims expressed in this article are solely those of the authors and do not necessarily represent those of their affiliated organizations, or those of the publisher, the editors and the reviewers. Any product that may be evaluated in this article, or claim that may be made by its manufacturer, is not guaranteed or endorsed by the publisher.
References
Brekke, H., and Roenitz, T. (2021). Using high-resolution microresistivity image logs to reconstruct paleoenvironments and stratal architectures: an example from the mcmurray formation, leismer area, northeastern alberta, Canada. Aapg Bull. 105, 1563–1593. doi:10.1306/01282118137
Farouk, S., Fagelnour, M., Zaky, A. S., Arafat, M., Salama, A., Al-Kahtany, K., et al. (2024a). Petroleum system evaluation: hydrocarbon potential and basin dynamics in abu darag sub-basin, northern gulf of suez (Egypt). Minerals 14 (11), 1154. doi:10.3390/min14111154
Farouk, S., Qteishat, A., Sen, S., Ahmad, F., El-Kahtany, K., Collier, R., et al. (2025). Characterization of the gas-bearing tight paleozoic sandstone reservoirs of the risha field, Jordan: inferences on reservoir quality and productivity. Arabian J. Sci. Eng. 50 (1), 215–235. doi:10.1007/s13369-024-09000-x
Farouk, S., Saada, S. A., Fagelnour, M. S., and Arafat, M. (2024b). Petrophysical and gas chromatographic analysis integration for hydrocarbon identifications in cretaceous reservoirs, azhar field, beni suef basin, Egypt. Egypt. J. Petroleum 33 (1), 7. doi:10.62593/2090-2468.1018
Fu, J., Zhao, H., Dong, G., Han, T., Ren, J., Huang, H., et al. (2023). Discovery and prospect of oil and gas exploration in new areas of Ordos Basin. Nat. Gas. Geosci. 34 (8), 1289–1304. doi:10.11764/j.issn.1672-1926.2023.06.004
Fu, J., Yu, Z., Li, C., Wang, W., Huang, Z., Wu, X., et al. (2021). New discovery and favorable areas of natural gas exploration in the 4th member of ordovician Majiagou Formation by well mitan 1 in the eastern Ordos Basin. Nat. Gas. Ind. 41 (12), 17–27. doi:10.3787/j.issn.1000-0976.2021.12.003
Guo, G., Xu, F. , Liu, L., Cai, Y., Qin, W., Chen, Z., et al. (2024). Enrichment and accumulation patterns and favorable area evaluation of deep coalbed methane in the Fugu area, Ordos Basin. Coal Geol. Explor. 52 (2), 81–91. doi:10.12363/issn.1001-1986.23.08.0521
He, H., Guo, X., Zhao, Z., Xi, S., Wang, J., Song, W., et al. (2022). New understandings on gas accumulation and major exploration breakthroughs in subsalt ma 4 member of ordovician Majiagou Formation, Ordos Basin, NW China. Petroleum Explor. Dev. 49 (3), 429–439. doi:10.11698/PED.20210659
Jiang, L., Yang, B., Wang, W., and Liu, L. (2022). Logging-based method to identify the lithology in carbonate rocks, Fuxian area. Nat. Gas Technol. Econ. 16 (2), 22–27. doi:10.3969/j.issn.2095-1132
Kang, S., Lv, Y., Wang, C., Wang, B., Li, Z., Zhang, Y., et al. (2024). Control of sedimentary environments on gas contents of coal seams: a case study of NO.15 coals bed of the Taiyuan Formation in Shouyang area, Qinshui Basin. J. Palaeogeogr. Ed. 26 (02), 416–430. doi:10.7605/gdlxb.2024.02.017
Khoshbakht, F., Azizzadeh, M., Memarian, H., Nourozi, G. H., and Moallemi, S. A. (2012). Comparison of electrical image log with core in a fractured carbonate reservoir. J. Petrol. Sci. Eng. 86-87, 289–296. doi:10.1016/j.petrol.2012.03.007
Lai, J., Liu, B., Feng, Q., Pang, X., Zhao, T., Wang, G., et al. (2020). Well logging identification and evaluation of depositional microfacies in dolostones from the 5th Member of the Ordovician Majiagou Formation in the Jingbian gas field, Ordos basin. Acta Geol. Sin. 94 (5), 1551–1567. doi:10.19762/j.cnki.dizhixuebao.2020201
Liu, X., He, J., Wei, L., Liu, B, Bao, H., Shi, K., et al. (2024). Sedimentary characteristics and evolution mechanism of Ordovician presalt dolomite reservoirs in the central and eastern Ordos Basin. Chin. J. Geol. 59 (3). doi:10.12017/dzkx.2024.045
Mazdarani, A., Kadkhodaie, A., Wood, D. A., and Soluki, Z. (2023). Natural fractures characterization by integration of fmi logs, well logs and core data: a case study from the sarvak formation (Iran). J. Petroleum Explor. Prod. Technol. 13, 1247–1263. doi:10.1007/s13202-023-01611-8
Meng, Q., Yu, X., Shi, J., Zhao, H., Liu, Y., Wang, Y., et al. (2023). Genesis and source of natural gas in well mitan-1 of ordovician Majiagou Formation, mid-eastern Ordos Basin, China. Nat. Gas. Geosci. doi:10.11764/j.issn.1672-1926.2023.05.011
Qi, Y., Li, D., Yu, S., and Li, Q. (2023). Geophysical exploration methods on bauxite reservoirs in L gasfield, Ordos Basin. Front. Energy Res. 11, 1328662. doi:10.3389/fenrg.2023.1328662
Qi, Y., Wu, K., Wang, B., Zheng, X., Li, W., and Li, D. (2024). Lithofacies identification of deep coalbed methane reservoir based on high-resolution seismic inversion. Front. Earth Sci. 12, 1440729. doi:10.3389/feart.2024.1440729
Tan, P., Chen, Z., Huang, L., Zhao, Q., and Shao, S. R. (2024b). Evaluation of the combined influence of geological layer property and in-situ stresses on fracture height growth for layered formations. Petroleum Sci. 21, 3222–3236. doi:10.1016/j.petsci.2024.07.014
Tan, P., Fu, S., Huang, L., Chen, Z., and Cao, J. (2024a). Effects of orthogonal cleat structures on hydraulic fracture evolution behavior. Geoenergy Sci. Eng. 241, 213119. doi:10.1016/j.geoen.2024.213119
Tang, X., and Cheng, C. H. (1996). Fast inversion of formation permeability from Stoneley wave logs using a simplified Biot-Rosenbaum model. GEOPHYSICS 61, 639–645. doi:10.1190/1.1443993
Wang, S., Wang, G., Huang, L., Song, L., Zhang, Y., Li, D., et al. (2021). Logging evaluation of lamina structure and reservoir quality in shale oil reservoir of Fengcheng Formation in Mahu Sag, China. Mar. Petroleum Geol. 133, 105299. doi:10.1016/j.marpetgeo.2021.105299
Wang, S., Wang, G., Lai, J., Li, D., Liu, S., Chen, X., et al. (2020). Logging identification and evaluation of vertical zonation of buried hill in Cambrian dolomite reservoir: a study of Yingmai-Yaha buried hill structural belt, northern Tarim basin. J. Petroleum Sci. Eng. 195, 107758. doi:10.1016/j.petrol.2020.107758
Wang, S., Wang, G., Li, D., Wu, X., Chen, X., Wang, Q., et al. (2022). Comparison between double caliper, imaging logs, and array sonic log for determining the in-situ stress direction: a case study from the ultra-deep fractured tight sandstone reservoirs, the Cretaceous Bashijiqike Formation in Keshen8 region of Kuqa depression, Tarim Basin, China. Petroleum Sci. 19 (6), 2601–2617. doi:10.1016/j.petsci.2022.08.035
Winkler, K. W., Liu, H.-L., and Linton Johnson, D. (1989). Permeability and borehole Stoneley waves: Comparison between experiment and theory. GEOPHYSICS 54, 66–75. doi:10.1190/1.1442578
Xu, C, Zhu, G., Ji, H., Zhu, Y., and Sun , Q. (2024). Exploration progress and reserve increase strategy of onshore natural gas of CNOOC. China Pet. Explor. 29 (1), 32–46. doi:10.3969/j.issn.1672-7703.2024.01.003
Yang, H., Fu, J., Wei, X., and Ren, J. (2011). Natural gas exploration domains in Ordovician marine carbonates, Ordos Basin. Acta Pet. Sin. 32 (5), 733–740.
Yao, J., Bao, H., Ren, J., Sun, L., and Ma, Z. (2015). Exploration of Ordovician subsalt reservoirs natural gas in Ordos Basin. China Pet. Explor. 20 (3), 1–12. doi:10.3969/j.issn.1672-7703.2015.03.001
Yu, S., Zhao, Z., Zhu, Y., Zhu, X., Lai, J., Li, D., et al. (2024). Reservoir characteristics and formation model of the bauxite gas reservoir: the Benxi Formation in the LX block, northeast of Ordos Basin, China. ACS Omega 9 (16), 18127–18136. doi:10.1021/acsomega.3c10097
Zhang, Y., Zhu, Y., Shao, L., Wang, C., Zhu, X., Liu, F., et al. (2023). Coal accumulation model of epicontinental sea in high-resolution sequence stratigraphic framework: a case study of Taiyuan Formation in Southern Qinshui Basin. J. Northeast petroleum Univ. 47 (04), 82–94+10. doi:10.3969/j.issn.2095-4107.2023.04.007
Zhou, J., Li, M., Wu, D., Yu, Z., Zhang, J., Zhang, T., et al. (2023). Characteristics and exploration potential of subsalt gas-bearing system in Majiagou Formation of middle ordovician in the eastern Ordos Basin. Nat. Gas. Ind. 43 (3), 34–45. doi:10.3787/j.issn.1000-0976.2023.03.004
Zhu, G., Li, B., Li, Z., Du, J., Liu, Y., and Wu, L. (2022a). Practices and development trend of unconvertional natural gas exploration in eastern margin of Ordos Basin: Taking Linxing-Shenfu gas field as an example. China offshore Oil Gas 34 (4), 16–29. doi:10.11935/j.issn.1673-1506.2022.04.002
Keywords: carbonate rock, logging evaluation, imaging logging, tight gas, unconventional exploration
Citation: Dan L, Kui W, Yu Q and Shanshan Y (2025) Fine interpretation method for tight reservoirs based on core experiments and imaging logging: a case study of tight carbonate rocks in L area. Front. Earth Sci. 13:1534598. doi: 10.3389/feart.2025.1534598
Received: 26 November 2024; Accepted: 18 March 2025;
Published: 11 April 2025.
Edited by:
Peng Tan, CNPC Engineering Technology R & D Company Limited, ChinaReviewed by:
Sherif Farouk, Egyptian Petroleum Research Institute, EgyptWang Song, China University of Petroleum, China
Weibiao Xie, China University of Petroleum Beijing, China
Copyright © 2025 Dan, Kui, Yu and Shanshan. This is an open-access article distributed under the terms of the Creative Commons Attribution License (CC BY). The use, distribution or reproduction in other forums is permitted, provided the original author(s) and the copyright owner(s) are credited and that the original publication in this journal is cited, in accordance with accepted academic practice. No use, distribution or reproduction is permitted which does not comply with these terms.
*Correspondence: Wu Kui, d3VrdWlAY25vb2MuY29tLmNu