 Dieter R. Tetzner
 Claire S. Allen
 Elizabeth R. Thomas
94% of researchers rate our articles as excellent or good
Learn more about the work of our research integrity team to safeguard the quality of each article we publish.
Find out more
METHODS article
Front. Earth Sci., 13 March 2025
Sec. Cryospheric Sciences
Volume 13 - 2025 | https://doi.org/10.3389/feart.2025.1530875
Low-concentration insoluble microparticles that are preserved in ice cores offer valuable information for reconstructing past environmental changes. However, their low concentrations and limited sample availability present challenges for extraction and recovery while ensuring representativeness of results. The analysis of ice cores using continuous flow analysis systems generates large volumes of excess meltwater as a by-product with the potential to improve the acquisition of targeted low-concentration insoluble microparticle samples. Here, we present Antarctic ice core diatom records, representative of targeted low-concentration insoluble microparticle records, recovered from excess meltwater generated from a continuous flow analysis system. We analyse these records to evaluate the feasibility of using this excess meltwater to generate replicable and representative results. Our results demonstrate that diatom records obtained from a continuous flow analysis system exhibit high recovery percentages and replicability, with minor quantifiable loss and memory effects in the system. Our multi-outlet sampling assessment highlights that the waste lines of the continuous flow analysis system are an optimal source for sampling excess meltwater. Additionally, the analysis of diatom spatial distribution in filters suggest a lower threshold for applying analytical methods which assume targeted microparticles are homogeneously distributed. These results confirm that a continuous flow analysis system can be used to extract targeted low-concentration insoluble microparticles from ice core samples, yielding representative and reproducible results.
Ice cores provide exceptionally well-preserved information of Earth’s past climate (Alley, 2010). Insoluble microparticle (IMP) records preserved in ice cores contain valuable information about past environmental conditions (Delmonte et al., 2008). These microparticle archives have significantly contributed to our understanding of atmospheric and terrestrial variations over the past million years (Petit et al., 1990; Delmonte et al., 2008; Lambert et al., 2008; Delmonte et al., 2020; Laluraj et al., 2020; Fan et al., 2021; Verma et al., 2023) and have helped synchronize ice and marine records (Wolff et al., 2022; Weber et al., 2022). Among the microparticles preserved in ice, aeolian mineral dust is the most abundant. Other IMP, such as pollen grains, diatoms, cryptotephra, micrometeorites and pollutants, have been identified in ice cores and provide unique information to reconstruct past environmental variability.
Pollen grains found in ice cores have enabled the study of past regional vegetation and improved ice chronologies based on their seasonal deposition (Festi et al., 2021; Cui et al., 2022). Diatoms recovered from Antarctic Peninsula ice core samples demonstrate a strong correlation with winds, enabling the reconstruction of past atmospheric circulation variability (Allen et al., 2020; Tetzner et al., 2022a; Tetzner et al., 2022b). Cryptotephra shards isolated from ice core layers provide valuable tie-points to link oceanic, terrestrial and atmospheric records, and enable estimating the magnitude and frequency of past volcanic eruptions (Dunbar et al., 2017; Cook et al., 2018; Tetzner et al., 2021a). Micrometeorites, extraterrestrial dust particles (<2mm), extracted from ice samples can inform about the occurrence of historical meteor showers and, through their oxygen isotope analysis, reconstruct ancient upper atmosphere isotopic composition (Duprat et al., 2007; Pack et al., 2017; Fischer et al., 2021; Rojas et al., 2021). Additionally, anthropogenic pollutants, such as Spheroidal Carbonaceous Particles (SCPs), found in low concentrations in Antarctic ice core samples, indicate the onset of coal-powered energy industries in Australia and South America (Thomas et al., 2023a; Thomas et al., 2023b).
These IMP records have the potential to provide unique environmental information when sampled at seasonal-to-annual resolution. However, the low concentration of IMPs in ice layers [<300 counts L-1; orders of magnitude below aeolian mineral dust concentration (Chesler et al., 2022)], along with the frequently limited ice core sample volume, pose challenges in acquiring samples at equivalent temporal resolution, underscoring the need to maximise meltwater volumes to ensure representative results. Continuous Flow Analysis (CFA) systems offer a potential source of surplus ice core meltwater, presenting an opportunity to enhance the acquisition of low-concentration IMP samples.
Over the past few decades, the utilisation of CFA systems for the analysis of ice core samples has undergone extensive validation (Kaufmann et al., 2008; Bigler et al., 2011; Grieman et al., 2022). CFA systems are specifically designed to melt ice core samples and selectively extract the meltwater from the inner portion of the sample for impurity analyses (Grieman et al., 2022). The excess meltwater generated from the outer part of the sample is typically discarded due to concerns about potential contamination during ice processing and handling in the lab (Bigler et al., 2011). While this practice is applicable to most traditional ice core impurity analyses, the incorporation of low-concentration IMP in a clean lab environment is very unlikely, making low-concentration IPM less susceptible to contamination, therefore, allowing for the direct utilisation of this excess meltwater. Recent studies have explored the potential of using excess meltwater from CFA systems to conduct targeted chemical and microparticle analyses (Tetzner et al., 2021b; Paleari et al., 2022; Paleari et al., 2023).
Paleari et al. (2022) and Paleari et al. (2023) demonstrated the feasibility of employing CFA excess meltwater for conducting cosmogenic radionuclide (10Be) measurements, achieving reliable high-resolution and cost-efficient results without needing additional ice core samples. Tetzner et al. (2021b), in turn, explored the use of discretely melted ice and CFA excess meltwater to recover polystyrene particle standards (low-concentration IMP analogues) and developed a discrete and continuous method to extract, recover and analyse targeted low-concentration IMP present in ice cores. While analysing CFA excess meltwater samples, Tetzner et al. (2021b) found considerable microparticle losses inside the CFA system, tentatively attributed to polystyrene material failure under freezing conditions. While a method validation using genuine ice core IMP from discrete samples (melting isolated sections of the ice core) was presented in Tetzner et al. (2021b), a corresponding method validation for CFA-obtained samples was not provided, leaving the representativeness of the continuous sampling method for authentic IMP, unresolved. Furthermore, the lowest concentration samples used in the development of the method were found to exceed the concentrations obtained in genuine low-concentration IMP samples (Tetzner et al., 2022a), raising questions about the minimum threshold for reliable results from this excess-CFA method.
This study aims to validate a statistically representative standardised CFA method for the extraction, recovery, and analysis of low-concentration IMP preserved in ice cores. We assess the use of excess meltwater obtained from a CFA system to extract, recover, and analyse diatoms preserved in ice core layers, applying the method proposed by Tetzner et al. (2021b) and comparing the recovery with results from discrete samples of the same ice core sections. Diatoms are preserved in ice cores in low concentrations (∼<300 counts L-1), and in a wide range of sizes (∼1–100 μm) and morphologies, making them useful representatives of targeted low-concentration IMP preserved in the ice. Diatom counts, concentration, degree of preservation, size, and diversity are used to assess the representativeness of CFA samples compared to discrete samples. A replicate of each sample is incorporated to quantify the record and method variability. Additionally, the distribution of diatoms is evaluated to establish the lowest applicability threshold for the Tetzner et al. (2021b) method.
The method makes use of two types of ice cores; (1) Sections from a 1 m long fabricated ice core made from Milli-Q™ ultrapure water (18.2 MΩ cm; MQ), and (2) Sections from genuine Antarctic ice cores. A pre-assessment of targeted low-concentration IMP concentration using bulk samples from the genuine Antarctic ice core sections analysed on this study yield site-specific low concentrations (∼<20 counts L-1) of pollen, micrometeorites and cryptotephra, but a considerable number of diatoms (∼<100 counts L-1). Based on these results, this study uses diatoms as the primary low-concentration IMP to test the CFA system. From this point on, we use ‘diatoms’ to refer to the targeted IMP of this study and use IMP as a generic term to cover all components.
A 1-m long artificial ice core was made from MQ water to obtain laboratory blanks for this study. MQ water was poured inside a pre-cleaned, 1-m long polyethylene layflat bag, thermos-sealed on one side. After pouring the MQ water, the bag was sealed on its open side and left to freeze (−23°C) horizontally in a freezing chamber at the British Antarctic Survey (BAS). The resulting MQ ice core was removed from its bag and handled on top of surfaces covered with aluminium foil to ensure MQ ice remained clean throughout. The MQ ice core was cut using a bandsaw with a steel blade in the cold laboratory facilities at BAS, to produce ten, square base (3.4 × 3.4 cm), 10-cm long, MQ ice strips (MQ-ice blanks). One MQ-ice blank was set aside for the analysis of the bulk MQ used to prepare MQ-ice blanks (MQ-bulk). The MQ-bulk was analysed to assess the microparticle content of the MQ-ice blanks before they were exposed to environments where genuine ice core samples had been handled and processed. All the cold laboratory working surfaces were pre-cleaned using Isopropyl Alcohol (IPA) before ice blanks and samples were handled on top of them. A second MQ-ice blank was used to rub these pre-cleaned surfaces (MQ-bench) to assess the potential incorporation of insoluble microparticles from within the laboratory environment. The remaining eight MQ-ice blanks were used for melting in a Continuous Flow Analysis (CFA) system (See section 2.2).
Two 1-m long (9.7 cm diameter) ice core sections from the Dyer Plateau ice core (70°40′16″S; 64°52′30″W; 2002 m a.s.l.) (Thompson et al., 1994), were analysed in this study. The two ice core sections, D80 and D85, correspond to ice from 79 to 80 and 84–85 m depth, representing the interval 1850–1854 CE and 1838–1841 CE, respectively. These sections were selected based on their favourable pre-assessment of diatom concentration using bulk samples [∼20-200 times lower than concentrations of 1350–13,500 (counts L-1) presented by Tetzner et al. (2021b)], an appropriate volume of ice available to obtain four replicate samples per ice core section, a high ice density (>0.85 g cm-3) ensuring large meltwater volume per sample, long continuous sections (>0.4 m) without breaks or cracks and favourable chronology supporting multiple annual cycles per meter of ice.
The ends of D80 and D85 cores were cleaned, and any sections of broken or cracked ice were removed, leaving two flat based ice cylinders of 40.3 cm (D80) and 64.4 cm (D85) long, roughly representing two and three annual cycles, respectively. Each cylinder was later cut into four, equally long, equal square base (3.4 × 3.4 cm) longitudinal sections (Supplementary Figure S1). All cuts were performed using a band-saw with steel blade in the cold laboratory facilities at BAS. All sides of the square-base longitudinal sections were cleaned using a ceramic knife to remove all external particles potentially incorporated while cutting or handling the ice. Two of the replicate longitudinal sections per core (D80-1 & D80-2; D85-1 & D85-2) were used to test the recovery of diatoms after passing through the CFA system (See section 2.2). The remaining two replicate longitudinal sections per core were processed as discrete samples and used as reference (D80-3, D80-4, D85-3, D85-4), to test the diatom original variability.
Eight MQ-ice blanks (MQ1-MQ8) and the four CFA-ice core samples (D80-1, D80-2, D85-1, D85-2) were melted using a CFA system in the ice chemistry lab at BAS (Grieman et al., 2022), slightly modified for this experiment to only pump meltwater through one line of instruments connected in series (Figure 1A). The sampling strategy comprised four sample runs starting with a MQ-ice blank, followed by a CFA-ice core sample and finalised with a MQ-ice blank (Figure 2). Meltwater was sampled at each of the three steps of the run. This three-step sampling sequence per run was designed to rinse the CFA-lines before and after each CFA-ice core sample, aiming to isolate the diatom content from each CFA-ice core sample and assess potential ‘memory’ effects in the system. Ice was melted at a constant rate of 40 mm/min and split in the CFA melt plate into five identical 1.6-m long Perfluoroalkoxy alkanes (PFA) tubes (internal diameter: 1.58 mm). The melt plate design diverts ∼30–40% of the meltwater into a central “sample line” channel (SL), and the remaining ∼60–70% excess meltwater goes randomly into four “waste line” channels (WL) at the sides of the melt plate (Figure 1B). All meltwater was pumped using a Ismatec™ IPC digital peristaltic pump through Polyvinyl chloride (PVC) tubing (internal diameter: 2.54 mm) at 30 rpm. SL meltwater was then pumped through smaller diameter tubing (internal diameter: 1.52 mm) to a manifold, where it was diverted into two lines (Figure 1). One of those lines (D-C line) was connected to a second Ismatec™ IPC digital peristaltic pump (PVC tubing with internal diameter of 0.76 mm and pump speed 15 rpm), pumping meltwater from the manifold to three instruments connected in sequence; (1) a liquid electric conductivity Amber Science Dionex CDM-1 flow-through meter (See Figure 1: “Conductivity 1”), (2) a flow-through Klotz Abakus laser particle counter (See Figure 1: “Dust”) and (3) a liquid electric conductivity Amber Science Dionex CDM-1 flow-through meter (See Figure 1: “Conductivity 2”). The second line where SL meltwater was diverted was an open-split end draining over-flow meltwater from the manifold (OFL) (Figure 1A). All meltwater pumped through the CFA system was directly bottled into new, pre-cleaned, low-density polyethylene (LDPE; Nalgene™) bottles at the end of each line (WL, OFL & D-C). Sample collection bottles were changed after each of the three steps described in the sampling sequence (Figure 2), only once the ice was completely melted and the tubing was empty of meltwater. A total of 42 samples (WL, OFL, D-C for D80-1 (9 samples), D80-2 (9 samples), D85-1 (9 samples) and D85-2 (9 samples); reference samples for D80-3 (1 sample), D80-4 (1 sample), D85-3 (1 sample) and D85-4 (1 sample); MQ-bulk (1 sample) and MQ-bench (1 sample)) were filtered and analysed for their diatom content.
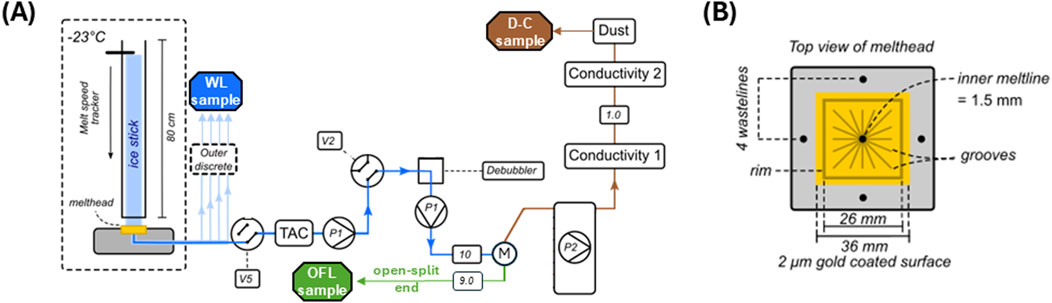
Figure 1. Schematic of the Continuous Flow Analysis (CFA) system in the ice chemistry lab at the British Antarctic Survey (BAS), restructured for this experiment [diagram modified from Grieman et al. (2022)]. (A) Diagram showing the instruments connected in the restructured BAS CFA setup presented in this study. Numeric labels in the diagram represent the volume of meltwater pumped through each line (mL per minute). (B) Diagram illustrating CFA melt head from top-view. WL = Sampling outlet from the CFA waste lines. OFL = Sampling outlet from the CFA overflow line. D-C= Sampling outlet from the CFA conductivity and microparticle instrument line. TAC = Total air content instrument. P1 and P2 = CFA peristaltic pumps. M = CFA Manifold. V2 and V5 = CFA valves.
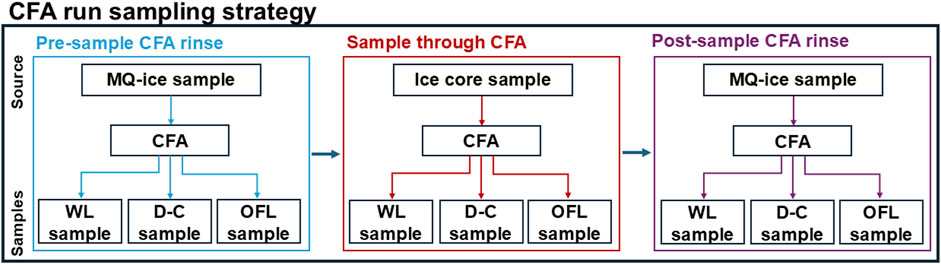
Figure 2. Flowchart showing the sampling strategy followed on each of the four CFA runs conducted in this experiment (MQ1>D80-1>MQ2; MQ3>D80-2>MQ4; MQ5>D85-1>MQ6; MQ7>D85-2>MQ8).
MQ-bulk, MQ-bench and the four reference samples (D80-3, D80-4, D85-3 & D85-4), were directly bottled into new precleaned, low-density sealed LDPE Nalgene™ bottles and left to melt under controlled temperature conditions (+4°C) for analyses as discrete samples.
The analyses of diatoms in the discrete meltwater samples were conducted following the method and recommendations outlined in Tetzner et al. (2021b). The meltwater from each bottle was pumped through PVC tubing (internal diameter: 2.54 mm) using a Ismatec™ IPC digital peristaltic pump at 30 rpm, and filtered through a 13 mm diameter, 1.0 μm pore size Whatman™ Polycarbonate membrane filter, inside clean polypropylene Swinnnex™ filter holders. After filtering the meltwater contained in each bottle, sample bottles were rinsed with MQ water, and all rinsing water was then filtered through the corresponding sample filter. Filter holders were thoroughly rinsed with MQ water after every sample.
Following Tetzner et al. (2021b) method, all filters were mounted onto aluminium stubs for analyses on an automated Scanning Electron Microscope (SEM) at the Earth Sciences Department of the University of Cambridge. The entire filters were imaged on a Quanta-650F using Back Scattered Electrons (BSE) on a low-pressure mode. Each filter was imaged at ×800 magnification for diatom identification/classification, counting and morphometrics. The area of each 13 mm diameter filter was divided into four horizontal grids to analyse diatom spatial distribution. Given the circular shape of the filter, each of the two central grids (T1 and T2) account roughly for ∼33% of the filter area, whereas each of the two grids at the top and bottom of the filter (T3 and T4) account for ∼16.5% of the filter area (Supplementary Figure S2). Diatom spatial distribution on each filter is presented in three groups, each representing a third of the filter area (T1, T2 and T3+T4). Diatom spatial distribution results are reported as a percentage calculated from the counts per third of the filter area (T1, T2 and T3+T4), divided by the total number of counts in the filter. A percentual filter variability parameter was calculated to assess the distribution of diatoms in the filter. This parameter was calculated as the standard deviation of the percentual values obtained from each third (T1, T2 and T3+T4) per filter.
All diatoms were counted and broadly classified in groups based on shared morphology or features. The taxonomical identification of each diatom is beyond the scope of this study and unnecessary to evaluate the distribution and variability of diatoms within the ice and filters. Since fractured particles (e.g., diatoms) were observed in pre-assessed bulk samples and the possibility of this parameter to yield a useful comparison, diatoms were also classified as either whole or fragments. Morphometric values reported correspond to the length of the longest axis of each diatom particle. All values reported in this study are presented as the mean between the results obtained from replicate samples, accompanied by their percent error (Equation 1).
MQ-bulk and MQ-bench blanks were analysed for the presence of diatoms. The MQ-bulk sample presented only ∼10–50 amorphous insoluble aeolian mineral dust grains. The MQ-bench sample exhibited ∼100-1000 insoluble microparticles, mostly amorphous insoluble aeolian mineral dust grains and fibres, but no diatoms.
Meltwater volume generated from the replicates of D80 and D85 reference samples were similar with a percentage error of less than 0.5% (Table 1).
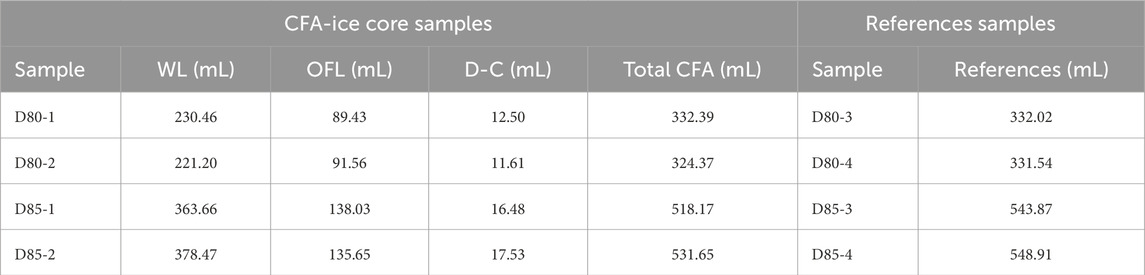
Table 1. Meltwater volume obtained from the discrete ice core reference samples and recovered from each CFA outlet. WL = Samples obtained from CFA waste lines. OFL = Samples obtained from CFA overflow line. D-C= Samples obtained from CFA dust particle counter/conductivity line. Total CFA = The combined contribution of WL, OFL and D-C.
A total of 51 diatoms were found in D80 reference samples (D80-3 and D80-4), with a mean value of 25.5 ± 2.0% diatoms per sample (Table 2; Figure 3A). Both D80 reference samples presented similar diatom concentration values, with a mean of 76.9 ± 2.0% (diatoms L-1). Both D80 reference samples (D80-3 and D80-4) presented diatom records which were predominantly constituted by diatom fragments (70%–81%) with a minor presence of whole diatom valves (19%–30%). Overall, 26% of the diatoms (fragments & whole) in the D80 references samples were classified into six groups based on their features and morphology. (Figure 4A; Figure 5), with only groups D1 and D2 present in both D80-3 and D80-4 samples (Table 2). Diatom size statistics were similar in both D80-3 and D80-4 samples, with mean and median values being 9.5 ± 3.4% and 7.8 ± 3.2% (µm), respectively.

Table 2. Summary of results from reference samples.
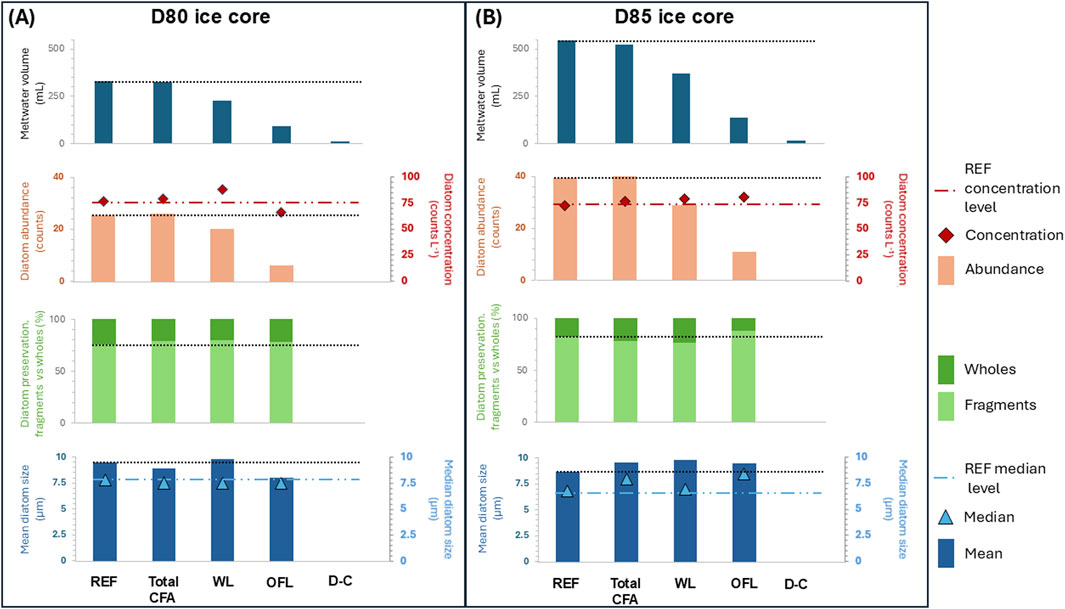
Figure 3. Discrete (REF) vs. Continuous Flow Analysis (CFA) results comparison. (A) Combined results obtained from the analysis of D80 ice core samples. (B) Combined results obtained from the analysis of D85 ice core samples. The black dashed line in each plot represents the magnitude of the REF sample on each parameter for comparison. WL = Samples obtained from CFA waste lines. OFL = Samples obtained from CFA Overflow line. D-C= Samples obtained from CFA conductivity/particle counter line. Total CFA = Combined contribution of WL, OFL and D-C.
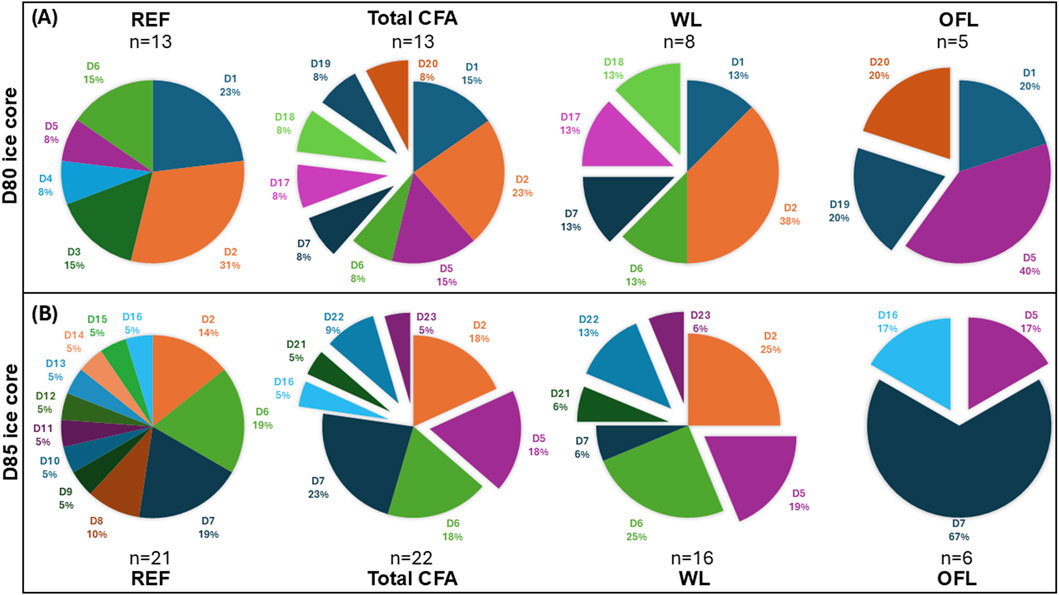
Figure 4. Pie charts showing how the identified diatom groups are distributed in the various samples Pie chart wedges detached from the main pie in the three CFA charts represent the groups that were not identified in the REF samples. Pie charts are sorted by the ice core from which they were sampled and the sample method. (A) Diatom groups identified in D80 ice core samples. (B) Diatom groups identified in D85 ice core samples. REF = Reference (discrete) samples. WL = Samples obtained from CFA waste lines. OFL = Samples obtained from CFA Overflow line. Total CFA = The combined contribution of WL, OFL and D-C. n = number of diatoms included in the correspondent pie chart.
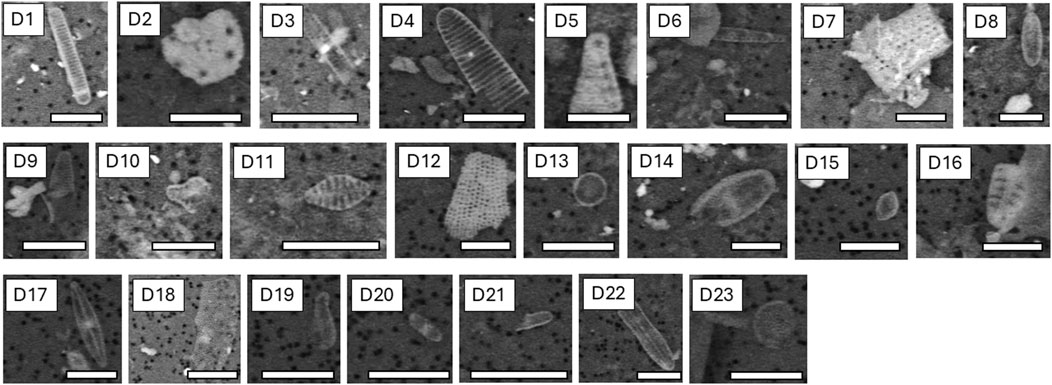
Figure 5. SEM micrographs presenting examples of each diatom group found in D80 and D85 samples. Bottom white bar on each micrograph represents a 10 µm scale bar.
A total of 79 diatoms were found in D85 reference samples, with a mean value of 39.5 ± 3.8% diatoms per sample (Table 2; Figure 3B). Diatom concentration presented comparable values with a mean of 72.3 ± 4.3% (diatoms L-1). Diatom records preserved in D85 reference samples were mainly comprised of diatom fragments (80%–84%) and the occasional presence of whole diatom valves (16%–20%). Overall, 28% of the diatoms found were classifiable. A total of 12 diatom groups were identified in D85 reference samples (Figure 4B; Figure 5), with only four found in both samples (Groups D2, D6, D7 and D8) (Table 2). Diatom size statistics were similar in both samples, with mean and median values of 8.7 ± 4.8% and 6.8 ± 3.7% (µm), respectively.
Meltwater volume recovered from CFA-ice core samples (D80-1, D80-2, D85-1 and D85-2) represented, on average, 97.5% ± 1.5% of the meltwater obtained from the corresponding reference samples (Table 1). The meltwater volume recovered from each of the three CFA-lines display a consistent pattern with mean partial contributions of 68%, 26.2% and 3.3% from WL, OF and D-C lines, respectively (Figure 3; Table 1).
Each of the eight MQ-ice blanks melted before and after a CFA-ice core samples were analysed for the presence of diatoms and no diatoms were found (Table 3).
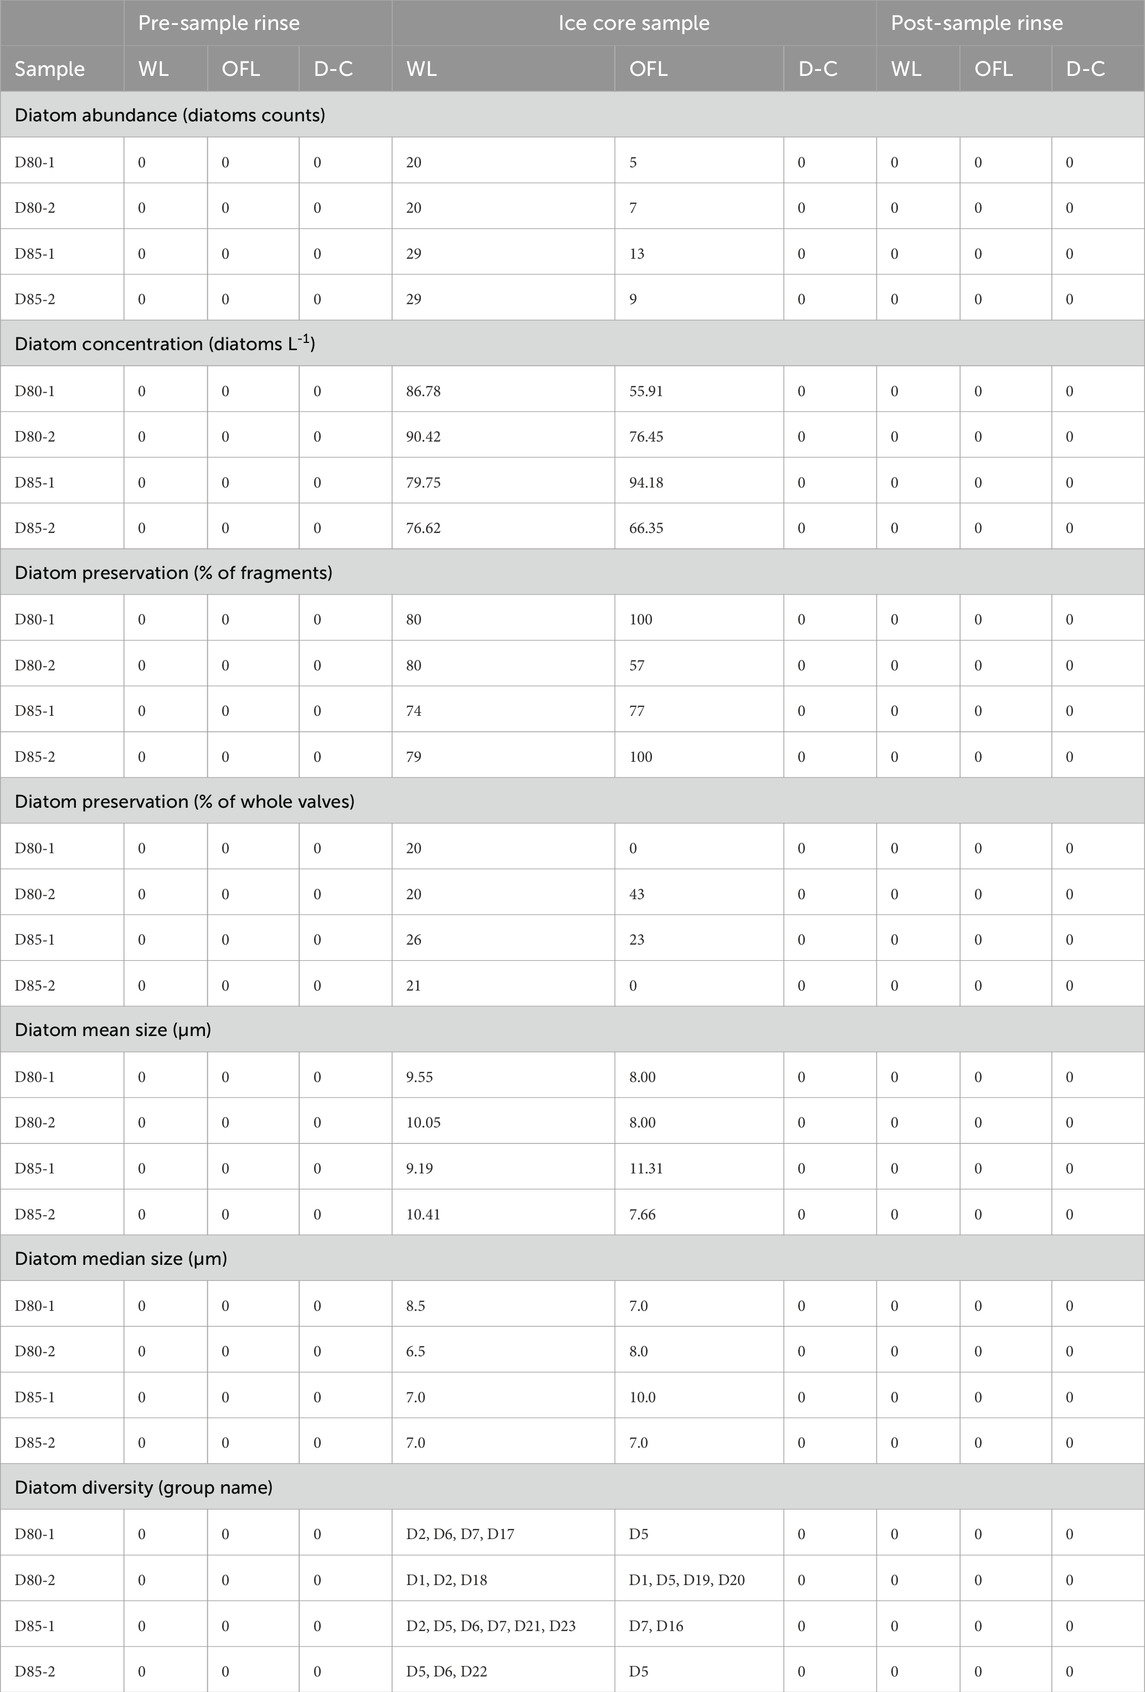
Table 3. Summary of results obtained from CFA-ice core samples. WL = Samples obtained from CFA waste lines. OFL = Samples obtained from CFA Overflow line. D-C= Samples obtained from CFA conductivity/particle counter line.
A total of 52 diatoms were found on D80 CFA-ice core samples (Table 3), with a mean value of 26 ± 3.8% diatoms per sample and a mean recovery percentage of 100% ± 2.0% relative to the discrete reference sample (Figure 3A). Both D80 CFA-ice core samples presented similar diatom concentration values, with a mean of 79.2 ± 5.1% (diatoms L-1). D80 CFA-ice core samples were mostly comprised of diatom fragments (79%) with some whole diatom valves (21%). Among all diatoms found in D80 CFA samples, 25% were classifiable. Nine diatom groups were identified in D80 CFA-ice core samples (Figure 4A), with only two of them present in both samples (Group D2 and D5; Figure 5; Table 3). Diatom sizes ranged from 5 to 30 μm, with mean and median values of 8.9 ± 10.1% and 7.5 ± 0.0% (µm), respectively.
A total of 80 diatoms were found in D85 CFA-ice core samples (Table 3), with a mean value of 40 ± 5.0% diatoms per sample, yielding a mean recovery percentage of 101.3% ± 5.0% relative to the discrete reference sample (Figure 3B). Diatom concentration presented a mean value of 76.3 ± 6.2% (diatoms L-1). The D85 CFA-ice diatom record was mainly comprised of diatom fragments (78%) with a minor proportion of whole diatom valves (22%). Among all diatoms found in the D85 CFA samples, 28% were classifiable. A total of nine diatom groups were identified in D85 CFA-ice core samples (Figure 4B), with two groups identified in both samples (Group D5 and D6; Figure 5; Table 3). The diatom specimens ranged in sizes from 5 to 35 μm, with mean and median values of 9.6 ± 1.7% and 7.75 ± 9.7% (µm), respectively.
Results from D80 and D85 CFA-ice core sample subsets (WL, OFL, D-C line) show a strong dependence on the volume of meltwater filtered per sample (Supplementary Figure S3). The highest number of diatoms were consistently found on the WL filters, followed by the OFL filters. No diatoms were found on the D-C line filters (Table 3). The analysis of discrete reference and CFA-ice core samples for each sample set (D80 and D85), reveal a positive linear relationship between the volume of meltwater filtered and the number of diatoms found per sample (slope = 81.8, R2 = 0.96; and slope = 69.9, R2 = 0.98 for D80 and D85, respectively) (Supplementary Figure S3).
Diatom records recovered from the WL and OFL presented similar mean values to their corresponding reference samples but different levels of variability depending on the CFA line used (Figure 3). In D80, the diatom concentration was ∼15% higher in the WL compared to the reference sample. While the diatom concentration in the OFL was ∼14% lower than the reference sample. The fragment percentage exhibits greater variability in the OFL (78.5% ± 27.4%) than the WL (80.0% ± 0.0%). Diatom size statistics were different in both CFA outlets, with WL values (x̄ = 9.8 ± 2.55% µm) being similar to reference samples (x̄ = 9.5 ± 3.4% µm) and OFL values being slightly lower (x̄ = 8.0 ± 0.0% µm) (Figure 3A). As such, in most metrics WL samples are more comparable with the reference samples compared to the OFL (Figure 4A).
Similar results were obtained when comparing D85 WL against D85 OFL. In D85, WL and OFL diatom concentration values were 8% and 10% higher than the reference sample, respectively (Table 3). As seen in D80 samples, the percentage of fragments exhibits greater variability in the OFL (88.5% ± 13.0%) than the WL (76.7% ± 3.4%). D85 reference diatom diversity is better matched by D85 WL, than D85 OFL (Figure 4B). Diatom size statistics were similar in both CFA outlets but slightly higher than reference samples, with OFL values (x̄ = 9.5 ± 19.2% µm) being more similar to reference samples (x̄ = 8.7 ± 4.8% µm) than WL values (x̄ = 9.8 ± 6.2% µm) (Figure 3B).
The spatial distribution of the diatoms on each filter is evaluated based on the diatom percentage per transect (Table 4). The analysis of all REF, WL & OFL samples revealed two types of distribution; (1) uneven distribution with mean T1, T2 and T3+T4 transect values of 21.2% (±2.7%), 28.3% (±9.3%) and 50.2% (±9.4%), respectively, displayed by all OFL samples and (2) a more homogeneous distribution with T1, T2 and T3+T4 mean transect values of 34.1 (±2.0%), 32.7 (±1.4%) and 33.2 (±2.3%), respectively, exhibited in all REF and WL samples. The standard deviation of transect values per filter shows a similar pattern, with OFL values ranging from 19.3% to 24.7%, while REF and WL values ranged from 2.3% to 10.0% (Figure 6).
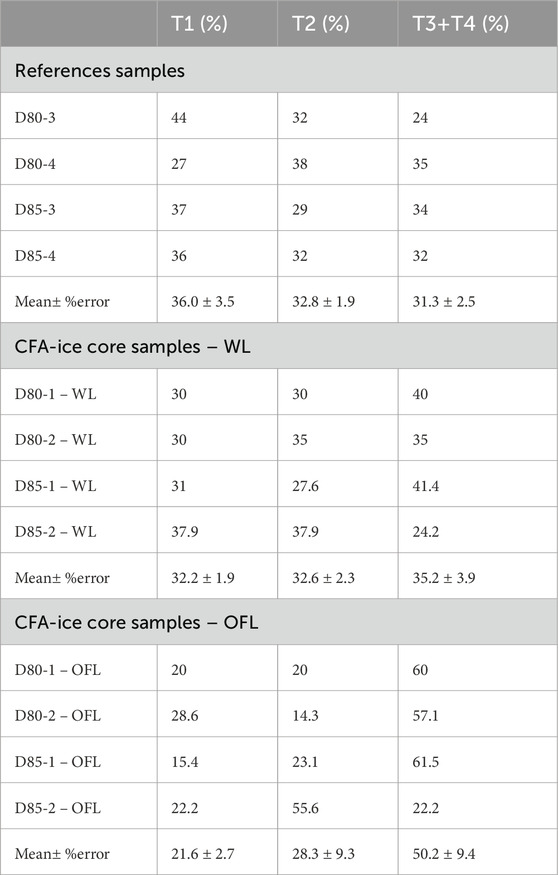
Table 4. Spatial distribution of diatoms on each filter. Reported values represent the percentage per transect of the total diatoms found on each filter (See Supplementary Figure S2). Each column represents an area equivalent to ∼33% of the filter surface. WL = Samples obtained from CFA waste lines. OFL = Samples obtained from CFA Overflow line.
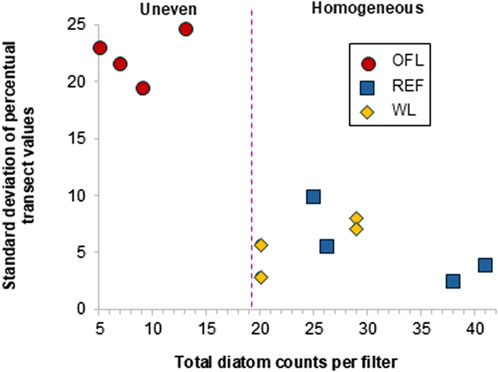
Figure 6. Percentage per transect standard deviation with increasing total diatom counts per filter. Red circles represent values obtained from OFL samples. Blue squares represent values obtained from reference samples. Yellow diamonds represent values from WL samples. The purple dashed line represents the transition from Uneven to homogeneous diatom distribution. REF = Reference samples. WL = Samples obtained from CFA waste lines. OFL = Samples obtained from CFA Overflow line.
Our experimental setup was designed to test the replicability of recovering diatoms (as an example of low-concentration IMP) preserved in ice core samples. The absence of diatoms in laboratory blanks (MQ-bulk and MQ-bench) assure that all diatoms found in this experiment were sourced from the ice core samples. The diatom counts obtained from the discrete reference samples consistently presented low variability (Percent error <5%) (Section 3.2; Table 2), in line with a previous study showing diatom records preserved in ice cores can be replicated with high accuracy (<4.2% (Tetzner et al., 2021b)). The similar results and the low variability obtained from the diatom records preserved in reference samples confirm these samples are suitable to be used as reference values to assess the diatom (and therefore other IMP) recovery from a CFA system.
Similarly, the diatom records obtained from both D80 and D85 total CFA-ice core samples (combined WL & OFL) consistently presented low variability (<6.3%, excepting for D80 mean size value (10.1%) and D85 median size value (9.7%)) (Section 3.3; Table 3), comparable to values obtained from discrete samples (reference samples [<5.0%) and Tetzner et al. (2021b)]. These results indicate that analyses via the CFA system does not increase variability in the record, thus, providing evidence that records preserve their original variability even after samples have been pumped through a CFA system.
The analyses of diatom recovery onto filters presented comparable results, regardless of the method used to obtain each sample (discrete melt (reference samples) or CFA meltwater). The diatom record from the combined CFA-ice core samples presented high recovery rates and similar variability to reference samples (Table 2 and 3). These results suggest the CFA system does not modify the record. Despite the strong similarities between replicated samples, the diatom concentration was found to be slightly higher in CFA-samples (<4 diatoms L-1) compared with the discrete reference samples (Figure 3). These higher values can be explained by the slightly reduced meltwater volume recovered from the CFA system (between 96% and 99% of reference volume) (Table 1), therefore, directly increasing the diatom concentration. The consistency in meltwater volumes generated from reference samples imply all ice samples should have generated the same meltwater volume (Table 1). A possible explanation for the reduced meltwater of CFA-ice core samples (on average ∼12 mL) could be the combined effect of meltwater remnants in the CFA system and the occasional intake of meltwater through the melt stream debubbler (used to extract the gas volume from the melt stream; Figure 1A). Occasional meltwater remnants, evident as sparse drops along the walls of the wider peri-pump tubing and WL, were observed after pumping each sample through the CFA system. Both conditions likely contributed to the final, slightly reduced meltwater volume recovered from the CFA-system.
While retention of small volumes of meltwater in the CFA system could provide a source of particle loss and create a memory effect in the samples, the absence of diatoms on the MQ-ice blank filters before and after each sample shows there are no discernible losses from this lodging effect (Table 3). Reliable recovery of diatoms from the CFA is also supported by the positive linear relationship between the volume of meltwater filtered and the similar number of diatoms present in both CFA and reference samples (Supplementary Figure S3).
The marginally higher diatom concentration found in CFA-ice core samples can be explained by the slightly reduced meltwater volumes, caused by occasional diversion of small meltwater volumes into the debubbler and sparse meltwater retention in the CFA system. This minor decrease in meltwater volume from the CFA is consistent with a previous study testing the recovery of polystyrene microspheres on the BAS CFA system (Tetzner et al, 2021b), in which particle loss inside system (21.7% ± 10.2%) and a potential memory effect (<3%) was mostly attributed to polystyrene microparticle freezing within the CFA and disintegrating. Here we show that testing the recovery of diatoms as an example of real low-concentration IMP preserved in ice core samples, avoids complications from using synthetic particles as a proxy of IMP and thus provides a more realistic estimate of CFA low-concentration IMP particle recovery. The higher consistency and lower variability of our diatom recovery results from the CFA system further supports that this study yields more realistic results than previously presented by Tetzner et al. (2021b).
Our results confirm diatom records can be reliably obtained from a CFA system. Nevertheless, our results also show that, when sampling diatoms, samples with concentrations below 80 particles L-1 (previously reported values ranging from 0 to <3000 counts L-1 (Tetzner et al., 2022a)), the accuracy of diatom recovery from the CFA system is tightly dependent on the CFA line (WL, OFL or D-C lines) from which a sample was obtained and specifically the volume of meltwater obtained (Table 3; Figure 3). Diatom concentrations in D80 and D85 are too low to be represented in the small volume of meltwater (<18 mL) sampled through the D-C line (See section 4.2; Supplementary Figure S3). We highlight the deficiency of the D-C line to sample low-concentration IMP, unless particle concentrations or sample volume are at least an order of magnitude higher than the samples used in this experiment.
Concentrations of diatoms obtained from WL and OFL lines were similar, although OFL values presented greater variability (Section 3.3; Table 3). The higher variability evident in OFL samples can be partly explained by the smaller meltwater volume and limited number of diatoms recovered from that outlet, with the addition of a single diatom causing a disproportionately large effect in diatom concentrations. The greater uncertainty in the results obtained from the OFL line suggests that OFL results may need to be excluded unless considerably increasing meltwater volume per sample. Diatom concentrations obtained from WL presented low variability but were systematically higher than reference samples (between 8% and 15%) (Table 3). Although there is no obvious explanation for these elevated diatom concentrations, the low uncertainty (<4%) permits accurate correction of the WL concentration estimates. Altogether, a combination of WL and OFL provides an accurate representation of the reference samples. However, if a single CFA sample source is to be used to obtain reliable results, the WL is the best CFA outlet for obtaining representative results.
Our experimental results show that diatoms recovered from CFA ice core samples are not always distributed homogeneously on filters (See section 3.4; Table 4). This finding contrasts with the results from using polystyrene microspheres on filters (Tetzner et al., 2021b), which were distributed homogeneously (±11.3%) on filters. This discrepancy is likely explained by the considerably different total number of particles per filter analysed in the two experiments. While Tetzner et al. (2021b) analysed samples with a minimum concentration of 1350 (counts L-1), this study analysed samples ranging 56-94 (counts L-1) (Table 2 and 3), with the lower numbers intending to challenge the limits of the predicted homogeneous distribution. Our results show that the diatom distribution is largely dependent on the number of diatoms on each filter (Figure 6) and a homogeneous distribution (of up to 10% variability per filter) is only established when the total number of diatoms in a 15-mm diameter filter is equal or above ∼20 (Figure 6). The shift to uneven distribution for counts below 20 provides a lower threshold for the optimized method proposed previously (Tetzner et al., 2021b), which works on the assumption of homogeneously distributed low-concentration IMP. Samples with less than 20 diatoms per 15-mm diameter filter (less than six diatoms per transect) presented a random distribution (of up to ±24.7% variability per filter), suggesting that the whole filter would need to be analysed to get representative results.
Targeted low-concentration insoluble microparticles (IMP) preserved in ice hold unique information for reconstructing past environmental changes. The extraction and recovery of targeted low-concentration IMP (diatoms) from ice core samples have been tested in an experimental setup using a Continuous Flow Analysis system (CFA). The experimental setup is highly consistent in extracting and recovering targeted low-concentration IMP from ice core meltwater, with negligible and quantifiable losses. The waste lines of the CFA system are suitable for sampling large volumes of excess meltwater with minimal biases. The low uncertainty, greater proportion of meltwater volume produced (68% of the total melt), together with the possibility of accurately correcting waste line estimates establish the waste lines as the best CFA outlet to obtain representative results of low-concentration IMP. Low-concentration IMP spatial distribution analyses show that the standard optimised method for analysing low-concentration IMP has a minimum threshold for its applicability, implying samples below this threshold require analysis of the entire sample to obtain representative results. Excess meltwater generated from melting ice core samples in a CFA system has been demonstrated to be a viable source of large meltwater volumes, the key to obtaining replicable and representative results when analysing low-concentration IMP preserved in ice. Future research should be focused on testing this experimental setup and applying it in the analysis of ice core samples enriched in other low-concentration IMP, underrepresented in the samples used in this study.
The raw data supporting the conclusions of this article will be made available by the authors, without undue reservation.
DT: Conceptualization, Data curation, Formal Analysis, Investigation, Methodology, Validation, Writing–original draft, Writing–review & editing. CA: Conceptualization, Data curation, Investigation, Methodology, Writing–review & editing. ET: Conceptualization, Investigation, Methodology, Writing–review & editing. JH: Investigation, Methodology, Writing–review & editing.
The author(s) declare that no financial support was received for the research, authorship, and/or publication of this article.
The authors declare that the research was conducted in the absence of any commercial or financial relationships that could be construed as a potential conflict of interest.
The author(s) declare that no Generative AI was used in the creation of this manuscript.
All claims expressed in this article are solely those of the authors and do not necessarily represent those of their affiliated organizations, or those of the publisher, the editors and the reviewers. Any product that may be evaluated in this article, or claim that may be made by its manufacturer, is not guaranteed or endorsed by the publisher.
The Supplementary Material for this article can be found online at: https://www.frontiersin.org/articles/10.3389/feart.2025.1530875/full#supplementary-material
Allen, C. S., Thomas, E. R., Blagbrough, H., Tetzner, D. R., Warren, R. A., Ludlow, E. C., et al. (2020). Preliminary evidence for the role played by South Westerly wind strength on the marine diatom content of an Antarctic Peninsula Ice Core (1980–2010). Geosciences 10 (3), 87. doi:10.3390/geosciences10030087
Alley, R. B. (2010). Reliability of ice-core science: historical insights. J. Glaciol. 56 (200), 1095–1103. doi:10.3189/002214311796406130
Bigler, M., Svensson, A., Kettner, E., Vallelonga, P., Nielsen, M. E., and Steffensen, J. P. (2011). Optimization of high-resolution continuous flow analysis for transient climate signals in ice cores. Environ. Sci. Technol. 45 (10), 4483–4489. doi:10.1021/es200118j
Chesler, A., Winski, D., Kreutz, K., Koffman, B., Osterberg, E., Ferris, D., et al. (2022). Non-spherical microparticle shape in Antarctica during the last glacial period affects dust volume-related metrics. Clim. Past Discuss. 2022, 1–24. doi:10.5194/cp-19-477-2023
Cook, E., Portnyagin, M., Ponomareva, V., Bazanova, L., Svensson, A., and Garbe-Schönberg, D. (2018). First identification of cryptotephra from the Kamchatka Peninsula in a Greenland ice core: implications of a widespread marker deposit that links Greenland to the Pacific northwest. Quat. Sci. Rev. 181, 200–206. doi:10.1016/j.quascirev.2017.11.036
Cui, A., Wang, M., Lu, H., Xu, B., Xu, D., and Li, H. (2022). Seasonal climatic variations inferred from pollen in a laminated glacier in the southeastern Tibetan Plateau. Earth Space Sci. 9 (12), e2022EA002581. doi:10.1029/2022ea002581
Delmonte, B., Andersson, P. S., Hansson, M., Schöberg, H., Petit, J. R., Basile-Doelsch, I., et al. (2008). Aeolian dust in East Antarctica (EPICA-Dome C and Vostok): provenance during glacial ages over the last 800 kyr. Geophys. Res. Lett. 35 (7). doi:10.1029/2008gl033382
Delmonte, B., Winton, H., Baroni, M., Baccolo, G., Hansson, M., Andersson, P., et al. (2020). Holocene dust in East Antarctica: provenance and variability in time and space. Holocene 30 (4), 546–558. doi:10.1177/0959683619875188
Dunbar, N. W., Iverson, N. A., Van Eaton, A. R., Sigl, M., Alloway, B. V., Kurbatov, A. V., et al. (2017). New Zealand supereruption provides time marker for the Last Glacial Maximum in Antarctica. Sci. Rep. 7 (1), 12238. doi:10.1038/s41598-017-11758-0
Duprat, J., Engrand, C., Maurette, M., Kurat, G., Gounelle, M., and Hammer, C. (2007). Micrometeorites from central Antarctic snow: the CONCORDIA collection. Adv. Space Res. 39 (4), 605–611. doi:10.1016/j.asr.2006.05.029
Fan, S., Gao, Y., Sherrell, R. M., Yu, S., and Bu, K. (2021). Concentrations, particle-size distributions, and dry deposition fluxes of aerosol trace elements over the Antarctic peninsula in austral summer. Atmos. Chem. Phys. 21 (3), 2105–2124. doi:10.5194/acp-21-2105-2021
Festi, D., Schwikowski, M., Maggi, V., Oeggl, K., and Jenk, T. M. (2021). Significant mass loss in the accumulation area of the Adamello glacier indicated by the chronology of a 46 m ice core. Cryosphere 15 (8), 4135–4143. doi:10.5194/tc-15-4135-2021
Fischer, M. B., Oeser, M., Weyer, S., Folco, L., Peters, S. T., Zahnow, F., et al. (2021). I-Type cosmic spherules as proxy for the Δ′ 17O of the atmosphere—a calibration with quaternary air. Paleoceanogr. Paleoclimatology 36 (3), e2020PA004159. doi:10.1029/2020pa004159
Grieman, M. M., Hoffmann, H. M., Humby, J. D., Mulvaney, R., Nehrbass-Ahles, C., Rix, J., et al. (2022). Continuous flow analysis methods for sodium, magnesium and calcium detection in the Skytrain ice core. J. Glaciol. 68 (267), 90–100. doi:10.1017/jog.2021.75
Kaufmann, P. R., Federer, U., Hutterli, M. A., Bigler, M., Schüpbach, S., Ruth, U., et al. (2008). An improved continuous flow analysis system for high-resolution field measurements on ice cores. Environ. Sci. & Technol. 42 (21), 8044–8050. doi:10.1021/es8007722
Laluraj, C. M., Rahaman, W., Thamban, M., and Srivastava, R. (2020). Enhanced dust influx to South Atlantic sector of Antarctica during the late-20th century: causes and contribution to radiative forcing. J. Geophys Res. Atmos. 125 (8), e2019JD030675. doi:10.1029/2019jd030675
Lambert, F., Delmonte, B., Petit, J. R., Bigler, M., Kaufmann, P. R., Hutterli, M. A., et al. (2008). Dust-climate couplings over the past 800,000 years from the EPICA Dome C ice core. Nature 452 (7187), 616–619. doi:10.1038/nature06763
Paleari, C. I., Mekhaldi, F., Adolphi, F., Christl, M., Vockenhuber, C., Gautschi, P., et al. (2022). Cosmogenic radionuclides reveal an extreme solar particle storm near a solar minimum 9125 years BP. Nat. Commun. 13 (1), 214. doi:10.1038/s41467-021-27891-4
Paleari, C. I., Mekhaldi, F., Erhardt, T., Zheng, M., Christl, M., Adolphi, F., et al. (2023). Evaluating the 11-year solar cycle and short-term 10 Be deposition events with novel excess water samples from the East Greenland Ice-core Project (EGRIP). Clim. Past 19 (11), 2409–2422. doi:10.5194/cp-19-2409-2023
Petit, J. R., Mourner, L., Jouzel, J., Korotkevich, Y. S., Kotlyakov, V. I., and Lorius, C. (1990). Palaeoclimatological and chronological implications of the Vostok core dust record. Nature 343 (6253), 56–58. doi:10.1038/343056a0
Rojas, J., Duprat, J., Engrand, C., Dartois, E., Delauche, L., Godard, M., et al. (2021). The micrometeorite flux at Dome C (Antarctica), monitoring the accretion of extraterrestrial dust on Earth. Earth Planet. Sci. Lett. 560, 116794. doi:10.1016/j.epsl.2021.116794
Tetzner, D., Thomas, E. R., Allen, C. S., and Wolff, E. W. (2021b). A refined method to analyze insoluble particulate matter in ice cores, and its application to diatom sampling in the Antarctic Peninsula. Front. Earth Sci. 9, 617043. doi:10.3389/feart.2021.617043
Tetzner, D. R., Allen, C. S., and Thomas, E. R. (2022a). Regional variability of diatoms in ice cores from the antarctic peninsula and ellsworth land, Antarctica. Cryosphere 16 (3), 779–798. doi:10.5194/tc-16-779-2022
Tetzner, D. R., Thomas, E. R., Allen, C. S., and Piermattei, A. (2021a). Evidence of recent active volcanism in the Balleny Islands (Antarctica) from ice core records. J. Geophys. Res. Atmos. 126 (23), e2021JD035095. doi:10.1029/2021jd035095
Tetzner, D. R., Thomas, E. R., Allen, C. S., and Grieman, M. M. (2022b). Regional validation of the use of diatoms in ice cores from the Antarctic Peninsula as a Southern Hemisphere westerly wind proxy. Clim. Past 18 (7), 1709–1727. doi:10.5194/cp-18-1709-2022
Thomas, E. R., Tetzner, D. R., Roberts, S. L., Turner, S. D., and Rose, N. L. (2023a). First evidence of industrial fly-ash in an Antarctic ice core. Sci. Rep. 13 (1), 6529. doi:10.1038/s41598-023-33849-x
Thomas, E. R., Vladimirova, D. O., Tetzner, D. R., Emanuelsson, D. B., Humby, J., Turner, S. D., et al. (2023b). The palmer ice core as a candidate global boundary stratotype section and point for the anthropocene series. Anthropocene Rev. 10 (1), 251–268. doi:10.1177/20530196231155191
Thompson, L. G., Peel, D. A., Mosley-Thompson, E., Mulvaney, R., Dal, J., Lin, P. N., et al. (1994). Climate since AD 1510 on Dyer Plateau, antarctic peninsula: evidence for recent climate change. Ann. Glaciol. 20, 420–426. doi:10.3189/1994aog20-1-420-426
Verma, A., Sain, K., and Kumar, A. (2023). Environmental changes in Antarctica using a shallow ice core from dronning maud land (DML), east Antarctica. Environ. Process. 10 (2), 22. doi:10.1007/s40710-023-00635-w
Weber, M. E., Bailey, I., Hemming, S. R., Martos, Y. M., Reilly, B. T., Ronge, T. A., et al. (2022). Antiphased dust deposition and productivity in the Antarctic Zone over 1.5 million years. Nat. Commun. 13 (1), 2044. doi:10.1038/s41467-022-29642-5
Keywords: ice core, Antarctica, cryptotephra, continuous flow analysis (CFA), pollen, diatoms, insoluble microparticles, mineral dust
Citation: Tetzner DR, Allen CS, Thomas ER and Humby JD (2025) Use of excess meltwater from continuous flow analysis systems for the analysis of low concentration insoluble microparticles in ice cores. Front. Earth Sci. 13:1530875. doi: 10.3389/feart.2025.1530875
Received: 19 November 2024; Accepted: 21 February 2025;
Published: 13 March 2025.
Edited by:
Summer Rupper, The University of Utah, United StatesReviewed by:
Rafael Souza Dos Reis, The Ohio State University, United StatesCopyright © 2025 Tetzner, Allen, Thomas and Humby. This is an open-access article distributed under the terms of the Creative Commons Attribution License (CC BY). The use, distribution or reproduction in other forums is permitted, provided the original author(s) and the copyright owner(s) are credited and that the original publication in this journal is cited, in accordance with accepted academic practice. No use, distribution or reproduction is permitted which does not comply with these terms.
*Correspondence: Dieter R. Tetzner, ZGlldGV0OTVAYmFzLmFjLnVr
Disclaimer: All claims expressed in this article are solely those of the authors and do not necessarily represent those of their affiliated organizations, or those of the publisher, the editors and the reviewers. Any product that may be evaluated in this article or claim that may be made by its manufacturer is not guaranteed or endorsed by the publisher.
Research integrity at Frontiers
Learn more about the work of our research integrity team to safeguard the quality of each article we publish.