
94% of researchers rate our articles as excellent or good
Learn more about the work of our research integrity team to safeguard the quality of each article we publish.
Find out more
ORIGINAL RESEARCH article
Front. Earth Sci., 20 March 2025
Sec. Solid Earth Geophysics
Volume 13 - 2025 | https://doi.org/10.3389/feart.2025.1530002
This article is part of the Research TopicGeophysics and Petrophysics Issues Involved in Unconventional Oil and Gas Development ProcessesView all 10 articles
 Shujun Yin1Jianliang Zhang1Hucheng Deng2,3*Hao Qin1Wenhao Xia1
 Yu Du
2*Ming Gong2
Yu Du
2*Ming Gong2
 Tao Huang
1Chang Li2
Tao Huang
1Chang Li2
Introduction: The Jurassic terrestrial shale in the Yingshan–Pingchang area of the northeastern Sichuan Basin holds substantial exploration and development potential. However, the area exhibits significant vertical heterogeneity and anisotropy in in-situ stress. Thus, precise vertical evaluation of in-situ stress is urgently required to provide a scientific basis for selecting hydraulic fracturing layers in future operations.
Methods: This study conducted a detailed in-situstress analysis utilizing paleomagnetic data, velocity anisotropy measurements, differential strain experiments, hydraulic fracturing results, and both conventional and specialized logging data. A transversely isotropic in-situstress prediction model was developed to evaluate the stress distribution, aiming to identify target layers favorable for hydraulic fracturing.
Result: Comprehensive analysis indicates that the in-situstress orientation of Jurassic shale in the Yingshan-Pingchang area generally aligns with the regional stress orientation (NE90° ± 10°). Due to the influence of local NW-trending structures, the in-situstress orientation exhibits a clockwise deflection. In the Jurassic formation, the maximum horizontal principal stress ranges from 42.33 MPa to 102.56 MPa, averaging 74.89 MPa; the minimum horizontal principal stress ranges from 39.20 MPa to 84.04 MPa, averaging 67.20 MPa; and the vertical principal stress varies between 31.91 MPa and 91.39 MPa, averaging 60.23 MPa. These findings were corroborated by in-situstress measurements obtained through hydraulic fracturing, demonstrating that the stress magnitudes determined via differential strain analysis are highly accurate. The analysis of the three-dimensional stress relationships indicates that the study area predominantly exhibits a strike-slip faulting regime. Comparative analysis reveals that the minimum principal stress gradient in shale is higher than that in limestone and sandstone. Furthermore, the transverse isotropic in-situstress prediction model demonstrates high accuracy. When comparing its predictions for minimum and maximum horizontal principal stresses to measured in-situstress data, the model exhibits average relative errors of only 3.39% and 3.23%, respectively.
Discussion: In the study area, vertical high-low-high (HLH) stress difference profiles exhibit the highest oil-bearing potential and a reduced likelihood of fracturing-induced artificial fractures crossing through layers. This makes HLH profiles the optimal structural type for selecting fracturing stages in in-situstress difference fracturing operations.
Following the significant breakthroughs of the 'Shale Revolution' in North America, a global surge in the exploration and development of marine shale oil and gas resources has been ignited (Jarvie et al., 2007; Wang et al., 2014). Concurrently, the successful exploitation of terrestrial shale oil in the Uteland Butte member of the Green River Formation in the Uinta Basin, United States, has sparked widespread interest in terrestrial shale resources (Vanden Berg et al., 2014). According to the 2015 EIA report on shale oil resources across 45 countries (excluding the United States), among the 101 shale oil basins and 152 shale oil formations worldwide, 24 formations are classified as lacustrine, accounting for approximately 19% of the total shale oil resources. In recent years, successful cases of lacustrine shale oil and gas development have been documented in Argentina and China (Legarreta and Villar, 2011; Wang et al., 2014), while numerous promising lacustrine shale basins are also present in Africa, Asia, and Europe, offering substantial economic potential. Notably, China, Chad, and Indonesia possess significant lacustrine shale oil and gas resources, with technically recoverable reserves estimated at 41.3 billion tonnes, 19.2 billion tonnes, and 10.8 billion tonnes, respectively, representing approximately 46.4%, 21.7%, and 12.2% of the global total (excluding the United States) (US ElA, 2015).
The large-scale development of marine shale gas has led to innovations in shale oil and gas enrichment theories (He and Bai, 2022; Hu et al., 2023). With the rapid advancement of exploration theories and development technologies (Guo et al., 2023; Chen and Liu, 2024), China, as a major country rich in lacustrine shale oil resources, is gradually expanding exploration into more extensive lacustrine shale formations. Significant breakthroughs have been achieved in the Cretaceous formations of the Songliao Basin, the Permian formations of the Junggar Basin, the Paleogene formations of the Bohai Bay Basin, and the Triassic formations of the Ordos Basin (Feng et al., 2015; Guo et al., 2023; Bao et al., 2023; Chen and Liu, 2024; Du et al., 2024). In the Sichuan Basin, the exploration and development of terrestrial shale oil and gas are concentrated in the Middle and Lower Jurassic strata. Five oil-bearing segments have been developed sequentially from the bottom up, including the Zhenzhuchong, Dongyuemiao, Da’anzhai, Lianggaoshan, and Shaximiao formations, all of which have yielded industrial-scale oil and gas (Feng et al., 2015; Li et al., 2016; Zhang et al., 2023; Xiong et al., 2024). Compared to the marine shales in the Sichuan Basin, Jurassic shale, claystone, siltstone, sandstone, carbonate rock, tuff, and other interbedded formations exhibit more frequent longitudinal interactions (Fang et al., 2023; Yang et al., 2023). Under the background of complex tectonics and high stress, the Jurassic shale exhibits characteristics such as great burial depth, high formation pressure, and strong vertical heterogeneity and anisotropy (Zhang et al., 2023; Shu et al., 2024). These factors pose a series of challenges in evaluating of shale oil and gas resources, reservoir characterization, and the selection of sweet spots. Therefore, accurate assessment of the vertical distribution characteristics of in-situ stress is critical.
In-situ stress, also known as original rock stress, refers to the natural forces present within the Earth’s crust that remain undisturbed by engineering activities (Wang et al., 2010). It primarily arises from the interplay of gravitational stress, tectonic stress, pore pressure, thermal stress, and residual stress (Ganguli et al., 2018; Baouche et al., 2021; Ganguli et al., 2021; Yong et al., 2022). Regarding the identification of in-situ stress in terrestrial shale oil and gas reservoirs (Lv et al., 2017), we determined the orientation of in-situ stress for the Xinchang Xujiahe V section in western Sichuan using paleomagnetic and anisotropy experiments. Additionally, Cai (2023) obtained measured values of in-situ stress for the Shahejie Formation in the Bohai Bay Basin through core acoustic emission Kaiser effect experiments and limited LOT data. He et al. (2024) identified the timing of the ancient tectonic stress in northeastern Sichuan’s Jurassic by determining the Kaiser effect points from acoustic emission tests. Li (2016) conducted differential strain measurements on cores from the Shahejie Formation in the Bohai Bay Basin, quantifying strain variations in multiple directions and calculating the magnitude and orientation of in-situ stress using elastic mechanics theory.
Regarding the prediction of in-situ stress in terrestrial shale oil and gas reservoirs, Yu et al. (2020) and Xiong et al. (2023) determined the magnitude of in-situ stress for the fracturing intervals of the Yanchang Formation in the Ordos Basin and the Fengcheng Formation in the Zhungeer Basin using fracture pressure calculation methods. They employed a spring-combination model to calculate the tectonic strain coefficients for the orientations of the maximum and minimum principal stresses. Wang (2021) established an in-situ stress model for the Yanchang Formation in the Ordos Basin, considering both isotropic and transverse isotropic properties. Wang (2022) further identified key parameters in the model through core mechanical experiments and compared the predicted in-situ stress results with actual measurements, confirming that the transversely isotropic model yielded the smallest errors. Lin et al. (2022a) compared the accuracy of the combined spring in-situ stress calculation model with that of the transversely isotropic in-situ stress calculation model, concluding that the transversely isotropic model provided higher accuracy for terrestrial shale in the Fengcheng Formation of the Zhungeer Basin.
Exploration experiences from various regions worldwide indicate that lacustrine shale formations exhibit complex geological characteristics and strong reservoir heterogeneity, with in-situ stress playing a crucial role in controlling reservoir stimulation effectiveness. Compared to marine shales, terrestrial shale reservoirs are generally more compact, exhibit greater variability in brittle mineral content, and develop more complex interbedded layers. These factors collectively determine the critical influence of in-situ stress on reservoir stimulation outcomes. However, research on in-situ stress in terrestrial shales remains insufficient, with limited findings and a relatively nascent stage of development. The applicability of conventional in-situ stress identification and prediction methods established for marine shales to lacustrine shale formations requires further verification and optimization. Therefore, establishing a comprehensive in-situ stress identification and evaluation framework based on multi-source data integration and multi-method analysis has become a critical focus in terrestrial shale research (Cao et al., 2020; Gao et al., 2023; Peng, 2023; Sun et al., 2023).
This study focuses on the Jurassic terrestrial shale in the Yingshan-Pingchang region of the northeastern Sichuan Basin. Using methods such as core testing, well logging identification, and field measurements, the in-situ stress orientation and magnitude of the target formation were identified, calculated, and validated. A transverse isotropic in-situ stress calculation model was developed, completed the interpretation of in-situ stress profiles for wells. Additionally, the structural characteristics of stress difference were optimized. Meanwhile, to enhance the development efficiency of terrestrial shale oil and gas resources, it is crucial to focus on the controlling effect of in-situ stress on fracture initiation and propagation within the reservoir. This research provides essential technical support for the efficient calculation of in-situ stress in terrestrial shale reservoirs, facilitating the development of a refined identification framework applicable to different basins. Furthermore, it offers scientific guidance for safe well drilling, optimized reservoir stimulation, and long-term stable production.
The Sichuan Basin, located in the southwestern part of China, is a typical superimposed oil and gas basin (Liu et al., 2021). It is situated in the western part of the Yangtze Plate and is an east-west extending basin overall (Zhang et al., 2011). The basin began to take shape during the Indosinian period and underwent folding and deformation during the Himalayan orogeny, forming its present-day structure (Liu et al., 1994). The basin can be divided into six structural units (Figure 1A) (Zhang et al., 2011): the northern Sichuan low gentle zone, the western Sichuan low steep zone, the central Sichuan gently sloping zone, the southwestern Sichuan fold zone, the southern Sichuan low-steep dome-shaped zone, and the eastern Sichuan high-steep fault-fold zone.
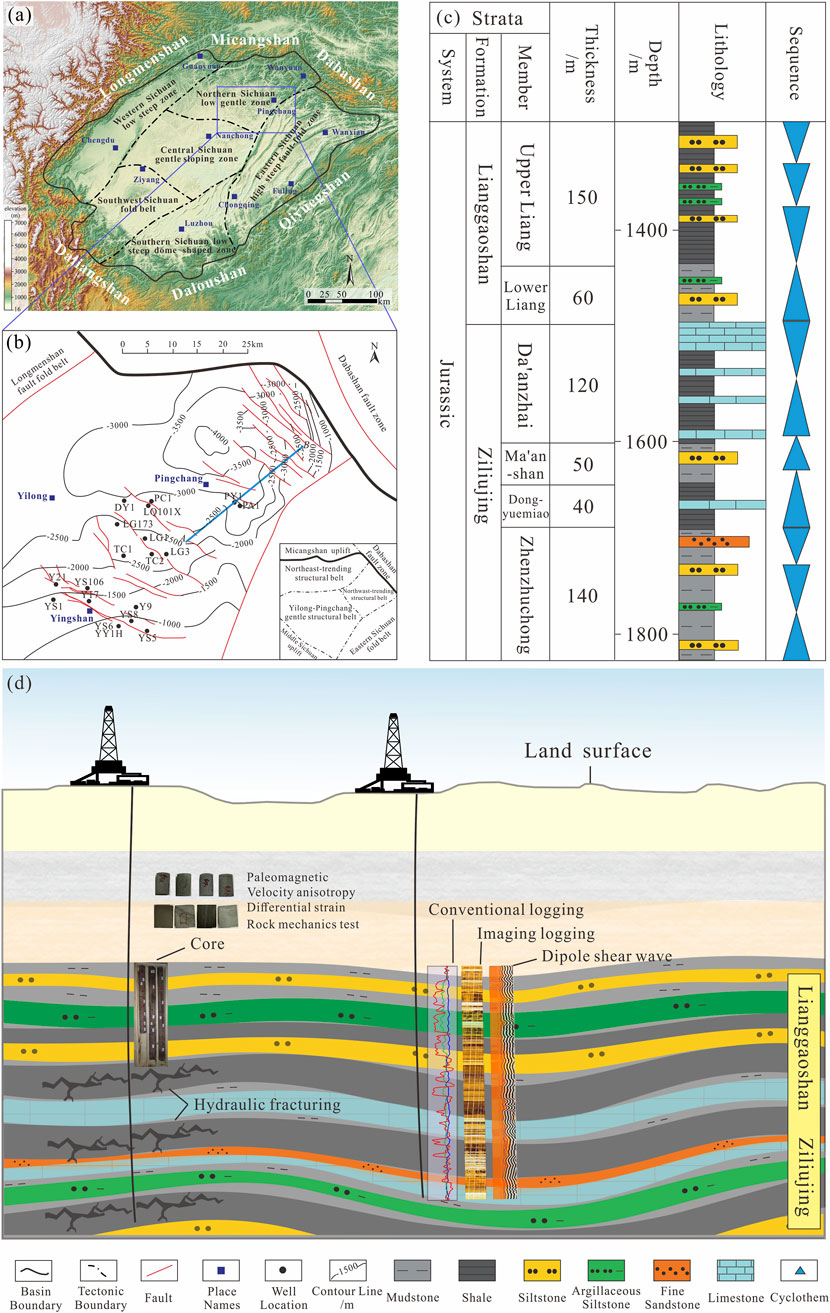
Figure 1. (A) Structural zoning map of the Sichuan Basin; (B) Structural map of northeastern Sichuan Basin; (C) Comprehensive stratigraphic column of Lower Jurassic Formation; (D) Demonstrate the materials covered in this study.
During the Mesozoic-Cenozoic era, the northeastern Sichuan area experienced reverse thrusting along the Micangshan and Dabashan basins. This was followed by multiple superimposed and reworked tectonic stresses from various orientations, resulting in the area’s complex tectonic deformation characteristics (Figure 1B) (He et al., 2024). The main tectonic orientations in the northeastern Sichuan area are predominantly northeast, northwest, and nearly east-west (He and Bai, 2022). The junction area between the Micangshan and Dabashan basins experienced three major tectonic events during the Indosinian, Yanshan, and Himalayan periods. Tectonic movements during the Yanshan and Himalayan periods had the most significant impact on the formation of tectonic deformation in the region (Zhu, 2020). The Jurassic system in northeastern Sichuan develops extruding and compression-torsion reverse faults, resulting in a tectonic pattern characterized by two uplifts, one concave structure, and one gentle slope across the area (Jiang et al., 2016). Simultaneously, compressive forces originating from the Dabashan region resulted in the formation of numerous east-west-trending syn-sedimentary faults within the area (Figure 1C) (Wang et al., 2024). These faults, characterized by minor displacements and predominantly terminating in the upper strata of the Lianggaoshan Formation, are highly conducive to enhancing reservoir quality and preserving hydrocarbons.
The Jurassic formation in northeastern Sichuan is primarily composed of delta-lacustrine terrestrial clastic rock deposits, with thicknesses ranging from 1,500 to 4,000 m. It exhibits a characteristic pattern of greater thickness in the north and west, and reduced thickness in the south and east (Xu, 2023). From bottom to top, several oil and gas-bearing layers have developed, including the Ziliujing Formation (comprising the Zhenzhuchong, Dongyuemiao, Ma’anshan, and Da’anzhai Sections), the Lianggaoshan Formation, and the Shaximiao Formation (Figure 1C) (Ni et al., 2015; Li et al., 2016). The Jurassic system underwent three major phases of lake transgression. The first phase of lake transgression occurred in the Dongyuemiao member of the Ziliujing Formation, with lithology primarily characterized by mud shale intercalated with limestone and small amounts of fine sandstone. The second phase of lake transgression took place in the Da’anzhai member, where the early to middle period was characterized by a transgressive process, with the maximum transgression occurring during the middle of the deposition (Chen et al., 2019). The overall lithology of the Da’anzhai member is characterized by mud shale intercalated with limestone. The third phase of lake transgression was marked by deeper water and a calm lake surface, with lithology composed of mud shale intercalated with fine sandstone. The Lianggaoshan Formation is divided into two sub-members: the Upper Lianggaoshan and Lower Lianggaoshan. The Lower Lianggaoshan member consists of mudstone intercalated with fine sandstone, while the Upper Lianggaoshan member differs, featuring organic-rich shale intercalated with fine sandstone (Chen and Liu, 2024).
In the research process of this study, we utilized a variety of sources for our research (Figure 1D). We first used core paleomagnetism and velocity anisotropy experiments, combined with imaging logging and dipole shear wave interpretation, to evaluate the direction of in-situ stress. Using core differential strain experiments and hydraulic fracturing test data, completed the interpretation of in-situ stress magnitude. Secondly, we constructed a transverse isotropic in-situ stress calculation model and assigned values to all parameters within the model. Finally, we performed a detailed evaluation of in-situ stress for wells. The following sections provide a detailed explanation of the core experimental methods.
The samples used in this experiment were primarily obtained from core samples taken from ten wells in the Yingshan-Pingchang area of northeastern Sichuan. These samples underwent paleomagnetic testing, velocity anisotropy testing, differential strain testing, and rock mechanics testing.
Paleomagnetic experiments can be used to restore the original orientation of core samples in the subsurface. In this regard, a viscous remanence measuring instrument was employed, implemented in accordance with the DD 2006-04″Paleomagnetic Test Technical Requirements” standard.
First, a reference line parallel to the core axis is drawn on the core surface, which serves as a common reference for both the paleomagnetic and ultrasonic anisotropy experiments. Cylindrical samples of 25 × 25 mm are drilled along the axial direction, and parallel reference lines are drawn on the cylindrical surface, passing through the center of the core’s end surface (Figure 2A). The remanent magnetization strength and orientation are measured at 20°C. The sample is then subjected to thermal demagnetization treatment, which typically involves heating the sample from room temperature to a set temperature, cooling it to room temperature in a zero-magnetic environment, and measuring the remanent magnetization strength. The temperature is subsequently raised, and measurements are repeated. The thermal demagnetization steps are conducted at intervals of 40°C, with remanent magnetization strength and direction measured at temperatures ranging from 60°C to 300°C. Finally, the standard Fisher statistical method is employed to calculate the average orientation of the viscous remanent magnetization in the geomagnetic coordinate system, thereby restoring the original orientation of the core in the subsurface (Figure 3A).
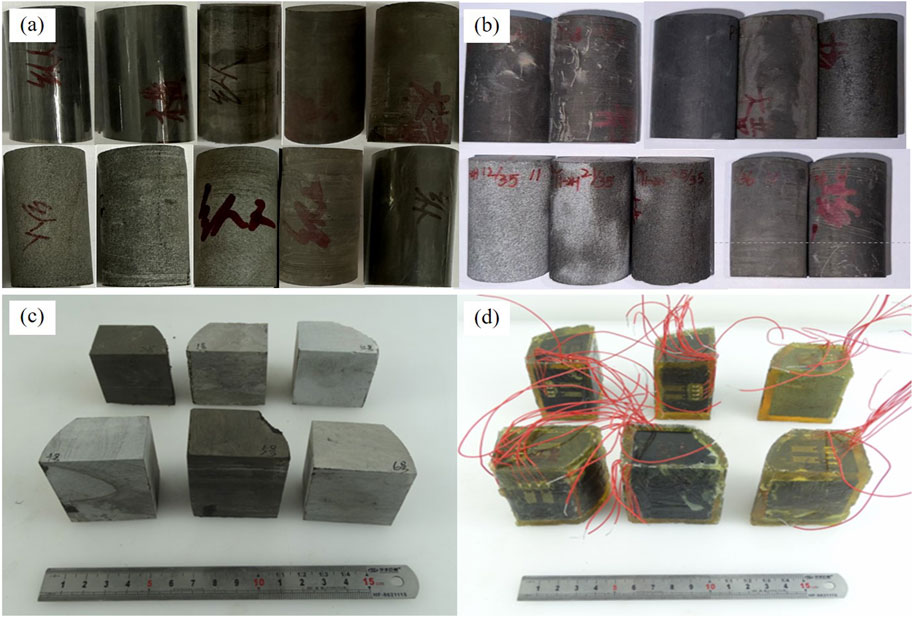
Figure 2. (A) Photograph of samples before paleomagnetic and wave velocity anisotropy experiment; (B) Photograph of samples after paleomagnetic and wave velocity anisotropy experiment; (C) Photograph of the sample before the differential strain experiment; (D) Photograph of the sample after the differential strain experiment.

Figure 3. (A) Palaeomagnetic experiment core positioning diagram; (B) wave velocity deviation with the change of circumferential angle curve,well YY1H, 2017.46 m.
Stress orientation can be determined through the analysis of core ultrasonic wave velocity anisotropy. The experiment was conducted in accordance with the DZ/T0276.31-2015″Rock Mass Acoustic Velocity Test” standard. The experiment utilized the wave velocity anisotropy module of the multi-function rock mechanics instrument (GCTS-RTR-2000, GCTS, United States), which primarily consists of a core holder, an ultrasonic probe, and an automatic expansion device for the probe. This testing system can measure the wave velocity of longitudinal (P-wave) and transverse (S-wave) waves, with P-waves selected for wave velocity anisotropy testing.
The sample is processed into a cylindrical specimen with dimensions of 25 mm × 50 mm (Figure 2B). A reference line is marked on the full-diameter core, parallel to the wellbore orientation, with an arrow pointing toward the top surface. This reference line is maintained consistently with the paleomagnetic reference line. The time taken for longitudinal wave propagation along the diameter at the reference line is measured using an ultrasonic device. Propagation time is measured at 10° intervals in a clockwise direction along the diameter, and velocity deviation is calculated. A curve of velocity deviation is plotted, and the angle corresponding to the minimum velocity represents the angle between the maximum horizontal principal stress and the reference line (Figure 3B). The orientation of the maximum principal stress at the reference line, combined with the paleomagnetic orientation results, allows for the determination of the orientation of the maximum horizontal principal stress. The calculation Formula 1 is as follows:
In this formula: α is the orientation of the maximum horizontal principal stress, in °, β is the orientation of the core as determined by paleomagnetic data, in °; θ is the angle between the maximum principal stress and the reference line, in °.
The differential strain experiment determines the overburden pressure, maximum horizontal principal stress, and minimum horizontal principal stress exerted on a cubic rock core under subsurface conditions by measuring strain changes in three orthogonal directions during hydrostatic pressure loading. The experiment was conducted in accordance with the DZ/T0276.20-2015″Testing Procedures for Physical and Mechanical Properties of Rocks” standard. The loading apparatus employed the WTB3824 static strain measurement system, which can automatically, accurately, reliably, and quickly measure static strain values at multiple points during stress testing of large structures, models, and materials.
The differential strain measurement experiment requires processing the core into cubic samples with dimensions of 50 mm × 50 mm (Figure 2C), with a strain gauge array attached to each of the three mutually perpendicular surfaces. After sealing the sample with silicone rubber, it is placed in a pressure vessel where hydrostatic pressure is applied until it exceeds the expected in-situ stress, causing microcracks to fully close. Strain variations in each orientation before and after the closure of the microcracks are measured using nine strain gauges on the surface of sample (Figure 2D). The six strain components based on the core coordinate system are then calculated, and the ratios of the three principal stresses are determined using elasticity theory. The pressure at the microcrack closure point is used as the maximum principal stress, or vertical stress is estimated based on the core sample’s depth. Finally, the three-dimensional stress magnitude at the location is calculated by combining the principal stress ratios.
In this experiment, a triaxial rock mechanics test system (RTR-1000, GCTS, America) was used to apply the stress to the specimen until the rock reaches the yield strength. The test process is in accordance with the GB/T50266-99“Standard for test methods of engineering rock mass.”
The calculation process for the anisotropic in-situ stress magnitude using VTI media-based logging parameters consists of the following five steps: (1) calculate vertical stress; (2) calculate pore pressure; (3) calculate rock mechanical parameters; (4) invert tectonic stress coefficients; and (5) calculate the in-situ stress magnitudes.
Combining paleomagnetic and velocity anisotropy experimenting, the results show that the current in-situ stress orientation of the Jurassic formation in the Pingchang area ranges from N82.7° to N116.65°E, with the main direction concentrated at N95° ± 10°E. In the Yingshan area, the stress orientation range is from N76° to N111.6°E. The maximum principal stress orientation at well YY1H ranges from 71.77° to 106.45°, while at well PY1, it ranges from 59.1° to 85.6° (Table 1). Due to the influence of local NW-trending structures, the in-situ stress orientation is deflected clockwise, and the three-dimensional stress regime exhibits a strike-slip stress regime. The stress orientation at well YY1H shows a slight clockwise deflection due to its proximity to the fault.
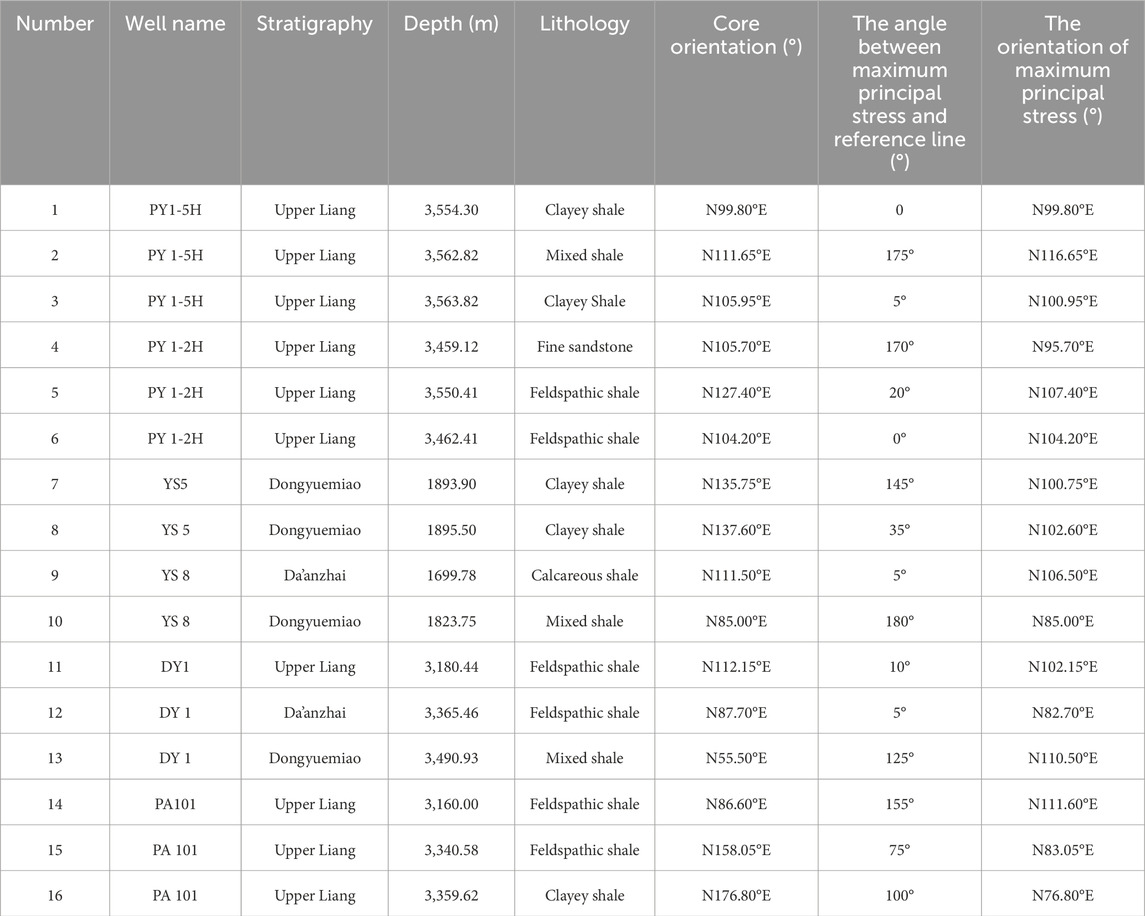
Table 1. Test results of maximum horizontal principal stress orientation determined by paleomagnetic and seismic velocity anisotropy experiments in Yingshan-Pingchang area, northeastern Sichuan Basin.
The resistivity differences in wellbore imaging logging can explain rock fractures caused by stress. By utilizing these characteristics, the orientation of the maximum horizontal stress can be further determined (Andrew et al., 2016; Ju et al., 2018). During the drilling process, due to the coupling of wellbore stress concentration and mud pressure, induced fractures or wellbore breakouts can form under specific conditions. The former is manifested in wellbore imaging logging as approximately vertical or feather-like dark bands or a single feather-like dark band (Figures 4A, B), with their orientation indicating the orientation of the maximum horizontal principal stress (Zoback et al., 2003; Colleen et al., 2009; Schmitt et al., 2012). The latter appears in wellbore imaging logging as an approximately symmetric distribution of dark bands or patches, which are discontinuous along the longitudinal orientation with blurred boundaries (Figures 4C, D). The long axis of the breakout is generally parallel to the orientation of the minimum horizontal principal stress (Zoback et al., 2003; Ju et al., 2018). The wellbore imaging logging at depths of 1044–1046 m in well YS8 characteristics is represented by feather-like dark bands arranged in a fan-shaped pattern, while at depths of 1581–1583 m in well YS5, a single feather-like dark band is observed. Based on the identified orientation of the induced fractures, the orientation of the maximum horizontal principal stress for the corresponding intervals in the two wells is 185° and 176°, respectively. The wellbore imaging logging at depths of 3,424–3,426 m in well DY1 and 1581–1583 m in well YS8 show significant wellbore breakouts, with breakout orientations of 6° and 80°, respectively. The interpreted orientations of the maximum horizontal principal stress are 96° and 170°, respectively. In intervals with more developed fractures, false breakout phenomena can easily be observed in borehole imaging imaging. Caution should be exercised during the identification process to avoid misinterpretation.
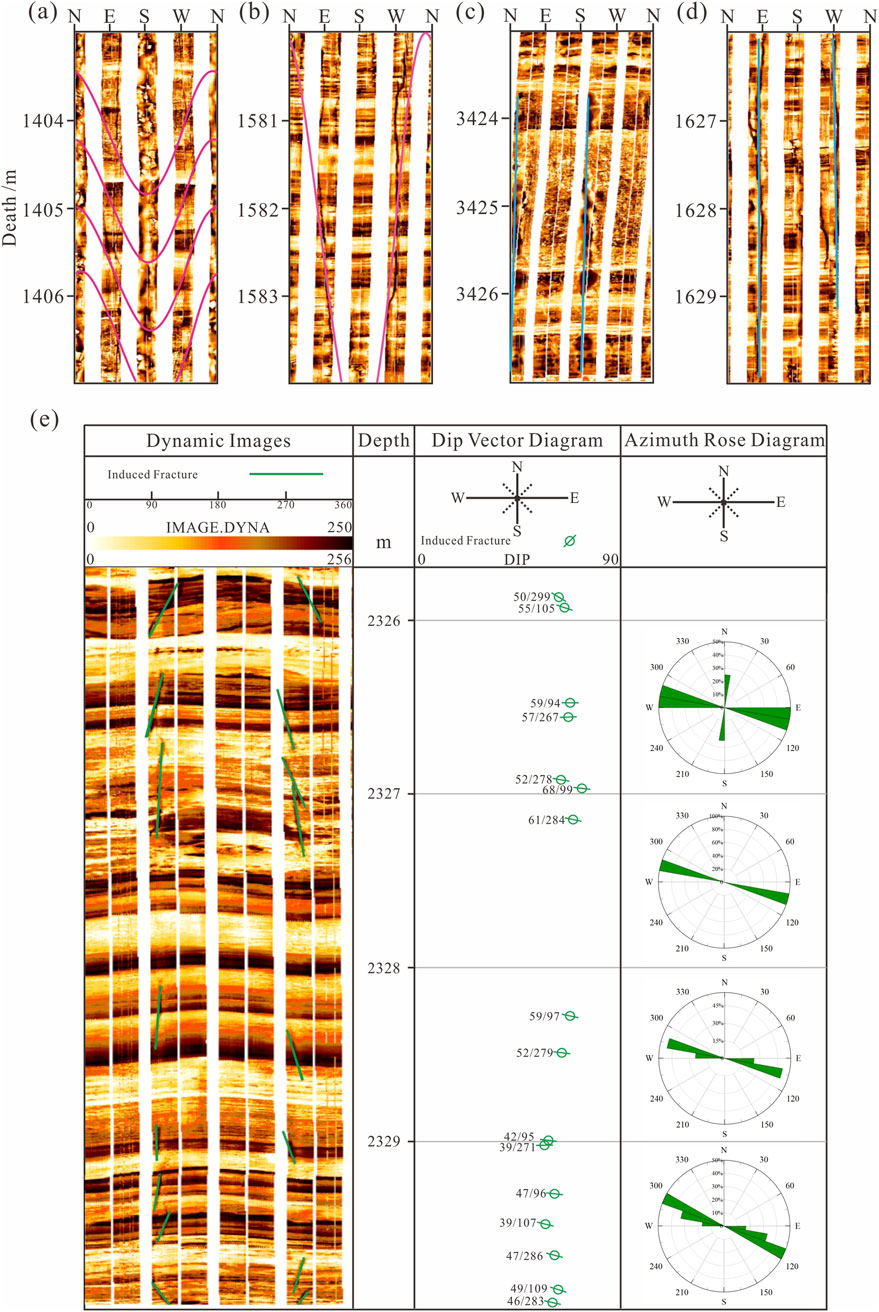
Figure 4. Examples of drilling-induced fractures and wellbore breakouts in image logging of Yingshan-Pingchang area, northeastern Sichuan Basin. (A) Well YS8, drilling-induced fractures; (B) Well YS5, drilling-induced fractures; (C) Well DY, wellbore breakouts; (D) Well YS8, wellbore breakouts; (E) Induced fracture identification and maximum principal stress orientation determination from electrical imaging logging, well DY1.
Electrical imaging logging interpretation software was utilized to identify induced fractures and wellbore breakouts in the DY1 well. The interpretation results indicate that the current stress orientation is primarily EW (Figure 4E).
For anisotropic formations, by considering the variation in shear wave velocities under different array configurations, can reveal the anisotropic characteristics of the subsurface rock layers (Heng et al., 2015). In anisotropic strata, in-situ stress primarily acts along different directions of the layers. Since the shear wave velocity is closely related to the anisotropy, particularly when the direction of shear wave propagation aligns with the stress direction, changes in velocity can reflect the direction of the in-situ stress. The polarization orientation of the fast shear wave indicates the maximum horizontal stress orientation. The time difference between the fast and slow waves is commonly used to measure the anisotropy of the formation. The stronger the anisotropy, the higher the reliability of the extracted data. The Formula 2 for calculating the anisotropy coefficient is as follows:
In this formula:
The interpretation of dipole shear wave logging indicates that the current in-situ stress orientation is primarily EW (Figure 5). The anisotropy analysis results show that as the difference coefficient between the two principal stresses increases, shear wave anisotropy becomes stronger, reducing the number of interpreted maximum principal stress orientations and increasing the reliability of the interpretation.
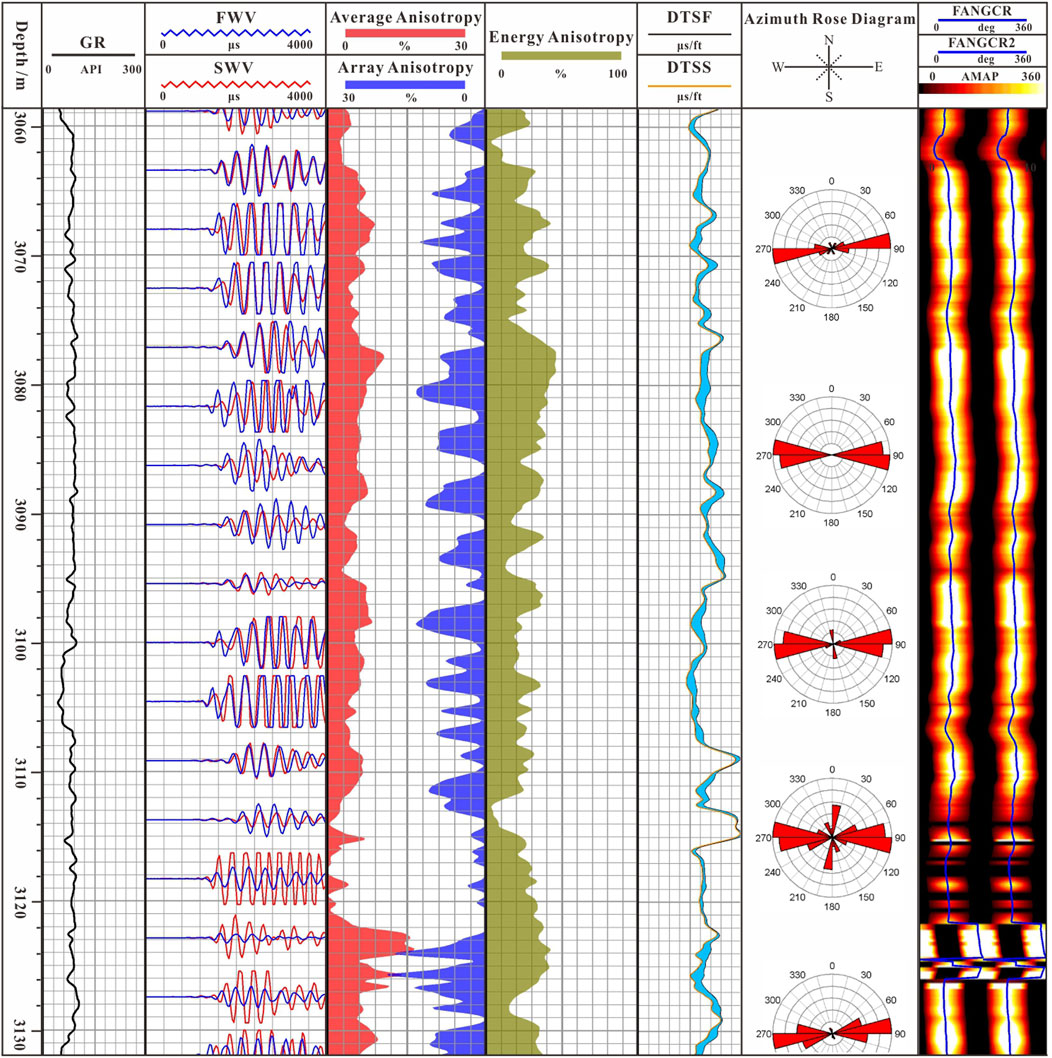
Figure 5. Anisotropic orientation of dipole shear wave interpreting the maximum principal stress orientation, well PY1.
The current stress orientation in the Yingshan-Pingchang area of the Jurassic Formation, determined by comprehensive analysis of differential strain, electrical imaging logging, and dipole shear wave logging, is primarily in the EW orientation (Figure 6A). The orientation ranges from N 87°–120° E, with the main direction maintaining a consistent range of NE 95° ± 10°.
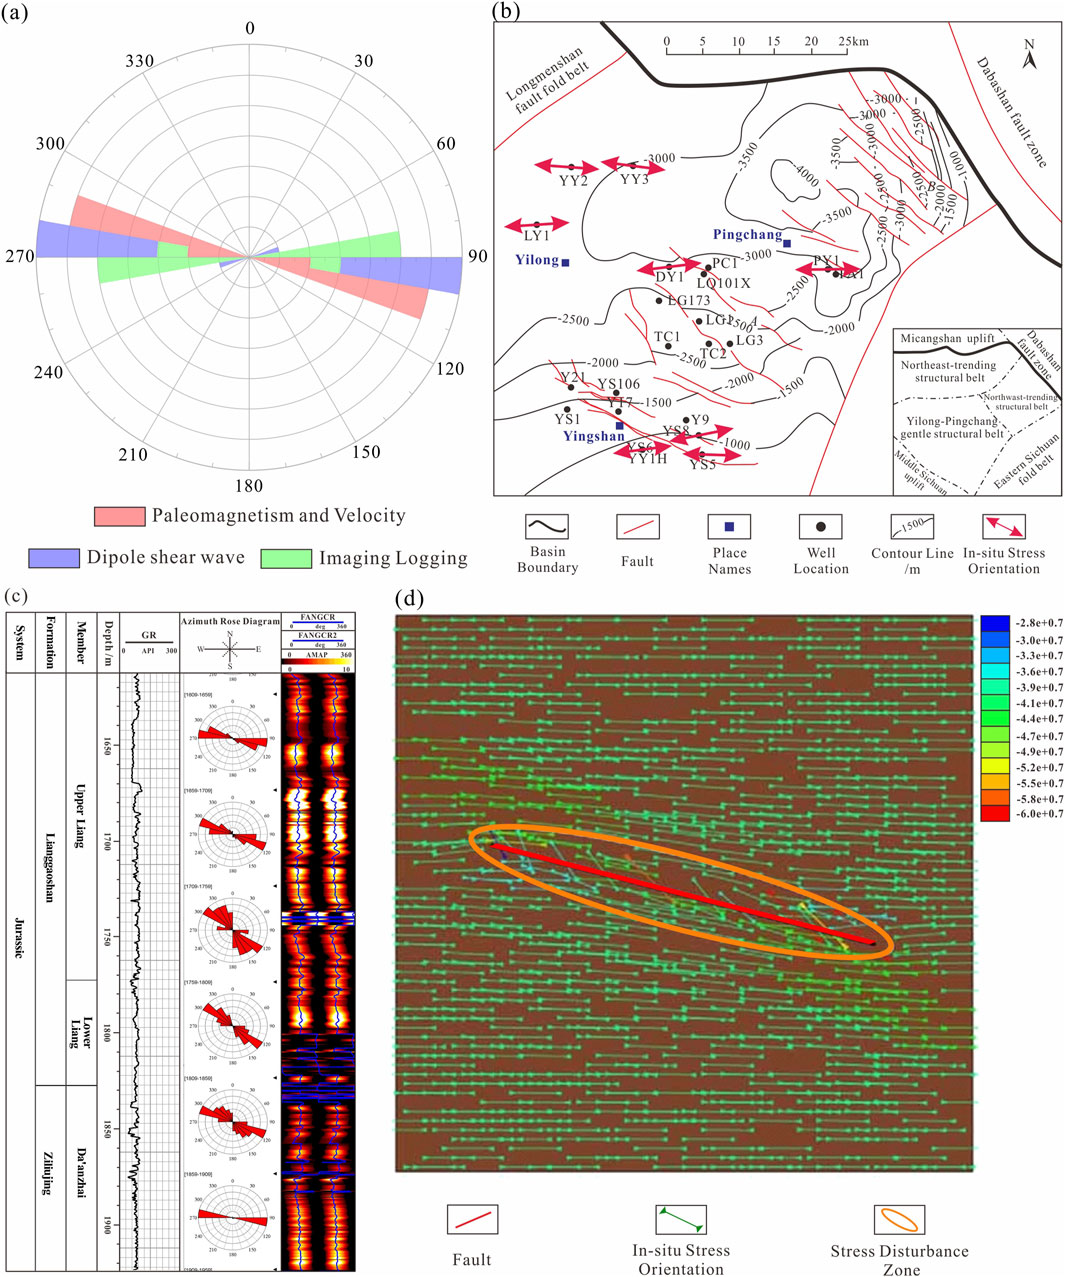
Figure 6. In-situ stress orientation characteristics in Jurassic of Yingshan-Pingchang area, northeastern Sichuan Basin. (A) Multi-data rosette for determining In-situ stress orientation; n (B) In-situ stress orientation interpretation map of key wells; (C) Interpretation diagram of in-situ stress orientation for well Yingshan6; (D) Simulation diagram of the disturbance to in-situ stress orientation by nearby faults around well YS6.
The overall in-situ stress orientation of the Jurassic formation in the study area is consistent with that of the neighboring Yuanba and Langzhong areas (Figure 6B). In the Yingshan area, the local tectonic influence causes a clockwise deviation of the in-situ stress orientation, primarily ranging from N60° to 80°E. Taking YS6 Well as an example (Figure 6C), the in-situ stress orientation at the target layer between 1,650 and 1,900 m is mainly influenced by the NWW-trending fault, resulting in a deviation of the stress orientation. Figure 6D presents a simulation showing the area’s maximum principal stress deviating due to its 25° angle with a local NW-trending fault. The direction of the maximum horizontal principal stress clearly deviates along the fault strike and propagates in a localized manner along it. Fault activity leads to the displacement of rock layers. When a fault forms a specific angle with the orientation of the maximum horizontal principal stress, the distribution of the original stress field undergoes significant alteration. In such cases, the fault exerts a strong guiding effect on the in-situ stress orientation. In areas distant from the fault (depths less than 1,650 m and greater than 1,900 m), the in-situ stress orientation at Yingshan Well six remains generally stable, exhibiting a characteristic EW orientation without noticeable deviation. This stability is because, away from the fault zone, the rock layers experience relatively uniform compression or tension and are not significantly affected by fault activity. Regional tectonic stress plays a dominant role during this period.
During the differential strain experiment, strain data were directly collected from nine directions on three orthogonal surfaces of the rock sample. The ratio of the three-dimensional stress was then calculated using elasticity theory. The pressure at the microfracture closure point was used to estimate the maximum principal stress, or alternatively, the vertical stress was inferred from the depth of the core sample. Finally, the three-dimensional stress was estimated by combining the principal stress ratios (Figure 7).
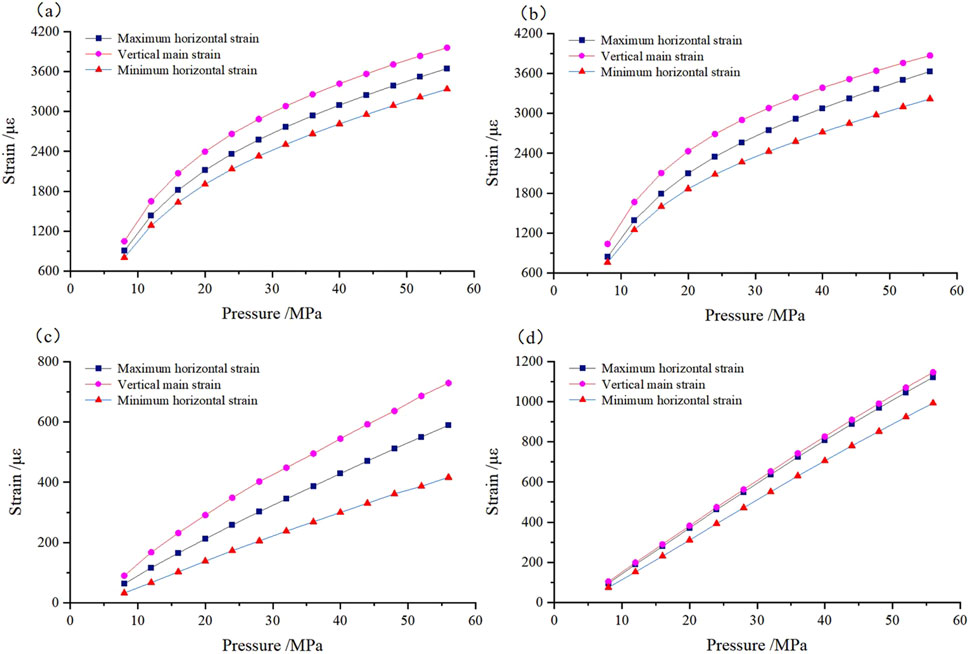
Figure 7. Variation of principal stress ratio with surrounding pressure in differential strain experiments (A) Well PY1, 3,115.06 m; (B) Well PY1, 3,154.55 m; (C) Well LQ1, 2,996.52 m; (D) Well LQ1, 3,005.4 m.
The results of the three-dimensional stress from the differential strain experiment indicate that the maximum horizontal principal stress ranges from 42.33 MPa to 102.56 MPa, averaging 74.89 MPa; the minimum horizontal principal stress ranges from 39.20 MPa to 84.04 MPa, averaging 67.20 MPa; the vertical principal stress ranges from 31.91 MPa to 91.39 MPa, averaging 60.23 MPa (Table 2).
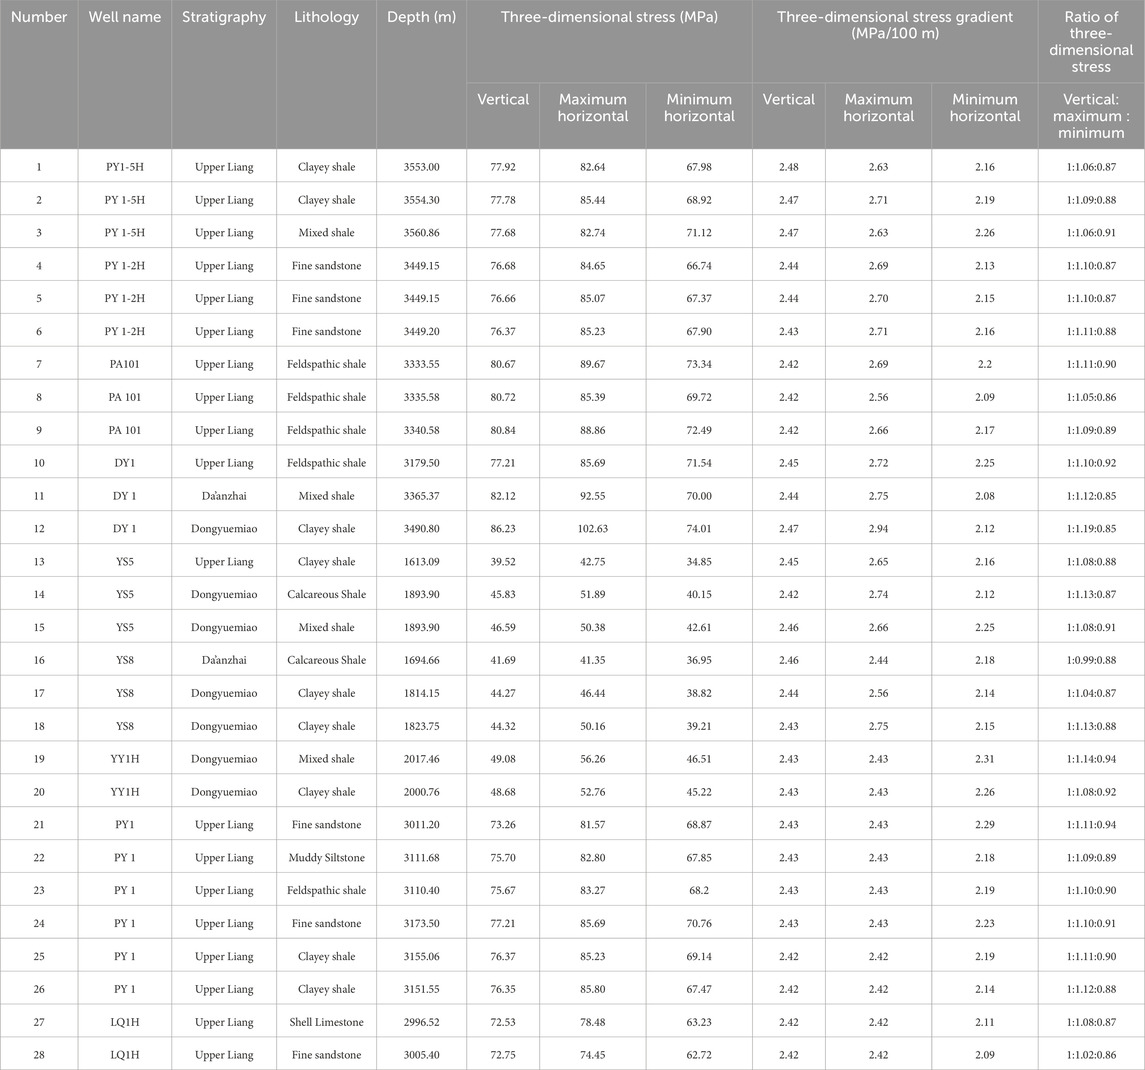
Table 2. Results of three-way stress values of the second member of Jurassic differential strain tests in the Yingshan-Pingchang area.
Based on the stress-strain relationship along the three principal orientations, the ratio of the magnitudes of the three-dimensional stress can be obtained. The stress ratio of the tested samples indicates that the maximum horizontal principal stress value > vertical principal stress value > minimum horizontal principal stress value, suggesting a strike-slip stress regime. Statistical analysis of the minimum principal stress gradient for different lithologies shows that, the minimum principal stress gradient of shale is higher than that of limestone and sandstone (Figure 8A). Due to the high clay mineral content in shale, the minimum horizontal principal stress gradient tends to be relatively high. According to the formula for calculating the minimum horizontal principal stress, a higher content of plastic minerals results in a larger tectonic strain coefficient, which in turn leads to an increase in the minimum horizontal stress gradient. Overall, the Jurassic stress values are higher in the Pingchang area than in the Longgang area and higher than in the Yingshan area due to the burial depth (Figure 8B).
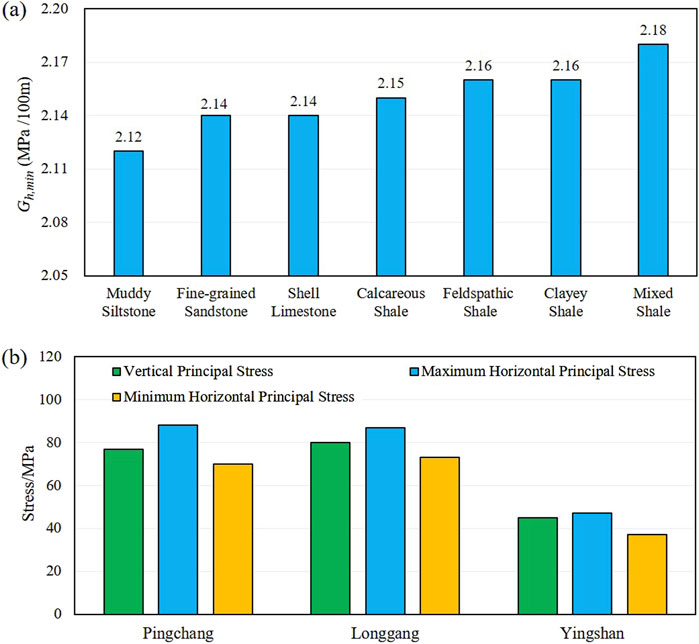
Figure 8. (A) Minimum principal stress gradient for different lithologies in the Jurassic Formation in the Yingshan-Pingchang area; (B) Three-dimensional Stress histogram for different areas in the Yingshan-Pingchang area.
The hydraulic fracturing method for in-situ stress measurement relies primarily on the pressure-time curve recorded during the fracturing process. By integrating relevant rock mechanics parameters and fracturing theory, the magnitudes of in-situ stresses can be calculated. Compared to other measurement methods, this approach does not require prior knowledge of the rock’s mechanical parameters, yet it enables the determination of multiple stress parameters within the formation. Additionally, it offers several advantages, including simple equipment, convenient operation, significant measurement depth, the ability for continuous or repeated testing at any depth, rapid measurement speed, intuitive measurement values, and comprehensive representation of the stress field (Schmitt et al., 2012; Wang et al., 2020). The use of fracturing data to determine in-situ stress is one of the most direct and reliable methods currently available.
Through the analysis and calculation of fracturing data (Table 3), it is concluded that the shut-in pressures for wells PA101, PY1-1H, PY1-2H, and PY1-3H mainly range from 35 to 42 MPa, averaging 37.01 MPa. Using the fracturing data, the in-situ stress magnitudes calculated by the hydraulic fracturing method are obtained (Table 3). Taking well PA101H as an example, the calculated maximum horizontal principal stress is 75.52 MPa, and the minimum horizontal principal stress is 66.187 MPa. A comparison of the results from the differential strain experiment with the hydraulic fracturing stress calculation results at the same depth (Table 3) shows that the in-situ stress values measured in the differential strain experiment are close to those calculated by hydraulic fracturing, demonstrating considerable accuracy.
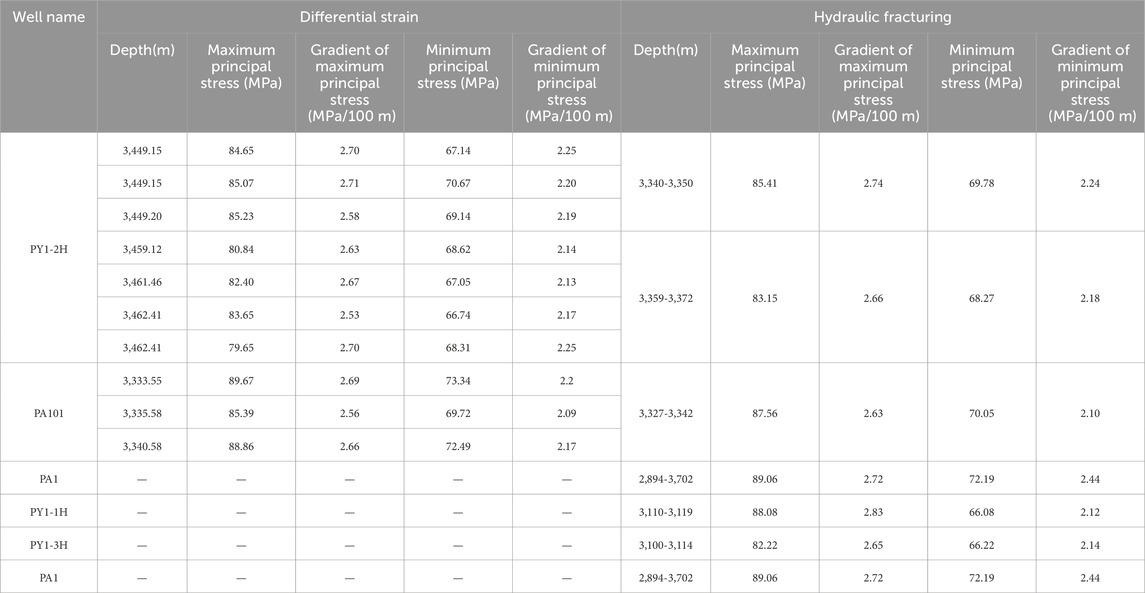
Table 3. Hydraulic fracturing and differential strain experiment calculation of in-situ stress size comparison data.
Based on the calculated magnitudes of in-situ stresses derived from construction parameter data, it was determined that the relationship among the stresses follows the pattern of maximum principal stress > vertical principal stress > minimum principal stress. Comprehensive analysis suggests that the stress regime in the Jurassic formation in this area is characterized by a strike-slip faulting stress type, which is consistent with the results obtained from the differential strain experiment.
In the Jurassic formations of the Yingshan-Pingchang area in northeastern Sichuan, bedding develops between layers, with the rock layers generally being isotropic in the horizontal direction (Zhang et al., 2021). Such layers can be modeled using the Vertical Transverse Isotropy (VTI) medium theory. For VTI formations, the axis of symmetry is in the vertical direction, while the plane of symmetry is horizontal. The rock properties are identical in the horizontal direction but differ in the vertical direction (Gary et al., 1995; Romain et al., 2004).
The magnitude of horizontal in-situ stress is influenced by factors such as vertical in-situ stress, formation pressure, and tectonic stress. Therefore, accurate calculation of vertical in-situ stress and pore pressure is essential. Typically, vertical stress is determined by integrating the density log curve. However, not all well sections possess a density log curve. Consequently, vertical stress is initially calculated using the average density of sections lacking a density log curve and subsequently augmented by the vertical stress obtained from integrating the density log curves of sections with density logs. The Formula 3 for calculating the vertical stress at a given depth in the formation is as follows:
In this formula: P
o
is the vertical stress, in MPa;
The overburden pressure gradient in the Ying Shan area mainly ranges from 2.46 to 2.5 MPa/100 m, while in the Longgang area, it ranges from 2.38 to 2.40 MPa/100 m, and in the Pingchang area, it ranges from 2.46 to 2.48 MPa/100 m.
Pore pressure is a critical parameter in drilling processes, fracturing design, and various other applications, and it is essential for evaluating in-situ stresses. Based on an analysis of the target formation in the study area, the method adheres to Teraghi’s effective stress theory. According to this theory, the overburden pressure within a given layer is partitioned into pore fluid pressure, supported by the pore fluids, and rock stress, supported by the solid grains of the bedrock. The relationship between overburden pressure, rock stress, and pore fluid pressure is calculated by Formula 4:
In this formula: P
0
is the overburden pressure, in MPa; P
P
is the pore fluid pressure, in MPa;
Based on the measured formation pressure data, well logging interpretation results of lithology, physical properties, and electrical response analysis, and considering the relationships among clay content, porosity, P-wave velocity, and effective stress, a multi-parameter regression algorithm was employed. To establish a formation pressure logging interpretation model that integrates data from different regions. The model is as follows in Formulas 5, 6:
Pingchang
Yingshan
In this formula: AC is the acoustic time delay from the sonic log, in μs/ft;
The relationship between stress and strain in a transversely isotropic medium (VTI medium) satisfies the generalized Hook’s law 4, and can be expressed as follows in Formula 7:
In this formula: C is the stiffness matrix, in GPa;
The symmetry type of formation rocks can be determined by the number of independent elastic parameters. An isotropic formation has two independent elastic parameters, while a transversely isotropic formation has five independent elastic parameters. To describe the stress-strain relationship in a VTI formation, the stiffness coefficients C 11 , C 33 , C 44 , C 66 , and C 13 need to be determined. These coefficients are calculated in Formulas 8-12, respectively, as follows:
In this formula:
Using an ultrasonic transducer system, the velocity of sound is measured on core plug samples extracted from large natural shale samples with vertical stratification. The core plug samples are taken at 0°, 45°, and 90° orientations. The corresponding five independent elastic parameters at the specified depth points can be calculated (Table 4).
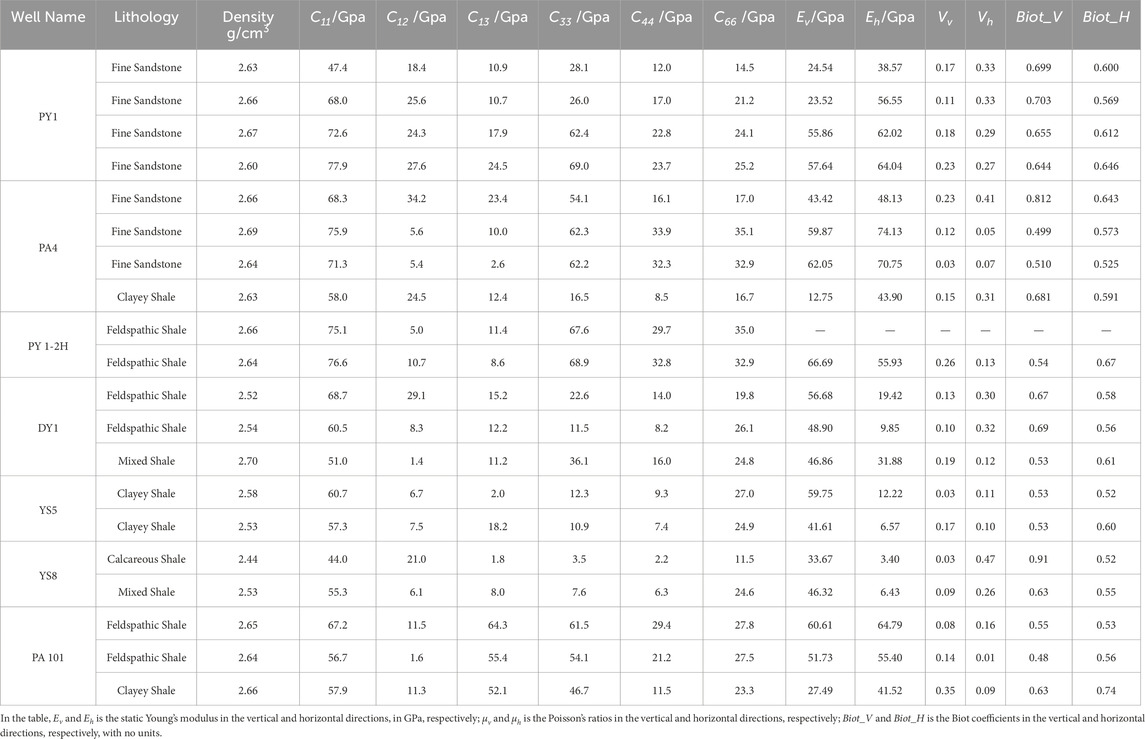
Table 4. Stiffness coefficient expaerimental values.
C 33 is calculated using the compressional wave velocity obtained from density and sonic data from well logging data. C 44 is calculated from the shear wave velocity derived from density and sonic data. C 66 can be determined by inversing the Stoneley wave velocity to compute the horizontal shear wave velocity and density. The parameters C 13 and C 11 need to be obtained from core experiments or empirical formulas. Based on core sample experimental data, Suarez-Rivera and Bratton proposed an improved ANNIE model called MANNE. By combining experimental data and using multiple linear regression to determine the coefficients of the MANNE model, resulting in the relationship Formulas 13-16 for C 13 and C 11 in vertical wells, sandstone, and shale as follows:
Vertical Well (Sandstone)
Vertical Well (Shale)
The Biot coefficient is a parameter used to describe the coupling relationship between the solid matrix and the pore pressure in a porous medium. It reflects the contributions of both the solid matrix and the pore space to the overall properties of the porous material. To obtain a more accurate estimate of the Biot coefficient, this study utilizes the effective stress theory. By employing experimentally measured parameters such as porosity, bulk modulus, and elastic modulus of the rock (Table 4), the Biot coefficient is estimated through theoretical derivation. The Biot coefficient is typically denoted by the symbol α and is defined as Formula 17:
In this formula: K dry is the rock’s bulk modulus; K solid is the bulk modulus of the skeleton.
After obtaining all the stiffness coefficients, the anisotropic rock mechanical parameters, such as dynamic elastic modulus and Poisson’s ratio, are calculated using the corresponding formulas. Based on the rock mechanical parameters derived from both mechanical experiments and acoustic logging data, a correction relationship model is established for the Pingchang and Yingshan areas, Formulas 18-25 are shown below:
Pingchang
Yingshan
In this formula: E
dv
and E
dh
is the dynamic Young’s modulus in the vertical and horizontal directions, in GPa;
Based on experimental measurements of the skeleton compression coefficient and the rock volume compression coefficient for the rock samples, a statistical analysis is conducted on the Biot coefficient in relation to parameters such as the acoustic travel time, rock bulk density, and other factors. A regression Formula 26 for the Biot coefficient with the GR and triple porosity logging curves is established as follows:
Using core experimental data combined with previously obtained parameters, including vertical stress, formation pore pressure, Young’s modulus, Poisson’s ratio, and Biot’s coefficient, the maximum and minimum tectonic stress coefficients are subsequently inverted based on the transversely isotropic (Sn) model Equations 27, 28.
Higgins et al. analyzed the anisotropic characteristics of VTI formations and developed the Sn model for interpreting the horizontal principal stress in VTI formations. The formula for calculating the horizontal principal stress in a transversely isotropic medium is as follows:
In this formula:
Taking well YS8 in the study area as an example. Using the parameters obtained above, the in-situ stress magnitude of the transversely isotropic terrestrial shale reservoir section was calculated using the VTI model. The calculated profile is shown in Figure 9.
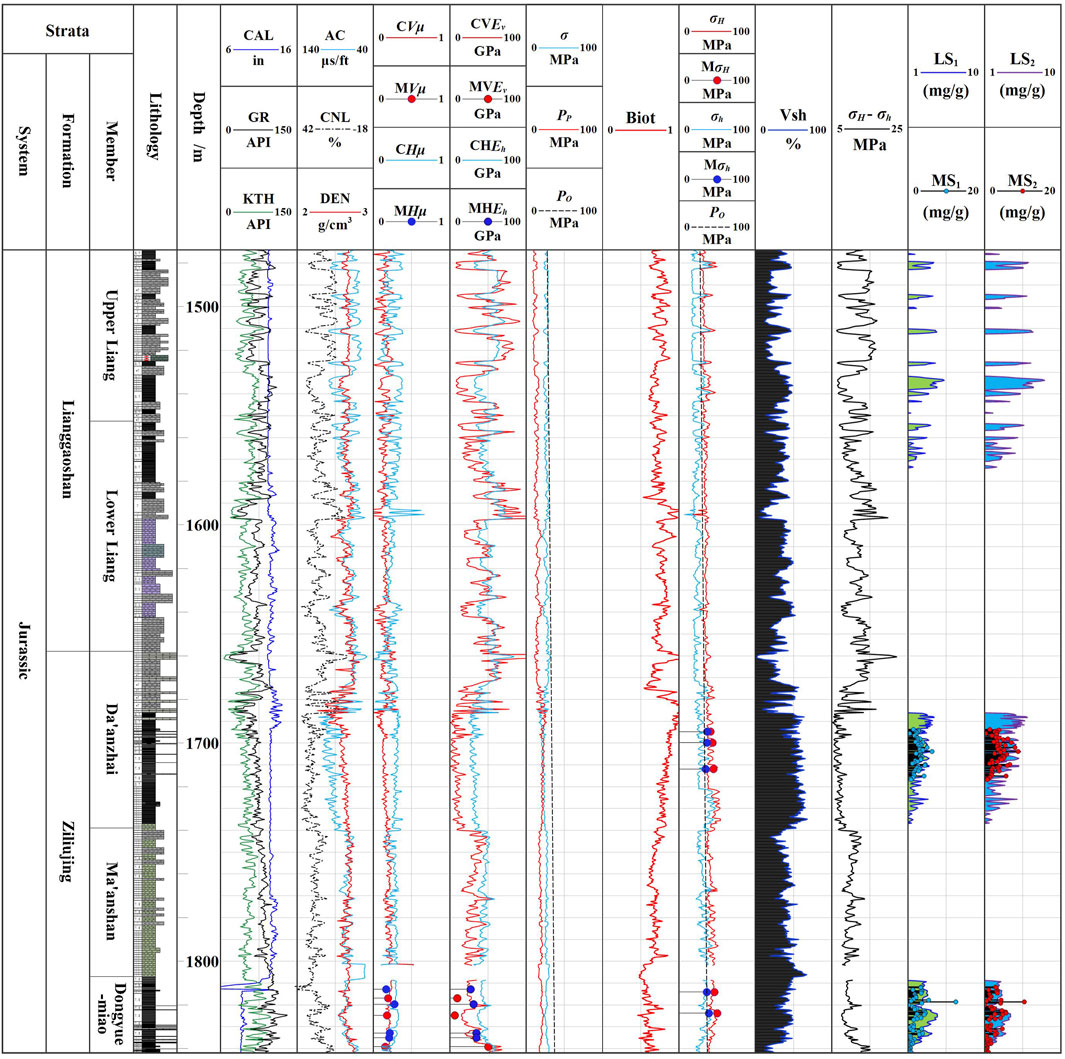
Figure 9. Correlation between calculated and measured data and logging profile diagram, well YS8.
The eighth and ninth channel show the vertical and horizontal Poisson’s ratios and Young’s moduli. It can be observed that in the terrestrial shale reservoir section,
To further analyze the effectiveness of the model’s in-situ stress calculations, the average relative error is used as the evaluation index. The calculation formula is given in Equation 29. The larger the average relative error indicates poorer model fitting and lower accuracy, while a smaller average relative error indicates higher model accuracy. The
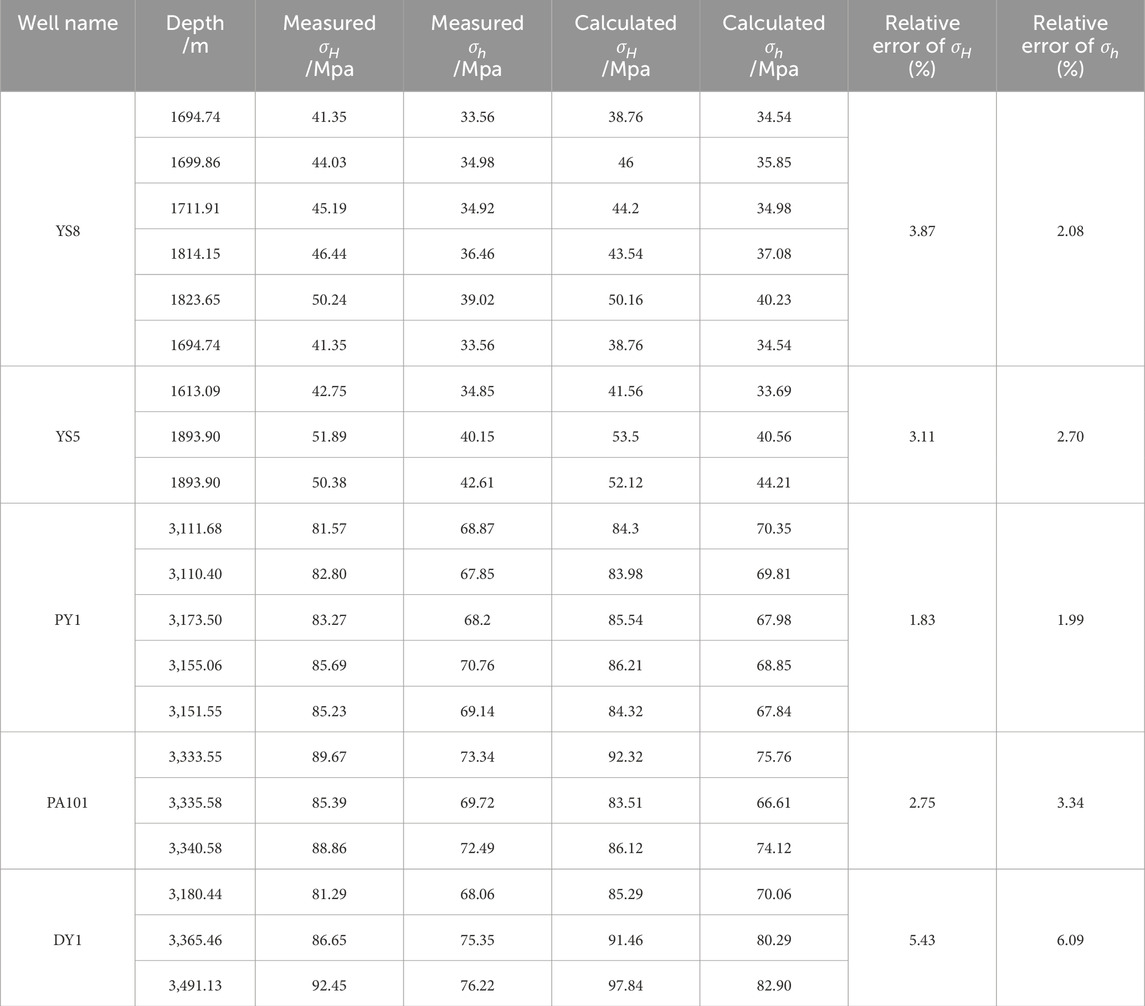
Table 5. Data of relative error in in-situ stress magnitude (part).
In this formula,
According to the in-situ stress profile of well YS81 (Figure 9), it can be observed that
Stress differences between the reservoir and the adjacent upper and lower surrounding rocks arise from their varying degrees of compactness, resulting in distinct stress gradients. Interlayer stress influences the extension and propagation orientation of hydraulic fractures, making it a crucial aspect of in-situ stress research. The horizontal stress differential is a key controlling factor for volumetric fracturing; a smaller differential facilitates the formation of a complex fracture network, whereas a larger differential tends to create fractures parallel to the maximum horizontal principal stress. Conversely, the height of fractures is primarily controlled by the distribution of the minimum principal stress within the fractured layer, while the length of fractures is mainly governed by the orientation of the maximum horizontal principal stress. Therefore, when selecting optimal fracturing intervals, it is necessary to further refine the classification of in-situ stress profiles from wells. Various stress profile types should be summarized, and fracturing should be targeted at the dominant type.
The typical profile types of horizontal principal stress difference in the Sichuan Basin are classified into the following five types: (1) High-Low-High type (Figure 10A-a1), the upper and lower peripheral rock stress difference magnitude are significantly higher than the reservoir stress difference; (2) High-Low-Low type (Figure 10A-a2), the upper enclosing ground stress difference is higher than the lower reservoir ground stress difference, while the difference between the lower enclosing ground stress difference and the reservoir ground stress difference is not significant; (3) Low-Low-High type (Figure 10A-a3), the lower enclosing ground stress difference is higher than the reservoir ground stress difference, while the difference between the upper enclosing ground stress difference and the reservoir ground stress difference is not significant; (4) Interlayer type (Figure 10A-a4), the upper and lower peripheral rock and the reservoir section have comparable stress difference and mutual high and low; (5) Low type (Figure 10A-a5), the upper and lower peripheral rock and reservoir section are at relatively low stress difference levels with no significant difference between them.
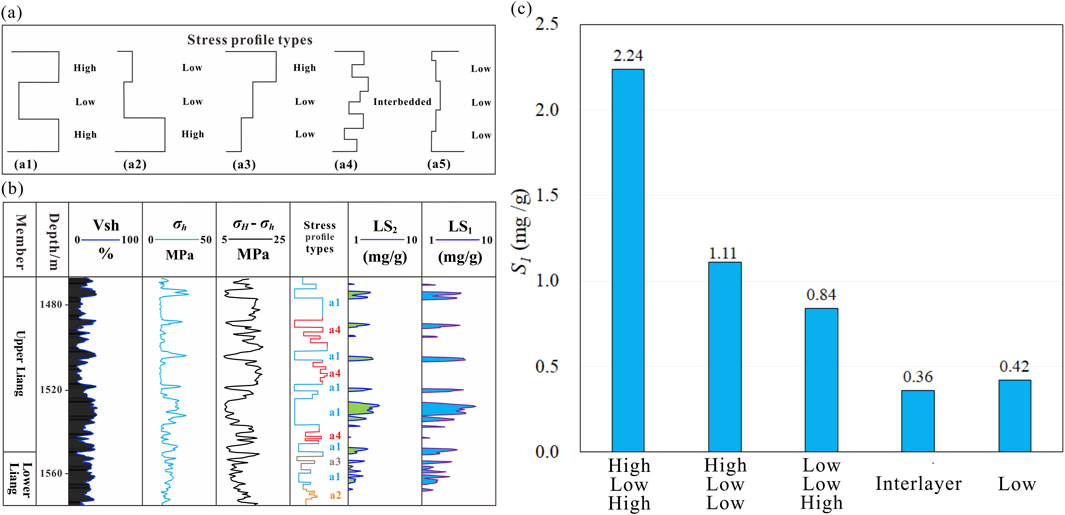
Figure 10. Characteristic profiles of different stress difference profile types (A) Typical stress difference profile types characteristics; (B) Example of YS8 stress difference profile types delineation; (C) Statistical plot of average S1 values for different stress difference profile types.
A fine classification of the stress difference profile types was performed on the stress profile of the YS8 well (Figure 10B), and combined with the oil content and hydrocarbon generation potential curves S1 and S2 calculated from the well log data. The analysis showed that when the stress difference profile type is of the High-Low-High, the oil content calculated from the well log is the highest, making it the dominant stress difference profile types in the study area (Figure 10C). In this stress difference profile types, the relatively small value facilitates the formation of a complex fracture network, which enhances reservoir connectivity and improves oil and gas flow, thereby achieving better reservoir stimulation results. Moreover, when the stress difference is small, fractures typically do not extend excessively into other layers, thus reducing the risk of layer penetration.
This study integrates three primary methods for obtaining in-situ stress parameters in terrestrial shale reservoirs: core testing, field measurements, and well logging interpretation. Among these, core testing is the most direct and effective approach for acquiring stress parameters (Wang, 2014). However, this study does not employ acoustic emission testing for stress magnitude estimation, due to its low accuracy and significant uncertainty in identifying the Kaiser effect point of in-situ stress (Jayanthu, 2019; Fraser et al., 2021). Instead, the differential strain analysis method is used, which simulates formation conditions to measure the differential strain in various directions of the core, thereby determining the stress state experienced by the rock in the formation (Shen et al., 2008).
In the absence of core samples, specialized logging techniques such as imaging logging and dipole shear wave logging can serve as effective alternatives (Han et al., 2020; Cao et al., 2022). However, in formations with well-developed high-angle fractures, borehole walls are prone to collapse due to fracturing, which affects stress direction interpretation based on borehole breakouts, thereby limiting its applicability. Additionally, in reservoirs with low differential stress coefficients, weak anisotropy and minimal borehole deformation further constrain the applicability of certain in-situ stress direction interpretation methods.
At the same time, due to the high cost of specialized logging, such techniques cannot be deployed in all wells in practical applications. In this context, conventional logging, with its lower cost and continuous distribution of test points, demonstrates significant application potential. Based on known rock mechanics parameters, this study establishes an in-situ stress interpretation model using the theory of transverse isotropic (VTI) media (Li, 2016; Yu et al., 2020; Lin et al., 2022b; Wang, 2022; Wang, 2023), enabling the indirect acquisition of continuous stress profiles. Finally, the accuracy of the transverse isotropy (VTI) model for stress calculation was validated using core-based stress measurement results. However, the model has certain limitations in calculating stress for different lithologies. These limitations primarily stem from the non-uniqueness of the well-log responses, the resolution limitations of the logging data, and the insufficient ability to characterize thin layers and subtle lithological variations. Therefore, the calculation of stress parameters should involve cross-validation and confirmation through multiple systems and methods.
Previous studies on the calculation and application of in-situ stress in terrestrial shale reservoirs have primarily focused on employing various methods and constructing multiple models for comparative analysis (Lin et al., 2022b; Wang, 2023) to enhance the accuracy of stress profile interpretation. Due to the poor physical properties of terrestrial shale reservoirs, achieving economic production often requires large-scale volumetric fracture network modifications along the entire wellbore (Mayerhofer et al., 2010). Building on this foundation, this study not only establishes continuous in-situ stress profiles for individual wells but also further explores the impact of the present-day stress state on reservoir stimulation effectiveness. Building on previous research findings, a greater horizontal principal stress difference is less conducive to forming a complex fracture network near the wellbore. In such cases, volumetric fractures tend to extend further in length while narrowing in width, leading to the formation of planar fractures during hydraulic fracturing. Conversely, a smaller stress difference promotes fracture propagation along natural fractures, resulting in a more intricate fracture network (Zhao and Li, 2014; Zhang et al., 2019; Ning et al., 2021). Therefore, when selecting fracturing intervals, it is essential to precisely characterize the interlayer stress distribution and accurately predict fracture propagation across layers. Failure to do so may lead to issues such as proppant blockage, premature termination of operations, or even complete engineering failure. Only by accurately evaluating the vertical and horizontal propagation of fractures can the optimal construction scale and well pattern be scientifically determined, thereby achieving the best reservoir stimulation results. Based on a systematic classification of five fundamental stress difference profile types in the study area, this study ultimately identifies the high-low-high (HLH) stress difference profile as the most promising in terms of production potential and reservoir stimulation effectiveness.
(1) The current stress orientation in the Yingshan-Pingchang area of the Jurassic Formation, determined by comprehensive analysis of differential strain, electrical imaging logging, and dipole shear wave logging, is predominantly in the EW orientation. The orientation ranges from N 87°–120° E, with the main direction maintaining a consistent range of NE 95° ± 10°. In the Yingshan area, the local tectonic influence causes a clockwise deviation of the in-situ stress orientation, primarily ranging from N60° to 80°E.
(2) Differential strain experiments in Jurassic shale reservoirs in the Yingshan-Pingchang area revealed the horizontal maximum principal stress ranges from 42.33 MPa to 102.56 MPa, averaging 74.89 MPa. The minimum horizontal principal stress ranges from 39.20 MPa to 84.04 MPa, averaging 67.20 MPa. The vertical principal stress ranges from 31.91 MPa to 91.39 MPa, averaging 60.23 MPa. The stress ratio of the tested samples indicates that the maximum horizontal principal stress value > vertical principal stress value > minimum horizontal principal stress value, suggesting a strike-slip stress regime. These results were validated using in-situ stress calculations from hydraulic fracturing, indicating that the accuracy of the stress magnitudes measured by the differential strain experiments is relatively high. Statistical analysis of the minimum principal stress gradient for different lithologies shows that the minimum principal stress gradient of shale is higher than that of limestone and sandstone.
(3) The key parameters of the transverse isotropic in-situ stress model were derived by correcting well log data using laboratory experimental testing and analysis methods. Predicted results for the minimum and maximum horizontal principal stresses from the transverse isotropic in-situ stress prediction model showed average relative errors of only 3.39% and 3.23%, respectively, when compared to the measured in-situ stress values. Vertically, the high-low-high (HLH) stress difference profile type demonstrates the highest oil-bearing potential and a reduced likelihood of fracturing-induced artificial fractures penetrating through layers, making it the optimal structural type for selecting the fracturing stage in the study area’s in-situ stress difference fracturing.
The raw data supporting the conclusions of this article will be made available by the authors, without undue reservation.
SY: Funding acquisition, Project administration, Writing–original draft, Writing–review and editing. JZ: Formal Analysis, Software, Validation, Writing–review and editing. HD: Data curation, Funding acquisition, Methodology, Supervision, Project administration, Writing–original draft. HQ: Data curation, Visualization, Writing–review and editing. WX: Data curation, Visualization, Writing–review and editing. YD: Data curation, Investigation, Methodology, Visualization, Writing–review and editing, Writing–original draft. MG: Data curation, Investigation, Visualization, Writing–review and editing. TH: Data curation, Investigation, Visualization, Writing–review and editing. CL: Data curation, Investigation, Visualization, Writing–review and editing.
The author(s) declare that financial support was received for the research, authorship, and/or publication of this article. Scientific Research Project of PetroChina Petroleum and Natural Gas Corporation Oilfield Company, Research on Application Technology of Unconventional Oil and Gas Geomechanics, Project No.: DQP-2022-KT-KY-004.
Authors SY, JZ, HQ, WX, and TH were employed by the Exploration and Development Research Institute of PetroChina Daqing Oilfield.
The remaining authors declare that the research was conducted in the absence of any commercial or financial relationships that could be construed as a potential conflict of interest.
The authors declare that this study received funding from PetroChina Petroleum and Natural Gas Corporation Oilfield Company. The funder had the following involvement in the study: design, collection, analysis, interpretation of data, the writing of this article.
The author(s) declare that no Generative AI was used in the creation of this manuscript.
All claims expressed in this article are solely those of the authors and do not necessarily represent those of their affiliated organizations, or those of the publisher, the editors and the reviewers. Any product that may be evaluated in this article, or claim that may be made by its manufacturer, is not guaranteed or endorsed by the publisher.
The Supplementary Material for this article can be found online at: https://www.frontiersin.org/articles/10.3389/feart.2025.1530002/full#supplementary-material
Andrew, K., Mark, W. F., and John, D. W. (2016). Use of borehole imaging to improve understanding of the in-situ stress orientation of Central and Northern England and its implications for unconventional hydrocarbon resources: marine and Petroleum Geology. Mar. Pet. Geol. 73, 1–20. doi:10.1016/j.marpetgeo.2016.02.012
Bao, S., Ge, M., Xu, X., Guo, T., Lin, Y., Mou, D., et al. (2023). Progress and development proposals in the exploration and development of continental shale oil in China. Geol. 50, 1343–1354. doi:10.12029/gc20230105002
Baouche, R., Sen, S., Ganguli, S. S., and Feriel, H. A. (2021). Petrophysical, geomechanical and depositional environment characterization of the triassic TAGI reservoir from the hassi berkine south field, berkine basin, southeastern Algeria. J Nat. Sci. Eng. 92, 104002. doi:10.1016/j.jngse.2021.104002
Cai, W. (2023). Study on the quantitative prediction method of lost circulation in fractured Formation in pre-exploration area. Beijing: China University of Petroleum. doi:10.27643/d.cnki.gsybu.2023.000254
Cao, F., He, J., Wang, Y., Deng, H., and Xu, Q. (2022). Methods to evaluate present-day in⁃ situ stress direction for low anisotropic reservoirs in the second member of the Xujiahe Formation in hechuan area. Adv. Earth Sci. 37, 742–755. doi:10.11867/j.issn.1001-8166.2022.036
Cao, H., Sun, D., Yuan, K., Li, A., and Zhang, G. (2020). In-situ stress determination of 3 km oil-gas deep hole and analysis of the tectonic stress field in the southern Guizhou. Geol. 47, 88–98. doi:10.12029/gc20200107
Chen, C., and Liu, X. (2024). Oil and gas exploration potential of continental shale of Lianggaoshan Formation of Middle Jurassic in Qijiang area of southeastern Sichuan. Geol. Exp. 46, 1015–1027. doi:10.11781/sysydz2024051015
Chen, C., Yang, X., Wang, Z., Li, B., and Huang, Z. (2019). Sedimentary facies of coquina limestone in lacustrine carbonate: a case study of Da'anzhai member,Lower Jurassic in Northeastern Sichuan basin, China. Geol. Rev. 65, 117–119. doi:10.16509/j.georeview.2019.s1.056
Colleen, B., Daniel, M., and Kazuhiko, T. (2009). Geomechanical wellbore imaging: implications for reservoir fracture permeability. Bulleitin. 93, 1551–1569. doi:10.1306/06180909030
Du, X., Jin, Z., Zeng, L., Liu, G., Yang, S., and Liang, X. (2024). Evaluation of natural fracture effectiveness in deep lacustrine shale oil reservoirs based on formation microresistivity imaging logs. Oil Gas Geol. 45, 852–865. doi:10.11743/ogg20240319
Fang, R., Jiang, Y., Yang, C., Wang, Z., Sun, S., Zhu, X., et al. (2023). Geological characteristics of shale oil in the jurassic lianggaoshan Formation in Sichuan Basin. Pet. Expl. 28, 66. doi:10.3969/j.issn.1672-7703.2023.04.007
Feng, R., Wu, Y., Tao, S., Zhang, T., Yue, T., and Liu, M. (2015). Sedimentary microfacies characteristics and their control on reservoirs in daanzhai member, lower jurassic, Sichuan Basin. Pet. Oil Geol. 37, 320–327. doi:10.11781/sysydz201503320
Fraser, D., Gholami, R., and Sarmadivaleh, M. (2021). Deformation Rate Analysis: how to determine in-situ stresses in unconventional gas reservoirs. Geol. 146, 104892. doi:10.1016/j.ijrmms.2021.104892
Ganguli, S. S., Sen, S., and Verma, S. (2021). Characterization of organic content, brittleness index, and geomechanical properties of the Eocene Cambay Shales — insights from the Ankleshwar oil field in western India. Charact. Org. content, brittleness index, geomechanical Prop. Eocene Cambay Shales—Insights Ankleshwar oil field West. India Interpretation 9, T235–T252. doi:10.1190/int-2020-0133.1
Ganguli, S. S., Vedanti, N., Pandey, O., and Dimri, V. (2018). Deep thermal regime, temperature induced over-pressured zone and implications for hydrocarbon potential in the Ankleshwar oil field, Cambay basin, India: J. Asian Earth Sci. 161, 93–102. doi:10.1016/j.jseaes.2018.05.005
Gao, S., Deng, H., Yan, W., Yin, S., Zhou, J., Wen, Z., et al. (2023). Evaluation and engineering applications of the in situ stress state of deep tight sandstone reservoirs in the Xujiahe Formation of the Yingshan-Longgang in the central Sichuan Basin. Earth Sci. 11, 1204082. doi:10.3389/feart.2023.1204082
Gary, M., Tapan, M., and Nicola, G. (1995). Predicting stress-induced velocity anisotropy in rocks. Geophy. 60, 1081–1087. doi:10.1190/1.1443836
Guo, X., Ma, X., and Li, M. (2023). Mechanisms for lacustrine shale oil enrichment in Chinese sedimentary basins. Oil Gas Geol. 44, 1333–1349. doi:10.11743/ogg20230601
He, J., Cao, H., Deng, H., Yin, C., Zhu, Y., Li, C., et al. (2024). Study on the development characteristics and formation evolution models of natural fractures in the Lianggaoshan formation shale in the yingshan-pingchang area of Northeastern Sichuan basin. Earth Sci. Front. 31 (05), 17–34. doi:10.13745/j.esf.sf.2024.6.16
He, W., and Bai, Q. (2022). Accumulation geological characteristics and major discoveries of lacustrine shale oil in Sichuan Basin. Mar. Pet. Geol. 43, 885. doi:10.7623/syxb202207001
Heng, S., Guo, Y., Yang, C., Daemen, J. J., and Li, Z. (2015). Experimental and theoretical study of the anisotropic properties of shale: international journal of rock mechanics and mining sciences. Min. Sci. 74, 58–68. doi:10.1016/j.ijrmms.2015.01.003
Hu, Z., Wang, R., and Li, J. (2023). Storage characteristic comparison of pores between lacustrine shales and their interbeds and differential evolutionary patterns. Oil Gas Geol. 44, 1393–1404. doi:10.11743/ogg20230605
Jarvie, D. M., Hill, R. J., Ruble, T. E., and Pollastro, R. M. (2007). Unconventional shale-gas systems: the Mississippian Barnett Shale of north-central Texas as one model for thermogenic shale-gas assessment. Gas Geol. 91, 475–499. doi:10.1306/12190606068
Jayanthu, S. (2019). Estimation of in-situ stress–experiemtnal trials on Kaiser effect and hydrofracturing tests: journal of Mines. Metals Fuels, 311–315.
Jiang, W., Tan, X., Wang, J., Fu, M., Chen, Q., and Wu, K. (2016). Diagenesis of tight sandstones and formation mechanism of the reservoir in the Xujiahe Formation, the Eastern margin of Longnvsi. Geol. Sci. 30, 1348.
Ju, W., Li, Z., Sun, W., and Xu, H. (2018). In-situ stress orientations in the xiagou tight oil reservoir of qingxi Oilfield, jiuxi basin, northwestern China. Marine Pet Geol. 98, 258–269. doi:10.1016/j.marpetgeo.2018.08.020
Legarreta, L., and Villar, H. J. (2011). Geological and geochemical keys of the potential shale resources, Argentina basins. Google scholar. 80196.
Li, C. (2016). Study and application of fracture-induced stress field in Dagang tight oil reservoirs: thesis.
Li, D., Li, J., Wang, S., and Zhang, B. (2016). Fine dissection of Jurassic tight oil calibrated area and key parameters research in Sichuan basin, China. Nat. Gas Geol. 27, 1666–1678. doi:10.11764/i.issn.1672-1926.2016.09.1666
Lin, H., Xiong, J., Peng, M., Liu, X., Liang, L., and Ding, Y. (2022a). Research on in-situ stress logging prediction of transversely isotropic continental shale reservoir: case study of the F Formation continental shale oil reservoir in MH Sag, Xinjiang. Nat. Gas Geol. 33, 1712–1722. doi:10.11764/j.issn.1672-1926.2022.05.004
Liu, H., Liang, H., Cai, L., and Shen, F. (1994). Structural styles of the longmenshan thrust belt and evolution of the foreland basin in western sichuan province, China. Acta Geol. Edi. 7, 351–372. doi:10.1111/j.1755-6724.1994.mp7004001.x
Liu, S., Yang, Y., Deng, B., Zhong, Y., Wen, L., Sun, W., et al. (2021). Tectonic evolution of the Sichuan Basin, southwest China: Earth Sci. Rev. 213, 103470. doi:10.1016/j.earscirev.2020.103470
Lv, J., Xie, R., Zhou, W., Liu, Y., and Yin, S. (2017). “Application of LM-BP neural network in simulation of shear wave velocity of shale formation,” J. Petlum. 41 75–83. doi:10.3969/j.issn.1673-5005.2017.03.009
Mayerhofer, M. J., Lolon, E. P., Warpinski, N. R., Cipolla, C. L., Walser, D., and Rightmire, C. M. (2010). What is stimulated reservoir volume. SPE Prod. Opt. 25, 89–98. doi:10.2118/119890-pa
Ni, C., Yang, J., Chen, W., Chen, J., Hou, G., and Wang, Y. (2015). Reservoir characteristics and development model of dense limestone: a case study from Daanzhai member in central Sichuan Basin. Lit. Res. 27, 38–47.
Ning, W., He, B., Li, F., Xie, L., Shi, A., and He, Q. (2021). Experimental study on fractures morphology of hydraulic fracturing in continental shale oil reservoir. Sci Technol Eng. 21, 7505–7512.
Peng, G. (2023). Fracture propagation laws of staged hydraulic fracture in fractured geothermal reservoir based on phase field model. Int. J. Coal Sci. Tech. 10, 52. doi:10.1007/s40789-023-00636-y
Romain, P., Andrey, B., and Victor, B. (2004). Nonlinear rock physics model for estimation of 3D subsurface stress in anisotropic formations. Theo. Lab. Geophys. 69, 415–425. doi:10.1190/1.1707061
Schmitt, D. R., Currie, C. A., and Zhang, L. (2012). Crustal stress determination from boreholes and rock cores. Fund. Principles. 580, 1–26. doi:10.1016/j.tecto.2012.08.029
Shu, Z., Shu, Y., Chen, M., Peng, W., and Liu, H. (2024). Lithofacies heterogeneity and reservoir pore development characteristics of continental shale: a case study of the Dongyuemiao shale of the Ziliujing Formation in the Sichuan Basin. Geol. Sci. Technol. 43, 1–15. doi:10.19509/j.cnki.dzkq.tb20220446
Sun, L., Li, M., Abdelaziz, A., Tang, X., Liu, Q., and Grasselli, G. (2023). An efficient 3D cell-based discrete fracture-matrix flow model for digitally captured fracture networks. Int. J. Coal Sci. Techno. 10, 70. doi:10.1007/s40789-023-00625-1
US ElA (2015). World shale resource assessments. Available at: https://www.eia.gov/analysis/studies/worldshalegas/.
Vanden Berg, M. D., Wood, R. E., Carney, S. M., and Morgan, C. D. (2014). Geological characterization of the Uteland Butte member of the eocene Green River Formation:an emerging unconventional carbonate tight oil play in the Uinta Basin,Utah. Rocky mountain association of geologist-American association of Petroleum geologists annual meeting.
Wang, C. (2014). Brief review and outlook of main estimate and measurement methods for in-situ stresses in rock mass. Geol. Rev. 60, 971–996. doi:10.16509/j.georeview.2014.05.005
Wang, C., Gao, G., Wang, H., and Wang, P. (2020). Integrated determination of principal stress and tensile strength of rock based on the laboratory and field hydraulic fracturing tests. J. Geo. 26, 167–174. doi:10.12090/i.issn.1006-6616.2020.26.02.016
Wang, H., Qiu, T., Wang, Z., Dong, Z., Wang, J., and Huang, K. (2024). Oil and gas enrichment conditions and favorable areas prediction of Liang⁃gaoshan formation shale in Pingchang area of Sichuan Basin: Petroleum geology and Oilfield development in daqing. 1–9. doi:10.19597/j.Issn.1000-3754.202402002
Wang, L., Lu, Y., Yang, X., Gao, F., Zhang, H., Li, H., et al. (2010). Study of distribution characteristics of in-situ stresses for huozhou mining area. J. Mech. Eng. 29, 2768–2773.
Wang, Q., Chen, X., Jha, A. N., and Rogers, H. (2014). Natural gas from shale formation–the evolution, evidences and challenges of shale gas revolution in United States. Ren. Sus. Energy Rev. 30, 1–28. doi:10.1016/j.rser.2013.08.065
Wang, X. (2022). Characterization and mechanical behavior of natural fractures in continental shale reservoirs Xi’an University of Science and Technology. Pet. Oil Geol. 176, 107346. doi:10.27397/d.cnki.gxaku.2022.000014
Wang, Z. (2021). “Research on fracturing model and evaluation method of continental shale reservoir China university of Petroleum,”. Beijing. doi:10.27643/d.cnki.gsybu.2021.000752
Xiong, J., Wu, J., Liu, X., Zhang, L., and Liang, L. (2023). The geomechanical characteristics of the continental shale reservoirs and their influence on the fracturing effect. Sci. Tech. Edi. 45 (5), 69–80. doi:10.11885/iissn.1674-5086.2021.12.28.01
Xiong, L., Dong, X., Wang, T., Wei, L., Ouyang, J., Wang, B., et al. (2024). Reassessment of exploration directions of continental shale oil in Lower Jurassic Da’anzhai Member in northern Sichuan Basin. Pet. Geol. Exp. 46, 989–1001. doi:10.11781/sysydz202405989
Xu, Y. (2023). Sedimentary characteristics and evolution of lower jurassic ziliujing -lianggao Formation in northeastern Sichuan Basin. Beijing: China University of Petroleum. doi:10.27643/d.cnki.gsybu.2023.002057
Yang, Y., Wen, L., Zhou, G., Zhan, W., Li, H., Song, Z., et al. (2023). New fields, new types and resource potentials of hydrocarbon exploration in Sichuan Basin. Pet. Sci. 44, 2045. doi:10.7623/syxb202312004
Yong, R., Wu, J., Huang, H., Xu, E., and Xu, B. (2022). Complex in situ stress states in a deep shale gas reservoir in the southern Sichuan Basin, China. Field Sci. Geol. 141, 105702. doi:10.1016/j.marpetgeo.2022.105702
Yu, Z., Zhuang, Y., and He, Y. (2020). Mechanical characleristies and crustal slress analysis of F block in Ordos Basin. Sci. Tech. Eng. 20, 1805–1811.
Zhang, H., Peng, J., Wang, X., and Li, J. (2023). Breakthrough of jurassic shale gas exploration in well Puluye1 of Sichuan Basin and its significance. Pet. 44, 1500. doi:10.7623/syxb202309008
Zhang, J., Fan, X., Huang, Z., Liu, Z., and Qi, Y. (2021). Assessment of anisotropic in–situ stressses in the upper triassic Xujiahe formation reservoirs in western sichuan depression of the Sichuan Basin. Oil Gas Geol. 42, 963–972. doi:10.11743/ogg20210416
Zhang, R., Hou, B., Han, H., Fan, M., and Chen, M. (2019). Experimental investigation on fracture morphology in laminated shale formation by hydraulic fracturing. J. Pet. Sci. Eng. 177, 442–451. doi:10.1016/j.petrol.2019.02.056
Zhang, Y., Dong, S., Li, J., and Shi, W. (2011). Mesozoic multi-directional compressional tectonics and formation-reformation of Sichuan basin. Geol. 38, 233–250.
Zhao, J., and Li, Y. (2014). Simulation of a complex fracture network Influenced by natural fractures. Nat. Gas Eng. 34, 68. doi:10.3787/i.issn.1000-0976.2014.01.010
Zhu, T. (2020). Main controlling factors and typesof continental shale oil and gas enrichment in Sichuan Basin. Pet. Geol. Exp. 42 (03), 345–354. doi:10.11781/sysydz202003345
Keywords: terrestrial shale oil and gas, strong heterogeneity, in-situ stress orientation and magnitude, VTI formation, transversely isotropic
Citation: Yin S, Zhang J, Deng H, Qin H, Xia W, Du Y, Gong M, Huang T and Li C (2025) Evaluation methods and engineering applications of in-situ stress in deep, strong heterogeneity terrestrial shale oil and gas reservoirs: a case study of jurassic shales in the Yingshan-Pingchang area, northeast Sichuan. Front. Earth Sci. 13:1530002. doi: 10.3389/feart.2025.1530002
Received: 18 November 2024; Accepted: 14 February 2025;
Published: 20 March 2025.
Edited by:
Peng Wu, Dalian University of Technology, ChinaReviewed by:
Shib Sankar Ganguli, National Geophysical Research Institute (CSIR), IndiaCopyright © 2025 Yin, Zhang, Deng, Qin, Xia, Du, Gong, Huang and Li. This is an open-access article distributed under the terms of the Creative Commons Attribution License (CC BY). The use, distribution or reproduction in other forums is permitted, provided the original author(s) and the copyright owner(s) are credited and that the original publication in this journal is cited, in accordance with accepted academic practice. No use, distribution or reproduction is permitted which does not comply with these terms.
*Correspondence: Hucheng Deng, ZGVuZ2h1Y2hlbmdAY2R1dC5jbg==; Yu Du, ZHVfeXVAc3R1LmNkdXQuZWR1LmNu
Disclaimer: All claims expressed in this article are solely those of the authors and do not necessarily represent those of their affiliated organizations, or those of the publisher, the editors and the reviewers. Any product that may be evaluated in this article or claim that may be made by its manufacturer is not guaranteed or endorsed by the publisher.
Research integrity at Frontiers
Learn more about the work of our research integrity team to safeguard the quality of each article we publish.