 Haiwen Liu
 Zhenzhen Dai1
 Kun Wang
 Kaijun Wu
- 1Department of Aviation Meteorology, Civil Aviation University of China, Tianjin, China
- 2School of Aviation Meteorology, Civil Aviation Flight University of China, Guanghan, China
- 3Institute of Urban Meteorology, China Meteorological Administration, Beijing, China
The Tibetan Plateau is known as the “Third Pole”. However, there are few studies on clear-air turbulence (CAT) event over the Tibetan Plateau. On 11 February 2023, a severe clear-air turbulence (CAT) event occurred along Lhasa-Chongqing route. To verify the role of mountain waves in this aircraft turbulence event, using ERA5 reanalysis data and the Weather Research and Forecasting (WRF) Model, the characteristics and generation mechanisms of this event are investigated. In synoptic features, the warm advection in the lower troposphere benefits the atmospheric instability, promoting the development of atmospheric turbulence. The CAT primarily occurred near the upper-level jet stream core. The significant vertical wind shear decreases the Richardson number (Ri). Kelvin–Helmholtz (K-H) instability with small Ri generates the CAT. To a certain extent, the WRF model can reproduce this turbulence event and accurately simulate the vertical motions over the plateau. Though previous studies indicated that the Tibetan Plateau is one of the main causes of CAT along Sichuan-Tibet route for the complex topography, our results of terrain sensitive experiments reveal that the topography of the plateau has little impact on this turbulence event. Therefore, K-H instability related to tropopause folding is the main mechanism causing this aircraft turbulence.
1 Introduction
Aircraft turbulence refers to the perturbations experienced by an aircraft due to atmospheric turbulence with a horizontal scale between 100 and 1,000 m, also known as aircraft-scale turbulence (Sharman et al., 2006; Liu et al., 2023). In aeronautical meteorology, turbulence occurring in the free atmosphere over 6,000 m is commonly referred to as Clear Air Turbulence (CAT), which does exclude turbulence linked to deep convection and convectively unstable boundary layers, but does not eliminate turbulence occurring within non-convective clouds (mostly cirrus) (Sharman and Pearson, 2017). As aircraft turbulence can result in occupant injuries, flight delays and aircraft damages (Sharman et al., 2012), it has long been a serious concern in the field of aeronautical meteorology. Particularly, CAT is considered one of the most significant threats to flight safety, because it is difficult to be detected by pilots or onboard radar systems (Williams and Joshi, 2013). Furthermore, the frequency of CAT is expected to increase obviously in the future under global warming (Williams and Joshi, 2013; Williams, 2017; Atrill et al., 2021; Hu et al., 2021).
The Tibetan Plateau, with an average altitude of over 4,000 m, is known as the “Third Pole” of the Earth. Due to the complex terrain, the Tibetan Plateau is also considered a frequent occurrence zone for aircraft turbulence. Xu et al. (2007) argued that the frequency and severity of turbulence along the Chengdu-Lhasa route are strongly related to the large topography of the Tibetan Plateau. Aircraft are directly impacted by small-scale turbulence caused by large-amplitude mountain waves and the subsequent breaking of these waves over complex terrain (Jiang and Doyle, 2004; Doyle et al., 2005; Lane et al., 2009). However, upper-level jet streams and the associated frontogenesis are also responsible for generating aircraft turbulence. The Eurasian subtropical westerly jet stream lingers over the Tibetan plateau every February. A severe CAT occurred along the Lhasa-Chongqing route on 11 February 2023. Whether the CAT was caused by the upper-level jet stream perched over the Tibetan Plateau or by mountain waves caused by the large topography remains unknown. This is the focus of this study.
The paper is organized as follows: A brief review of data and method is presented in Section 2. Section 3 shows the analysis of synoptic-scale circulation pattern, model results and mechanisms of the CAT event. Finally, a summary and discussion are provided in Section 4.
2 Data and method
2.1 Data and model
The data used in this study include (1) Automatic Dependent Surveillance-Broadcast (ADS-B) data, which determines the three dimensional position and identification of aircraft, and then periodically transmits information available to other aircraft and ground stations. The information about position and velocity vectors of the aircraft are derived from the Global Positioning System (GPS) or other suitable Navigation System (Manesh and Kaabouch, 2017). (2) Pilot Reports (PIREPs) data sets. (3) hourly mean equivalent black–body temperature products (TBB) of Japan Himawari-8 satellite on 11 February 2023. The spatial resolution is 0.05°
The Weather Research and Forecasting (WRF) Model (version 4.2) is employed to investigate the possible mechanisms of the CAT event. The numerical model is configured with two-way nested domains centered on the turbulence region, using ERA5 data at 0.25°
2.2 CAT diagnostics
Following the previous studies (Sharman et al., 2006; Kim et al., 2018; Sharman et al., 2006; Kim et al., 2018; Lee et al., 2023), three representative diagnostics are calculated to characterize CAT. It has been discovered that the vertical wind shear (VWS) is a significant contributor to CAT. VWS is associated with changes in horizontal wind speed and/or direction with altitude. The calculation formula is as follows
where z is the vertical direction, u and v are the zonal and meridional wind components (unit: m/s).
The second turbulence diagnostics is the Richardson number (Ri). Both theory and observation have demonstrated that CAT are produced by K-H instabilities with small Ri in some situations (Endlich, 1964; Dutton and Panofsky, 1970). Ri is defined as
with
where
Thirdly, Ellrod index 1 (TI1) is a reliable diagnosis for CAT near the jet stream (Ellrod and Knapp, 1992). TI1 depends mainly upon the magnitudes of the total deformation (DEF) and VWS (Equation 1), which is related to the horizontal gradient of
with
where u and v are the horizontal wind components in the east–west (x) and north–south (y) directions, respectively.
3 Results
3.1 The phenomenon of this CAT event
According to PIREPs, Flight PN6392 from Lhasa to Chongqing encountered severe turbulence on 11 February 2023. The flight departed from Lhasa Gonggar International Airport (ZULS) at 0548UTC and arrived at Chongqing Jiangbei International Airport (ZUCK) at 0755 UTC. The turbulence occurred at approximately 0655UTC at a location (29.76°N, 99.62°E) with an altitude of 10,743 m (∼250 hPa). The severe turbulence lasted about 10 min. Using ADS-B data, the flight route is plotted. As shown in Figure 1A, the route traverses the Tibetan Plateau, which has an average elevation of 4,000 m, as well as the steep terrain of the eastern foothills of the plateau. This complex terrain not only increases the difficulty of flight piloting but also benefits the occurrence of turbulence. According to the infrared cloud imagery of brightness temperature from satellite observations (Figure 1B), although there are notable convective cloud clusters north of 30°N, there are no convective clouds in the area where the turbulence occurred, indicating that this incident is a CAT event (Kim and Chun, 2010; Lee et al., 2023).
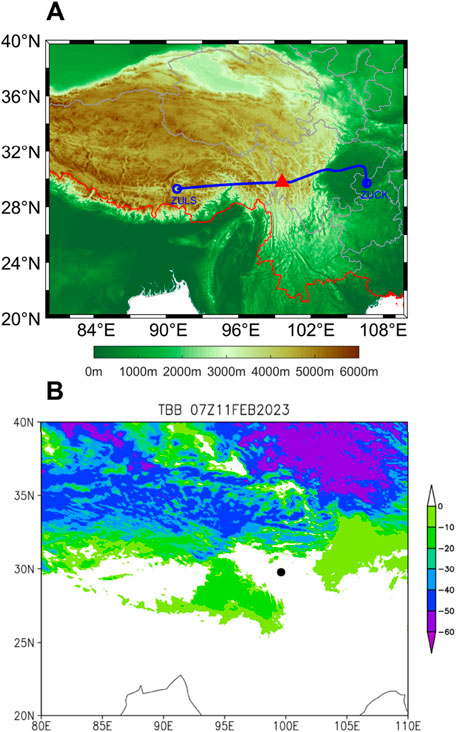
Figure 1. (A) The topographic map of Southwest China and the horizontal flight route of PN6392 (blue line) on 11 February 2023 from Lhasa Gonggar Airport (ZULS) to Chongqing Jiangbei Airport (ZUCK); (B) Infrared cloud imagery of brightness temperature (unit: K) from Himawari-8 satellite at 0700 UTC on 11 Feburary 2023 over Southeast China. The red triangle in (A) and the black dot in (B) shows the position (29.76°N, 99.62°E) where aviation turbulence mainly happened.
3.2 Analysis of synoptic-scale circulation pattern
Using ERA5 data, Figure 2 shows the synoptic-scale weather conditions around the flight route during the occurrence of the aircraft turbulence. It is found that the turbulence occurred near the upper-level jet stream core at the 250-hPa level. The jet stream flows from the west to the east over Southeast China with a maximum speed of 70 m/s (Figure 2A). There are densely packed isotherms on the upper-level jet stream’s northern edge. Additionally, there is an interlacing pattern in the contour lines and isotherms. However, the area where the turbulence occurred does not exhibit a significant intersection of isotherms and contour lines, suggesting that the inertial terms have little effect on the turbulence. In the mid-troposphere (at the 500-hPa level), Figure 2B shows a weak ridge over the central and eastern parts of China. To the west of the turbulence zone, there are cold centers with temperatures of −8°C and −14°C located in the 27°–31°N, 88°–93°E and 27°–32°N, 95°–98°E regions, respectively. Westerly winds transport the cold air from these regions towards the CAT area. The synoptic-scale flow pattern at the 700-hPa level (Figure 2C) is different from that at the 500-hPa level. There is a closed low-pressure center, known as the Southwest Vortex, located at the east of the plateau, accompanied by a cold center with a temperature of −8°C in the northeastern part of the plateau. In the southern part of the plateau, noticeable warm advection appears from the south to the north. Figure 2D depicts the spatial distributions of the surface wind field, temperature field, and relative humidity. Evidently, the most distinctive characteristic of the overall relative humidity distribution is that the humidity is higher on the eastern of the figure, while it is relatively lower in the western sides including Sichuan Basin area. The consistent southwesterly wind, crossing the isotherms, indicates a warm advection in the near surface layer. There is a low-value center located between 29° and 31°N and along 100°E, which is precisely the Southwest Vortex mentioned previously. Overall, the surface synoptic situation aligns well with that in the middle and lower troposphere at 700 hPa (Figure 2C). The existence of warm advection in the middle and lower troposphere facilitates the occurrence of convective instability.
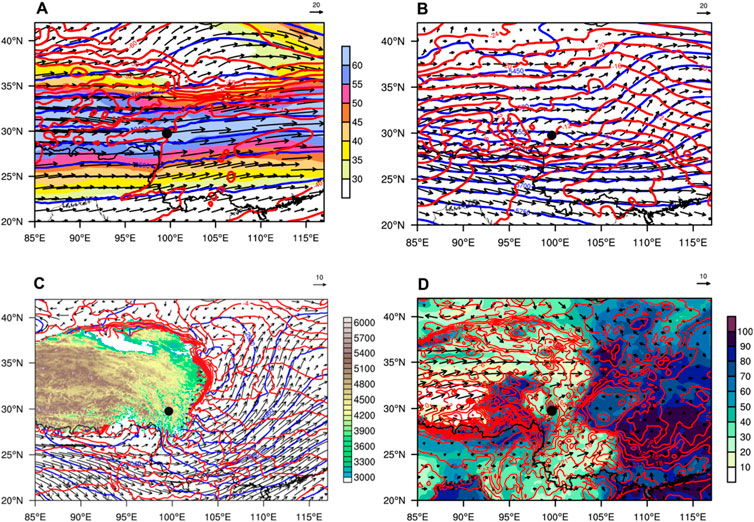
Figure 2. Geopotential height (blue line, unit: gpm), temperature (red line, unit: °C) and horizontal wind (black arrow, unit: m/s) at (A) 250 hPa; (B) 500 hPa and (C) 700 hPa. The shading in (A) and (C) shows the horizontal wind speed (unit: m/s) and elevation, respectively. (D) The surface wind (black arrow, unit: m/s), temperature (red line, unit: °C) and Relative humidity (unit: %). All the data is obtained from ERA5 at 0700 UTC on 11 February 2023 over Southeast China. The black dot (29.76°N, 99.62°E) shows the position where aviation turbulence mainly happened.
The T-logp diagram is shown at the position where aviation turbulence mainly happened (29.76°N, 99.62°E) at 0700 UTC on 11 February 2023 in Figure 3. At the 500-hPa level, the dew point and temperature curves are close, indicating high humidity in this layer. As the altitude increases, humidity decreases. The air is dry at approximately 350 hPa, which is conducive to the occurrence of clear skies at high altitudes. Although humidity increases slightly above 350 hPa, it still does not favor cloud formation. The enhanced stability in the mid-upper troposphere is associated with tropopause folding, that is, the process of tropopause deformation and stratospheric air being squeezed into the middle troposphere. The details of the tropopause folding will be shown in the following figures. Figure 3 also presents the vertical profile of wind. According to the principle of thermal wind, the wind rotates clockwise with increasing height from around 600 hPa to 400 hPa, indicating that there is warm advection in this layer. Nevertheless, the wind rotates counterclockwise with increasing height from 400 hPa to 175 hPa indistinctly, suggesting no obvious cold advection existing in this layer. This configuration warm advection at low atmospheric levels aligns with the circulation patterns shown in Figure 2.
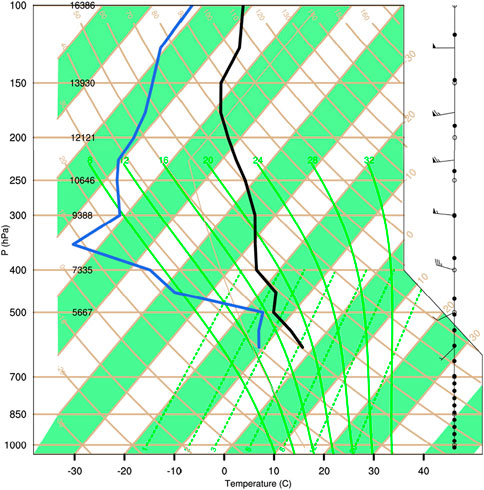
Figure 3. Skew T-logp diagram of temperature (black line, unit: °C), dewpoint temperature (blue line, unit: °C), and wind (unit: m/s) obtained from ERA5 data at the position where aviation turbulence mainly happened (29.76°N, 99.62°E) at 0700 UTC on 11 February 2023. Wind speeds at each level are shown by full (10 m/s) and half (5 m/s) barbs and a pennant (50 m/s).
From a turbulence forecasting perspective, the CAT diagnostics are of interest along with their thresholds for stability. Using ERA5 data, three representative diagnostics are employed to investigate the CAT activity. As shown in Figure 4A, the Richardson number (Ri, Equations 2, 3) in the turbulence region ranges between 0.6 and 2.0 value of Ri indicating occurrence of mild to moderate CAT (Table 1), meanwhile,A small Ri indicates significant vertical wind shear or relatively weak static stability, promoting the development of turbulence, which consequently leads to the occurrence of aircraft turbulence. The turbulence region is located near the upper-level jet axis, with wind speeds reaching 60–65 m/s. Lee et al. (1984) found that the value of VWS more than 9.7 × 10⁻³ s−1 indicating occurrence of mild to moderate CAT, while a high-value region of VWS with approximately 1 × 10⁻² s−1 in Figure 4B satisfying the conditions of mild to moderate CAT. Pronounced vertical wind shear tends to generate K-H waves. Under high wind speeds, K-H waves become shear-unstable, leading to waveform breakdown and the creation of multi-scale turbulent vortices. The energy transforms into turbulent energy. Therefore, K-H instability has long been recognized as an important source of CAT (Sharman et al., 2012). K-H instability results in local Ri reductions. Moreover, Figure 4C shows that TI1 (Equations 4, 5) with the value exceeding 1 × 10⁻⁶ s⁻1 also indicates the occurrence of light turbulence. Although all three indexes show lighter intensity of turbulence than that reported by PIREPs, the three diagnostics can reflect the occurrence of turbulence.

Figure 4. Geopotential height (black line, unit: gpm), temperature (red line, unit: °C), horizontal wind (black arrow, unit: m/s) and (A) the Richardson number (Ri, shading); (B) vertical wind shear index (VWS, shading, unit: 10−2 s−1) and (C) Ellrod 1 index (TI1, shading, unit: 10−6 s−2) at 250 hPa at 0700 UTC on 11 February 2023 obtained from ERA5 data. The black dot (29.76°N, 99.62°E) shows the position where aviation turbulence mainly happened.
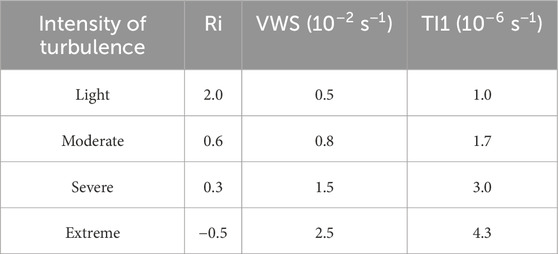
Table 1. Classification of CAT with three turbulence diagnostics (Source: ICAO, 2005; Sharman et al., 2006).
Previous studies claimed that turbulence near the upper-level jet streams is usually with tropopause folding (Kim and Chun, 2010). Additionally, the analysis of humidity profiles in the T-logp diagram above also mentioned tropopause folding. According to the statistical results, potential vorticity in the stratosphere is approximately an order of magnitude greater than that in the troposphere due to the differences in static stability (Lamarque and Hess, 1994; Griffiths et al., 2000). High potential vorticity value usually indicates stratospheric air. The height at which potential vorticity equals 1.5 or 2 PVU (1 PVU = 10−6 K∙m2∙kg−1∙s−1) represents the dynamical tropopause. Tropopause folding can be identified using the undulation of the potential vorticity isolines or potential vorticity anomalies. As the green solid line shown in Figure 5A, there is a steep 1.5 PVU line over the plateau and the tropopause is deeply folded down to a level of roughly 350 hPa. Moreover, strong wind shear tends to occur at the boundaries of high potential vorticity regions, leading to turbulence. As a result, the local Richardson number becomes small.
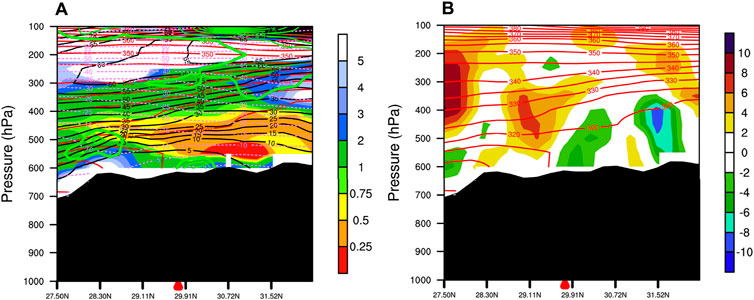
Figure 5. The latitude-height cross section along 99°E for (A) the Richardson number (shading), potential temperature (red line, unit: K), zonal wind (black line, unit: m/s), temperature (purple dotted line, unit: °C) and potential vorticity (green solid line, unit: PVU); (B) vertical velocity (shading, unit: 10−1 Pa/s) and potential temperature (red line, unit: K). The red triangle (29.76°N) shows the latitude where aviation turbulence mainly happened. The data is from ERA5 at 0700 UTC on 11 February 2023.
Another notable characteristic of this turbulence event is that it occurred over the complex terrain of Qinghai-Tibet. Breaking mountain wave generated by stratified airflow passing over topography is a source of CAT (Lane et al., 2009). Figure 5B shows the latitude-height cross section along 99°E of vertical velocity and potential temperature. The vertical velocity exhibits a “+-+-” pattern. The potential temperature increases with height, showing that the atmosphere is in a relatively stable stratification. This stable stratification is a crucial condition for the generation of gravity waves. However, whether the gravity waves generated by the plateau terrain are the primary cause of this clear-air turbulence event requires further verification.
3.3 Generation mechanisms of the CAT event
In order to better understand the possible mechanisms of the CAT event on 11 February 2023, numerical simulations of this event are conducted using the mesoscale WRF (V4.2) model. The model configuration is shown in Figure 6. There are two-way nested domains. Apart from the control experiment, additional terrain sensitivity experiments are designed to investigate the impact of the topography of Tibetan Plateau on the turbulence process (Table 2). The topographic height of the Tibetan Plateau is reduced to 1,500 m and 500 m in the two sensitivity experiments, respectively.
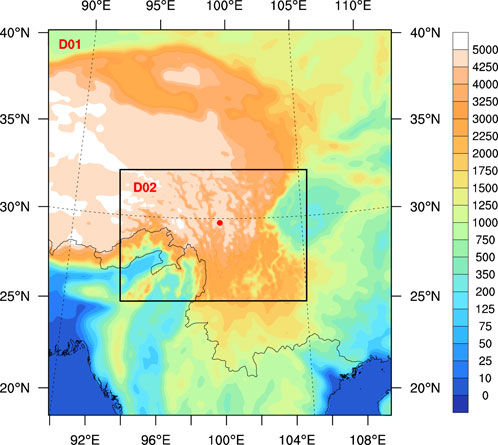
Figure 6. Configuration of the WRF model with two-way nested domains. The shading shows the elevation (unit: m). The red dot shows the position where the aviation turbulence event mainly happened.

Table 2. Design of the model experiments.
The observed radiosonde data at Changdu Staion (31.15°N, 97.1667°E) and Xichang Station (27.9°N, 102.2667°E) are selected to check the effect of WRF simulation at 1200 UTC on 11 February 2023. The simulated vertical profile by WRF can well matched the observation (Supplementary Figure S1). Even though these two stations are the closest radiosonde stations to the airplane bumps, they are quite far away from the turbulence point (29.76°N, 99.62°E), and the time (1200 UTC) is 5 hours later than the turbulence occurrence time (0700 UTC). So it is difficult to reflect the atmospheric condition when the turbulence occurs. As a result, we use reanalysis data to analyze atmospheric stratification at that time. In fact, there are many studies that use reanalysis data for observational research (Trier and Sharman, 2009; Wang et al., 2009; Hu et al., 2023). The vertical profile of temperature, dewpoint temperature, and wind obtained from the control experiment and ERA5 data are basically consistent (Figures 7A, B). In the control simulation, the maximum humidity appears slightly higher (at about 450 hPa level) than that in the atmospheric reanalysis data ERA5. As the altitude increases, humidity decreases, with the minimum humidity appearing at 350 hPa. Humidity then increases with height above 350 hPa. The simulated trend of humidity variation with height is consistent with the result derived from ERA5 data. Comparing the control experiment with the two terrain sensitivity experiments (Figures 7C, D), it is found that the skew T–logp diagrams of temperature, dewpoint temperature, and wind are similar, indicating that the topography mainly affects the temperature and wind field in the lower to mid troposphere. The maximum humidity is located near 750 hPa in the terrain-1,500 m experiment, while the maximum humidity appears below 850 hPa in the terrain-500 m experiment.

Figure 7. The same as Figure 3 but for (A) ERA5 reanalysis data; (B) control experiment; (C) terrain-1,500 m experiment and (D) terrain-500 m experiment at 0700 UTC on 11 February 2023. The experiments in (B–D) are simulated by the WRF model.
For further investigation of the WRF model simulations, CAT diagnostics are calculated in the control experiment and compared with the values derived from the ERA5. As shown in Figure 8G, although TI1 calculated from the simulation is slightly smaller, it still falls within the turbulence threshold range (Table 1). The Ri and VWS values in Figures 8A, D are similar to those obtained using ERA5 (Figures 4A, B), indicating that the WRF model can effectively reproduce the clear-air turbulence process. Comparing the control experiment with the two terrain sensitivity experiments (Figures 7C, D) (terrain-1,500 m and terrain-500 m experiments), it is found that changing the terrain height does not significantly alter the Ri (Figures 8B, C). The VWS in the terrain-500 m and terrain-1,500 m experiments (Figures 8E, F) is almost the same as that in the control run. The Ri, VWS, and TI1 all show light to moderate turbulence near the position of airplane bumps in terrain-1,500 m and terrain-500 m experiments. Though the TI1 in both terrain experiments is slightly smaller than that in the control experiment (Figures 8H, I), it still represents the turbulence process, suggesting that the large terrain of the Tibetan Plateau has little impact on this turbulence event.
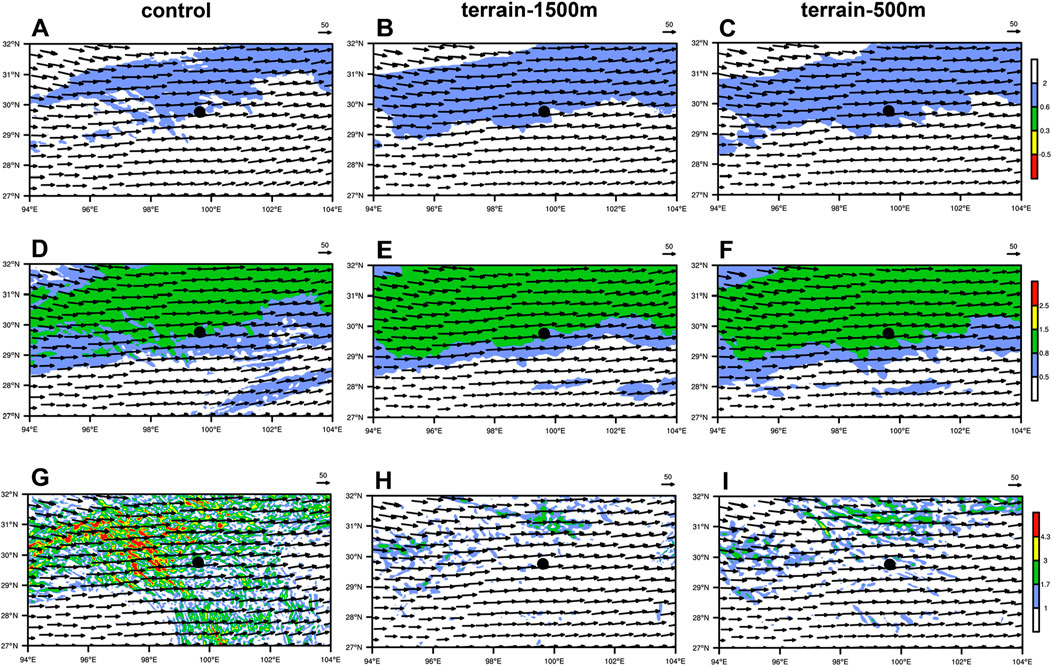
Figure 8. Ri (shading) and horizontal wind (black arrow, unit: m/s) at 250 hPa of (A) control experiment, (B) terrain-1,500 m experiment and (C) terrain-500 m experiment at 0700 UTC on 11 February 2023. (D–F) are the same as (A–C) but for VWS (shading, unit: 10–2 s−1). (G–I) are same as (A–C) but for TI1 (shading, unit: 10–6 s−1). The black dot (29.76°N, 99.62°E) shows the position where aviation turbulence mainly happened.
Considering that the calculated Ri at 250 hPa in the model simulation is consistent with the ERA5 calculations, the distribution of the Richardson number with height is further analyzed in the WRF control experiment and terrain sensitivity experiments. The vertical distribution of Ri calculated from the control experiment aligns closely with that from ERA5 above 400 hPa. Due to the high spatial resolution of the WRF model, the vertical distribution of Ri in the mid-to-lower troposphere reveals more detailed features. However, the range of Ri, especially below the main turbulence occurrence area, shows similarity between the WRF simulations and ERA5 calculations, indicating that the WRF model can accurately simulate the atmospheric turbulence characteristics. Through comparison between the control experiment and the terrain sensitivity experiments, it is found that the large terrain of the Tibetan Plateau has little impact on the atmospheric turbulence above 350 hPa. However, the topography has a significant influence on the atmospheric turbulence near the surface and in the mid-to-lower troposphere. In the control experiment (Figure 9A), the Ri near the plateau surface is less than 0.5, indicating strong turbulence between 500 and 600 hPa. The Ri between 400 and 500 hPa is still relatively low, ranging from 0.5 to 0.75 below the main turbulence area. In both the terrain-1,500 m and terrain-500 m experiments, the lowest Ri also appears near the surface subject to surface friction (Figures 9B, C). The Ri between 400 and 500 hPa in the two terrain experiments is similar to that in the control experiment but shows slight differences in spatial distribution, with stronger turbulence areas mainly located to the north and south of the turbulence occurrence area. This elucidates that the topography has an important influence on the atmospheric turbulence near the surface and in the lower-middle troposphere. The influence of the topography diminishes with height.
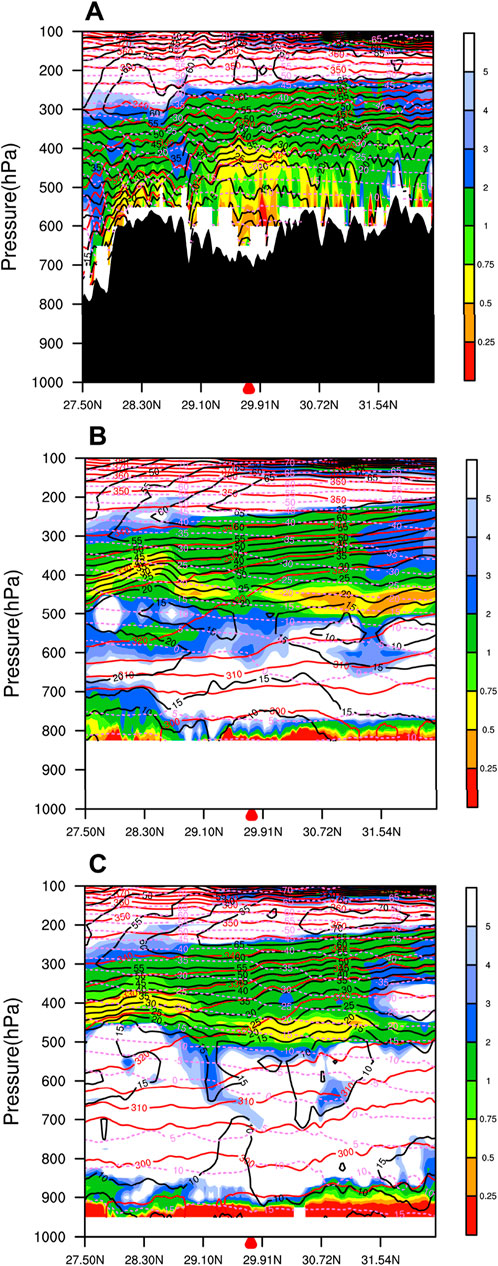
Figure 9. The latitude-height cross section along 99°E for the Richardson number (shading), zonal wind (black solid line, unit: m/s) and temperature (purple dashed line, unit: °C) of (A) control experiment; (B) terrain-1,500 m experiment and (C) terrain-500 m experiment at 0700 UTC on 11 February 2023. The red triangle (29.76°N) shows the latitude where aviation turbulence mainly happened.
The WRF model can accurately simulate the vertical motion caused by terrain, showing the pattern of vertical velocity in agreement with that in the atmospheric reanalysis data ERA5. Owing to the high resolution of model, the simulated vertical velocity values (Figure 10A) are larger than the reanalysis results. When the terrain height is reduced, the vertical motion weakens, especially near the surface (Figures 10B, C). The vertical motion mainly occurs above 400 hPa, with the maximum vertical velocity located around 250 hPa in the terrain-1,500 m experiment. Compared to terrain-1,500 m experiment, the vertical motion is significant between 800 and 500 hPa in terrain-500 m experiment with the terrain height being furtherly reduced. However, the vertical velocity above 400 hPa is similar in the north of the turbulence region in both the 500 m and 1,500 m terrain experiments. This phenomenon indicates that terrain significantly affects vertical velocity, but this influence decreases with height. The conclusion also confirms that the clear-air turbulence was not mainly caused by terrain but related to the significant vertical wind shear of the upper-level jet stream and tropopause folding. This result is consistent with the findings that CAT often occurs in the tropopause folding region (Reid and Vaughan, 2004; Kim and Chun, 2010; Luce et al., 2012).
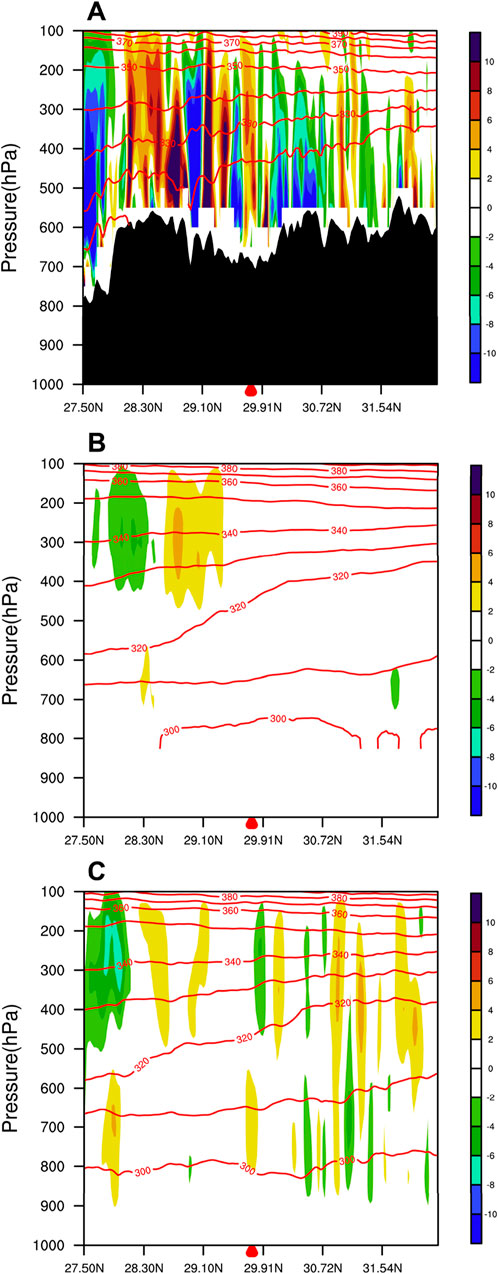
Figure 10. The latitude-height cross section along 99°E for the vertical velocity (shading, unit: Pa/s) and potential temperature (red contour, unit: K) at 0700 UTC on 11 February 2023. (A) control experiment; (B) terrain-1,500 m experiment and (C) terrain-500 m experiment. The red triangle (29.76°N) shows the latitude where aviation turbulence mainly happened.
4 Conclusion and discussion
A severe CAT event occurred over the Tibet Plateau during the flight departing from Lhasa to Chongqing on 11 February 2023. Using reanalysis data ERA5 and WRF model, the characteristics and possible generation mechanisms of this event are investigated.
From the perspective of large-scale circulation patterns, there is warm advection in the lower troposphere. This warm advection at lower atmospheric levels benefits convectional instability, promoting the development of atmospheric turbulence. The aircraft turbulence primarily occurred near the upper-level jet stream core. High wind speeds and significant vertical wind shear can easily lead to a decrease in Ri, furtherly causing K-H instability. K-H instability contributes to the occurrence of CAT.
Whether it is diagnostic analysis or model simulation, the intensity of turbulence reflected by the three indexes is smaller than that reported by PIREPs. The WRF model can simulate this CAT event well to some extent. Orographic sensitive experiments reveal that the terrain of the plateau is not the primary cause of this clear-air turbulence. Therefore, K-H instability related to tropopause folding is the main mechanism causing this aircraft turbulence. Understanding the causes of the CAT events is important but is a challenge. Previous studies suggested that the frequency and severity of turbulence on the Chengdu-Lhasa route are closely related to the large topography of the Qinghai-Tibet Plateau (Xu et al., 2007; Li et al., 2011). This random case study demonstrates that CAT over the plateau should not be ignored. Furthermore, the conclusion drawn in this study may be subject to the single case study and model limitations. Studies using more cases under various weather conditions and different models would be helpful for determining the robustness of this work.
Data availability statement
The original contributions presented in the study are included in the article/Supplementary Material, further inquiries can be directed to the corresponding author.
Author contributions
HL: Methodology, Writing–review and editing. ZD: Data curation, Software, Writing–review and editing. KuW: Writing–original draft, Writing–review and editing. KaW: Investigation, Software, Visualization, Writing–review and editing. KZ: Investigation, Software, Visualization, Writing–review and editing. MC: Validation, Writing–review and editing. WZ: Conceptualization, Writing–review and editing.
Funding
The author(s) declare that financial support was received for the research, authorship, and/or publication of this article. This research was funded by Key project of Civil Aviation Joint Research Fund of National Natural Science Foundation (U2033207), the National Natural Science Foundation of China (NSFC) (42405166, 52102419 and 41906009).
Conflict of interest
The authors declare that the research was conducted in the absence of any commercial or financial relationships that could be construed as a potential conflict of interest.
Generative AI statement
The author(s) declare that no Generative AI was used in the creation of this manuscript.
Publisher’s note
All claims expressed in this article are solely those of the authors and do not necessarily represent those of their affiliated organizations, or those of the publisher, the editors and the reviewers. Any product that may be evaluated in this article, or claim that may be made by its manufacturer, is not guaranteed or endorsed by the publisher.
Supplementary material
The Supplementary Material for this article can be found online at: https://www.frontiersin.org/articles/10.3389/feart.2025.1529934/full#supplementary-material
References
Atrill, J., Sushama, L., and Teufel, B. (2021). Clear-air turbulence in a changing climate and its impact on polar aviation. Saf. Extreme Environ. 3, 103–124. doi:10.1007/s42797-021-00036-y
Bessho, K., Date, K., Hayashi, M., Ikeda, A., Imai, T., Inoue, H., et al. (2016). An introduction to Himawari-8/9—Japan’s new-generation geostationary meteorological satellites. J. Meteorological Soc. Jpn. Ser. II 94, 151–183. doi:10.2151/jmsj.2016-009
Doyle, J. D., Shapiro, M. A., Jiang, Q., and Bartels, D. L. (2005). Large-amplitude mountain wave breaking over Greenland. J. Atmos. Sci. 62, 3106–3126. doi:10.1175/JAS3528.1
Dudhia, J. (1989). Numerical study of convection observed during the winter monsoon experiment using a mesoscale two-dimensional model. J. Atmos. Sci. 46, 3077–3107. doi:10.1175/1520-0469(1989)046<3077:nsocod>2.0.co;2
Dutton, J. A., and Panofsky, H. A. (1970). Clear Air Turbulence: a Mystery May Be Unfolding: high altitude turbulence poses serious problems for aviation and atmospheric science. Science 167, 937–944. doi:10.1126/science.167.3920.937
Ellrod, G. P., and Knapp, D. I. (1992). An objective clear-air turbulence forecasting technique: verification and operational use. Weather Forecast. 7, 150–165. doi:10.1175/1520-0434(1992)007<0150:aocatf>2.0.co;2
Endlich, R. M. (1964). The mesoscale structure of some regions of clear-air turbulence. J. Appl. Meteorology Climatol. 3, 261–276. doi:10.1175/1520-0450(1964)003<0261:tmsosr>2.0.co;2
Gilliam, R. C., and Pleim, J. E. (2010). Performance assessment of new land surface and planetary boundary layer physics in the WRF-ARW. J. Appl. Meteorology Climatol. 49, 760–774. doi:10.1175/2009JAMC2126.1
Griffiths, M., Thorpe, A. J., and Browning, K. A. (2000). Convective destabilization by a tropopause fold diagnosed using potential-vorticity inversion. Q. J. R. Meteorological Soc. 126, 125–144. doi:10.1002/qj.49712656207
Hu, B., Tang, J., Ding, J., and Liu, G. (2021). Regional downscaled future change of clear-air turbulence over East Asia under RCP8.5 scenario within the CORDEX-EA-II project. Int. J. Climatol. 41, 5022–5035. doi:10.1002/joc.7114
Hu, B. Y., Hui, P. H., Ding, J. F., and Tang, J. P. (2023). Clear-air turbulence (CAT) encounters on 13 november 2019 over central and eastern China: numerical simulation and generation mechanism. Weather Forecast. 38, 1643–1660. doi:10.1175/WAF-D-23-0015.1
Iacono, M. J., Delamere, J. S., Mlawer, E. J., Shephard, M. W., Clough, S. A., and Collins, W. D. (2008). Radiative forcing by long-lived greenhouse gases: calculations with the AER radiative transfer models. J. Geophys. Res. Atmos. 113. doi:10.1029/2008jd009944
ICAO (2005). Manual on low-level wind shear. 1st Edn. Montreal, Canada: International civil aviation organization. Available at: https://www.skybrary.aero/bookshelf/books/2194.pdf. (Accessed February 14, 2025).
Jiang, Q., and Doyle, J. D. (2004). Gravity wave breaking over the central Alps: role of complex terrain. J. Atmos. Sci. 61, 2249–2266. doi:10.1175/1520-0469(2004)061<2249:gwbotc>2.0.co;2
Kim, J.-H., and Chun, H.-Y. (2010). A numerical study of clear-air turbulence (CAT) encounters over South Korea on 2 April 2007. J. Appl. Meteorology Climatol. 49, 2381–2403. doi:10.1175/2010JAMC2449.1
Kim, J.-H., Sharman, R., Strahan, M., Scheck, J. W., Bartholomew, C., Cheung, J. C., et al. (2018). Improvements in nonconvective aviation turbulence prediction for the world area forecast system. Bull. Am. Meteorological Soc. 99, 2295–2311. doi:10.1175/BAMS-D-17-0117.1
Lamarque, J.-F., and Hess, P. G. (1994). Cross-tropopause mass exchange and potential vorticity budget in a simulated tropopause folding. J. Atmos. Sci. 51, 2246–2269. doi:10.1175/1520-0469(1994)051<2246:ctmeap>2.0.co;2
Lane, T. P., Doyle, J. D., Sharman, R. D., Shapiro, M. A., and Watson, C. D. (2009). Statistics and dynamics of aircraft encounters of turbulence over Greenland. Mon. weather Rev. 137, 2687–2702. doi:10.1175/2009MWR2878.1
Lee, D. R., Stull, R. S., and Irvine, W. S. (1984). Clear air turbulence forecasting techniques. Air weather service (MAC), Air force global weather central. Technical Note AFGWC/TN-79/001 (REV). Available at: https://apps.dtic.mil/sti/pdfs/ADA083099.pdf. (Accessed February 14, 2025).
Lee, J. H., Kim, J. H., Sharman, R. D., Kim, J., and Son, S. W. (2023). Climatology of clear-air turbulence in upper troposphere and lower stratosphere in the Northern Hemisphere using ERA5 reanalysis data. J. Geophys. Res. Atmos. 128, e2022JD037679. doi:10.1029/2022JD037679
Li, Y. H., Yang, J., XV, H., and Meng, Q. L. (2011). Numerical simulation and analysis of a process of turbulence on lasa airway. Plateau Mt. Meteorology Res. 31, 56–60.
Liu, H., You, J., Wu, K., Sun, Y., and Liu, G. (2023). Advance on clear-air turbulence of civil aviation aircraft. J. Civ. Aviat. Univ. China 41, 1–8. [in Chinese].
Luce, H., Nishi, N., Caccia, J.-L., Fukao, S., Yamamoto, M. K., Mega, T., et al. (2012). Kelvin-Helmholtz billows generated at a cirrus cloud base within a tropopause fold/upper-level frontal system. Geophys. Res. Lett. 39. doi:10.1029/2011gl050120
Manesh, M. R., and Kaabouch, N. (2017). Analysis of vulnerabilities, attacks, countermeasures and overall risk of the Automatic Dependent Surveillance-Broadcast (ADS-B) system. Int. J. Crit. infrastructure Prot. 19, 16–31. doi:10.1016/j.ijcip.2017.10.002
Morrison, H., Thompson, G., and Tatarskii, V. (2009). Impact of cloud microphysics on the development of trailing stratiform precipitation in a simulated squall line: comparison of one-and two-moment schemes. Mon. weather Rev. 137, 991–1007. doi:10.1175/2008MWR2556.1
Pleim, J. E. (2007). A combined local and nonlocal closure model for the atmospheric boundary layer. Part I: model description and testing. J. Appl. Meteorology Climatol. 46, 1383–1395. doi:10.1175/JAM2539.1
Reid, H. J., and Vaughan, G. (2004). Convective mixing in a tropopause fold. Q. J. R. Meteorological Soc. 130, 1195–1212. doi:10.1256/qj.03.21
Sharman, R., Tebaldi, C., Wiener, G., and Wolff, J. (2006). An integrated approach to mid-and upper-level turbulence forecasting. Weather Forecast. 21, 268–287. doi:10.1175/WAF924.1
Sharman, R., Trier, S., Lane, T., and Doyle, J. (2012). Sources and dynamics of turbulence in the upper troposphere and lower stratosphere: a review. Geophys. Res. Lett. 39. doi:10.1029/2012gl051996
Sharman, R. D., and Pearson, J. M. (2017). Prediction of energy dissipation rates for aviation turbulence. Part I: forecasting nonconvective turbulence. J. Appl. Meteorology Climatol. 56, 317–337. doi:10.1175/JAMC-D-16-0205.1
Trier, S., and Sharman, R. D. (2009). Convection-permitting simulations of the environment supporting widespread turbulence within the upper-level outflow of a mesoscale convective system. Mon. Weather Rev. 137, 1972–1990. doi:10.1175/2008MWR2770.1
Wang, Y., Wang, Y., and Fudeyasu, H. (2009). The role of typhoonSongda (2004) in producing distantly located heavy rainfallin Japan. Mon. Weather Rev. 137, 3699–3716. doi:10.1175/2009MWR2933.1
Williams, P. D. (2017). Increased light, moderate, and severe clear-air turbulence in response to climate change. Adv. Atmos. Sci. 34, 576–586. doi:10.1007/s00376-017-6268-2
Williams, P. D., and Joshi, M. M. (2013). Intensification of winter transatlantic aviation turbulence in response to climate change. Nat. Clim. Change 3, 644–648. doi:10.1038/nclimate1866
Keywords: clear-air turbulence, jet stream, wind shear, tropopause folding, topography
Citation: Liu H, Dai Z, Wang K, Wu K, Zhou K, Chen M and Zhang W (2025) Numerical case study of a clear-air turbulence event over the Tibetan Plateau. Front. Earth Sci. 13:1529934. doi: 10.3389/feart.2025.1529934
Received: 18 November 2024; Accepted: 06 February 2025;
Published: 24 February 2025.
Edited by:
Jane Liu, University of Toronto, CanadaReviewed by:
Lei Shu, Fujian Normal University, ChinaJun Hu, Fujian Academy of Environmental Sciences, China
Copyright © 2025 Liu, Dai, Wang, Wu, Zhou, Chen and Zhang. This is an open-access article distributed under the terms of the Creative Commons Attribution License (CC BY). The use, distribution or reproduction in other forums is permitted, provided the original author(s) and the copyright owner(s) are credited and that the original publication in this journal is cited, in accordance with accepted academic practice. No use, distribution or reproduction is permitted which does not comply with these terms.
*Correspondence: Kun Wang, d2FuZ19rQGNhdWMuZWR1LmNu