 Wei Du1
 Yafei Ma
- 1Shanxi Xiaobaodang Mining Co.,Ltd., Yulin, Shaanxi, China
- 2Shanxi Coalbed Methane Development Co.,Ltd., Xianyang, Shaanxi, China
- 3College of Urban Geology and Engineering, Hebei GEO University Shijiazhuang, Shijiazhuang, Hebei, China
- 4Hebei Civil Engineering Co., Ltd., Shijiazhuang, Hebei, China
Based on the measured subsidence data of the 112,201 working face in Xiaobaodang Coal Mine of Shaanxi Province, the traditional probability integral method and probability density function method are used to study the curve fitting of the main inclined section under insufficient mining conditions. The analysis results show that the fitting effect of the probability density function method is better than that of the probability integral method. In view of the poor effect of edge fitting, the idea of sub-region fitting is proposed. Two sets of predicted parameters are used to fit the edge and central regions. The fitting results are close to the surface deformation, and the fitting effect is better. The method can improve the accuracy of surface deformation prediction. The research results can provide a reference for the prediction of surface subsidence in Xiaobaodang Coal Mine and its surrounding mining areas.
1 Introduction
After mining an underground coal seam, the original stress equilibrium of the surrounding rock mass is disrupted, leading to stress redistribution until a new equilibrium is reached. During this process, the rock strata and ground surface undergo continuous movement, deformation, and discontinuous damage, a phenomenon known as mining subsidence. Mining subsidence is a significant geological hazard in mining areas. Currently, the probabilistic integration method (PIM), developed by Liu Baochen and Dai Huayang based on the random media theory (Liu and Dai, 2016). is the dominant approach for predicting coal mining subsidence. The PIM calculates subsidence via error functions and exhibits high practicality due to its simple parameterization. However, under insufficient mining conditions—where the mining range does not reach the critical threshold for full subsidence development—its limitations become evident, necessitating further improvements. Such as Cai et al. (2023), provide a comprehensive analysis of monitoring and calculation methods, emphasizing the method’s foundation in random media theory and its limitations under varying geological conditions. The probabilistic integration method has certain limitations, including its inability to accurately represent rock mass movement and deformation within the strata (Chen et al., 2021), rapid edge convergence, and insufficient explanation of the underlying mechanical mechanisms. Among the many models, the probability density function method proposed by Guo Zengzhang has achieved good fitting effects (Guo et al., 2004). Yan et al. (2019) studied the problem of ground subsidence caused by coal mining and proposed a new prediction model based on the log-normal distribution function. Zhang et al. (2020) proposed an improved Knothe time function model for predicting dynamic ground subsidence caused by underground mining. Wang and Yang (2021) investigated the relationship between the parameters of the Gompertz time function and geological mining conditions, and proposed a calculation method and prediction algorithm for practical application. Hu et al. (2023) combined InSAR technology, the probabilistic integration method, and the genetic algorithm to propose an improved method for dynamically predicting the probabilistic integration parameters for achieving subsidence inversion and prediction under insufficient mining conditions. Zi-Tong et al. (2024) proposed a system framework (BASIC-H) based on Bayesian inference and Copula theory, for modeling and constructing the probability density function (PDF) and credible region (CR) of multivariate, asymmetric, and multimodal distributions of geological technical data. Shi et al. (2021) integrated SBAS-InSAR with the probability integral method (PIM) to improve subsidence prediction accuracy. Wang et al. (2024) proposed an improved dynamic PIM combined with InSAR, effectively reducing edge effects in subsidence predictions. Li et al. (2022) introduced a strip-unit mining model based on the PIM to achieve accurate 3D dynamic subsidence predictions. Chi et al. (2023) developed a hybrid machine-learning model that improved the accuracy of predicting PIM parameters. Guo et al. (2022) introduced an improved fireworks algorithm to enhance the reliability of PIM parameter inversion. Lou, (2024) applied robust ridge regression to achieve more stable and accurate PIM parameter estimation, overcoming issues related to outliers and ill-conditioned matrices. These advancements demonstrate the international relevance and continuous improvement in subsidence prediction methodologies. Tao et al. (2023), in response to the actual range of surface impact from coal seam mining in thick loose layer mining areas significantly exceeding theoretical predictions, proposed a new segmented correction model of the probabilistic integration method. Zhang et al. (2024) studied the surface subsidence prediction of the Gengquan coal mine based on the probabilistic integration method and the FLAC3D numerical simulation method. Xuemin et al. (2021) proposed a new dynamic prediction integrated model (DPIM), based on the integration of the probabilistic integration method (PIM) and the Weibull time function, for predicting future dynamic subsidence during periods not covered by SAR data acquisition. Bing et al. (2021) applied the probability density function method to predict surface subsidence and rock layer conditions in a mining subsidence area. Many scholars have modified and improved the model, achieving certain results (Luo et al., 2024; Huo et al., 2023; Yuan et al., 2020; Li et al., 2020; Zhao et al., 2022; Wei et al., 2023), with specific adaptations for conditions such as reverse faulting (Luo et al., 2024) and backfill mining (Huo et al., 2023), addressing issues such as rapid convergence at the edges. Ground settlement is a common geological hazard associated with underground engineering activities such as mining and tunneling. For instance, Ahmadi et al. (2023) investigated the impact of tunneling on bridge foundations in urban areas, highlighting that excavation-induced ground settlement significantly affects adjacent structures. Similarly, mining activities, particularly under-extraction, can also lead to ground settlement, posing risks to surface structures and ecosystems.
At present, one of the widely adopted methods is to conduct subsidence observation through surface observation stations, and to predict the subsidence of other areas by using the actual measurement data to invert for prediction parameters (Guo et al., 2004). This requires the selected model to have a good fit, so it is of great significance to study the fitting accuracy of the subsidence function curve.
This study utilizes actual subsidence measurements to evaluate the curve-fitting performance of the traditional probabilistic integration method and the probability density function method for the main inclined cross-section under insufficient mining conditions. Under insufficient mining conditions, there is a significant discrepancy between the predicted results and the actual situation (Zhao et al., 2022; Wei et al., 2023; Jiang et al., 2024), prompting studies like Yuan et al. (2020) to focus on parameter reliability.
These recent advancements, including modifications for thick loose layers (Li et al., 2020; Zhao et al., 2022) and loess dongas (Wei et al., 2023), underscore the ongoing efforts to refine subsidence prediction models for complex mining scenarios.
In this study, multiple approaches were explored to optimize data fitting. Initially, cumulative distribution function (CDF) and probability density function (PDF) methods were employed to model the marginal distribution of the data. However, these standard techniques failed to capture key data characteristics. However, these standard techniques did not adequately capture the characteristics of the data. To address this issue, we introduced a piecewise fitting strategy, which involved modeling different segments of the data separately. This approach significantly improved the flexibility and accuracy of the fit. Subsequently, we validated our findings through numerical simulations, confirming that the developed model effectively reflects the overall trend of the data.
2 Non-sufficient mining surface movement model
2.1 Probabilistic integration method
Liu Baochen and Dai Huayang developed the probabilistic integration prediction method, deriving a simplified solution based on random media theory and formulating a comprehensive, applicable approach (Liu and Dai, 2016).
(1) The semi-infinite mining prediction formula is as follows:
The insufficient settlement function is given in Equation 1, where the error function (erf) describes the integral results of the probability distribution, reflecting the cumulative effects of random medium movement.
By differentiating Equation 1, the formula for calculating surface inclination (slope) is obtained, as shown in Equation 2.
Further differentiation of Equation 2 yields the formula for calculating subsidence curvature along the main section, as shown in Equation 3.
By differentiating Equation 3, the formula for calculating horizontal deformation along the main section is obtained, as shown in Equation 4.
By taking the derivative of Equation 4, the formula for calculating the horizontal deformation along the main section can be obtained, as shown in Equation 5.
Where, w0−Maximum surface subsidence, mm; r−Influence radius, m; x−Horizontal position of any point; b−Horizontal movement coefficient.
(2) Prediction of Surface Movement and Deformation on the Main Inclined Cross-Section
When the coal seam is fully mined along the strike direction (parallel to the coal seam extension) with a sufficiently large mining range and complete surface subsidence, but mining in the dip direction (perpendicular to the strike) remains limited, the subsidence basin becomes asymmetric. To account for this asymmetry, the probabilistic integration method must be modified by introducing the main influence radii (r1 and r2) in the lower and upper mountain directions. These parameters correspond to the influence range beneath the coal seam (lower mountain) and above the coal seam (upper mountain), respectively.
The modified prediction formulas for the dip-direction main cross-section are presented in Equations 6–10:
In the formula, t1 and t2 represent parameters for the lower and upper mountain boundaries, respectively. The main influence radii of the equivalent horizontal coal seam in these two directions are no longer identical. The radii r1 and r2, can be determined using Equation 11:
Here, tanβ1 and tanβ2 represent the tangents of the main influence angles for the lower and upper mountain regions, respectively. The inclined working face length L is calculated using Equation 12:
where D1 is the working face length, θ0 is the mining influence propagation angle, and α is the coal seam inclination angle.
The above formula applies to limited mining and does not differentiate between sufficient and insufficient mining conditions. Typically, insufficient mining values are obtained by multiplying the sufficient mining values by a mining coefficient C, as expressed in Equation 13:
In the probabilistic integration method, subsidence basin parameters are typically solved using mathematical techniques, with curve fitting based on actual measurement data being the most common approach. The mathematical solution process involves identifying a smooth curve that minimizes the sum of squared errors of discrete data points. The predicted parameters include the subsidence coefficient
The primary challenges in parameter estimation are as follows:
(1) High correlation between parameters: When multiple parameters exhibit strong correlation, they become indistinguishable during curve fitting. For instance, the mining coefficient C and the subsidence coefficient q are difficult to separate. In the formula Cw0/2, the expression transforms into Cmqcosα/2, meaning that during fitting, it effectively scales mmm by a factor of C and q, making it difficult to distinguish between C and q.
(2) Poor fitting at basin edges: Ensuring accurate fitting across both the interior and edge regions of the subsidence basin is challenging. While the central part of the basin can typically be well-fitted, the edge regions often exhibit rapid convergence, leading to poor fitting performance (Han, 2021).
2.2 Probability density function method
The probability density function (PDF) method postulates that under conditions of insufficient mining, the displacement probability of discrete medium fragments gradually converges to the probability density function of a normal distribution (Guo et al., 2004). Assuming that the movement of fractured rock mass units follows a normal distribution, the subsidence model can be directly constructed using the probability density function, effectively mitigating strong correlations between parameters. The specific subsidence formula based on the probability density function method is presented in Equation 14:
Equations 15–18 provide the calculation formulas for surface inclination, curvature, horizontal displacement, and horizontal deformation under the probability density function (PDF) method. These equations follow a similar structure to Equations 2–5.
In the formula:
Compared to the probabilistic integration method, the PDF method directly uses the subsidence rate to predict maximum subsidence under insufficient mining conditions. This approach eliminates the need for two additional parameters—the mining coefficient and the subsidence coefficient—simplifying the prediction process.
3 Working face and surface movement conditions
3.1 Overview of the working face
The Xiao Ba Dang coal mine, operated by Xiao Ba Dang Mining Co., Ltd., is located in southwest Shenmu County, Yulin City, Shaanxi Province, and northeast Yuyang District. The first mining working face, 112,201, employs the large mining height longwall top coal caving method for roof management. After mining, the roof collapses and fractures, forming an “internal three zones” within the rock strata.
The 112,201 working face has a strike length of 4,660 m and a dip length of 350 m. The coal seam thickness ranges from 5.5 to 6.0 m, with an average of 5.8 m, and an inclination angle averaging 0.5°.
3.2 Overview of the observation station
The surface topography of the 112,201 working face is relatively simple, with no buildings, railways, pipelines, or other obstructions. Consequently, the observation station in this study adopts a linear layout consisting of a strike observation line and a dip observation line, both perpendicular at the center of the subsidence basin.
Design of the strike observation line:
Given the thick surface loose layer of the 112,201 working face, the strike observation line is designed to cover half of the subsidence basin. Based on surface movement observations from the 20,102 working face of the Yushuwan coal mine, the strike line length is set at 900 m, with 300 m extending beyond the mining boundary of the cut eye and 600 m within it.
At one end of the strike line, three control points are placed outside the cut eye, spaced 100 m apart. Considering the average mining depth of 302 m, the point spacing is 25 m, resulting in a total of 37 monitoring points along the strike line. The monitoring point numbering follows a sequential pattern: Control points are labeled KZ01, KZ02, KZ03. Monitoring points are identified using a character and two Arabic numerals (e.g., Z01, Z02, …). “K” denotes a control point. “Z” denotes the strike observation line. The following numbers represent the sequential measuring points.
Design of the dip observation line:
To ensure complete subsidence basin coverage, the dip observation line length is set at 1,000 m, meeting observation requirements.
Each end of the dip line has two control points, totaling four, with a spacing of 100 m between control points and working points. Since the working face width (l = 350 m) is less than (1.4 H0 = 423 m), the movement basin may not have reached full mining conditions along the dip. To accurately determine point spacing, 25 m intervals are used, with 40 working measuring points laid out. The order of the dip observation line control points is KQ01, KQ02, KQ04; the working measuring point number is composed of a character and two Arabic numerals. For example, the first monitoring point on the dip observation line is numbered as Q01, and the rest follow suit. Where “K” is the control point identification code, “Q” is the monitoring point identification code, and the following numbers are the sequential numbers of the measuring points.
The layout of strike and dip observation line monitoring points is illustrated in Figure 1.
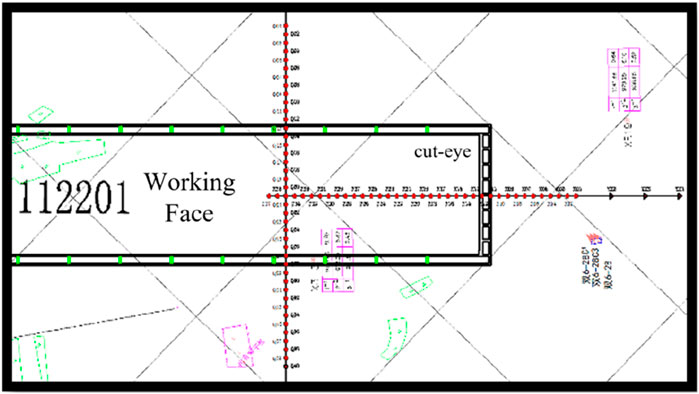
Figure 1. Schematic of monitoring points on strike and dip observation lines.
3.3 Observation data analysis
The working face is fully mined along the strike direction, with a maximum settlement of 3,664 mm recorded at monitoring point Z18. In the dip direction, the maximum settlement reaches 3,327 mm at point Q20, and the settlement curve does not exhibit a horizontal section. A comprehensive analysis indicates that full mining conditions have not been achieved in the dip direction.
4 Surface subsidence trend main cross-section fitting analysis
The fitting analysis in this study was conducted using Origin, a professional plotting and data analysis software developed by OriginLab Corporation. Widely used internationally, Origin provides robust function fitting capabilities (Grant, 2017). In this study, Origin was employed for nonlinear fitting of subsidence data. Its built-in algorithms enabled the construction of probability integration and density function models, with residual analysis performed to evaluate goodness-of-fit. Its built-in algorithms facilitated the construction of probability integration and probability density function models, while residual analysis was performed to assess the goodness-of-fit.
4.1 Probabilistic integration method fitting analysis
Using the nonlinear fitting function in Origin, a probabilistic integration fitting function was constructed based on Equation 13. Since the existing surface subsidence data use the left mining boundary as the origin, the independent variable x in the original formula requires a coordinate translation by s1. Thus, the original coordinates are replaced with (x−s1). Incorporating the parameters of the 112,201 working face and surface observation data, the reconstructed probabilistic integration fitting function, which includes the inflection point shift, is presented in Equation 19:
Fitting the model using the aforementioned function reveals a correlation between C and q. Therefore, it is necessary to assign a value to C based on actual conditions. The value of C is determined as the ratio of the maximum subsidence in the dip direction to the maximum subsidence in the strike direction. After calculation, C is found to be 0.9.
Since the coal seam is nearly horizontal, it can be assumed that s1 and s2 are equal. Thus, a single variable s is used in the formula instead. The simplified probabilistic integration fitting function is presented in Equation 20:
Among them, q, tanβ and s are the predicted parameters.
The fitting curve is shown in Figure 2, and the fitting residual results are shown in Table 1:
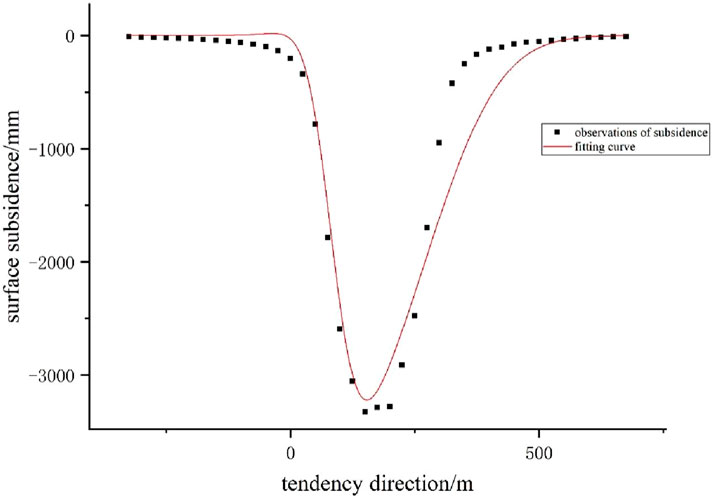
Figure 2. Fitting curve of the ground subsidence probability integration method for the 112,201 working face.
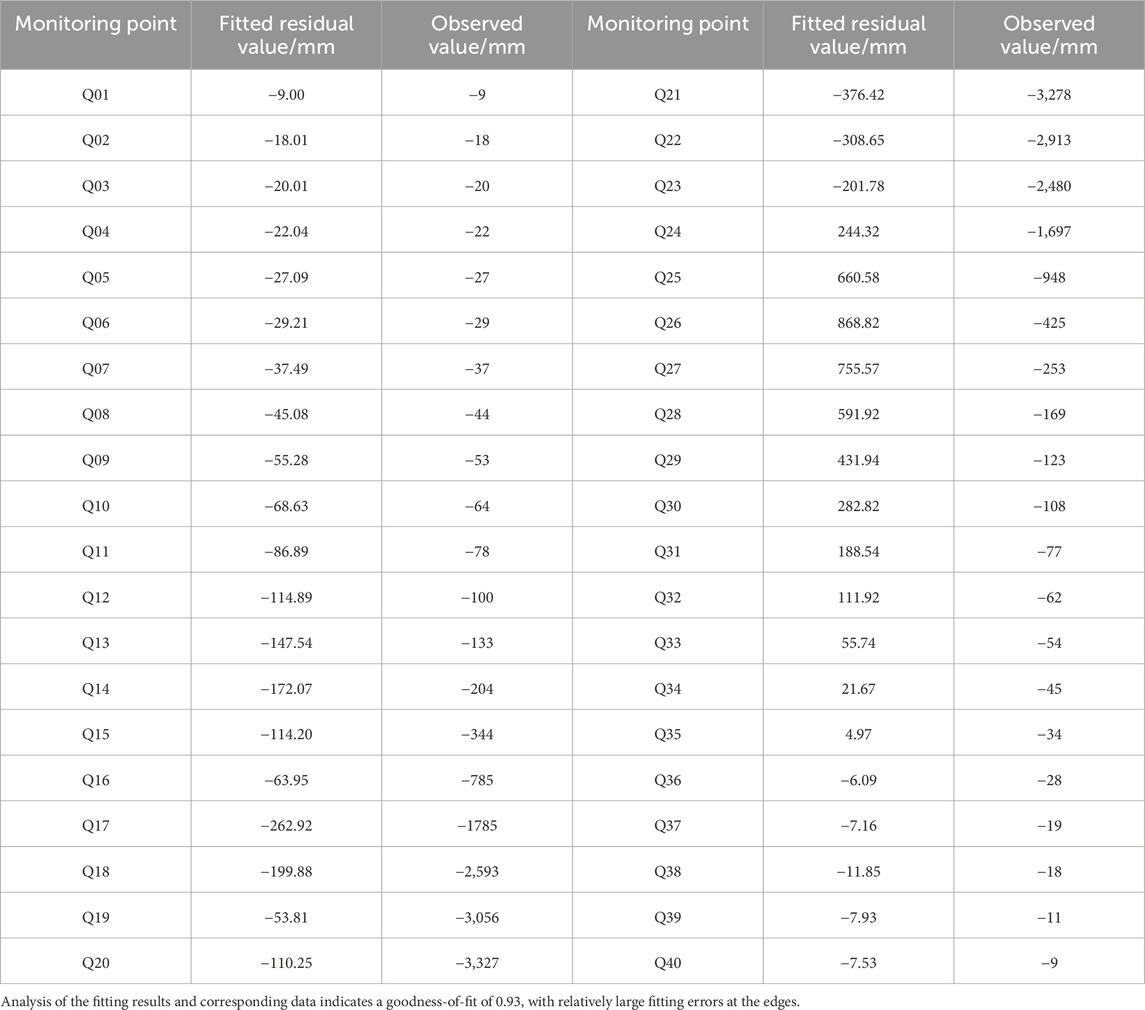
Table 1. Table of fitting residual values for the probability integration method of the 112,201 working face.
The fitting parameters of the aforementioned curve are as follows: q = 1.02, tanβ = 2.97, and S = 82.38.
4.2 Probability density function method
The probability density function (PDF) fitting function, constructed based on Equation 14, is presented in Equation 21:
The fitting curve is illustrated in Figure 3, while the fitting residuals are presented in Table 2.
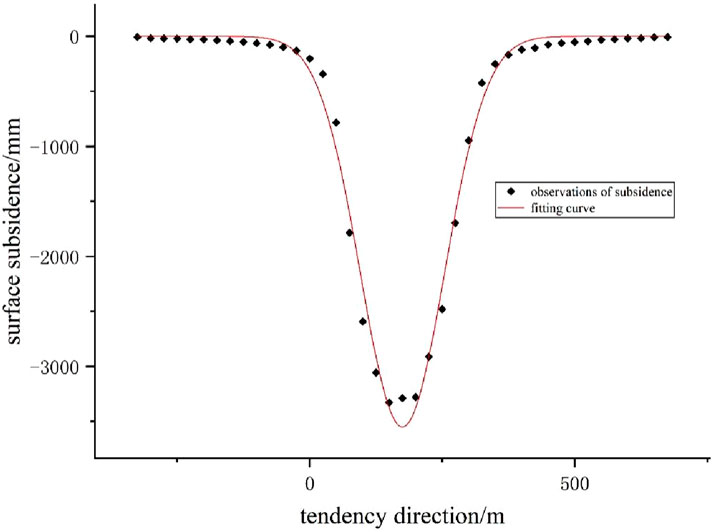
Figure 3. Fitting curve graph of the ground subsidence using the probability density function method for the 112,201 working face.
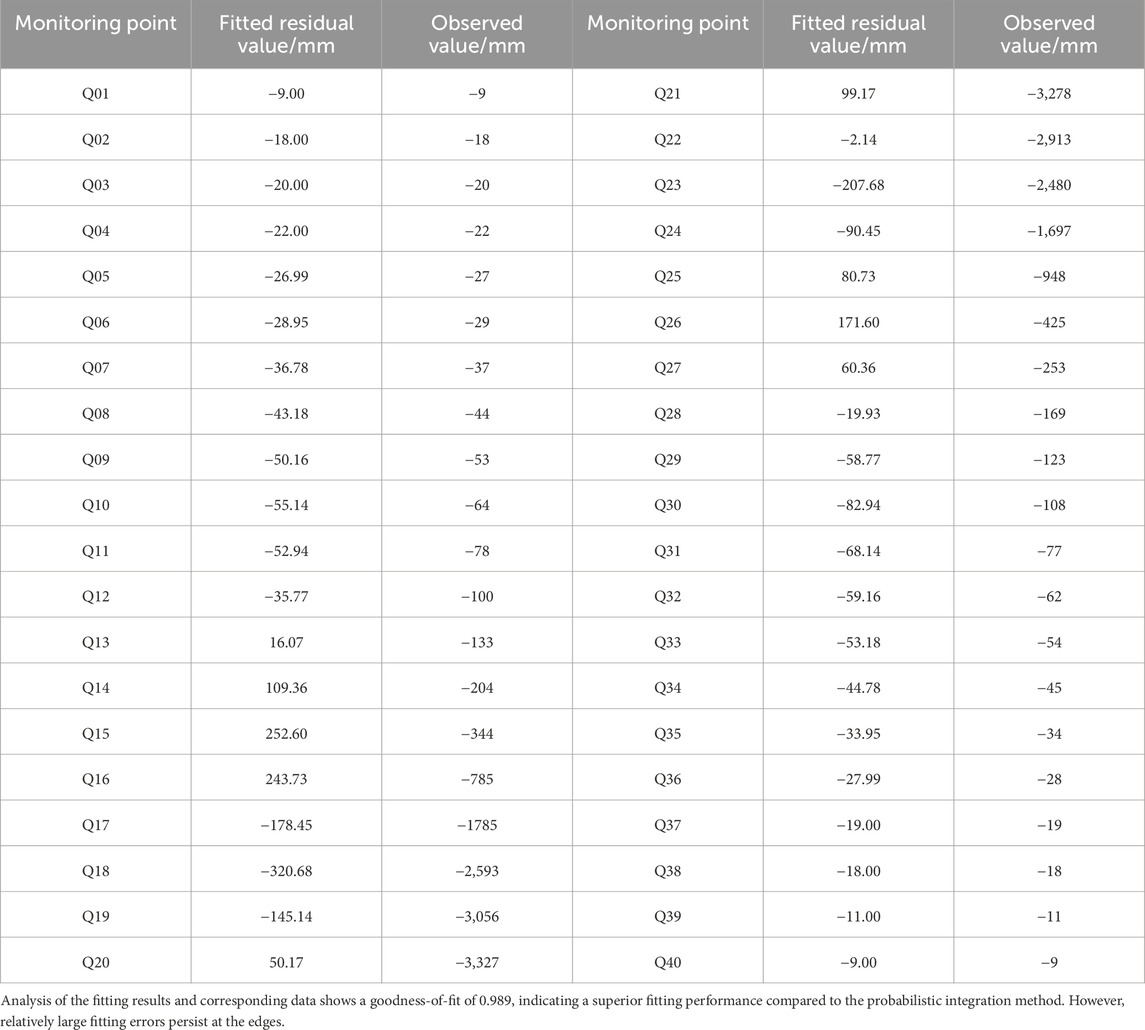
Table 2. Table of fitting residual values using the probability density function method for the 112,201 working face.
The fitting parameters of the aforementioned curve are as follows: q = 0.61184, tanβ = 1.5167, and S = 82.38.
4.3 Sensitivity analysis of q and tanβ
The sensitivity of q and tan β is now discussed and analyzed.
(1) q
Under the condition that tanβ remains constant at 1.5167, Figure 4 shows the fitted probability density function curves for different cases where q = 0.4, q = 0.5, and q = 0.61184.
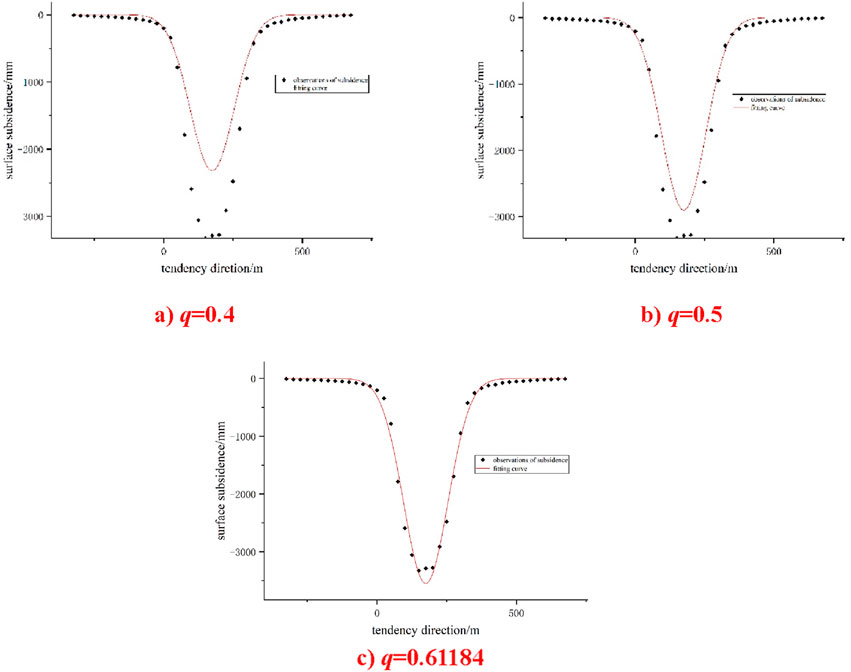
Figure 4. (a) q = 0.4 (b) q = 0.5 (c) q = 0.61184. The probability density function fitting curve (tanβ = 1.5167).
Overall, under the constant condition of tanβ = 1.5167, an increase in the value of q leads to a reduction in the degree of surface subsidence, while the symmetrical U-shaped distribution characteristic of the subsidence remains unchanged. This trend indicates that q is a critical parameter affecting the depth of subsidence, with larger q values corresponding to shallower subsidence.
(2) tanβ
Under the condition that q remains constant at 0.61184, Figure 5 shows the fitted probability density function curves for different cases where tanβ = 1.5167, tanβ = 2, and tanβ = 3.
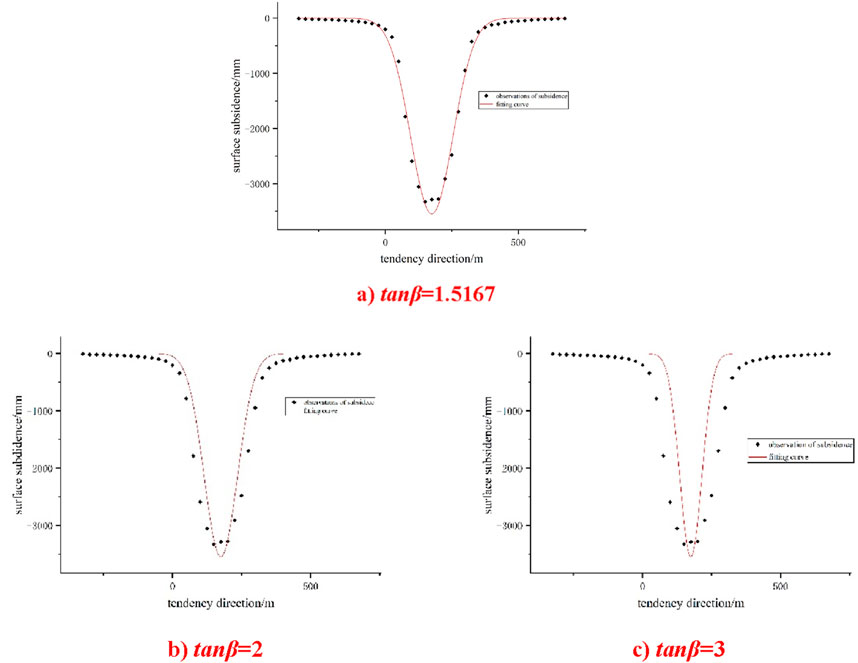
Figure 5. (a) tanβ = 1.5167 (b) tanβ = 2 (c) tanβ = 3. The probability density function fitting curve (q = 0.61184).
Under the condition that q remains constant at 0.61184, as tanβ increases from 1.5167 to two and then to 3, the following trends are observed: The maximum depth (peak value) of surface subsidence gradually increases. The range of subsidence distribution gradually narrows, with the curve becoming steeper, indicating that subsidence is more concentrated in the central region. The overall distribution retains a symmetrical U-shaped characteristic, with the basic shape unchanged by variations in tanβ.
By adjusting the expected parameters in the fitting of the predicted curve to the observation data, it is difficult to ensure that both the interior and the edges of the basin can be well fitted.
When q remains constant at 0.61184, and tanβ increases from 1.5167 to 2, and then to 3, the following trends are observed:
1. The maximum depth (peak value) of surface subsidence gradually increases.
2. The subsidence distribution range narrows, with the curve becoming steeper, indicating that subsidence is more concentrated in the central region.
3. The overall distribution retains a symmetrical U-shaped characteristic, with its basic shape remaining unchanged despite variations in tanβ.
When adjusting expected parameters to fit the predicted curve to observation data, it remains challenging to achieve an optimal fit for both the interior and edges of the subsidence basin.
4.4 Regional inversion
Given that both the probabilistic integration method and the probability density function (PDF) method exhibit large edge fitting errors, this study proposes a regional inversion approach for the PDF method, which demonstrates a good overall fit. The objective is to reconstruct the fitting function for edge data, ensuring an accurate fit for both the edge and central regions.
For the edge data Q01-Q10 and Q31-Q40, a new fitting was performed with the fitting parameters q set to 0.02994, tanβ set to 0.5864, and the R-squared value at 0.988. The fitted curves from regional inversion are shown in Figure 6. The fitting residuals are shown in Table 3.
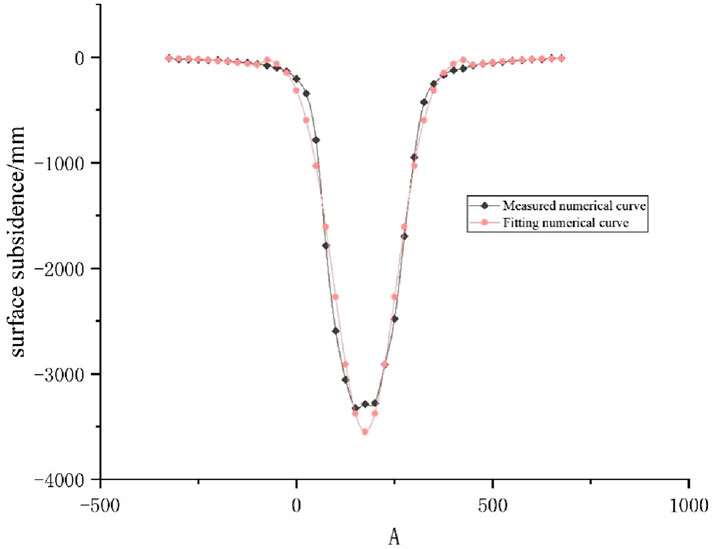
Figure 6. Figure of fitted curves from regional inversion.
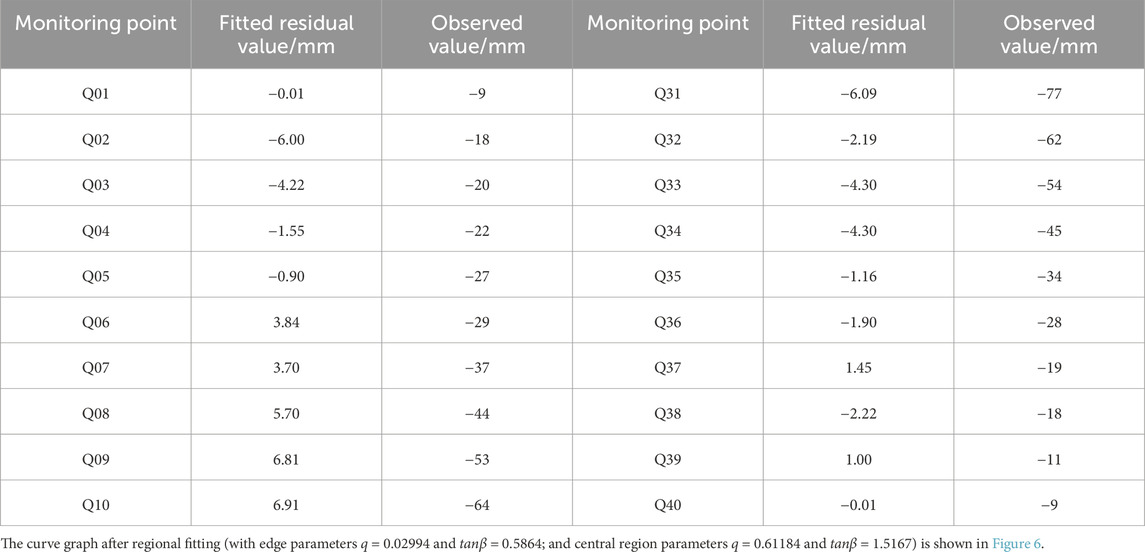
Table 3. Table of fitting residual values for edge data using the probability density function method for the 112,201 working face.
Based on the above analysis, it is recommended to adopt the probability density function (PDF) method, utilizing different predicted parameters for edge and central data. The inverted predicted parameters are presented in the following Table 4.

Table 4. Table of inverted predicted parameters.
5 Surface subsidence trend main cross-section numerical simulation analysis comparison
5.1 Model construction
The calculations in this study were conducted using MIDAS GTS NX, a geotechnical engineering analysis software. To simulate the soil body, solid elements were employed due to their ability to accurately capture the three-dimensional stress-strain behavior of soil.
The model dimensions were set to 630 m (X) × 300 m (Y) × 351 m (Z), ensuring that boundaries were sufficiently distant from the area of interest to minimize boundary effects on simulation results. The soil material was represented using the Mohr-Coulomb model, chosen for its proven effectiveness in capturing the shear strength and failure characteristics of soil under the studied conditions. Key parameters of the Mohr-Coulomb model, including the internal friction angle (ϕ), cohesion (c), and unit weight (γ), were obtained from laboratory tests on site-collected soil samples, ensuring consistency with real-world conditions.
The boundary conditions were defined to reflect the physical constraints of the problem:
1. The upper boundary was set as a free surface, simulating an unconstrained ground surface.
2. The lower boundary constrained displacement in the Z direction, representing a rigid bedrock layer.
3. The left and right boundaries constrained displacement in the Y direction, while the front and back boundaries constrained displacement in the X direction, mimicking the semi-infinite extent of the soil in the horizontal plane.
To enhance reproducibility, the model assumes a homogeneous, isotropic soil body with no groundwater, neglecting fluid-solid coupling effects. The mesh was constructed using hexahedral solid elements with an average size of 5 m, balancing computational efficiency and accuracy.
The simulation was conducted in two stages:
1. Establishing an initial stress field under gravitational loading to reflect in situ conditions.
2. Applying specific loading or excavation scenarios based on the study’s objectives.
The model setup is illustrated in Figure 7, providing a visual representation of the geometry and boundary conditions.
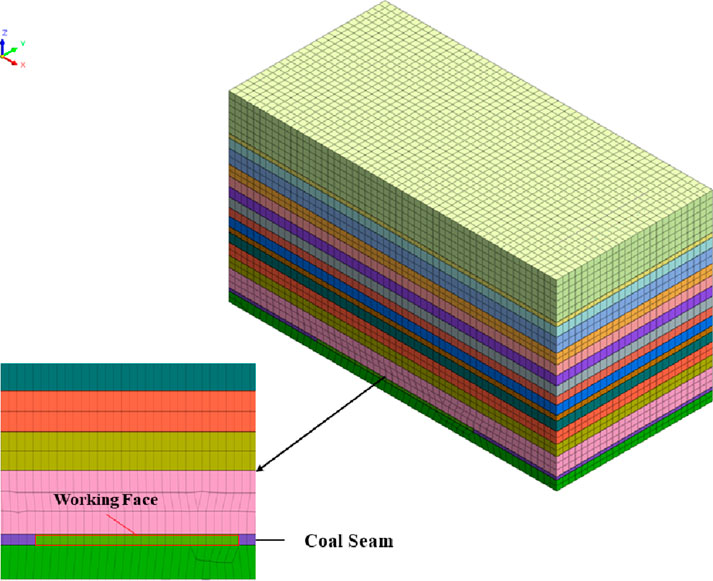
Figure 7. Numerical calculation model.
5.2 Computational results
Mining of the underground coal seam resulted in the loss of support for the overlying soil and rock mass, triggering a stress redistribution within the strata. The area adjacent to the coal pillar experienced significant pressure, leading to compressive failure of the soil and rock mass in that region (G.W. P., 2017). The simulation results are illustrated in Figure 8.
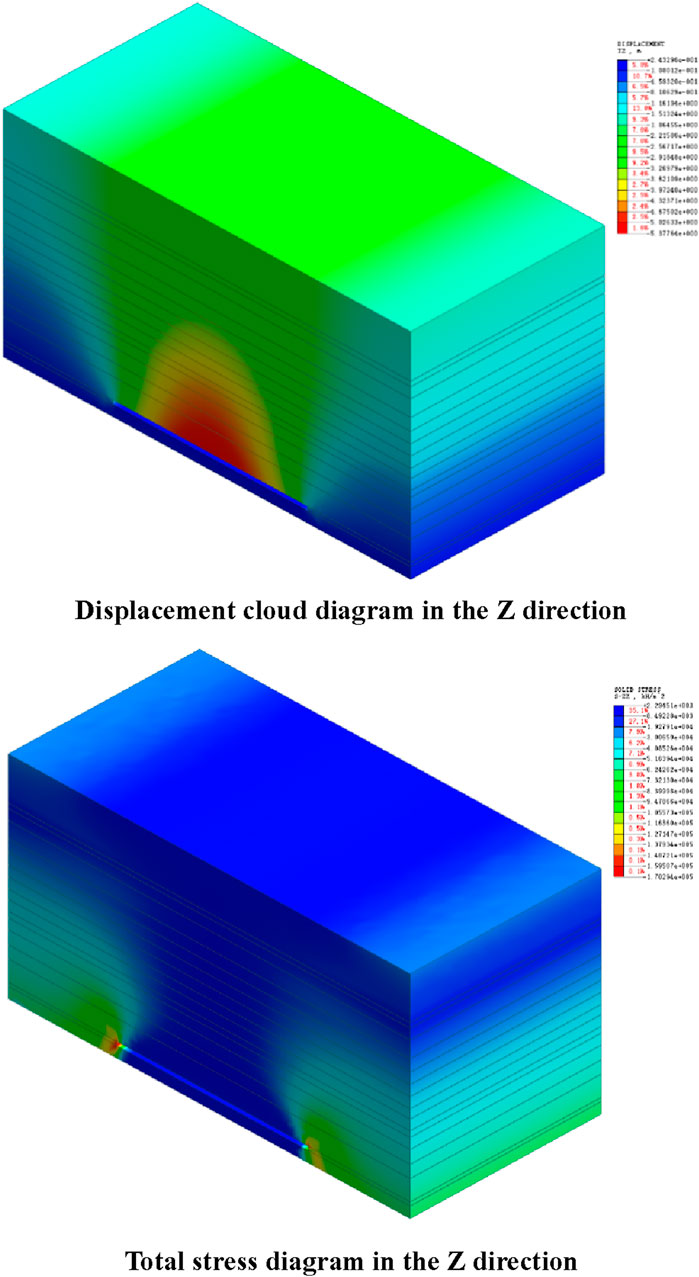
Figure 8. Displacement cloud diagram in the Z direction. Total stress diagram in the Z direction. Numerical calculation results of ground subsidence for the 112,201 working face.
After excavation, stress redistribution induces uneven settlement within a certain range. The settlement value gradually decreases upward from the bottom of the mined-out area. On the surface, settlement decreases progressively from the center of the excavation toward both ends. The maximum surface settlement is 2.91 m.
5.3 Comparison of fitting analysis and numerical analysis
Figures 9, 10 illustrate the fitting results of the probability density function (PDF) method and the probabilistic integration method, respectively, compared with numerical calculation results. The figures clearly depict the comparison between numerical results and fitting results.
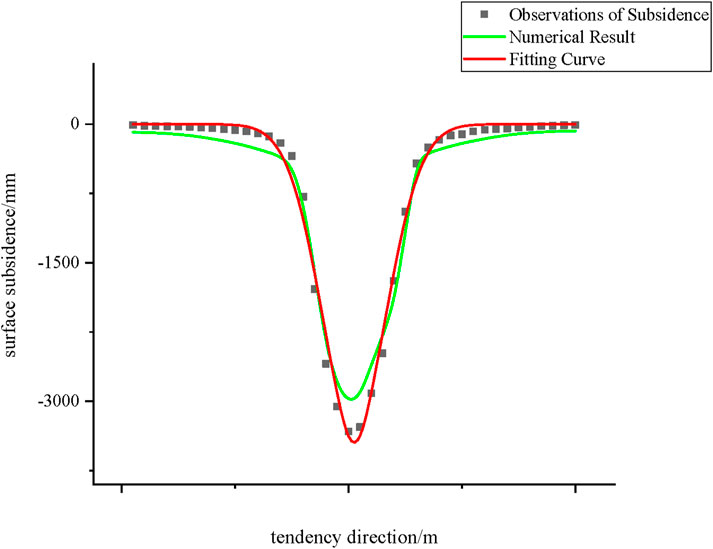
Figure 9. Comparison of the probability density function fitting curve and the numerical calculation curve for ground subsidence of the 112,201 working face.
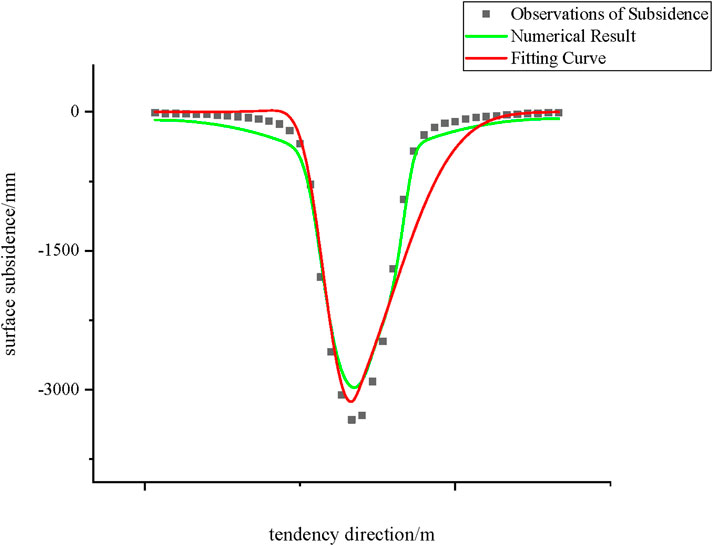
Figure 10. Comparison of the probabilistic integration method fitting curve and the numerical calculation curve for ground subsidence of the 112,201 working face.
A comparative analysis of the probabilistic integration method and the PDF method reveals that the probabilistic integration method may exhibit fitting accuracy issues within specific intervals. This phenomenon likely arises from its inherent limitations in global fitting capability. In contrast, the PDF method demonstrates a high degree of consistency with numerical simulation results in overall trends. This finding suggests that the PDF method offers a significant advantage in global fitting performance.
6 Discussion
This study demonstrates that the probability density function (PDF) method outperforms the traditional probabilistic integration method (PIM) in fitting subsidence curves under insufficient mining conditions, particularly in edge regions. These results align with Guo et al. (2004), who proposed the PDF method to mitigate parameter correlation issues inherent in PIM. However, our regional inversion strategy further resolves edge-fitting discrepancies, a limitation noted in studies by Han (2021) and Zhao et al. (2022).
Compared to recent advancements like the segmented correction model by Tao et al. (2023) for thick loose layers or the hybrid machine-learning approach by Chi et al. (2023), our method simplifies parameterization by eliminating the need for additional coefficients (e.g., mining coefficient C), enhancing practicality for field applications. While Hu et al. (2023) integrated InSAR and genetic algorithms to improve PIM, our focus on sub-region fitting offers a computationally efficient alternative without requiring extensive remote sensing data.
A key strength of this work is its adaptability to asymmetric subsidence basins, a challenge poorly addressed by classical PIM (Liu and Dai, 2016). However, limitations persist: The model assumes homogeneous strata, whereas complex geological conditions (e.g., reverse faults or backfill mining) may necessitate further modifications, as explored by Luo et al. (2024) and Huo et al. (2023). The reliance on localized observation data limits generalizability across diverse mining geometries.
These findings contribute to the broader discourse on subsidence prediction by validating the PDF method’s robustness under insufficient mining and proposing a hybrid fitting framework. Future work should explore integrating regional inversion with time-dependent models (e.g., Zhang et al., 2020) to address dynamic subsidence.
7 Conclusion
(1) The subsidence curves of the study area were fitted using both the probabilistic integration method and the probability density function (PDF) method. Analysis results indicate that the PDF method provides a superior fit. The probabilistic integration method exhibits several drawbacks, including strong correlation between predicted parameters, rapid convergence, and relatively large errors in edge data during the fitting process.
(2) To address the issue of poor edge fitting, a regional fitting approach was adopted, resulting in a closer match to surface deformation and improved fitting accuracy. This method enhances the precision of predicted surface deformation and demonstrates practical applicability.
(3) A comparison of the fitting performance of the PDF method and the probabilistic integration method against numerical simulation results shows that the PDF method exhibits a higher degree of consistency with the overall trend of numerical simulations.
Data availability statement
The original contributions presented in the study are included in the article/supplementary material, further inquiries can be directed to the corresponding author.
Author contributions
WD: Conceptualization, Investigation, Writing – original draft. MG: Methodology, Validation, Writing – original draft. JL: Methodology, Resources, Writing – review and editing. YZ: Formal Analysis, Supervision, Writing – review and editing. YM: Data curation, Writing – review and editing. HD: Data curation, Validation, Visualization, Writing – review and editing. BJ: Conceptualization, Formal Analysis, Resources, Writing – review and editing. LF: Data curation, Resources, Writing – review and editing. ZL: Formal Analysis, Resources, Supervision, Writing – review and editing.
Funding
The author(s) declare that financial support was received for the research and/or publication of this article. This work was financially funded by the Natural Science Foundation of Hebei Province D2023403055.
Conflict of interest
Author WD was employed by Shanxi Xiaobaodang Mining Co.,Ltd. Authors MG, JL, and YZ were employed by Shanxi Coalbed Methane Development Co.,Ltd. Author ZL was employed by Hebei Civil Engineering Co., Ltd.
The remaining authors declare that the research was conducted in the absence of any commercial or financial relationships that could be construed as a potential conflict of interest.
Generative AI statement
The author(s) declare that no Generative AI was used in the creation of this manuscript.
Publisher’s note
All claims expressed in this article are solely those of the authors and do not necessarily represent those of their affiliated organizations, or those of the publisher, the editors and the reviewers. Any product that may be evaluated in this article, or claim that may be made by its manufacturer, is not guaranteed or endorsed by the publisher.
References
Ahmadi, M., Torkashvand, A., Badraddini, A., Sarfarazi, V., and Jahanmiri, S. (2023). Investigation of the influence of tunneling on bridge foundation in urban area. Geotechnical Geol. Eng. 41 (4), 2481–2499. doi:10.1007/s10706-023-02410-y
Bing, H., Yan, Z., Qiang, F., and Hou, H. (2021). Study on mining subsidence of mineral deposit and overburden stability based on probability density function. IOP Conf. Ser. Earth Environ. Sci. 781, 022078. doi:10.1088/1755-1315/781/2/022078
Cai, Y., Jin, Y., Wang, Z., Chen, T., Wang, Y., Kong, W., et al. (2023). A review of monitoring, calculation, and simulation methods for ground subsidence induced by coal mining. Int. J. coal Sci. & Technol. 10 (1), 32. doi:10.1007/s40789-023-00595-4
Chen, S., Lei, W., Yang, X., Fang, X., and Jiang, C. (2021). Research on prediction model of mining subsidence in thick unconsolidated layer mining area. IEEE Access 9, 23996–24010. doi:10.1109/access.2021.3056873
Chi, S., Wang, L., and Yu, X. (2023). A new method for calculating prediction parameters of surface deformation in the mining area. Appl. Sci. 13 (14), 8030. doi:10.3390/app13148030
Guo, Q., Chen, H., Luo, J., Wang, X., Wang, L., Lv, X., et al. (2022). Parameter inversion of probability integral method based on improved crow search algorithm. Arabian J. Geosciences 15 (2), 180. doi:10.1007/s12517-022-09457-w
Guo, W., Liu, D., and Bai, E. (2004). Correction of the subsidence curve formula based on the probability integration method. J. Henan Polytech. Univ. Nat. Sci. Ed. 35 (3), 357–362. doi:10.13225/j.cnki.jccs.2004.02.007
G.W. P. (2017). Design analysis in rock mechanics. 3rd ed. London: Taylor & Francis. doi:10.1201/9780203968253
Han, Y. (2021). Research on the acquisition and application of predicted parameters of the probability integration method. Mine Surv. 49 (4), 15–19. doi:10.3969/j.issn.1001-358X.2021.04.004
Hu, L., Jie, Z., Lian, X., Zhao, X., Lei, X., and Gong, X. (2023). Inversion of subsidence parameters and prediction of surface dynamics under insufficient mining. J. Min. Sci. 59 (4), 693–704. doi:10.1134/s106273912304021x
Huo, W., Li, H., Guo, G., Wang, Y., and Yuan, Y. (2023). Surface subsidence prediction method for backfill mining in shallow coal seams with hard roofs for building protection. Sustainability 15 (22), 15791. doi:10.3390/su152215791
Jiang, T., Zhu, C., Qiao, Y., Sasaoka, T., Shimada, H., Hamanaka, A., et al. (2024). Deterioration evolution mechanism and damage constitutive model improvement of sandstone–coal composite samples under the effect of repeated immersion. Phys. Fluids 36 (5). doi:10.1063/5.0208619
Li, J., Yu, X., and Liang, Y. (2020). A prediction model of mining subsidence in thick loose layer based on probability integral model. Earth Sci. Res. J. 24 (3), 367–372. doi:10.15446/esrj.v24n3.90111
Li, P., Li, Y., Li, Q., Cao, Z., and Wang, L. (2022). A novel analytical model of mining subsidence considering time effect based on the probability integral theory. Sustainability 14 (21), 14443. doi:10.3390/su142114443
Liu, B., and Dai, H. (2016). Research development and origin of probability integral method. J. Min. Strata Control Eng. 21 (2), 1–3. doi:10.13532/j.cnki.cn11-3677/td.2016.02.001
Lou, J. (2024). A parameter inversion method for the probability integral method based on robust ridge estimation. Front. Earth Sci. 11, 1330163. doi:10.3389/feart.2023.1330163
Luo, J., Li, Y., Guo, Q., Meng, X., and Wang, L. (2024). Research on the surface subsidence characteristics and prediction models caused by coal mining under the reverse fault. Sci. Rep. 14 (1), 25316. doi:10.1038/s41598-024-75182-x
Shi, M., Yang, H., Wang, B., Peng, J., Gao, Z., and Zhang, B. (2021). Improving boundary constraint of probability integral method in SBAS-InSAR for deformation monitoring in mining areas. Remote Sens. 13 (8), 1497. doi:10.3390/rs13081497
Tao, W., Guangli, G., Huaizhan, L., Wang, L., Jiang, Q., and Jiang, C. (2023). A novel probability integral method segmental modified model for subsidence prediction applicable to thick loose layer mining areas. Environ. Sci. Pollut. Res. Int. 30 (18), 52049–52061. doi:10.1007/s11356-023-26021-5
Wang, J., Yang, & others, Wei, X., Shi, X., and Yao, S. (2021). Prediction of longwall progressive subsidence basin using the Gompertz time function. Rock Mech. Rock Eng. 55, 379–398. doi:10.1007/s00603-021-02664-z
Wang, Z., Zhao, Y., Wang, P., Wang, X., Jiang, A., Zhang, G., et al. (2024). Refined subsidence monitoring and dynamic prediction in narrow and long mining areas based on InSAR and probabilistic integral method. Sci. Rep. 14 (1), 28009. doi:10.1038/s41598-024-76037-1
Wei, T., Guo, G., Li, H., Wang, L., Jiang, Q., and Jiang, C. (2023). A novel probability integral method segmental modified model for subsidence prediction applicable to thick loose layer mining areas. Environ. Sci. Pollut. Res. 30 (18), 52049–52061. doi:10.1007/s11356-023-26021-5
Xuemin, X., Yikai, Z., Zhihui, Y., Xiao, L., Liu, X., Chen, L., et al. (2021). Predicting mining-induced dynamic deformations for drilling solution rock salt mine based on probability integral method and Weibull temporal function. Int. J. Remote Sens. 42 (2), 639–671. doi:10.1080/01431161.2020.1813345
Yan, W., Chen, J., and Yan, Y. (2019). A new model for predicting surface mining subsidence: the improved lognormal function model. Geosciences J. 23 (1), 165–174. doi:10.1007/s12303-018-0008-1
Yuan, Y., Li, H., Zhang, H., Zhang, Y., and Zhang, X. (2020). Improving reliability of prediction results of mine surface subsidence of Northern Pei County for reusing land resources. Appl. Sci. 10 (23), 8385. doi:10.3390/app10238385
Zhang, J., Zhang, P., and Ji, X. (2024). Prediction of surface subsidence in Gequan coal mine based on probability integral and numerical simulation. Acad. J. Eng. Technol. Sci. doi:10.25236/AJETS.2024.070102
Zhang, L., Cheng, H., Yao, Z., and Wang, X. (2020). Application of the improved Knothe time function model in the prediction of ground mining subsidence: a case study from Heze City, Shandong Province, China. Appl. Sci. 10 (9), 3147. doi:10.3390/app10093147
Zhao, B., Guo, Y., Mao, X., Zhai, D., Zhu, D., Huo, Y., et al. (2022). Prediction method for surface subsidence of coal seam mining in loess donga based on the probability integration model. Energies 15 (6), 2282. doi:10.3390/en15062282
Keywords: mining subsidence, probability integral method, probability density function method, insufficient mining, fitting analysis
Citation: Du W, Guo M, Lai J, Zhang Y, Ma Y, Dun H, Jia B, Feng L and Li Z (2025) Fitting analysis of the curve of main inclined section of surface subsidence of insufficient mining. Front. Earth Sci. 13:1525363. doi: 10.3389/feart.2025.1525363
Received: 09 November 2024; Accepted: 01 April 2025;
Published: 24 April 2025.
Edited by:
Hao Shi, Anhui University of Science and Technology, ChinaReviewed by:
Tianqi Jiang, Kyushu University, JapanMaria Teresa Yubero, Polytechnic University of Catalonia, Spain
Vahab Sarfarazi, Hamedan University of Technology, Iran
Copyright © 2025 Du, Guo, Lai, Zhang, Ma, Dun, Jia, Feng and Li. This is an open-access article distributed under the terms of the Creative Commons Attribution License (CC BY). The use, distribution or reproduction in other forums is permitted, provided the original author(s) and the copyright owner(s) are credited and that the original publication in this journal is cited, in accordance with accepted academic practice. No use, distribution or reproduction is permitted which does not comply with these terms.
*Correspondence: Yafei Ma, bXlmbnpiQDE2My5jb20=