
94% of researchers rate our articles as excellent or good
Learn more about the work of our research integrity team to safeguard the quality of each article we publish.
Find out more
ORIGINAL RESEARCH article
Front. Earth Sci., 10 March 2025
Sec. Earth and Planetary Materials
Volume 13 - 2025 | https://doi.org/10.3389/feart.2025.1522488
 Nauman Izhar1
 Muhammad Adeel Khan2*
 Muhammad Salman Khan2*
 Asad Khan2*
 Mahmood Ahmad3,4
 Mohanad Muayad Sabri Sabri5
 Muriuzs Necurzac6Abdullah Alzlfawi7
The geotechnical properties of soil are crucial in determining the stability of foundations and construction safety in regions with high groundwater levels, such as Warsak Road in Peshawar, Pakistan. Due to its proximity to the Warsak Dam and intersecting irrigation canals, the area experiences a consistently high water table, which significantly impacts soil stability, leading to potential issues such as excessive settlement, reduced shear strength, and increased structural instability. These groundwater conditions pose unique challenges for foundation stability, making it essential to develop a comprehensive understanding of the soil’s consolidation behavior and shear strength properties. To address these concerns, this study employs a combined experimental and numerical approach, aiming to evaluate these critical soil properties in detail. The experimental phase involved collecting three undisturbed soil samples from each of the five distinct sites along Warsak Road, spaced approximately 5 km apart. These samples were subjected to standardized laboratory tests, including grain size distribution, specific gravity, Atterberg Limits, direct shear, unconfined compression, and oedometer tests, per ASTM standards. To further validate the laboratory findings, numerical analysis using PLAXIS software was conducted, along with analytical evaluations using the Meyerhof and Vesic bearing capacity equations. This integrated methodology provided a comprehensive understanding of the soil’s behavior under varying conditions, revealing distinct variations in the average values of the three samples from each site. Specifically, Site 1 exhibited an average cohesion of 18.22 kN/m2, making it suitable for low-rise structures, whereas Site 2, with an average cohesion of 15.23 kN/m2, indicated the need for stabilization due to its high consolidation potential. Site 3, averaging 13.3 kN/m2, showed higher settlement risk, necessitating deep foundations, while Site 4, with the lowest average cohesion of 9.94 kN/m2, was deemed unsuitable for heavy loads without reinforcement. In contrast, Site 5, having the highest average cohesion of 20.2 kN/m2, demonstrated excellent stability, ideal for multi-story buildings and other heavy structures. The numerical results from PLAXIS offered a more accurate understanding of soil behavior compared to the traditional Meyerhof and Vesic methods, highlighting the necessity of integrating advanced numerical techniques with conventional approaches. Accordingly, targeted soil improvement measures are recommended for weak and highly compressible soils to ensure the long-term stability and safety of structures in the region.
Geotechnical engineering has advanced significantly since the mid-18th century, driven by early structural failures that emphasized the importance of understanding soil properties in foundation design. Modern geotechnical practices have since focused on addressing complex soil behaviors, particularly in regions with high water tables and proximity to water bodies. Such regions, often characterized by clayey soils, present unique challenges due to low shear strength and high consolidation potential, making them prone to settlement and structural instability (Onyelowe et al., 2023). In these conditions, water-saturated soils become highly compressible, requiring detailed geotechnical assessments and potentially the use of deep foundations or soil improvement techniques to ensure structural integrity (Onyelowe et al., 2023; Bian et al., 2024; Otake and Honjo, 2022).
Research on the consolidation and shear strength of clayey soils has been a cornerstone in geotechnical engineering for centuries (Yin et al., 2021; Suzuki and Yasuhara, 2007; Krishna MuRTHY et al., 1981; Roy, 2022; Islam et al., 2022). Early soil mechanics principles were first explored by pioneers like Coulomb and Terzaghi, who emphasized the importance of these properties for foundation stability (Shulyatyev and Mozgacheva, 2024; Lokkas et al., 2021; Aziz et al., 2024; Hua et al., 2024; Su et al., 2022). Theories such as Terzaghi’s consolidation hypothesis and subsequent advancements by Ladd, Casagrande, and Skempton established a robust framework for understanding soil behavior under structural loads (Lokkas et al., 2021; Liu et al., 2024). Consolidation, defined as the reduction in soil volume due to water expulsion under load, is critical in evaluating settlement potential (Mohammed, 2015; Xu et al., 2021). Similarly, shear strength, which determines soil resistance to failure under stress, is essential for foundation design. Recent studies have emphasized that soil mineral composition, moisture content, and natural structures such as layering and bonding significantly influence the complexities of consolidation and shear strength variability in clayey soils, underscoring the need for localized studies to address site-specific geotechnical challenges effectively.
Clayey soils exhibit significant plasticity when exposed to water due to their unique mineral characteristics, influenced by factors such as surface area, cation exchange capacity, and iron oxide content (Boumehraz et al., 2024; Zi et al., 2024; Wang J. et al., 2024; Niu et al., 2024). Mineral composition, such as kaolinite or smectite dominance, greatly impacts soil behavior, with kaolinite-rich clays having lower organic carbon content (Nguyen, 2014; Hu et al., 2024; Zhou H. et al., 2022; Wang H. et al., 2024; Yin et al., 2024). Additionally, the presence of salts, particularly sulfates, can adversely impact the stability and mechanical properties of stabilized clay soils, while variations in pore fluid chemistry can further alter soil behavior (Bakr, 2024; Liang et al., 2025; Zhou et al., 2022b; Zhou and Liu, 2022; Zhou et al., 2022c). Standard laboratory tests using distilled water may not accurately represent in-situ conditions, leading to potential misinterpretations, as parameters such as the liquid limit and plasticity index are sensitive to clay-water interactions and have a direct influence on hydraulic conductivity (Elmashad and Ata, 2016; Bilgen and Kavak, 2010; Shan et al., 2024).
A prime example of these challenges is evident along Warsak Road in Peshawar, Pakistan, where the geotechnical complexities of clayey soils pose significant issues for foundation design and structural stability due to their low shear strength and high consolidation potential. The area’s proximity to Warsak Dam and intersecting irrigation canals, coupled with high water tables and seasonal moisture variations, further exacerbate these issues, making the soil highly susceptible to excessive settlement and instability. Given the region’s rapid urbanization and infrastructural expansion, there is a critical need for comprehensive geotechnical studies to ensure safe and sustainable development. The lack of detailed, site-specific data complicates foundation design, especially for multi-story structures subjected to complex loading.
To address these complexities, soil stabilization techniques are widely used in geotechnical engineering to enhance soil properties such as strength, durability, and plasticity (Salim et al., 2018; Li et al., 2024; Zhao et al., 2025; Runsheng et al., 2023; Wang et al., 2023). Stabilization methods often involve mixing different soils or adding chemical additives based on site-specific requirements (Freitag, 1986; Wang et al., 2024c; Wang et al., 2024d). The selection of appropriate stabilization techniques depends on various factors, including soil type, economic considerations, project duration, and availability of materials (Sujatha et al., 2018). Common methods include stone columns, root piles, and reinforced earth using geosynthetics and randomly distributed fibers (Salim et al., 2018). The concept of reinforced soil, introduced by Henri Vidal in the 1960s, offers an environmentally friendly and cost-effective solution due to the local availability and biodegradability of the materials used (Wu et al., 2014; Al Adili et al., 2012). Consequently, understanding the complex behavior of clayey soils and implementing appropriate stabilization measures is essential for ensuring structural stability and minimizing settlement risks in construction projects.
Despite extensive research on soil stabilization and improvement techniques, there is a noticeable gap in localized geotechnical studies specific to this region, particularly regarding the consolidation potential and shear strength of clayey soils. This lack of reliable data presents a challenge in designing effective foundation strategies tailored to the unique soil conditions of Warsak Road. Addressing these gaps through advanced soil analysis and validated modeling techniques is essential for ensuring safe and sustainable development. Thus, this study aims to comprehensively assess the geotechnical properties of clayey soils along Warsak Road by a) characterizing the soil in terms of grain size distribution and plasticity parameters using ASTM standards, b) evaluating its shear strength and bearing capacity through laboratory tests, and c) analyzing the soil behavior using PLAXIS software (Brinkgreve and PLAXIS Version 8 Reference Manual STATIK, 2016). The results will be validated against established standards and equations, such as Meyerhof (Das, 2009) and Vesic (Sedmak Vesić, 1973), to ensure accuracy and provide valuable insights for the region’s ongoing and future construction projects.
The experimental phase involved a comprehensive geotechnical evaluation of the soil samples collected from five strategically selected locations along Warsak Road, spaced approximately 5 km apart to account for any variations in soil type, as shown in Figure 1. The sampling sites were strategically selected to achieve the research objectives. To ensure reliable data, three undisturbed samples were collected from each location, adhering to ASTM standards. The locations included Site 1 (S1) at Irrigation Colony, Site 2 (S2) at Sabz Ali Town, Site 3 (S3) at Almassa Model Town, Site 4 (S4) at Garhi Sherdad, and Site 5 (S5) at Kochyan Payan. The samples were extracted from a depth of 2 m, ensuring proximity to the water table for a more accurate representation of the subsurface conditions. Undisturbed soil samples were extracted using shelby tubes and block samplers, ensuring the preservation of natural moisture content by sealing the ends with wax and polythene. The samples were immediately transported to the laboratory for testing. Various tests, including particle size distribution, specific gravity, plasticity, shear strength, and consolidation potential, were conducted to comprehensively assess the soil properties. The data obtained were analyzed using geotechnical methods to evaluate the soil’s behavior under different loading conditions.

Figure 1. Map showing the sample collection sites along Warsak Road, Peshawar (Wikipedia and Khyber Pakhtunkhwa, 2024; Ahmad et al., 2013).
The particle size distribution was evaluated using ASTM D422 standards (ASTM D422, 2018). Coarse particles were analyzed through sieve analysis, which involved stacking sieves of progressively smaller apertures and using a mechanical shaker to separate and classify the soil particles by size. Similarly, hydrometer analysis was performed for finer particles smaller than 0.075 mm by mixing the soil with a dispersing agent and creating a soil-water suspension. The mixture was then homogenized using a mechanical stirrer (Figure 2A) and placed in hydrometer cylinders within a water bath (Figure 2B) to measure the relative density of the suspension at specified time intervals. This provided a detailed understanding of the distribution of both coarse and fine particles within the soil samples.
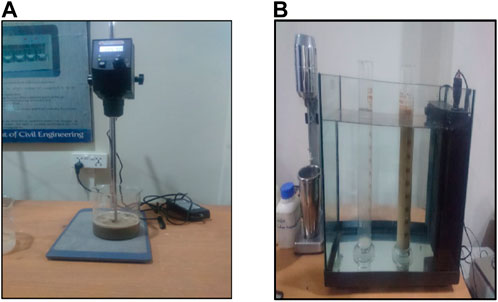
Figure 2. Procedure for hydrometer analysis, including (A) suspension mixing, and (B) Hydrometer cylinders in a water bath for sedimentation analysis.
The index properties of the soil were assessed through Specific Gravity Test (SGT) and Atterberg Limits Test (ALT). The SGT, conducted according to ASTM D854 standards (ASTM D854, 2023), determined the ratio of the mass of the soil to the mass of an equivalent volume of water, indicating the soil’s density relative to water. The test began with the preparation of the soil sample and water. The specific gravity flask was then filled and weighed to determine the mass of the soil relative to water for accurate density calculation. Additionally, the ALT (ASTM D4318, 2017), which included the determination of liquid limit and plastic limit, was carried out to assess the plasticity characteristics of the soil. Figure 3A shows that the initial soil sample was weighed before testing. The liquid limit was determined using the Casagrande device (Figure 3B), while the plastic limit was evaluated by rolling soil threads into uniform sizes (Figure 3D). After achieving a plastic state, the sample was weighed again to measure the plastic limit, as illustrated in Figure 3C. These tests help classify the soil’s consistency and establish its plasticity index, a key factor in understanding its behavior under various moisture conditions.
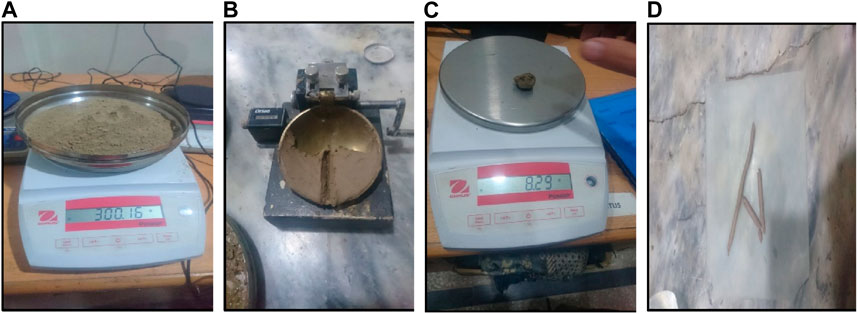
Figure 3. Various stages of the Atterberg Limits tests, including (A) sample weighing, (B) determination of Liquid Limit using the Casagrande device, (C) measuring the Plastic Limit, and (D) rolled soil threads to assess soil plasticity.
The strength characteristics of the soil were determined through a series of standardized tests. The Direct Shear Test (DST), conducted according to ASTM D3080 (ASTM D3080-04, 2012), was used to evaluate the shear strength parameters, including ultimate and residual shear stresses, which are essential for assessing soil stability and designing retaining structures. The soil specimen was carefully placed in the direct shear box, and the load application device was set up for testing. Additionally, the Unconfined Compression Test (UCT) was performed following ASTM D2166 to measure the undrained shear strength of cohesive soils without lateral confinement (ASTM D2166 − 06, 2007). As illustrated in Figure 4A, the soil specimen was trimmed to the required dimensions before testing. The final prepared specimen is shown in Figure 4B, while Figure 4C depicts the weighing of the trimmed sample to record its initial mass prior to the compression test. In the field, the Standard Penetration Test (SPT) was employed to determine the relative density and bearing capacity of the soil, where the number of hammer blows required to drive a standard sampler into the soil served as an index for soil strength (ASTM D1586-18, 2018).
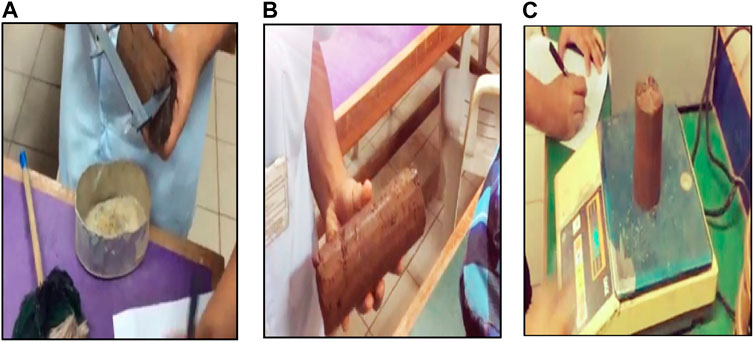
Figure 4. Sequence of specimen preparation and measurement for the Unconfined Compression Test (A) trimming the soil sample to required dimensions, (B) final prepared specimen, and (C) weighing the specimen for initial mass determination.
The consolidation characteristics of the soil were analyzed using the Oedometer Test (OT) in accordance with ASTM D2435 standards (ASTM D2435/D2435M − 11, 2011). As shown in Figure 5A, the soil specimen was carefully placed in the consolidation ring before testing. Incremental loads were then systematically applied using the oedometer apparatus, illustrated in Figure 5B, to measure settlement over time. The detailed configuration of the consolidation cell is depicted in Figure 5C, allowing for accurate determination of key consolidation properties such as compression and swelling indices. Incremental loads were applied systematically to measure settlement over time, allowing for the determination of key consolidation properties such as compression and swelling indices. This data was used to evaluate the potential for long-term settlement and to predict the soil’s behavior under varying loading conditions, ensuring accurate foundation design and stability assessments.
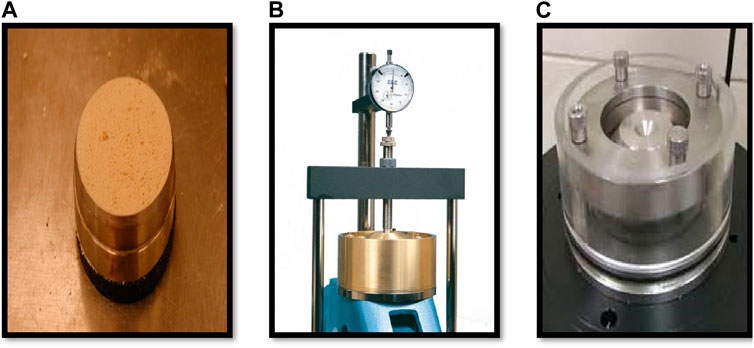
Figure 5. Setup and procedure for the OT, including; (A) placement of the soil specimen in the consolidation ring, (B) Oedometer apparatus for applying incremental loads and recording settlement, and (C) consolidation cell setup used for detailed measurement of soil compression and swelling properties.
In this section, the numerical modeling of the geotechnical properties of clayey soils along Warsak Road was carried out using PLAXIS software. The purpose of this modeling was to simulate soil behavior under various loading conditions and validate the laboratory findings. Parameters such as cohesion, angle of internal friction, Poisson’s ratio, and Young’s modulus, derived from laboratory tests (e.g., DST and UCT), were incorporated into the PLAXIS model to represent the soil accurately. The soil layers were defined using the measured properties from each sample location, and appropriate boundary conditions were applied to simulate the real-world field conditions. A standard downward displacement was applied to evaluate the deformation response and bearing capacity of the soil, enabling a comparison with empirical methods such as Meyerhof and Vesic bearing capacity equations (Das, 2009; Sedmak Vesić, 1973). The numerical results were analyzed to assess key factors such as settlement, stress distribution, and shear strain within the soil matrix. These outputs were then cross-validated with the results obtained from traditional analytical methods and laboratory experiments to ensure consistency and reliability.
The Meyerhof bearing capacity equation for calculating the ultimate bearing capacity of a shallow foundation is expressed in Equation 1 as follows:
where:
c = Soil cohesion (kN/m2)
γ = Unit weight of the soil (kN/m³)
D = Depth of foundation (m)
B = Width of foundation (m)
Nc, Nq, Nγ = Meyerhof bearing capacity factors (dependent on soil friction angle ϕ)
Sc, Sq, Sγ = Shape factors
Dc, Dq, Dγ = Depth factors
Ic, Iq, Iγ = Inclination factors
The Meyerhof equation expands upon the classic Terzaghi bearing capacity equation by incorporating shape, depth, and inclination factors. However, for cases where the applied load is perpendicular (no inclination), the inclination factors Ic, Iq, Iγ are considered equal to 1, simplifying the Equation 1 to Equation 2:
For cohesive soils (ϕ = 0), the third term becomes zero (Nγ = 0), and for clays where Nq = 1, the second term also becomes zero, reducing the Equation 2 to Equation 3:
The bearing capacity factors, which are essential for evaluating soil strength parameters, can be calculated using Equations 4–6:
These equations enable a more refined calculation of bearing capacity, accommodating variations in soil cohesion and internal friction angle (ϕ\phiϕ) for accurate structural design.
The Vesic bearing capacity equation further extends the Meyerhof approach by incorporating additional factors for more complex loading conditions. It is represented as Equation 7:
where bc, bq, bγ are modification factors that account for footing inclination relative to the horizontal. The bearing capacity factors are given by Equations 8–10:
These additional factors enable Vesic’s equation to provide a more comprehensive evaluation of bearing capacity, accounting for variations in footing inclination, shape, and depth, thereby making it suitable for scenarios involving complex soil-structure interactions.
The methodology detailed in the preceding sections provides a comprehensive framework for evaluating the geotechnical properties of cohesive soils along Warsak Road. By combining laboratory experiments, numerical modeling, and analytical methods, this study aims to present a multi-faceted understanding of soil behavior under varying conditions. The experimental tests yielded critical data on soil consolidation, shear strength, and other key properties, while numerical simulations using PLAXIS offered insights into stress distribution and load-bearing capacities. The results derived from these approaches are systematically analyzed and discussed, with a focus on how the findings address the research objectives and contribute to existing geotechnical knowledge.
This chapter presents the results obtained from various geotechnical tests conducted on the soil specimens, including Sieve Analysis, Hydrometer Test, Pycnometer Test, ALT, SPT, UCT, DST, and OT. The findings provide a detailed evaluation of the soil’s physical and mechanical properties, offering insights into its suitability for construction and foundation stability. Each test result is discussed in relation to its relevance for the soil’s structural behavior and engineering characteristics.
To evaluate the soil gradation for all five sites, the collected soil samples from each site were grouped and averaged based on the three samples taken per location, following ASTM D422 standards. Each grouped sample was analyzed using a standard set of sieves to classify the soil into distinct particle size fractions, ranging from gravel-sized particles to fine sand and silt. The proportion of soil retained on each sieve was recorded to determine the average percentage for each size fraction per site. For finer particles passing through sieve No. 200, hydrometer analysis was performed according to ASTM D422 standards to classify particles smaller than 0.075 mm (ASTM D422, 2018). The results were then plotted as semi-log particle size distribution curves, representing the average gradation profile for each site, as shown in Figure 6. This approach provided a comprehensive view of soil gradation characteristics, clearly comparing soil properties across the five distinct sampling locations.
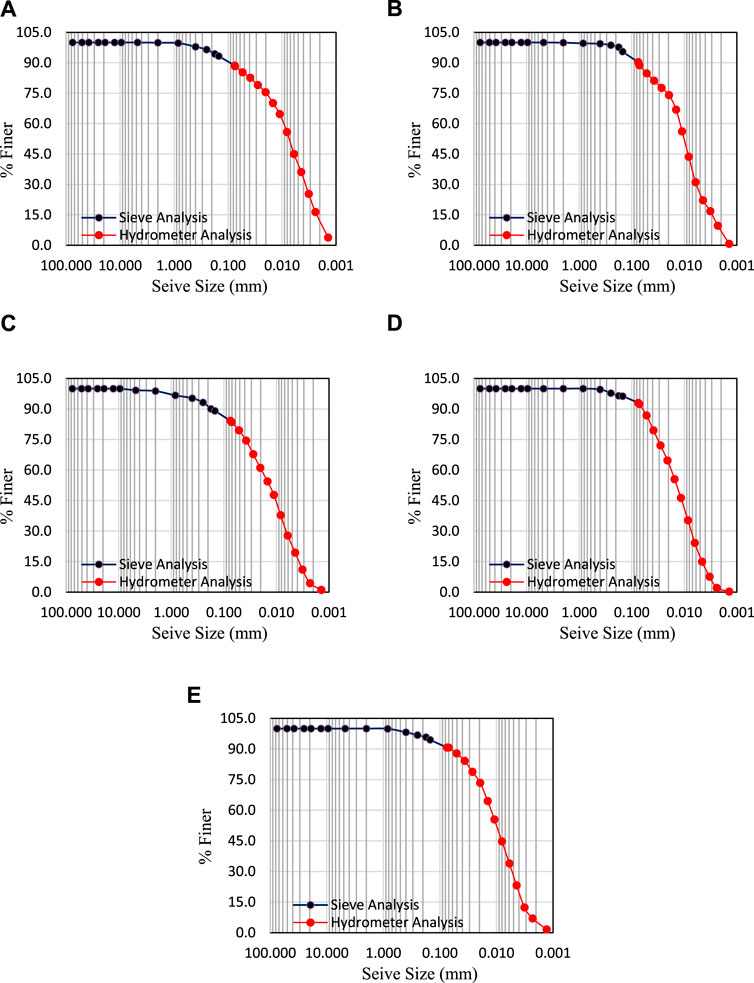
Figure 6. Particle size distribution curves for the average values of soil samples from each of the five sites: (A) S1, (B) S2, (C) S3, (D) S4, and (E) S5.
The particle size distribution curves for the soil samples collected from all five sites (S1 to S5) provide a comprehensive analysis of soil gradation along Warsak Road, highlighting variations in soil composition and behavior. Samples from S1 and S5 show well-graded characteristics with balanced proportions of coarse and fine particles, making them suitable for construction applications due to better compaction and stability. In contrast, samples from S4, dominated by a high percentage of fine particles, indicate poor shear strength and high compressibility, necessitating soil stabilization before structural use. Samples from S2 and S3 fall between these extremes. S2 samples have a higher proportion of fine particles, resulting in lower permeability and higher consolidation potential, while S3 samples offer a relatively uniform distribution, making them a viable option for sub-base materials.
The ALT and SGT were performed on the averaged soil samples from each of the five sites to evaluate their physical and plastic characteristics. The ALT, conducted according to ASTM D4318 standards, classified the samples based on their plasticity properties, distinguishing between high, intermediate, and low plasticity clays and silts for each site (ASTM D4318, 2017). The results are illustrated in Figure 7, which shows the relationship between water content and number of blows (Figures 7A, C, E, G, I) and the corresponding Plasticity Index vs Liquid Limit classifications (Figures 7B, D, F, H, J) for the samples from each site. The classification of the soil samples is represented using standard symbols to identify the type and plasticity of each soil. The symbols include CH for high plasticity clay, CI for intermediate plasticity clay, CL for low plasticity clay, MH for high plasticity silt, ML for low plasticity silt, OH for high plasticity organic soil, and OL for organic low plasticity silt. These classifications provided clear distinctions among the soil samples from the five sites, aiding in understanding their behavior and suitability for different engineering applications. The classification symbols were utilized consistently across all graphical representations to facilitate easy comparison and interpretation of the test results.
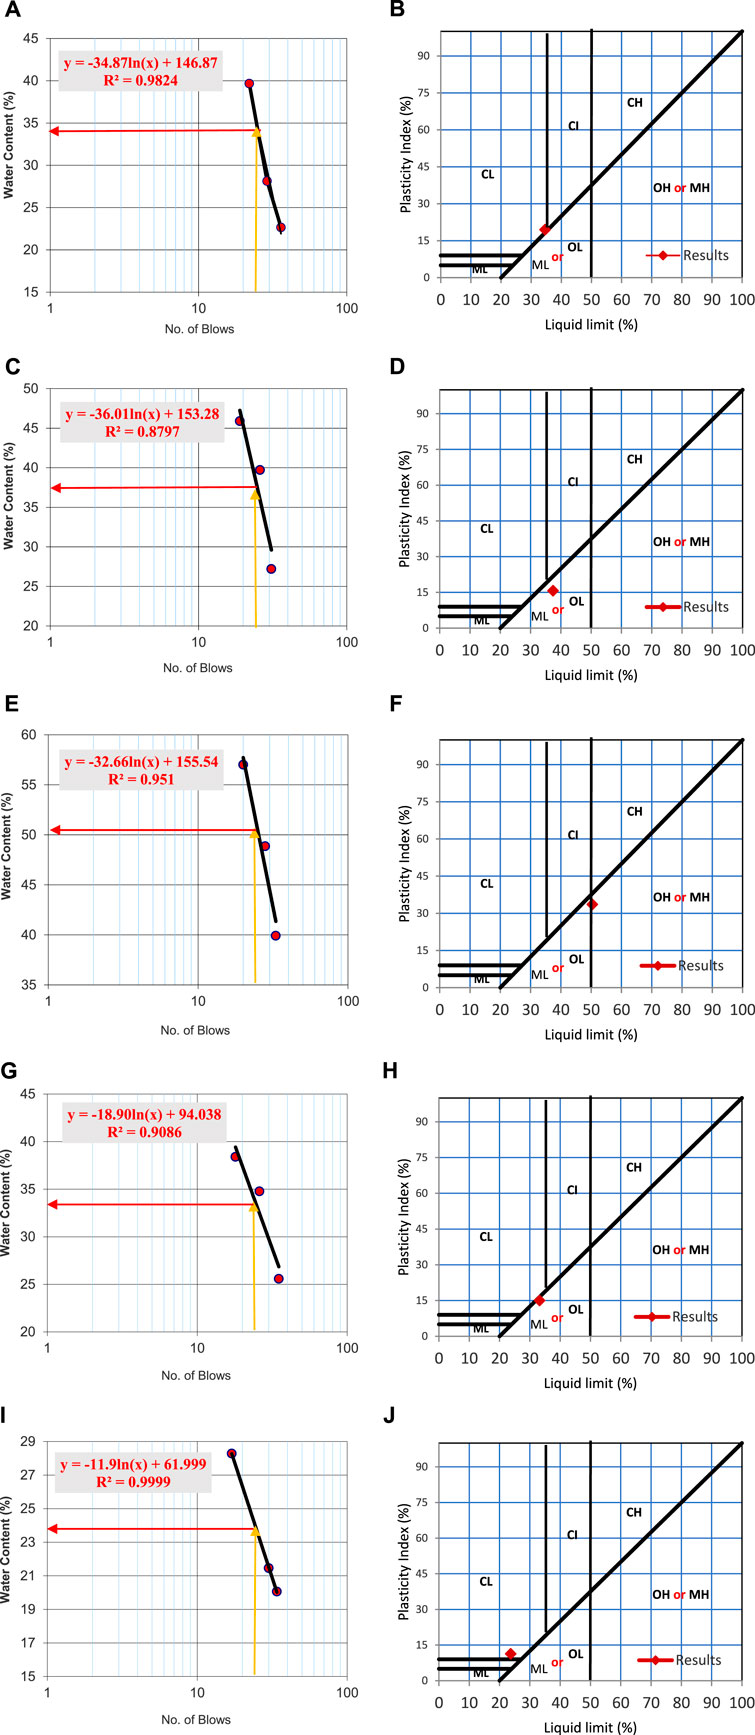
Figure 7. Summary of Atterberg Limits test results for the averaged soil samples from each of the five sites, with (A, C, E, G and I) showing water content vs number of blows for each site and (B, D, F, H and J) corresponding Plasticity Index vs Liquid Limit classification plots.
The Atterberg Limits focus on the soil’s plastic and liquid limits, which are more directly related to clay content and behavior under varying moisture conditions. Even though soil from S1 and S5 is well-graded, its classification as CL based on Atterberg results suggests that the fines present in these samples are predominantly clay particles, which can influence their plastic behavior under certain conditions. In contrast, soil samples from S2, S3, and S4, despite being classified as OL/ML, show distinct characteristics due to the nature and proportion of their fine content. Soil from S2, with a relatively low R2 value of 0.8797, indicates erratic behavior and greater variability in response to moisture changes, suggesting a mixture of organic matter or variable fine materials, making it less predictable and less suitable for foundation purposes without stabilization. The sample from S3, on the other hand, has a higher R2 value of 0.951, implying more uniformity in particle distribution and a stable behavior under varying moisture conditions, making it a better candidate for construction applications than S2, despite both being in the same classification range. S4 soil, with an R2 value of 0.9086, falls between S2 and S3 in terms of stability and predictability. Its classification as OL/ML suggests that while it is low in plasticity, it may also include organic content, contributing to its moderate compressibility and inconsistent behavior. Therefore, like S2 soil, it would require stabilization before being considered for structural applications, especially in load-bearing scenarios. Overall, soil from S1 and S5 is better suited for foundational support due to their classification as CL, whereas soil from S2, S3, and S4 exhibit higher compressibility and variability, necessitating careful consideration and potential stabilization measures to ensure structural integrity in engineering applications.
Similarly, the SGT, performed according to ASTM D854 standards, was used to determine the relative density of the soil samples collected from the five sites, averaged from three samples per site, compared to water (ASTM D854, 2023). This test is critical in understanding the soil’s mineral composition and particle density, which directly influences its compaction and stability under load-bearing conditions. The specific gravity values, averaged for each site, help in evaluating the suitability of the soil for construction applications, as higher values typically indicate denser and more stable soil materials that are better suited for supporting structural loads.
Table 1 summarizes the specific gravity results of the average soil samples collected from five distinct sites along Warsak Road, with three soil samples taken from each site. The specific gravity values for these grouped samples range from 2.58 to 2.72, indicating varying mineral compositions and potential organic content across the locations. The soil from S1 and S5 have the highest specific gravity values (2.71 and 2.72, respectively), suggesting a predominance of inorganic and denser mineral particles, making them more suitable for construction applications. In contrast, the soil from S2, with a specific gravity of 2.58, reflects lower density, potentially due to a higher proportion of organic matter or lightweight minerals, making it less stable without treatment. Soil from S3 (2.64) and S4 (2.62) show intermediate characteristics, indicating a mix of silty or organic materials, aligning with earlier classifications of low plasticity. Overall, these variations highlight the need for tailored stabilization measures for soil from Sites 2, 3, and 4 to ensure structural integrity, while the soil from Sites 1 and 5 demonstrates better suitability for direct use in foundational support.
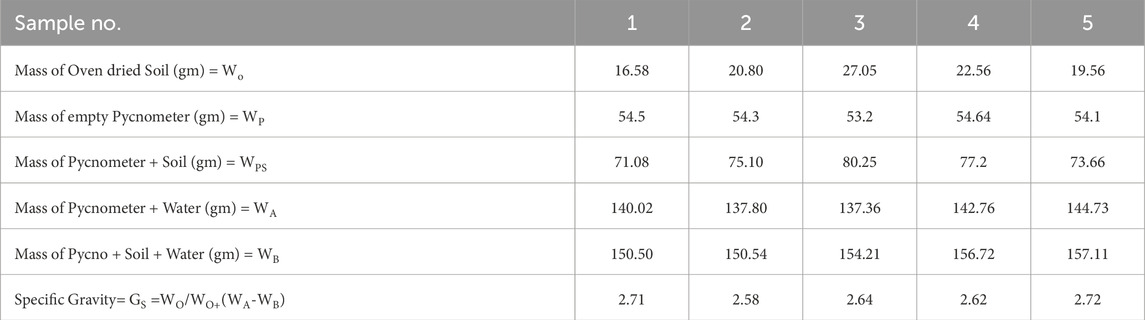
Table 1. Specific gravity values of average soil samples from five different sites along Warsak Road.
The Direct Shear Test (DST) was conducted on the averaged soil samples from each of the five sites according to ASTM D3080 standards, and the shear strength parameters (cohesion and angle of internal friction) were determined for each site (ASTM D3080-04, 2012). Figure 8A represents the results for the soil from Site 1, which exhibited a cohesion of 18.22 kN/m2 and an internal friction angle of 1.05°, indicating moderate shear strength and good stability under applied loads. Figure 8B illustrates the results for the soil from Site 2, displaying slightly lower cohesion at 15.23 kN/m2 but a comparable friction angle of 1.1°, signifying reasonable shear resistance. Figure 8C corresponds to the soil from Site 3, showing a cohesion value of 13.3 kN/m2 and a friction angle of 1.04°, reflecting a further decrease in shear strength and making it less ideal for supporting heavy loads. Figure 8D represents the soil from Site 4, which had the lowest cohesion value of 9.94 kN/m2 and a similar friction angle of 1.1°, classifying it as the weakest in terms of shear strength, suggesting a need for reinforcement in high-stress applications. In contrast, Figure 8E shows the soil from Site 5 with the highest cohesion at 20.2 kN/m2 and the steepest friction angle of 1.24°, indicating superior shear strength and stability.
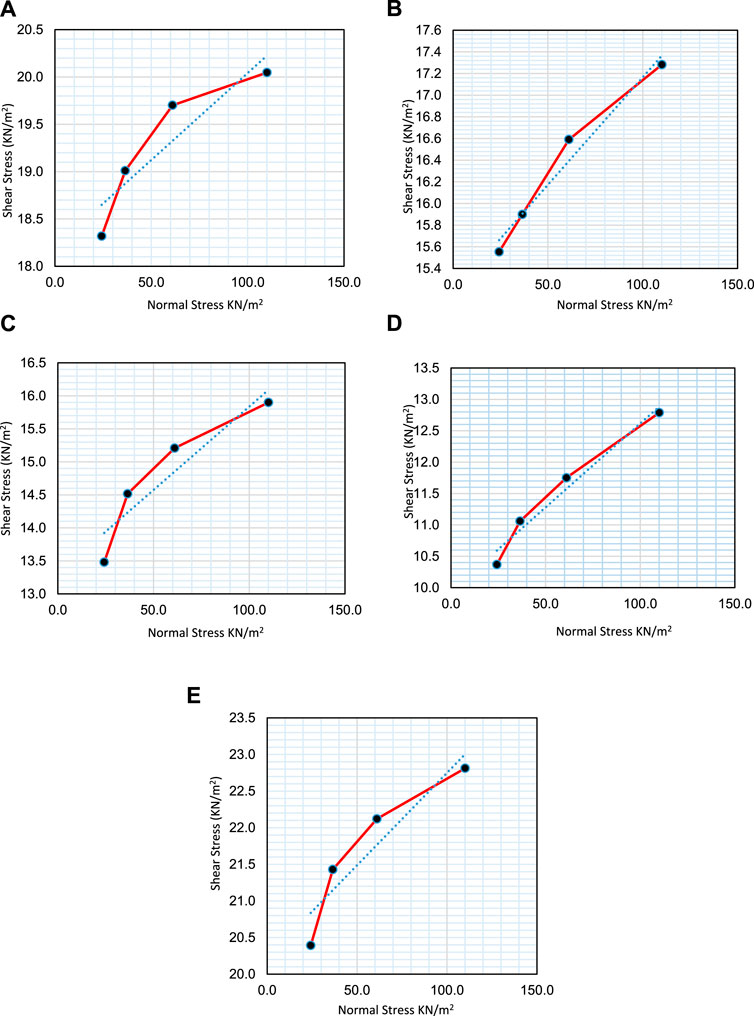
Figure 8. Shear stress vs. normal stress graphs derived from the Direct Shear Test for soil samples collected from five sites: (A) S1, (B) S2, (C) S3, (D) S4, and (E) S5.
Based on these results, the soils can be categorized as follows: Soils from S1, S2, and S3 fall into the category of medium-strength clayey soils with varying degrees of shear resistance. In contrast, the soil from Site 4, with its low cohesion and minimal friction angle, represents a weak soil type, indicating limited stability under applied loads. The soil from Site 5, on the other hand, is classified as a strong, cohesive soil with high shear resistance, making it more suitable for supporting heavier structural loads. These variations are critical for determining the appropriate foundation strategies for construction projects across different locations along Warsak Road.
The UCT was conducted on three soil samples from each of the five sites along Warsak Road, following ASTM D2166 standards, to evaluate the average compressive strength and behavior under axial loading (ASTM D2166 − 06, 2007). The prepared samples were uniform with a diameter of 5.00 cm and a length of 10.00 cm, giving a consistent length-to-diameter (L/D) ratio of 2.00 for each specimen. Each sample had a cross-sectional area of 19.63 cm2 and a volume of 196.25 cm³. After averaging the results from each group of three samples, S1 showed an average bulk unit weight of 1.76 g/cm³ and moisture content of 18.90%, reflecting moderate compressive strength characteristics. S2 had a slightly lower average bulk unit weight of 1.73 g/cm³ and a moisture content of 17.30%, indicating lower stability. S3 with an average bulk unit weight of 1.74 g/cm³ and moisture content of 19.10%, displayed moderate compressive strength. In contrast, S4 exhibited the lowest bulk unit weight at 1.74 g/cm³ and the lowest moisture content at 14.30%, suggesting a weaker soil structure. S5 showed the highest average bulk unit weight of 1.80 g/cm³ and a moisture content of 26.60%, indicating strong water retention and higher stability. These variations in average values across sites emphasize the need for tailored engineering solutions based on the specific compressive strength and load-bearing characteristics of each location.
The compressive strength and axial deformation of soil samples were analyzed based on the average values obtained from three samples per site. The results show variations in the unconfined compression behavior for each location, as illustrated in Figure 9. The average compressive strength for the soil from S1 (Figure 9A) was 15.18 kN/m2 at a displacement of 1.3 mm, indicating moderate stability and suitability for moderate structural loads. For S2 (Figure 9B), the average peak compressive stress was 14.27 kN/m2 at the same displacement, reflecting lower stability and cohesion, making this site’s soil less ideal for heavy load-bearing without additional stabilization. The soil from S3 (Figure 9C) averaged a peak compressive stress of 15.79 kN/m2, suggesting moderate strength comparable to S1, suitable for medium-load applications. In contrast, the soil from S4 (Figure 9D) had the lowest average compressive strength at 11.21 kN/m2, indicating weak compressive resistance and suggesting the need for reinforcement before being used in high-load applications. Finally, the soil from S5 (Figure 9E) exhibited the highest average compressive strength of 17.53 kN/m2 at 1.3 mm displacement, making it the most suitable for supporting heavier structural loads.

Figure 9. Unconfined compressive strength and axial deformation curves for soil samples collected from different sites along Warsak Road, illustrating their distinct responses under unconfined loading conditions for (A) S1, (B) S2, (C) S3, (D) S4, and (E) S5.
These average values highlight the significant differences in soil behavior across the sites. Soils from Sites 1, 3, and 5 demonstrate higher stability and strength, while those from Sites 2 and 4 show greater compressibility and lower cohesion, necessitating targeted stabilization strategies to ensure safe and stable foundation conditions.
The SPT was performed at five distinct sites along Warsak Road to evaluate the soil’s bearing capacity. At each site, three boreholes were drilled, and N-values were recorded at 2 and 5 m’ depth in each borehole, providing a more comprehensive assessment of the soil’s resistance. The N-values obtained from the three boreholes at each depth were averaged to calculate a representative Nₐᵥₑ for the site, ensuring reliable data on soil strength and stability. The Nₐᵥₑ values were then used to calculate the allowable bearing capacity, highlighting the soil’s suitability for supporting foundations and construction activities. At S1, an average Nₐᵥₑ value of 7 was obtained from the boreholes, resulting in an allowable bearing capacity of 57.45 kN/m2, which indicates that the soil can support moderate structural loads, making it suitable for standard shallow foundations. S2 showed a slightly lower Nₐᵥₑ value of 6.5, leading to an allowable bearing capacity of 47.88 kN/m2, suggesting a less compact soil profile compared to S1. At S3, the Nₐᵥₑ value was 6.0, resulting in an allowable bearing capacity of 38.30 kN/m2, reflecting a weaker soil profile that may require deep foundations or soil improvement. S4 recorded the lowest Nₐᵥₑ value of 5.0, yielding an allowable bearing capacity of 19.16 kN/m2, categorizing it as loose and highly compressible soil that would require significant stabilization for safe construction. Conversely, S5 exhibited an Nₐᵥₑ value of 7.0, resulting in the highest allowable bearing capacity of 57.60 kN/m2, indicating a dense, well-compacted soil capable of supporting heavier structural loads. These variations highlight the need for tailored foundation strategies based on specific site conditions to ensure long-term stability and safety.
The OT was conducted to evaluate the consolidation potential of the soil samples, and provided detailed insights into the consolidation behavior and soil properties at a depth of 1.5 m, following ASTM D2435 standards (ASTM D2435/D2435M − 11, 2011). The test involved applying incremental loads to the specimens and recording the resulting displacements at specified time intervals. The key parameters calculated from these measurements include void ratios, coefficient of consolidation (Cv), and coefficient of permeability (K). The samples demonstrated varying levels of over-consolidation ratios (OCR), indicating their consolidation history and current stress conditions. The key soil properties measured for each sample are detailed in Table 2 below.
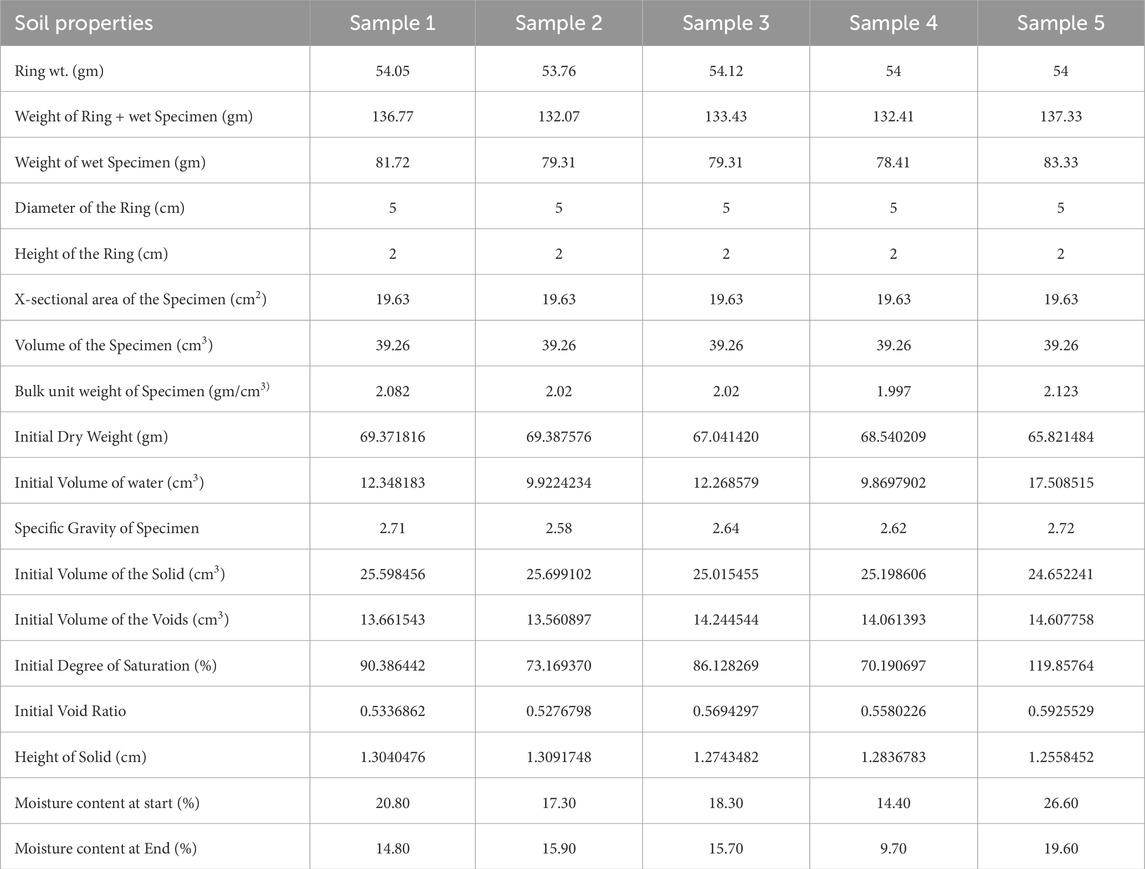
Table 2. Detailed geometric and physical properties of soil specimens for OT.
The results from the OT, as illustrated in Figures 10A–E, provide a visual representation of the soil behavior discussed in the earlier analyses for the soil samples collected from S1 through S5. Each graph shows the deformation of soil under varying pressure conditions, offering insights into the compressibility and consolidation potential of each site. For S1 as shown in Figure 10A, the deformation trend remains low across all loading stages, indicating that the soil is relatively resistant to compression. This behavior is consistent with its classification as a CL and its high cohesion value of 18.22 kN/m2, making it suitable for moderate structural loads. The specific gravity value of 2.71 further supports its stability and low compressibility, making it an ideal candidate for foundation applications.
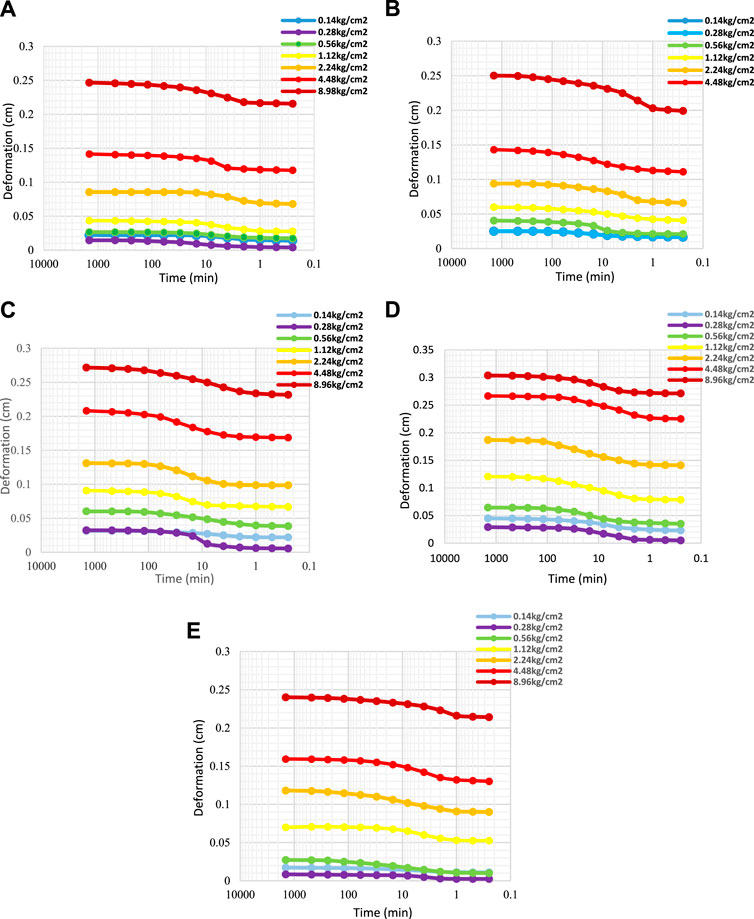
Figure 10. Time-Deformation Curves for Oedometer Tests on Soil Samples, showing settlement behavior under varying pressures for soil samples from (A) S1, (B) S2, (C) S3, (D) S4, and (E) S5.
In contrast, the deformation pattern for soil from S2 in Figure 10B reveals a higher degree of compressibility, as evidenced by the steeper deformation curve under increasing pressures. This aligns with its classification as OL and its lower specific gravity value of 2.58, indicating higher water retention and lower shear strength. The OT results also show that S2 has moderate consolidation potential, requiring reinforcement for construction use due to its relatively low cohesion of 15.23 kN/m2. Despite being in the same OL classification, soil from S3 (Figure 10C) displays a more predictable and uniform deformation pattern compared to S2, suggesting better consolidation and load-bearing capacity. This is reflected in the intermediate specific gravity value of 2.64 and a slightly higher cohesion of 13.3 kN/m2. The moderate deformation and higher stability under load make S3 more favorable than S2, though it remains less ideal than S1 for supporting heavier structures.
The deformation curve for S4 (Figure 10D) shows a sharp increase in deformation with higher loads, indicating high compressibility and low shear strength, making it unsuitable for load-bearing applications without stabilization. This is consistent with its classification as OL and its low cohesion value of 9.94 kN/m2. The specific gravity value of 2.62 further reflects its less dense nature, correlating with its poor consolidation performance in the Oedometer Test. As such, soil from S4 would require significant reinforcement before it could be considered for any structural support. In contrast, S5, depicted in Figure 10E, exhibits minimal deformation even under high pressure, confirming its suitability for heavy structural applications. The high specific gravity of 2.72, coupled with the highest cohesion value of 20.2 kN/m2, indicates excellent stability and resistance to compressive forces. This is further supported by its classification as a CL, making Site 5 the strongest and most stable soil among all the tested sites. Its deformation curve quickly stabilizes at higher pressures, reflecting its low compressibility and high bearing capacity, making it ideal for multi-story buildings and heavy structural applications.
Overall, the deformation patterns in Figures 10A–E align well with the conclusions drawn from the ALT, DST, and UCT results for the soil samples collected from S1 through S5. Soils from S1 and S5 are the most suitable for foundational support, showing the least deformation and highest shear strength, making them ideal candidates for construction applications. Conversely, the soils from Sites 2, 3, and 4, despite their similar OL classification, display distinct differences in compressibility and stability, necessitating careful engineering interventions, such as stabilization techniques, to enhance their suitability for construction purposes.
The data analysis was conducted using PLAXIS version 8.6, a finite element software tailored for deformation and stability analysis in geotechnical engineering and rock mechanics. The software operates in three primary stages: input, calculation, and output. The input stage involves defining the soil model parameters such as cohesion, angle of internal friction, Poisson’s ratio, angle of dilation, modulus of compressibility, void ratio, and bulk unit weight, most of which were obtained from experimental results as shown in Table 3. The process began by inputting these parameters, selecting the soil geometry, and defining the groundwater table position. Boundary conditions were applied, including fixities and a standard displacement of 0.025 m in the downward direction to simulate loading.
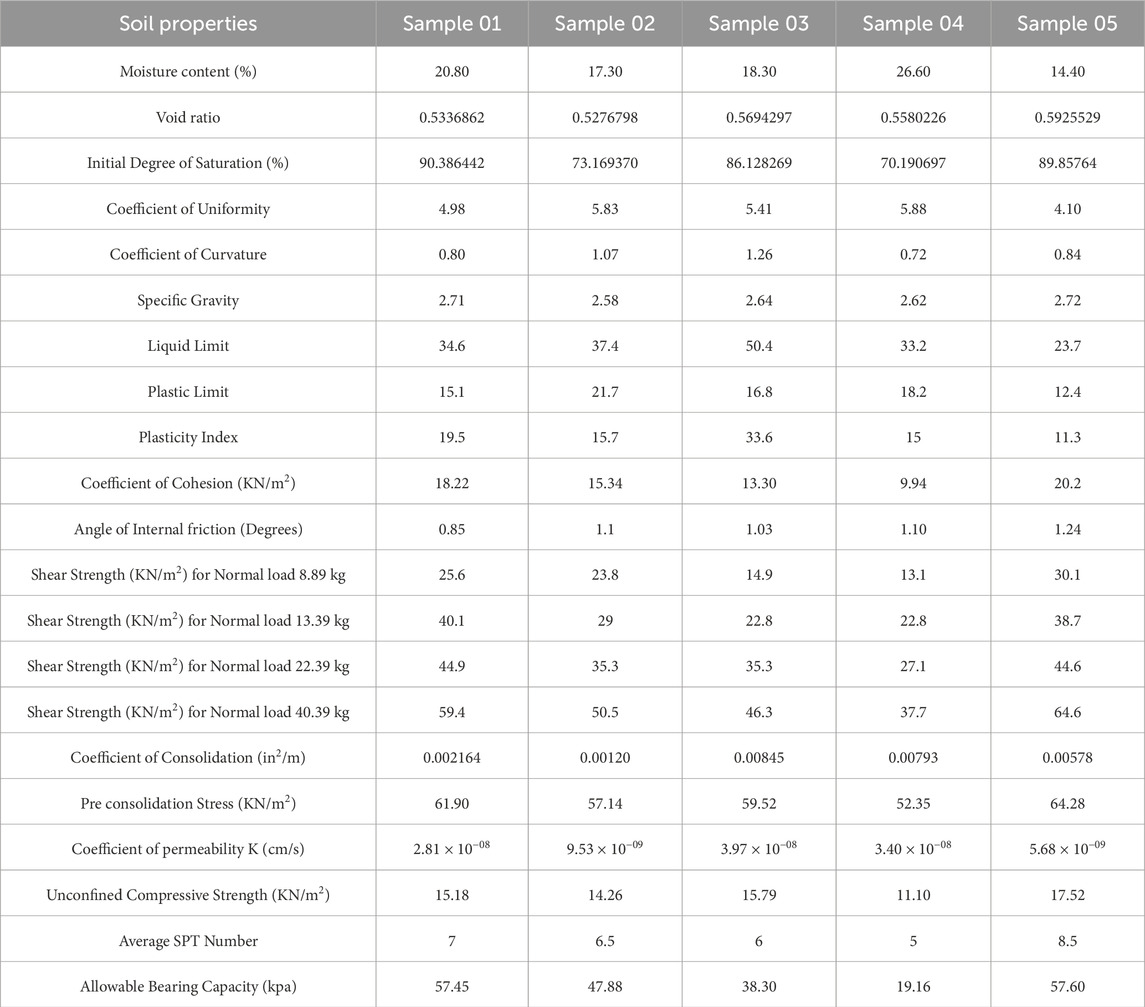
Table 3. Soil specimen properties for analysis.
The initial phase of the analysis examined the soil’s response to the applied displacement, revealing distinct deformation behaviors for each soil type. In the second phase, the reaction forces generated within the soils were calculated, representing the stress required to achieve the specified displacement. This allowed for a detailed assessment of each soil specimen’s resistance and load-bearing capacity. The final phase involved generating graphical and tabulated outputs to illustrate the deformation patterns within the soil strata. These results were represented as force-displacement curves, showing the relationship between the applied force and the resulting soil deformation.
The compiled data sets were then compared to highlight variations in soil response. To validate the analysis, the results were compared against theoretical values obtained using Meyerhof’s bearing capacity equations, enabling a comprehensive evaluation of the soil’s design capacity.
Using the specified inputs in PLAXIS as shown in Table 3 and accurately defining the ground conditions, the resulting soil behavior and deformation response are illustrated in Figures 11A–E, which showcases the stress distribution patterns within the soil profiles under varying conditions of applied displacement. Each figure represents the unique stress contours and deformation patterns for all five site samples:
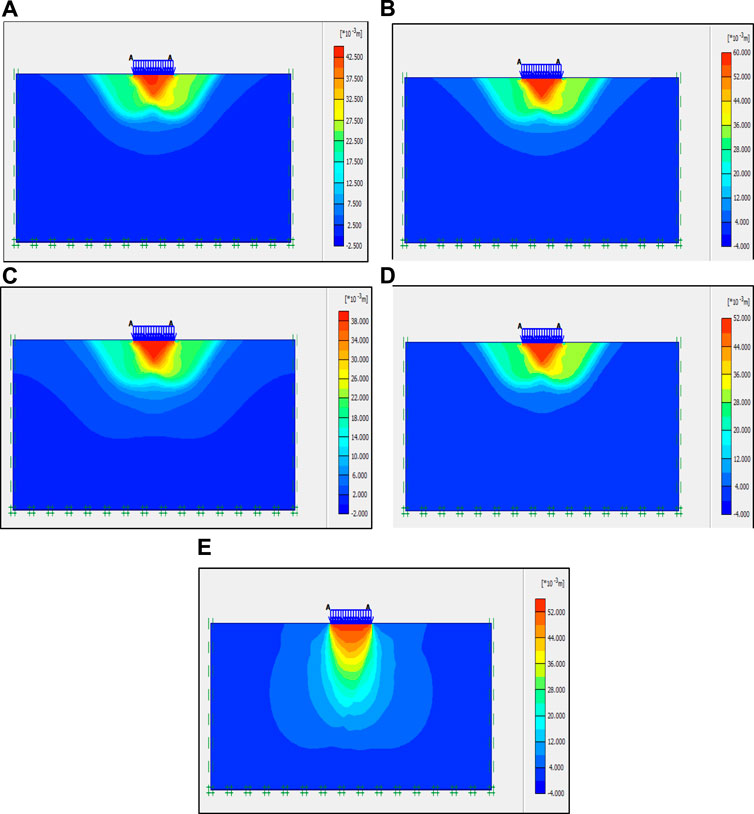
Figure 11. Stress distribution patterns within the soil profile under varying conditions of applied displacement for sites (A) S1, (B) S2, (C) S3, (D) S4, and (E) S5.
The PLAXIS analysis results indicate that the soil’s load-bearing capacity ranges from 55.08 kN/m2 to 111.1 kN/m2. The soil of S4 exhibited the lowest bearing capacity due to the presence of a shallow water table, while S5 demonstrated the highest capacity, attributed to lower moisture content and higher inter-particle cohesion as shown in the Figure 12. While Figure 13 illustrates the comparative results of the ultimate bearing capacity of five site soil samples, evaluated using three distinct methodologies: the Meyerhof equation, the Vesic equation, and the PLAXIS finite element analysis.
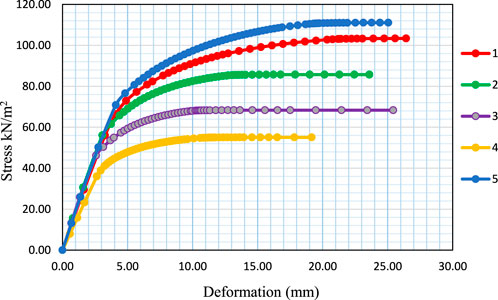
Figure 12. Stress versus Deformation curves for sites S1, S2, S3, S4, and S5, illustrate the variation in load-bearing capacity and stiffness characteristics for each site soil sample.
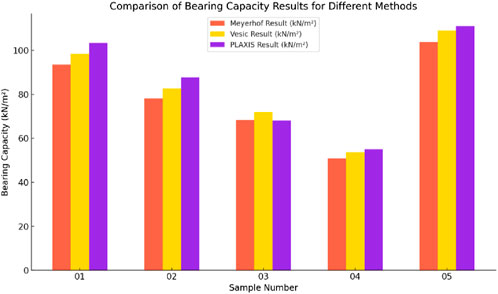
Figure 13. Comparison of ultimate bearing capacity results using different methods.
For S1 sample, the Meyerhof method yielded a bearing capacity of 93.54 kN/m2, Vesic provided a slightly higher capacity of 98.38 kN/m2, and the PLAXIS analysis reported the highest value of 103.37 kN/m2. The incremental increase in PLAXIS values suggests that this method better captures soil deformation and stress distribution due to its numerical modeling capabilities. S2 sample exhibited a similar pattern, with Meyerhof at 78.12 kN/m2, Vesic at 82.62 kN/m2, and PLAXIS at 87.76 kN/m2. This trend is consistent with the increased detail in stress-strain behavior accounted for by the finite element analysis in PLAXIS. For S3 sample, the results from all three methods were closer, with Meyerhof at 68.36 kN/m2, Vesic at 71.82 kN/m2, and PLAXIS at 68.01 kN/m2. The convergence of values suggests that the soil properties in this sample are relatively insensitive to the additional shape and depth factors considered in Vesic’s approach, leading to minimal variation between methods. In the S4 sample, the lowest bearing capacities were observed due to the presence of a shallow water table, which significantly weakened the soil’s load-bearing capacity. Meyerhof recorded 50.88 kN/m2, Vesic 53.67 kN/m2, and PLAXIS 55.08 kN/m2. The slightly higher PLAXIS value may be attributed to its ability to account for the influence of moisture content more comprehensively. Finally, S5 sample showed the highest bearing capacities among all the samples, with Meyerhof at 103.82 kN/m2, Vesic at 109.08 kN/m2, and PLAXIS at 111.08 kN/m2. This is likely due to lower moisture content and higher inter-particle cohesion in the soil, which enhances its stability and resistance to deformation.
Overall, the results indicate that while the Meyerhof and Vesic methods provide reasonable estimates, the PLAXIS analysis consistently shows slightly higher bearing capacities for most samples. This is likely due to the ability of finite element modeling to incorporate complex soil behavior, deformation patterns, and stress redistribution more accurately. The Vesic method generally yields higher values compared to Meyerhof due to its consideration of additional shape, depth, and inclination factors, making it a more comprehensive analytical tool for estimating bearing capacity. This comparative analysis highlights the influence of analytical versus numerical modeling techniques in determining the load-bearing characteristics of soils. For practical applications, the PLAXIS results are recommended as they provide a more robust and detailed assessment of soil behavior under loading conditions.
While this study provides significant insights into the geotechnical properties of cohesive soils in high water table areas along Warsak Road, several limitations should be acknowledged:
1. The numerical modeling performed using PLAXIS software relies on several simplifying assumptions, including idealized boundary conditions and isotropic soil behavior. These assumptions, while necessary for computational feasibility, may not fully capture the complexities of real-world soil conditions.
2. The findings of this study are specific to the soil samples collected from Warsak Road and may not be directly applicable to other regions with different soil compositions, hydrogeological conditions, or loading environments. Variations in soil mineralogy, moisture content, and groundwater interactions in other areas could lead to significantly different outcomes.
3. While standardized laboratory tests provided valuable data, they may not fully replicate the dynamic and variable conditions encountered in the field, such as seasonal fluctuations in groundwater levels or heterogeneous subsurface conditions.
4. Although the study analyzed soil from five distinct sites, additional sampling points and a broader geographic coverage could provide a more comprehensive understanding of soil behavior in the region.
5. This study primarily focused on short-term soil behavior under controlled loading conditions. Long-term behavior, including creep, degradation, and environmental impacts, remains outside the scope of this research.
This study aimed to evaluate the shear strength and consolidation properties of cohesive soils along Warsak Road, Peshawar, to address geotechnical challenges posed by high groundwater levels. Five sites, spaced 5 km apart, were selected for comprehensive testing using Particle Size Distribution, Specific Gravity, Atterberg Limits, Unconfined Compression, Direct Shear, Oedometer, and Standard Penetration Tests, all in compliance with ASTM standards. Analytical methods, including Meyerhof and Vesic equations, and numerical simulations using PLAXIS software were employed for validation. The findings offer valuable insights into soil behavior under different conditions, forming the basis for recommendations to ensure safe construction practices in the region. The main conclusions are as follows:
1) The soil samples collected from the five different sites exhibited notable variability in shear strength and consolidation potential. An inverse relationship was observed, with samples displaying higher shear strength typically showing lower consolidation potential. This pattern was particularly evident in S1 and S5, which exhibited high shear strength and low compressibility, indicating their suitability for stable foundation support.
2) The high water table along Warsak Road significantly impacted the consolidation potential at several sites, notably in S4, which exhibited the lowest shear strength and highest compressibility. This highlights the critical influence of groundwater conditions on soil stability and underscores the importance of incorporating local water table variations into foundation design considerations.
3) Based on the observed shear strength and consolidation characteristics, shallow foundations are recommended for soil at S1 and S5, given their stability and low settlement potential. Conversely, the soils at S2, S3, and S4, which exhibited higher compressibility and reduced shear strength, require either deep foundation systems or soil stabilization measures to mitigate the risks of excessive settlement and potential structural instability.
4) The results from PLAXIS numerical modeling provided a more detailed understanding of the soil behavior, often yielding higher bearing capacity values compared to Meyerhof and Vesic’s analytical methods. This highlights the necessity of employing advanced numerical modeling in regions with complex soil conditions to complement traditional analytical approaches.
5) The study identified site-specific variations in soil properties, even within a relatively small geographical region along Warsak Road. This underscores the importance of conducting localized soil assessments to develop tailored foundation strategies that ensure structural stability and long-term safety.
6) By integrating experimental results with numerical and analytical modeling, the study offers a comprehensive evaluation of the shear strength and consolidation characteristics of the cohesive soils in high water table areas, providing practical guidelines for safe and effective foundation design in similar geotechnical settings.
The raw data supporting the conclusions of this article will be made available by the authors, without undue reservation.
NI: Conceptualization, Data curation, Formal Analysis, Investigation, Methodology, Validation, Visualization, Writing–original draft. MAK: Conceptualization, Data curation, Formal Analysis, Investigation, Methodology, Validation, Visualization, Writing–original draft. MSK: Data curation, Formal Analysis, Investigation, Validation, Visualization, Writing–review and editing. AK: Data curation, Software, Validation, Visualization, Writing–review and editing. MA: Investigation, Supervision, Validation, Writing–review and editing. MSS: Funding acquisition, Investigation, Resources, Validation, Writing–review and editing, Formal Analysis. MN: Data curation, Formal Analysis, Validation, Writing–review and editing. AA: Formal Analysis, Investigation, Validation, Writing–review and editing.
The author(s) declare that financial support was received for the research, authorship, and/or publication of this article. The research is partially funded by the Ministry of Science and Higher Education of the Russian Federation as part of the World-class Research Center program: Advanced Digital Technologies (contract No. 075-15-2022-311 dated 20.04.2022).
The authors declare that the research was conducted in the absence of any commercial or financial relationships that could be construed as a potential conflict of interest.
The author(s) declare that no Generative AI was used in the creation of this manuscript.
All claims expressed in this article are solely those of the authors and do not necessarily represent those of their affiliated organizations, or those of the publisher, the editors and the reviewers. Any product that may be evaluated in this article, or claim that may be made by its manufacturer, is not guaranteed or endorsed by the publisher.
Ahmad, M., Iqbal, Q., and Khan, F. A. (2013). PROFILING and zoning of geotechnical SUB-soil data liquid limit of soil plastic limit of soil pounds per cubic foot tons per square foot, 25, 531–537.
Al Adili, A., Azzam, R., Spagnoli, G., and Schrader, J. (2012). Strength of soil reinforced with fiber materials (Papyrus). Soil Mech. Found. Eng. 48, 241–247. doi:10.1007/s11204-012-9154-z
Krishna MuRTHY, T. S. N. M., Sridharan, A., and Nagaraj, T. (1981). Shear strength behaviour of overconsolidated clays. Soils Found. 21, 73–83. doi:10.3208/sandf1972.21.2_73
ASTM D1586-18 (2018). Standard test method for standard penetration test (SPT) and split-barrel sampling of soils. West Conshohocken, PA, USA: ASTM International, 1–10. doi:10.1520/D1586_D1586M-18E01
ASTM D2166 − 06 (2007). StandardTest method for unconfined compressive strength of cohesive soil. West Conshohocken, PA, USA: ASTM International, 1–3.
ASTM D2435/D2435M − 11 (2011). Standard test methods for one-dimensional consolidation properties of soils using incremental loading. West Conshohocken, PA, USA: ASTM International, 1–6. doi:10.1520/D2435_D2435M-11
ASTM D3080-04 (2012). Standard test method for direct shear test of soils under consolidated drained conditions, 7. West Conshohocken, PA, USA: ASTM International
ASTM D422 (2018). Standard test method for particle-size analysis of soils. West Conshohocken, PA, USA: ASTM International, 3–5.
ASTM D4318 (2017). Standard test methods for liquid limit, plastic limit, and plasticity index of soils. West Conshohocken, PA, USA: ASTM International, 1–20. doi:10.1520/D4318-17E01
ASTM D854 (2023). Standard test methods for specific gravity of soil solids by the water displacement method. West Conshohocken, PA, USA: ASTM International, 1–4. doi:10.1520/C1709-18
Aziz, K., Chen, F., Khan, I., Hussain Khahro, S., Malik, M. A., Ahmed Memon, Z., et al. (2024). Road traffic crash severity analysis: a Bayesian-optimized dynamic ensemble selection guided by instance hardness and region of competence strategy. IEEE Access 12, 139540–139559. doi:10.1109/ACCESS.2024.3465489
Bakr, R. M. (2024). Stabilization of soft clay soil by deep mixing with lime and cement in the presence of salt water. Civ. Eng. Archit. 12, 78–96. doi:10.13189/cea.2024.120107
Bian, X., Ren, Z., Zeng, L., Zhao, F., Yao, Y., and Li, X. (2024). Effects of biochar on the compressibility of soil with high water content. J. Clean. Prod. 434, 140032. doi:10.1016/j.jclepro.2023.140032
Bilgen, G., and Kavak, A. (2010). Effects of seawater on geotechnical properties of a clay soil. Fresenius Environ. Bull. 19, 1623–1628.
Boumehraz, M., Goudjil, K., and Hamaidia, A. (2024). Study of the sensitivity of a clayey soil due to the effect of water type, 5, 1–11. doi:10.54021/seesv5n2-219
Elmashad, M. E., and Ata, A. A. (2016). Effect of seawater on consistency, infiltration rate and swelling characteristics of montmorillonite clay. HBRC J. 12, 175–180. doi:10.1016/j.hbrcj.2014.12.004
Freitag, D. R. (1986). Soil randomly reinforced with fibers. J. Geotech. Eng. 112, 823–826. doi:10.1061/(asce)0733-9410(1986)112:8(823)
Hu, H., Qi, L., and Chao, X. (2024). Physics-informed Neural Networks (PINN) for computational solid mechanics: numerical frameworks and applications. Thin-Walled Struct. 205, 112495. doi:10.1016/j.tws.2024.112495
Hua, L., Tian, Y., Gui, Y., Liu, W., and Wu, W. (2024). Semi-analytical study of pile–soil interaction on a permeable pipe pile subjected to rheological consolidation of clayey soils. Int. J. Numer. Anal. Methods Geomech. 49, 1058–1074. doi:10.1002/nag.3915
Islam, S., Islam, J., and Robiul Hoque, N. M. (2022). Improvement of consolidation properties of clay soil using fine-grained construction and demolition waste. Heliyon 8, e11029. doi:10.1016/j.heliyon.2022.e11029
Liang, J., Liu, W., Yin, X., Li, W., Yang, Z., and Yang, J. (2025). Experimental study on the performance of shield tunnel tail grout in ground. Undergr. Sp. 20, 277–292. doi:10.1016/j.undsp.2024.07.001
Liu, J., Liu, W., Allechy, F. B., Zheng, Z., Liu, R., and Kouadio, K. L. (2024). Machine learning-based techniques for land subsidence simulation in an urban area. J. Environ. Manage. 352, 120078. doi:10.1016/j.jenvman.2024.120078
Li, Y., Jia, D., Wang, S., Qu, R., Qiao, M., and Liu, H. (2024). Surrogate model for reservoir performance prediction with time-varying well control based on depth generative network. Pet. Explor. Dev. 51, 1287–1300. doi:10.1016/S1876-3804(25)60541-6
Lokkas, P., Chouliaras, I., Chrisanidis, T., Christodoulou, D., Papadimitriou, E., and Paschalis, E. (2021). Historical background and evolution of soil mechanics. WSEAS Trans. Adv. Eng. Educ. 18, 96–113. doi:10.37394/232010.2021.18.10
Mohammed, J. A. (2015). Consolidation of soils: testing and evaluation. doi:10.13140/RG.2.2.20220.33923
Nguyen, M. (2014). Respiration in mixes of sandy and clay soils: influence of clay type and addition rate. J. Soil Sci. Plant Nutr. 14, 881–887.
Niu, Q., Hu, M., Chang, J., Wang, W., Yuan, W., Wang, Q., et al. (2024). Explosive fracturing mechanism in low-permeability sandstone-type uranium deposits considering different acidification reactions. Energy 312, 133676. doi:10.1016/j.energy.2024.133676
Onyelowe, K. C., Ebid, A. M., Ramani Sujatha, E., Fazel-Mojtahedi, F., Golaghaei-Darzi, A., Kontoni, D. P. N., et al. (2023). Extensive overview of soil constitutive relations and applications for geotechnical engineering problems. Heliyon 9, e14465. doi:10.1016/j.heliyon.2023.e14465
Otake, Y., and Honjo, Y. (2022). Challenges in geotechnical design revealed by reliability assessment: review and future perspectives. Soils Found. 62, 101129. doi:10.1016/j.sandf.2022.101129
Runsheng, H., Yan, Z., Wenlong, Q., Tianzhu, D., Mingzhi, W., and Feng, W. (2023). Geology and geochemistry of Zn-Pb(-Ge-Ag) deposits in the Sichuan-Yunnan-Guizhou Triangle area, China: a review and a new type. Front. Earth Sci. 11. doi:10.3389/feart.2023.1136397
Salim, N., Al-Soudany, K., and Jajjawi, N. (2018). Geotechnical properties of reinforced clayey soil using nylons carry’s bags by products. MATEC Web Conf. 162, 01020–01026. doi:10.1051/matecconf/201816201020
Sedmak Vesić, A. (1973). Analysis of ultimate loads of shallow foundations, J. Soil Mech. Found. Div. 99 45–73. doi:10.1061/JSFEAQ.0001846
Shan, Y., Tan, S., Cui, J., Yuan, J., Li, Y., and Huang, Z. (2024). Effect of plastic fine particles on shear strength at the critical state of sand-clay mixture. Can. Geotech. J. 62, 1–21. doi:10.1139/cgj-2023-0618
Shulyatyev, O., and Mozgacheva, O. A. (2024). Carl Terzaghi: the founder of modern soil mechanics. Soil Mech. Found. Eng. 61, 34–41. doi:10.1007/s11204-024-09940-4
Su, Y., Cui, Y.-J., Dupla, J.-C., and Canou, J. (2022). Soil-water retention behaviour of fine/coarse soil mixture with varying coarse grain contents and fine soil dry densities. Can. Geotech. J. 59, 291–299. doi:10.1139/cgj-2021-0054
Sujatha, E. R., Lakshmipriya, E., Sangavi, A. R., and Poonkuzhali, K. V. (2018). Influence of random inclusion of treated sisal fibres on the unconfined compressive strength of highly compressible clay. Sci. Iran. 25, 2517–2524. doi:10.24200/sci.2017.4208
Suzuki, K., and Yasuhara, K. (2007). Increase in undrained shear strength of clay with respect to rate of consolidation. Soils Found. 47, 303–318. doi:10.3208/sandf.47.303
Wang, H., Liu, Z., Lin, C., Yang, Q., and Hamdi, E. (2024b). Non-monotonic effect of differential stress and temperature on mechanical property and rockburst proneness of granite under high-temperature true triaxial compression. Geomech. Geophys. Geo-Energy Geo-Resources 10, 162. doi:10.1007/s40948-024-00891-6
Wang, J., Zhang, Y., Wang, K., Li, L., Cheng, S., and Sun, S. (2024a). Development of similar materials with different tension-compression ratios and evaluation of TBM excavation. Bull. Eng. Geol. Environ. 83, 190. doi:10.1007/s10064-024-03674-1
Wang, L., Zhang, Y., Han, R., and Li, X. (2023). LA-ICP-MS analyses of trace elements in zoned sphalerite: a study from the Maoping carbonate-hosted Pb-Zn(-Ge) deposit, southwest China. Ore Geol. Rev. 157, 105468. doi:10.1016/j.oregeorev.2023.105468
Wang, M., Kang, J., Liu, W., Li, M., Su, J., Fang, Z., et al. (2024c). Design and study of mine silo drainage method based on fuzzy control and Avoiding Peak Filling Valley strategy. Sci. Rep. 14, 9300. doi:10.1038/s41598-024-60228-x
Wang, M., Su, J., Qin, H., Shang, L., Kang, J., Liu, W., et al. (2024d). Research on active advanced support Technology of backfilling and mining face. Rock Mech. Rock Eng. 57, 7623–7642. doi:10.1007/s00603-024-03808-7
Wikipedia, Khyber Pakhtunkhwa, (2024). Available at: https://en.wikipedia.org/wiki/Khyber_Pakhtunkhwa.
Wu, Y., Li, Y., and Niu, B. (2014). Assessment of the mechanical properties of sisal fiber-reinforced silty clay using triaxial shear tests. Sci. World J. 1–9. doi:10.1155/2014/436231
Xu, D.-S., Yan, J.-M., and Liu, Q. (2021). Behavior of discrete fiber-reinforced sandy soil in large-scale simple shear tests. Geosynth. Int. 28, 598–608. doi:10.1680/jgein.21.00007
Yin, H., Zhang, G., Wu, Q., Cui, F., Yan, B., Yin, S., et al. (2024). Unraveling overlying rock fracturing evolvement for mining water inflow channel prediction: a spatiotemporal analysis using ConvLSTM image reconstruction. IEEE Trans. Geosci. Remote Sens. 62, 1–17. doi:10.1109/TGRS.2024.3452937
Yin, J., Zhang, K., Geng, W., Gaamom, A., and Xiao, J. (2021). Effect of initial water content on undrained shear strength of K0 consolidated clay. Soils Found. 61, 1453–1463. doi:10.1016/j.sandf.2021.08.010
Zhao, Y., Xiao, H., Chen, L., Chen, P., Lu, Z., Tang, C., et al. (2025). Application of the non-linear three-component model for simulating accelerated creep behavior of polymer-alloy geocell sheets. Geotext. Geomembranes 53, 70–80. doi:10.1016/j.geotexmem.2024.09.005
Zhou, G., Li, H., Song, R., Wang, Q., Xu, J., and Song, B. (2022c). Orthorectification of fisheye image under equidistant projection model. Remote Sens. 14, 4175. doi:10.3390/rs14174175
Zhou, G., Liu, W., Zhu, Q., Lu, Y., and Liu, Y. (2022b). ECA-MobileNetV3(Large)+SegNet model for binary sugarcane classification of remotely sensed images. IEEE Trans. Geosci. Remote Sens. 60, 1–15. doi:10.1109/TGRS.2022.3215802
Zhou, G., and Liu, X. (2022). Orthorectification model for extra-length linear array imagery. IEEE Trans. Geosci. Remote Sens. 60, 1–10. doi:10.1109/TGRS.2022.3223911
Zhou, H., Liu, Z., Shen, W., Feng, T., and Zhang, G. (2022a). Mechanical property and thermal degradation mechanism of granite in thermal-mechanical coupled triaxial compression. Int. J. Rock Mech. Min. Sci. 160, 105270. doi:10.1016/j.ijrmms.2022.105270
Keywords: warsak road peshawar, consolidation behavior, shear strength behavior, PLAXIS, meyerhof and vesic bearing capacity
Citation: Izhar N, Khan MA, Khan MS, Khan A, Ahmad M, Sabri Sabri MM, Necurzac M and Alzlfawi A (2025) Numerical and experimental evaluation of shear strength and consolidation properties of cohesive soils in high water table areas. Front. Earth Sci. 13:1522488. doi: 10.3389/feart.2025.1522488
Received: 04 November 2024; Accepted: 12 February 2025;
Published: 10 March 2025.
Edited by:
Ramez Al-Mansob, University of Doha for Science and Technology, QatarReviewed by:
Beenish Jehan Khan, CECOS University of Information Technology and Emerging Sciences, PakistanCopyright © 2025 Izhar, Khan, Khan, Khan, Ahmad, Sabri Sabri, Niekurzak and Alzlfawi. This is an open-access article distributed under the terms of the Creative Commons Attribution License (CC BY). The use, distribution or reproduction in other forums is permitted, provided the original author(s) and the copyright owner(s) are credited and that the original publication in this journal is cited, in accordance with accepted academic practice. No use, distribution or reproduction is permitted which does not comply with these terms.
*Correspondence: Muhammad Adeel Khan, YWRlZWxAdG9uZ2ppLmVkdS5jbg==; Muhammad Salman Khan, bXNhbG1hbi5raGFuMDA5OUBnbWFpbC5jb20=; Asad Khan, YXNhZEB0b25namkuZWR1LmNu
Disclaimer: All claims expressed in this article are solely those of the authors and do not necessarily represent those of their affiliated organizations, or those of the publisher, the editors and the reviewers. Any product that may be evaluated in this article or claim that may be made by its manufacturer is not guaranteed or endorsed by the publisher.
Research integrity at Frontiers
Learn more about the work of our research integrity team to safeguard the quality of each article we publish.