
95% of researchers rate our articles as excellent or good
Learn more about the work of our research integrity team to safeguard the quality of each article we publish.
Find out more
ORIGINAL RESEARCH article
Front. Earth Sci. , 21 March 2025
Sec. Geomagnetism and Paleomagnetism
Volume 13 - 2025 | https://doi.org/10.3389/feart.2025.1519524
This article is part of the Research Topic Advances in Magnetotelluric Imaging View all 10 articles
Natural-source audio-frequency magnetotelluric (AMT) data is highly sensitive to conductive anomalies associated with mineralization. To image the three-dimensional mineralized zones in the Baogutu porphyry copper belt, Western Junggar, NW China, we deployed an AMT array consisting of 176 regularly distributed sites. A parallel 3D electromagnetic data inversion scheme was employed to invert this AMT dataset. Using lab-measured electrical resistivity of rock samples, we interpret the 3D resistivity model by comparing it with borehole profiles. The most pronounced conductive anomalies in the inverted model are the east-west elongate conductive zones located at the center of the array, extending to a depth of 600 m. The inverted 3D model aligns closely with the borehole results, demonstrating that the 3D inversion of a dense AMT array can provide a high-resolution and reliable model. The electrical resistivity model shows a strong correlation with the shear wave velocity model. The positive correlation between resistivity and shear wave velocity identifies the potential mineralized areas, as supported by petrophysical and drilling data, which may assist in determining future drilling targets.
The audio-frequency magnetotelluric (AMT) method, along with controlled-source AMT (CSAMT), has been widely used to map shallow resistivity structures with high resolution. For example, it has been employed to trace the hydrological system of thermal fluid flow in Bakreswar hot spring, India (Sinharay et al., 2010); to image high-conductive zones at mid-crustal depths in the Otjiwarongo and Katima Mulilo regions of Namibia (Share et al., 2014); to delineate the shape of resistive granitic intrusions and their conductive surrounding metamorphic zones in West Junggar, NW China (Yang et al., 2016); to investigate one of the major metallogenic belts in southern China, including iron and polymetallic deposits in the Longmen region (Hu et al., 2013); and to explore skarn-type ore belts in the Zhuxi polymetallic deposits (Shi et al., 2020). In the AMT procedure, we typically measure two orthogonal electrical field components (i.e., Ex and Ey) and two or three orthogonal magnetic field components (i.e., Hx, Hy, Hz) of the naturally induced electromagnetic wave in the frequency range of 20,000 Hz to approximately 1 Hz (i.e., audio-frequency). These measurements are used to estimate the impedance tensor and the vertical transfer functions, which are directly related to the electrical resistivity of the Earth. Modern 3D inversion techniques have significantly enhanced the resolution and reliability of resistivity models inverted from AMT data. However, to date, only a few 3D results have been reported. (e.g., Yang et al., 2016; Blake et al., 2016; Wang et al., 2017; Shi et al., 2021; Wan and Wang, 2023, etc.).
As the first porphyry Cu-Mo-Au deposit discovered in Western Junggar, NW China, Baogutu has garnered significant attention in recent years (e.g., Shen et al., 2010; Shen and Pan, 2013; Cao et al., 2014; Cao et al., 2015; Zheng et al., 2015; Cao et al., 2016; Cao et al., 2017, et al.). Previous studies on the metallogeny of Baogutu stocks and porphyries have predominantly relied on geological investigations. For example, Cao et al. (2014) suggested that Baogutu can be classified as a typical reduced porphyry Cu deposit. However, geophysical investigations have rarely been conducted, limiting our understanding of the deep characteristics of the deposit. This motivates us to utilize dense AMT surveying to evaluate the potential for further exploration.
Here, we present the results from imaging the 3D electrical resistivity structure of the V (5th) porphyry stock in the Baogutu area, using 176 AMT sites and 3D inversion techniques. The inverted 3D resistivity model has been interpreted in conjunction with the shear wave velocity model, as well as the electrical resistivity and shear wave velocity of rock samples, which show good agreement.
The Western Junggar region in NW China is situated in the southern portion of the Central Asian Orogenic Belt (CAOB, Figure 1). This area occupies a late Paleozoic convergent zone bounded by three major plates: the Tarim craton to the south, the Siberia craton to the northeast, and the Kazakhstan block to the northwest (Jahn et al., 2004; Safonova et al., 2004; Chai et al., 2009; Zhang et al., 2009; Zhao et al., 2009). The crustal growth of the CAOB, one of the most deformed areas in the Phanerozoic, has been accompanied by multi-stage and diverse crust-mantle interactions and ore-forming processes (Windley et al., 2002; Yakubchuk, 2004; Buslov et al., 2004).
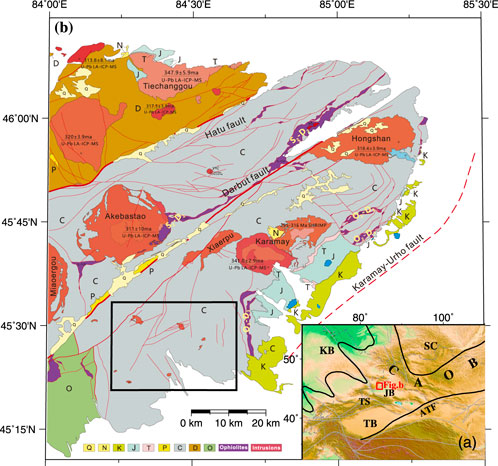
Figure 1. Simplified geology maps of the Western Junggar area (after Yang et al. (2016)). (a) Tectonic settings of NW China (after Buckman and Aitchison (2004)), illustrating that the Western Junggar area is situated in the southern part of the Central Asian Orogenic Belt (CAOB). It is surrounded by the Kazakhstan plate to the northwest, the Siberia Craton to the northeast, and the Tarim Craton to the south. The location of panel (b) is marked by a red box. (b) Simplified geology map of the Western Junggar area, showing major granitic intrusions, including Hongshan, Karamay, and Akebasitao, which are emplaced in the Carboniferous terrane. Three major faults—the Karamay-Urho Fault, the Darbut Fault, and the Hatu Fault—are indicated. The thick black rectangle outlines the range of Figure 2. Acronyms in panel (a): ATF: Altyn Tagh Fault; CAOB: Central Asian Orogenic Belt; KB: Kazakhstan Block; JB: Junggar Basin; SC: Siberian Craton; TB: Tarim Block; TS: Tian Shan Mountains; Q: Quaternary; N: Neogene; K: Cretaceous; J: Jurassic; T: Triassic; P: Permian; C: Carboniferous; D: Devonian; O: Ordovician.
The Western Junggar accretionary collage is characterized by widespread Devonian and Carboniferous island arc-related volcanic rocks, granitoids, and oceanic sediments (Buckman and Aitchison, 2004), as shown in Figure 1. The Devonian strata are mainly distributed in the northwest, while the Carboniferous strata are primarily found in the southeast (Tang et al., 2010). The most extensively distributed Lower Carboniferous layers in this area consist of three units: the Xibeikulasi Group (C1x), Baogutu Group (C1b), and Tailegula Group (C1t), from bottom to top (Zheng et al., 2009; An and Zhu, 2009; Zong et al., 2014; Zhang et al., 2015). The Late Carboniferous to Early Permian period is critical for mineral deposit formation (Yin et al., 2011). Surface exposures of ultrabasic and acidic igneous intrusions indicate that magmatism was widespread throughout the Western Junggar area during this time (Figure 1; Chen and Jahn, 2004; Chen and Arakawa, 2005; Wang and Xu, 2006).
There are two groups of intermediate-acidic intrusions in the region. The first group consists of barren granite batholiths that intruded into Devonian to Lower Carboniferous volcanic rocks and were dominant around 300 Ma (Su et al., 2006). The second group includes intermediate-acidic stocks that intruded into the Carboniferous Darbut volcanic belt, primarily between 322 and 305 Ma (Shen and Jin, 1993). Separated by the Darbut fault, alkali-feldspar granite intruded as batholiths to the north of the fault (e.g., Akebasitao and Miaoergou granitic intrusions), while the southern side of the fault is dominated by intermediate-acidic small intrusions (e.g., Baogutu and Karamay granitic intrusions) (Yin et al., 2011). Frequent and large-scale magmatism, along with simultaneous and/or late tectonic deformation and particularly multi-stage superimposed magmas, contributed to the development of the Hatu, Saertuohai, and Baogutu Cu-Au deposits in West Junggar (Tang et al., 2010; Ma et al., 2012). Based on the geological structure and evolutionary history, ore deposits and mineralization have been linked to hydrothermal activity, ultrabasic rocks, and intermediate-acidic small intrusions (Cheng and Zhang, 2006). However, the nature of the granitoids and the genesis of these deposits remain subjects of debate (Cao et al., 2016).
The faults and folds are well developed in the study area (Figure 2A), with Stock V located on the eastern flank of the Baogutu anticline (Figure 2B; Yang, 2008; Zhang et al., 2010). There are three types of faults identified: NS-trending faults from the early stage, NE-trending faults from the middle stage, and sub-parallel NS-trending faults from the later stage. The early extension-shear faults are larger, extending over 10 km, and control the distribution of intermediate-acidic rocks. The middle NE-trending faults cut through the earlier NS-trending faults and intrusions, partially affecting porphyry formations. These NE-trending faults are parallel to most of the intermediate-acidic dikes and ore-bearing quartz-sulfide veins in the Baogutu Cu-Au deposits, serving as critical ore-controlling structures in the area (Wei et al., 2014). Previous studies suggest that the early NS-trending faults provide space for Cu-Au mineralization, while the NE-trending faults generally control the development of small stocks. The late-stage NS-trending faults are smaller and manifest as small cracks, which serve as the main ore-hosting structures for mineralization, often partially filled with dikes (Yang, 2008).
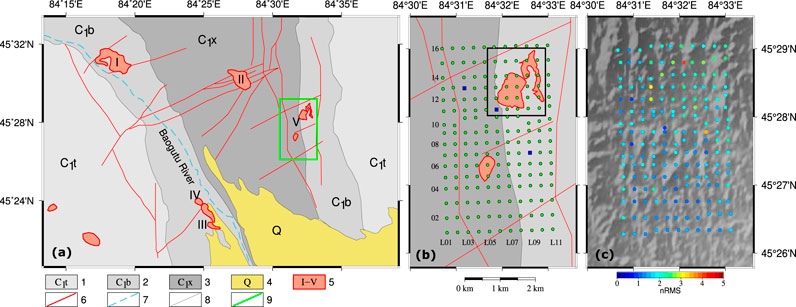
Figure 2. Local geology and AMT site coverage of the Baogutu area. (a) Simplified local geology map (after Shen et al. (2009)). Legends: 1: Tailegula Group; 2: Baogutu Group; 3: Xibeikulasi Group; 4: Quaternary; 5: Carboniferous porphyries and their corresponding numbering; 6: Faults; 7: Rivers; 8: Geological boundaries; 9: Range covered by the AMT array in panel (b). (b) Displays the local geology of Stock V of the Baogutu granitic intrusion and AMT sites (green filled circles). Three representative sites, shown in Figure 3, are marked as dark blue squares. The black rectangular box indicates the map range for Figure 8. (c) The normalized root mean square errors for each AMT site of the preferred inverted model. The topography of the study area is represented in the background as a shaded relief map.
The Baogutu porphyry copper belt is located south of the Darbut fault in the western Junggar, approximately 40 km from Karamay city. This belt represents the eastern extension of the Tuoli Cu-Au belt in Xinjiang (Shen et al., 2009; Zhang et al., 2006). The deposits are primarily distributed in the contact zones of Hercynian intermediate-acidic intrusions and their associated dikes (Cheng and Zhang, 2006). Porphyry copper deposits develop within intermediate-acidic stocks, resulting in mineralization with thicknesses ranging from tens to hundreds of meters. While copper (Cu) is the major ore-forming element, gold (Au) and molybdenum (Mo) are also present (Cheng et al., 2009). Extensive studies have identified more than 20 ore-bearing stocks (marked with Roman numerals) (e.g., Shen et al., 2009; Shen et al., 2012; Shen and Pan, 2015; Tang et al., 2010; Zheng et al., 2015; Cao et al., 2016; Ma et al., 2012, etc.). However, limited geophysical data have been collected to delineate the deposits in Baogutu. Motivated by the successful applications of AMT data for various geological targets, we deployed a dense AMT array to image the Baogutu porphyry Cu-Au deposit within Stock V, which we present here as a case study in mineral exploration.
We conducted 11 AMT profiles, with each profile consisting of 16 stations, resulting in a total of 176 sites covering a region of 3 km by 5 km (Figure 2B). The profile spacing is approximately 300 m, and the site spacing is also about 300 m in the central part of the array, increasing to around 400 m for the last 2 and 3 sites at the northern and southern ends of each profile. To minimize noise from a power line that crosses the study area from east to west, Site #10 of each profile was relocated 100 m north or south from its designated position (Figure 2B).
We used the MTU-NET system manufactured by Phoenix Geophysics to acquire the AMT data. For logistical reasons, we only recorded the horizontal electric fields (

Figure 3. The observed (points with error bars) and predicted (solid lines) apparent resistivity and impedance phase curves of the six representative AMT sites. Site 03-13 (left panel) is situated on top of the Xibeikulasi Group; Site 06-11 is located at the boundary of the Xibeikulasi Group and Baogutu Group; Site 09-07 is situated on Baogutu Group; Site 02-10, 09-10 and 10-09 are situated on the imaged conductors C1, C3 and C4 respectively as shown in Figure 6. Note that for the error bars plotted in these apparent resistivity and phase curves, we used the ones which have applied the error floor setting, but not the original ones produced from the impedance estimation program.
We employed the latest parallel 3D MT data inversion scheme, the Modular system for Electromagnetic Inversion (ModEM) (Egbert and Kelbert, 2012; Kelbert et al., 2014), for 3D modeling and inversion. ModEM is widely used for interpreting MT data from continental-scale arrays (e.g., Meqbel et al., 2014; Yang et al., 2015; Bedrosian, 2016; Murphy and Egbert, 2017; Egbert et al., 2022) as well as local profiles (e.g., Xu et al., 2016b; Xu et al., 2016c), due to its power, flexibility, and availability to academic communities. The preferred 3D resistivity model presented in this paper (Figures 6, 7) was obtained by inverting the full impedance tensor from all 176 sites across 59 periods, ranging from 10,400 Hz–0.6 Hz. The topography of the study area is relatively flat (Figure 2C), with elevation variations of less than 100 m throughout the entire region; therefore, we ignored the topographic effect in the inversion process. We tested various a priori models, data error floor settings, model gridding, and other inversion parameters by running the inversion multiple times to recover a reliable inverted model. For the preferred model presented here, we assigned error floors of 5% of
We discretized the study area horizontally with 75 m grids in the core, padding with seven grids on all four edges, with increasing widths by a factor of 1.2 outward to the boundaries exponentially, to satisfy the boundary conditions. The model was discretized vertically with 30 layers, starting from 5 m for the first layer, and then the thickness of the layers increased logarithmically to
We used the nonlinear conjugate gradient (NLCG) scheme built into ModEM to fit the data iteratively. Based on the laboratory measurements of the rock samples in the study area (Table 1), the regional background resistivity is relatively large (more than 1,000
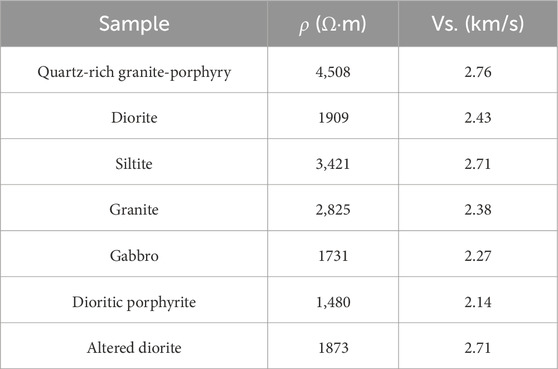
Table 1. The electrical resistivity and shear wave velocity of rock samples in Baogutu from lab measurements.
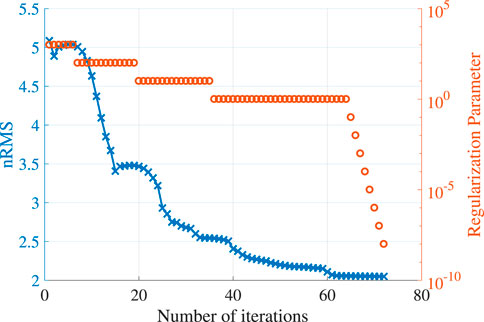
Figure 4. The variations of nRMS and regularization parameters as functions of number of iterations. The blue solid line and cross markers represent the variation of nRMS, while the orange circles show the regularization parameters. Note that the vertical axis for regularization parameters is on the right.
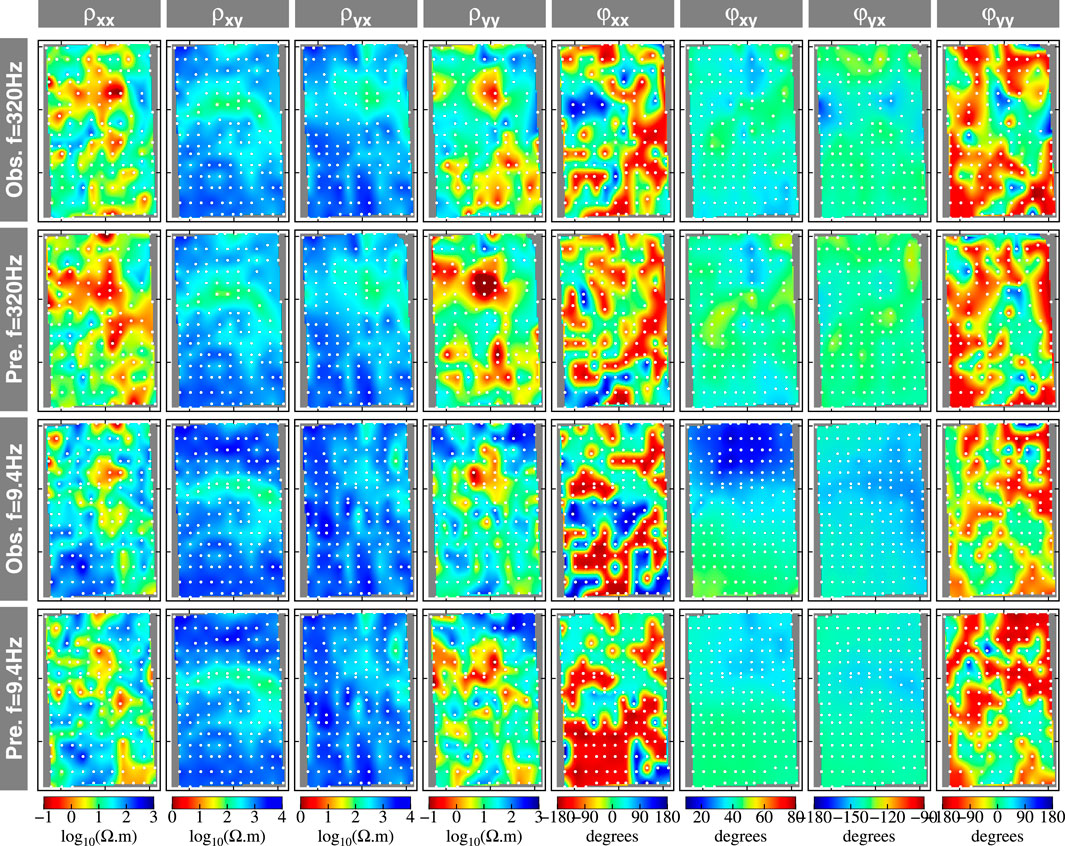
Figure 5. Maps of observed (1st and 3rd rows) and predicted (2nd and 4th rows) apparent resistivity (1st to 4th columns) and impedance phase (5th to 8th columns) for frequencies of 320 Hz and 9.4 Hz. The AMT sites are indicated by filled circles. All maps are interpolated from site locations using a natural neighbor interpolation algorithm. The color scales for each component are shown at the bottom of each column.
Note that the variation of nRMS with respect to the number of iterations shows fluctuations (Figure 4), particularly in the early stages. Based on our understanding, occasional small increases in nRMS are likely due to the line search scheme used in the NLCG module of ModEM. This scheme evaluates only two additional values of the objective function beyond the current nRMS value. It then uses these three points to interpolate a quadratic parabolic function. The algorithm subsequently selects the minimum of this parabola as the result of the line search. However, if the actual function along the search direction is not well-represented by a parabolic function, the step size determined by this method may be imprecise. This can lead to an increase in nRMS. Specifically, when the true function deviates from a parabolic shape, the chosen step size might not be optimal, resulting in temporary increases in nRMS.
As presented in the selected depth slices (Figure 6) and the vertical cross-sections (Figure 7), the inverted 3D electrical resistivity model clearly reveals the detailed structure of the study area, ranging from dozens of meters to more than 2 km in depth. For convenience, we plotted the outlines of the outcrops V1 to V3 of Baogutu stock V from south to north in Figure 6G, along with the local faults and geological boundaries of the Xibeikulasi Group and Baogutu Group in all subplots of Figure 6. The profiles A-A’ to E-E’ in Figure 6H indicate the locations of the vertical cross-sections shown in Figure 7.
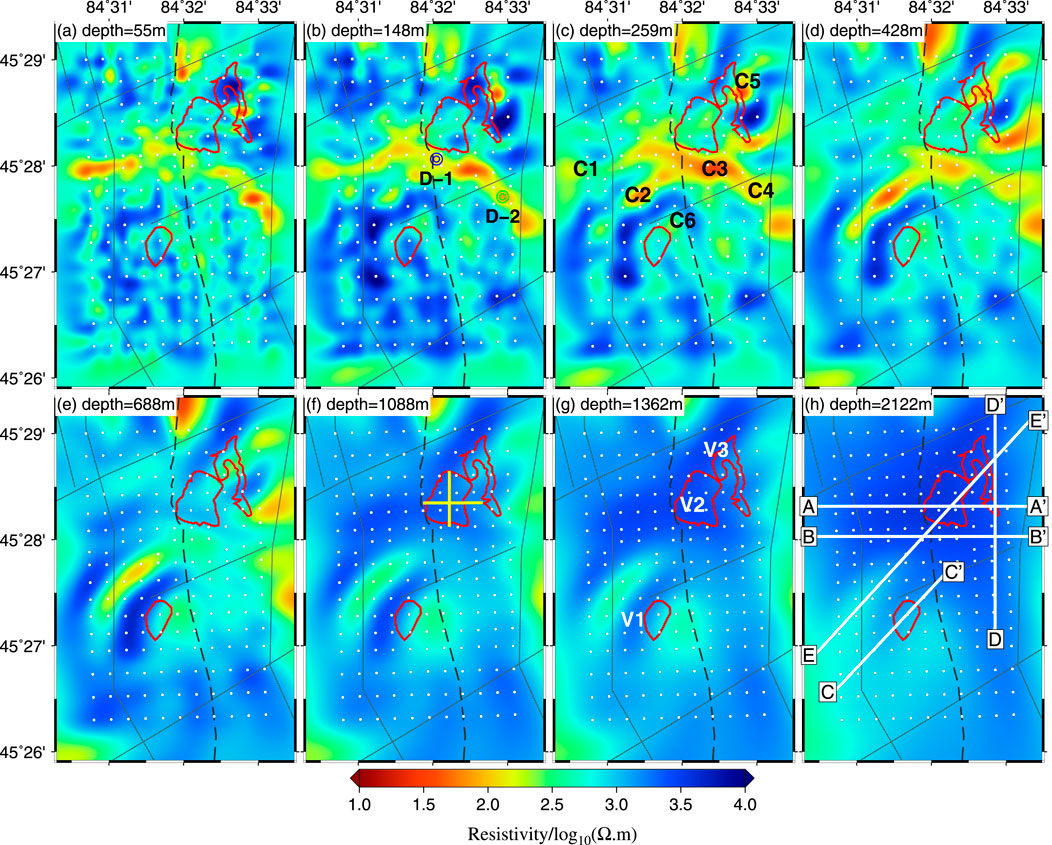
Figure 6. The depth slices of the preferred inverted model. (a–h): Electrical resistivity at representative depths. The surficial boundaries of the V Baogutu intrusion are indicated by red solid lines. The local faults are marked by thin black lines. The boundary of the Xibeikulasi Group and Baogutu Group is outlined by black dashed line. The blue and green circles in panel (b) mark the prompted drilling holes: D-1 and D-2. Two thick solid yellow lines in panel (f) show the location of profiles in Figures 8B, C. Profiles A-A′ to E-E′ in panel (h) give the locations of the vertical cross-sections shown in Figure 7. C1-C6 mark the conductors discussed in the main text.
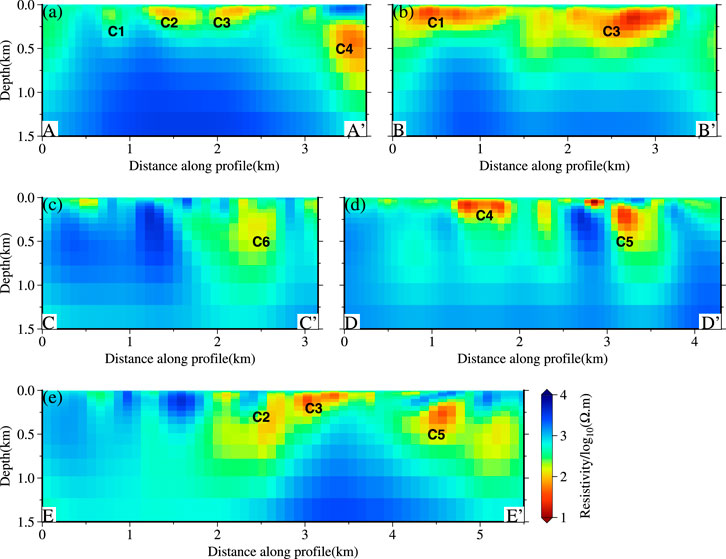
Figure 7. Representative vertical cross-sections passing through the intrusion and the conductors. The location of these profiles is shown in Figure 6H.
The most pronounced feature in the shallow depths of the model is the east-west conductive zone in the central part of the study area, which is related to the mineralized stock V. We named these conductors C1-C6 (Figure 6C). The shallow layers in the model (Figures 6A, B) indicate that C1, C3, and C4 connect to each other, while C2 does not appear until a depth of nearly 250 m (Figure 6C). In the deeper layers, as shown in the profiles A-A’ and B-B’ (Figure 7), C1 and C2 have merged together and connected to C3 along the east-west direction in the southern area of V2. The C4 (Figures 7D, D’) and C3 (Figures 7E, E’) are clearly separated from C5 by resistive intrusions beneath the outcrops V1 and V2. We have noted that two conductive spots exist in the middle and northern parts of stock V3, as shown in Figure 6D; they appear to be two independent branches. Since the current AMT array cannot constrain these two anomalies precisely, we cannot confidently describe them in detail. The conductive zone in the V1 outcrop area, which coincides with the outcrop boundary (Figures 6A–E), extends vertically from the surface to approximately 700 m in depth.
Dozens of boreholes have been drilled in stock V-2 (e.g., Shen et al., 2009; Shen et al., 2010). Two lithologic profiles have been compiled from the drilling cores of these boreholes (Shen et al., 2010). To verify the conductive anomalies in the preferred model, we plotted the vertical cross-sections alongside the lithologic and mineral profiles revealed by the borehole results (Shen et al., 2010). The lithologic outlines were adapted from Shen et al. (2010). The green polygons in Figure 8B, C indicate that the orebodies are primarily distributed in the upper 600 m of stock V-2, where a highly conductive anomaly (20-40
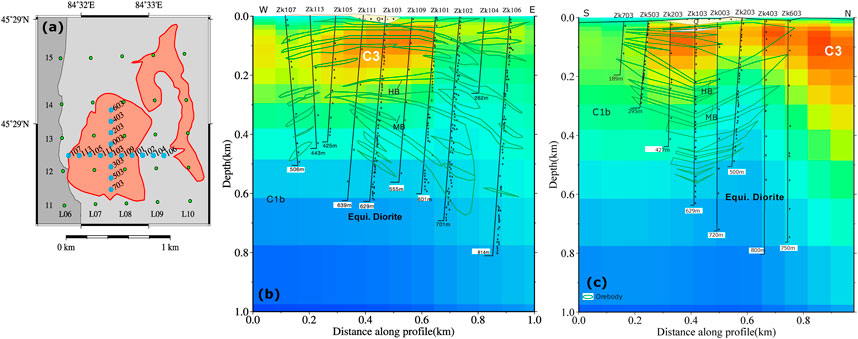
Figure 8. The cross sections of preferred model comparing with boreholes. (a) Location and numbering of boreholes from Shen et al. (2010). The boreholes are shown as skyblue circles. (b) The vertical cross-section of the preferred model overlies by the E-W profile interpreted from boreholes in Shen et al. (2010): Figure 7B. We only keep the outlines of the original boreholes profile for better comparison. The color bar of the resistivity is the same as in Figure 6. (c) The vertical cross-section of the preferred model overlies by the N-S profile. Legends are the same as in panel (b).
Considering the lack of high-frequency data (10,000–1,000 Hz), which is primarily sensitive to depths of 100–300 m in a 600
The porphyry Cu-Au-Mo mineralization in West Junggar is associated with intermediate intrusive rocks. Typically, ore-bearing mineralization occurs in the upper stocks and in the contact zones between the stocks and their country rocks (Shen et al., 2009). In our inverted model, several high-conductivity zones can be identified as potential mineralized zones. As noted earlier, all major conductive anomalies are located on the flanks or in the uppermost zones of the stocks.
For stock V2, the orebodies are likely distributed along the southern boundary, exhibiting a shallow east-west extension and a deeper southwest trend. Drilling results in stock V2 indicate that the ore-bearing porphyry extends to approximately 600 m in depth (Shen et al., 2009), which aligns well with our model. Furthermore, C3 connects with C2 at depth and extends more than 1 km, suggesting significant mineralization occurs at depths of 200 m to 1 km along the southern edge of stock V2. The conductor C4 may represent an orebody associated with small faults. As suggested by Richards (2003), large porphyry deposits are likely formed where magma ascents are concentrated at structural intersections. However, conductor C1 might also represent an isolated orebody developed at shallower depths within the Xibeikulasi Group. In all depth slices shallower than 1 km, we can clearly identify an independent high-conductivity area, C6, at the northeast boundary of stock V1. This area is likely an ore-bearing stock extending vertically to 700 m, associated with the intermediate intrusion. For stock V3, conductor C5 likely highlights an orebody that may develop independently on the northeast flank of the stock at depths of 100 m–800 m (Figure 7D).
Shen and Pan (2015) suggested that the mineralized intrusive phases at the Baogutu porphyry belt comprise the main-stage diorite stock and minor late-stage diorite porphyry dikes. The main-stage host experienced significant hydrothermal alteration and contains the majority of the Cu-Mo-Au mineralization. This implies that the presence of high-conductivity zones near stock V is likely associated with the Cu-Au deposit.
Xu H. et al. (2016) employed the eikonal tomography method to map the shallow 3D velocity structure of the Baogutu V stock belt. They noted that the Xibeikulasi Group (C1x) in the west exhibits a higher shear wave velocity compared to the Baogutu Group (C1b) in the east. However, our model does not reveal any significant resistivity differences between these two groups, suggesting that they likely have similar conductivity. To facilitate comparison with the shear wave velocity model, we plotted two depth slices (at 450 m and 700 m) in Figures 9A, B, using the same map range as in Figure 6. In Figure 9A, the low shear wave velocity anomaly at the southern edge of stock V2 aligns closely with conductor C3. Additionally, measurements of rock samples indicate that ore-bearing intrusive rocks (e.g., gabbro, dioritic-porphyrite) possess low shear wave velocities and relatively low resistivity, especially when mineralized, suggesting that C3 could be a promising mineralized zone. To examine the overall correlation between the shear wave velocity (Vs.) model and the resistivity model, we computed their Pearson’s correlation coefficient by first interpolating them onto the same grid and then calculating the correlation coefficient point by point with respect to the depth variations of the models using following Equation 1
where
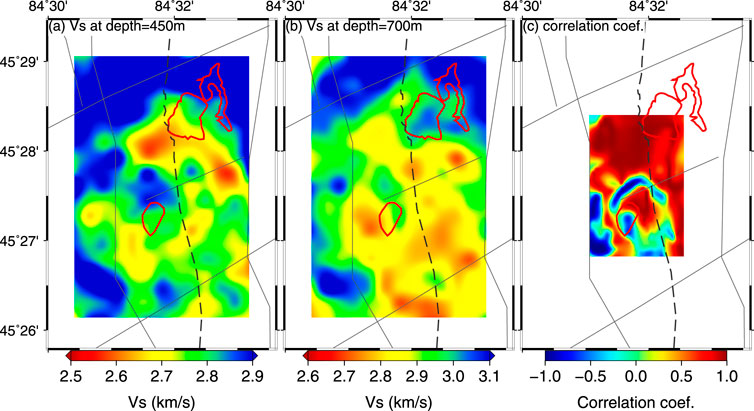
Figure 9. The 450 m (a) and 700 m (b) depth slices of shear wave velocity model from Xu (H) et al. (2016) and the correlation coefficients (c) between the electrical resistivity model and the shear wave velocity model.
It is important to note that the Vs. model is best resolved only in the central part of the array (see Xu et al., 2016a, for details), so we limited our correlation analysis to this region. As shown in Figure 9C, the resistivity model strongly positively correlates with Vs. at the southern edge of stock V2, while it shows a strong negative correlation with Vs. at stock V1. This suggests that stock V1 may have different lithological properties compared to stock V2. The strong positive correlation between S-wave velocity (Vs.) and conductivity observed in Stock V1 and V2 likely indicates the presence of a fracture zone associated with a local fault. Additionally, a prominent negative correlation belt surrounding Stock V1 is one of the most notable features. This area’s low conductivity and high Vs. values may suggest the formation of a fracture contact zone during the intrusion of the magmatic stock.
Regarding the metallogenesis of the Baogutu porphyry copper belt, Zhang et al. (2010) suggested that the Baogutu porphyry copper deposit may have formed in the Late Carboniferous, with its mineralization closely linked to the intrusion of intermediate-acidic porphyry bodies. They posited that the ore-forming fluid originates from deep magmatic waters. Tang et al. (2010) and Yin et al. (2010) proposed that the Baogutu Cu-Au deposits could occur above a slab window during ocean ridge subduction, where the interaction between high-oxygen fugacity slab melt and mantle peridotite leads to the decomposition of metal sulfides, subsequently promoting Cu and Au mineralization. Furthermore, Shen et al. (2009) suggested that the ore-bearing porphyry system derives from the partial melting of multiple sources, including oceanic crust and a subduction-modified mantle wedge, with significant crystal fractionation occurring during the convergence between the paleo-Junggar ocean and the Darbut arc. Given the limitations of our AMT data, which lacks long-period information and covers only a relatively small aperture, we are unable to resolve any structures deeper than 2 km. This restriction complicates discussions surrounding the metallogenesis of the Baogutu porphyry copper deposit in our study area. However, based on the tectonic evolution inferred from the regional-scale resistivity model (Xu et al., 2016b), we support the view that the Baogutu porphyry copper belt is likely related to an intra-oceanic subduction event beneath the Darbut arc during the Late Paleozoic.
We imaged the high-resolution resistivity structure of stock V of the Baogutu intermediate-acidic intrusions using an AMT dataset consisting of 176 sites. The Baogutu porphyry copper belt is distinctly represented as conductive zones along the flanks of outcrops V1 to V3, particularly at the northeast flanks of V1 and V3, and extending in an east-west direction between V1 and V2. Our model, inverted from the AMT data, reveals that all significant high electrical conductivity zones extend from the surface to approximately 600 m in depth. When integrated with previous geological, geochemical, and geophysical studies, our model provides insights into the 3D structure of the Cu-Mo-Au mineralization zones associated with the magmatic activities of the Baogutu intrusions. Most mineralization appears to develop irregularly within the ore-bearing stocks and at the contact zones between the stocks and their country rocks, suggesting that the porphyry copper deposits may be influenced by small intermediate-acidic intrusions rather than showing significant correlations with existing faults. Comparing our results with borehole profiles, the AMT imaging aligns closely with the lithological profiles compiled from drilling cores. The resistivity model also demonstrates a strong correlation with the shear wave velocity model. We recommend that further drilling be conducted at other promising conductive anomalies. Additionally, to enhance our understanding of metallogenesis, the current array should be expanded to include broadband MT stations.
The raw data supporting the conclusions of this article will be made available by the authors, with reasonable request.
BY: Funding acquisition, Methodology, Resources, Software, Visualization, Writing–original draft, Writing–review and editing, Data curation, Formal Analysis, Investigation, Conceptualization, Validation. XM: Formal Analysis, Investigation, Resources, Validation, Writing–review and editing. YW: Formal Analysis, Investigation, Resources, Validation, Writing–review and editing. LY: Data curation, Formal Analysis, Investigation, Resources, Validation, Writing–review and editing. YX: Conceptualization, Funding acquisition, Investigation, Project administration, Supervision, Writing–review and editing.
The author(s) declare that financial support was received for the research and/or publication of this article. This research was financially supported by China National Science and Technology Major Project: Deep Earth Probe and Mineral Resources Exploration (grant 2024ZD1000200), NSFC (grant 42474103) and China Geological Survey for the project “Deep Geological Investigation of the Karamay Back Mountain Area in Western Junggar, Xinjiang” (Grant 1212011220245).
We would like to extend our gratitude to Dr. Ying Liu from the China University of Geosciences in Wuhan, China, and Dr. Anqi Zhang from the Innovation Academy for Precision Measurement Science and Technology at the Chinese Academy of Sciences. Their extensive discussions and valuable insights were instrumental throughout this study. Additionally, we are grateful for the constructive comments and insightful suggestions provided by three reviewers, which significantly enhanced the quality of this paper.
The authors declare that the research was conducted in the absence of any commercial or financial relationships that could be construed as a potential conflict of interest.
The author(s) declare that no Generative AI was used in the creation of this manuscript.
All claims expressed in this article are solely those of the authors and do not necessarily represent those of their affiliated organizations, or those of the publisher, the editors and the reviewers. Any product that may be evaluated in this article, or claim that may be made by its manufacturer, is not guaranteed or endorsed by the publisher.
An, F., and Zhu, Y. (2009). Significance of native arsenic in the Baogutu gold deposit, western Junggar, Xinjiang, NW China (in Chinese with English abstract). Chin. Sci. Bull. 54, 1465–1470. doi:10.1007/s11434-009-0086-6
Bedrosian, P. A. (2016). Making it and breaking it in the Midwest: continental assembly and rifting from modeling of EarthScope magnetotelluric data. Precambrian Res. 278, 337–361. doi:10.1016/j.precamres.2016.03.009
Blake, S., Henry, T., Muller, M. R., Jones, A. G., Moore, J. P., Murray, J., et al. (2016). Understanding hydrothermal circulation patterns at a low-enthalpy thermal spring using audio-magnetotelluric data: a case study from Ireland. J. Appl. Geophys. 132, 1–16. doi:10.1016/j.jappgeo.2016.06.007
Buckman, S., and Aitchison, J. C. (2004). Tectonic evolution of palaeozoic terranes in West Junggar, xinjiang, NW China. Geological Society London Special Publications 226, 101–129.
Buslov, M. M., Fujiwara, Y., Iwata, K., and Semakov, N. N. (2004). Late paleozoic-early mesozoic geodynamics of central asia. Gondwana Res. 7, 791–808. doi:10.1016/s1342-937x(05)71064-9
Cao, M., Qin, K., Li, G., Evans, N. J., Hollings, P., Maisch, M., et al. (2017). Mineralogical evidence for crystallization conditions and petrogenesis of ilmenite-series I-type granitoids at the Baogutu reduced porphyry Cu deposit (Western Junggar, NW China): Mössbauer spectroscopy, EPM and LA-(MC)-ICPMS analyses. Ore Geol. Rev. 86, 382–403. doi:10.1016/j.oregeorev.2017.02.033
Cao, M., Qin, K., Li, G., Evans, N. J., and Jin, L. (2015). In situ LA-(MC)-ICP-MS trace element and Nd isotopic compositions and genesis of polygenetic titanite from the Baogutu reduced porphyry Cu deposit, Western Junggar, NW China. Ore Geol. Rev. 65, 940–954. doi:10.1016/j.oregeorev.2014.07.014
Cao, M., Qin, K., Li, G., Jin, L., Evans, N. J., and Yang, X. (2014). Baogutu: an example of reduced porphyry Cu deposit in western Junggar. Ore Geol. Rev. 56, 159–180. doi:10.1016/j.oregeorev.2013.08.014
Cao, M. J., Qin, K. Z., Li, G. M., Evans, N. J., Hollings, P., and Jin, L. Y. (2016). Genesis of ilmenite-series I-type granitoids at the Baogutu reduced porphyry Cu deposit, western Junggar, NW-China. Lithos 246-247, 13–30. doi:10.1016/j.lithos.2015.12.019
Chai, F., Mao, J., Dong, L., Yang, F., Liu, F., Geng, X., et al. (2009). Geochronology of metarhyolites from the kangbutiebao formation in the kelang basin, altay Mountains, xinjiang: implications for the tectonic evolution and metallogeny. Gondwana Res. 16, 189–200. doi:10.1016/j.gr.2009.03.002
Chen, B., and Arakawa, Y. (2005). Elemental and Nd-Sr isotopic geochemistry of granitoids from the West Junggar foldbelt (NW China), with implications for Phanerozoic continental growth. Geochimica Cosmochimica Acta 69, 1307–1320. doi:10.1016/j.gca.2004.09.019
Chen, B., and Jahn, B. M. (2004). Genesis of post-collisional granitoids and basement nature of the Junggar Terrane, NW China: Nd-Sr isotope and trace element evidence. J. Asian Earth Sci. 23, 691–703. doi:10.1016/s1367-9120(03)00118-4
Cheng, Y., and Zhang, R. (2006). Mineralization regularity of Cu-Au deposits in the Baogutu area, western Junggar, Xinjiang (in Chinese with English abstract). Geol. Prospect. 42, 11–15.
Cheng, Y., Zhang, R., and Qi, G. (2009). “Mineralization regularity of Cu-Au deposits in the Baogutu area, western Junggar, Xinjiang,”, 32. Xinjiang nonferrous metals, 29–30.
Egbert, G. D., and Booker, J. R. (1986). Robust estimation of geomagnetic transfer functions. Geophys. J. R. Astronomical Soc. 87, 173–194. doi:10.1111/j.1365-246X.1986.tb04552.x
Egbert, G. D., and Kelbert, A. (2012). Computational recipes for electromagnetic inverse problems. Geophys. J. Int. 189, 251–267. doi:10.1111/j.1365-246x.2011.05347.x
Egbert, G. D., Yang, B., Bedrosian, P. A., Key, K., Livelybrooks, D. W., Schultz, A., et al. (2022). Fluid transport and storage in the cascadia forearc influenced by overriding plate lithology. Nat. Geosci. 15, 677–682. doi:10.1038/s41561-022-00981-8
Garcia, X., and Jones, A. (2002). Atmospheric sources for audio-magnetotelluric (AMT) sounding. Geophysics 67, 448–458. doi:10.1190/1.1468604
Hu, X., Peng, R., Wu, G., Wang, W., Huo, G., and Han, B. (2013). Mineral exploration using CSAMT data: application to longmen region metallogenic belt, guangdong province, China. GEOPHYSICS 78, B111–B119. doi:10.1190/geo2012-0115.1
Jahn, B. M., Capdevila, R., Liu, D., Vernon, A., and Badarch, G. (2004). Sources of Phanerozoic granitoids in the transect Bayanhongor-Ulaan Baatar, Mongolia: geochemical and Nd isotopic evidence, and implications for Phanerozoic crustal growth. J. Asian Earth Sci. 23, 629–653. doi:10.1016/s1367-9120(03)00125-1
Kelbert, A., Meqbel, N., Egbert, G. D., and Tandon, K. (2014). ModEM: a modular system for inversion of electromagnetic geophysical data. Comput. and Geosciences 66, 40–53. doi:10.1016/j.cageo.2014.01.010
Ma, C., Xiao, W., Windley, B. F., Zhao, G., Han, C., Zhang, J., et al. (2012). Tracing a subducted ridge-transform system in a late Carboniferous accretionary prism of the southern Altaids: orthogonal sanukitoid dyke swarms in Western Junggar, NW China. Lithos 140-141, 152–165. doi:10.1016/j.lithos.2012.02.005
Meqbel, N. M., Egbert, G. D., Wannamaker, P. E., Kelbert, A., and Schultz, A. (2014). Deep electrical resistivity structure of the northwestern U.S. derived from 3-D inversion of USArray magnetotelluric data. Earth Planet. Sci. Lett. 402, 290–304. doi:10.1016/j.epsl.2013.12.026
Murphy, B. S., and Egbert, G. D. (2017). Electrical conductivity structure of southeastern North America: implications for lithospheric architecture and Appalachian topographic rejuvenation. Earth Planet. Sci. Lett. 462, 66–75. doi:10.1016/j.epsl.2017.01.009
Richards, J. P. (2003). Tectono-magmatic precursors for porphyry Cu-(Mo-Au) deposit formation. Econ. Geol. 98, 1515–1533. doi:10.2113/98.8.1515
Safonova, I. Y., Buslov, M. M., Iwata, K., and Kokh, D. A. (2004). Fragments of vendian-early carboniferous oceanic crust of the paleo-asian ocean in foldbelts of the altai-sayan region of central asia: geochemistry, biostratigraphy and structural setting. Gondwana Res. 7, 771–790. doi:10.1016/s1342-937x(05)71063-7
Share, P., Jones, A., Muller, M., Khoza, D., Miensopust, M., and Webb, S. (2014). An audio-magnetotelluric investigation of the Otjiwarongo and Katima Mulilo regions, Namibia. Geophysics 79, B151–B171. doi:10.1190/geo2013-0171.1
Shen, P., and Pan, H. (2013). Country-rock contamination of magmas associated with the Baogutu porphyry Cu deposit, Xinjiang, China. Lithos 177, 451–469. doi:10.1016/j.lithos.2013.07.019
Shen, P., and Pan, H. D. (2015). Methane origin and oxygen-fugacity evolution of the Baogutu reduced porphyry Cu deposit in the West Junggar terrain, China. Miner. Deposita 50, 967–986. doi:10.1007/s00126-015-0580-5
Shen, P., Shen, Y., Liu, T., Meng, L., Dai, H., and Yang, Y. (2009). Geochemical signature of porphyries in the Baogutu porphyry copper belt, Western Junggar, NW China. Gondwana Res. 16, 227–242. doi:10.1016/j.gr.2009.04.004
Shen, P., Shen, Y., Pan, H., Li, X. H., Dong, L., Wang, J., et al. (2012). Geochronology and isotope geochemistry of the Baogutu porphyry copper deposit in the West Junggar region, Xinjiang, China. J. Asian Earth Sci. 49, 99–115. doi:10.1016/j.jseaes.2011.11.025
Shen, P., Shen, Y., Pan, H., Wang, J., Zhang, R., and Zhang, Y. (2010). Baogutu porphyry Cu-Mo-Au deposit, West Junggar, northwest China: petrology, alteration, and mineralization. Econ. Geol. 105, 947–970. doi:10.2113/econgeo.105.5.947
Shi, Y., Ouyang, Y., Xu, Y., Yang, B., and Liu, S. (2021). Three-dimensional electrical structure of the Taqian-Zhuxi copper-tungsten polymetallic deposits, South China Denver, CO and virtual. Society of Exploration Geophysicists, 1271–1274. doi:10.1190/segam2021-3580700.1
Shi, Y., Xu, Y., Yang, B., Peng, Z., and Liu, S. (2020). Three-dimensional audio-frequency magnetotelluric imaging of Zhuxi copper-tungsten polymetallic deposits, South China. J. Appl. Geophys. 172, 103910. doi:10.1016/j.jappgeo.2019.103910
Sinharay, R., Srivastava, S., and Bhattacharya, B. (2010). Audiomagnetotelluric studies to trace the hydrological system of thermal fluid flow of Bakreswar Hot Spring, Eastern India: a case history. GEOPHYSICS 75, B187–B195. doi:10.1190/1.3431532
Su, Y., Tang, H., Hou, G., and Liu, C. (2006). Geochemistry of aluminous A-type granites along Darabut tectonic belt in West Junggar, Xinjiang (in Chinese with English abstract). Geochimica 35, 55–67.
Tang, G., Wang, Q., Wyman, D. A., Li, Z. X., Zhao, Z. H., Jia, X. H., et al. (2010). Ridge subduction and crustal growth in the Central Asian Orogenic Belt: evidence from Late Carboniferous adakites and high-Mg diorites in the western Junggar region, northern Xinjiang (west China). Chem. Geol. 277, 281–300. doi:10.1016/j.chemgeo.2010.08.012
Wan, H., and Wang, Q. (2023). Electrical structure of gulu geothermal field in southern tibet and its implication for the high-temperature geothermal system. Front. Earth Sci. 11. doi:10.3389/feart.2023.1138360
Wang, J., and Xu, X. (2006). Post-collisional tectonic evolution and metallogenesis in northern Xinjiang, China (in Chinese with English abstract). Acta Petrol. Sin. 80, 23–31.
Wang, N., Zhao, S., Hui, J., and Qin, Q. (2017). Three-dimensional audio-magnetotelluric sounding in monitoring coalbed methane reservoirs. J. Appl. Geophys. 138, 198–209. doi:10.1016/j.jappgeo.2017.01.028
Wei, S., Zhu, Y., and An, F. (2014). Mineralization and elements migration characteristics of porphyry copper deposits in Baogutu area, Xinjiang (in Chinese with English abstract). Mineral. Deposits 33, 165–180.
Windley, B. F., Kroner, A., Guo, J., Qu, G., Li, Y., and Zhang, C. (2002). Neoproterozoic to paleozoic geology of the altai orogen, NW China: new zircon age data and tectonic evolution. J. Geol. 110, 719–737. doi:10.1086/342866
Xu, H., Luo, Y., Chen, C., and Xu, Y. (2016a). 3D shallow structures in the Baogutu area, Karamay, determined by eikonal tomography of short-period ambient noise surface waves. J. Appl. Geophys. 129, 101–110. doi:10.1016/j.jappgeo.2016.03.037
Xu, Y., Yang, B., Zhang, S., Liu, Y., Zhu, L., Huang, R., et al. (2016b). Magnetotelluric imaging of a fossil paleozoic intra-oceanic subduction zone in western junggar, NW China. J. Geophys. Res. Solid Earth 121, 4103–4117. doi:10.1002/2015JB012394
Xu, Y., Zhang, S., Griffin, W. L., Yang, Y., Yang, B., Luo, Y., et al. (2016c). How did the Dabie Orogen collapse? Insights from 3-D magnetotelluric imaging of profile data. J. Geophys. Res. Solid Earth 121, 5169–5185. doi:10.1002/2015JB012717
Yakubchuk, A. (2004). Architecture and mineral deposit settings of the Altaid orogenic collage: a revised model. J. Asian Earth Sci. 23, 761–779. doi:10.1016/j.jseaes.2004.01.006
Yang, B., Egbert, D. G., Kelbert, A., and Naser, M. M. (2015). Three-dimensional electrical resistivity of the north-central USA from EarthScope long period magnetotelluric data. Earth Planet. Sci. Lett. 422, 87–93. doi:10.1016/j.epsl.2015.04.006
Yang, B., Zhang, A., Zhang, S., Liu, Y., Zhang, S., Li, Y., et al. (2016). Three-dimensional audio-frequency magnetotelluric imaging of Akebasitao granitic intrusions in Western Junggar, NW China. J. Appl. Geophys. 135, 288–296. doi:10.1016/j.jappgeo.2016.10.010
Yang, Z. (2008). Geological and geochemical anomalies of porphyry Cu deposit in Baogutu area, Tuoli country, Xinjiang, China (in Chinese with English abstract). Xinjiang nonferrous Met. 31, 14–16.
Yin, J., Yuan, C., Sun, M., Long, X., Zhao, G., Wong, K. P., et al. (2010). Late Carboniferous high-Mg dioritic dikes in Western Junggar, NW China: geochemical features, petrogenesis and tectonic implications. Gondwana Res. 17, 145–152. doi:10.1016/j.gr.2009.05.011
Yin, J., Yuan, C., Wang, Y., Long, X., and Guan, Y. (2011). Magmatic records on the late paleozoic tectonic evolution of western junggar,xinjiang (in Chinese with English abstract). Geotect. Metallogenia 35, 278–291.
Zhang, L., Wang, G., Gao, R., Shen, T., Zong, R., and Yan, W. (2015). U-pb chronology of detrital zircons from the carboniferous sequences and its geological implications in west Junggar (in Chinese with English abstract). Geotect. Metallogenia 39, 704–718.
Zhang, R., Yunxiao, Z., Tong, G., Wang, J., and Li, L. (2006). Major breakthrough in copper exploration in the Baogutu porphyry copper deposit, western Junggar, Xinjiang, and its significance (in Chinese with English abstract). Geol. China 33, 1354–1360.
Zhang, Z., Yang, F., Yan, S., Zhang, R., Chao, F., and Geng, X. (2010). Sources of ore-forming fluids and materials of the Baogutu porphyry copper deposit in Xinjiang Constraints from sulfur-hydrogen-oxygen isotopes geochemistry (in Chinese with English abstract). Acta Petrol. Sin. 26, 707–716.
Zhang, Z., Zhou, G., Kusky, T. M., Yan, S., Chen, B., and Zhao, L. (2009). Late Paleozoic volcanic record of the Eastern Junggar terrane, Xinjiang, Northwestern China: major and trace element characteristics, Sr-Nd isotopic systematics and implications for tectonic evolution. Gondwana Res. 16, 201–215. doi:10.1016/j.gr.2009.03.004
Zhao, Z., Xiong, X., Wang, Q., Bai, Z., and Qiao, Y. (2009). Late paleozoic underplating in north xinjiang: evidence from shoshonites and adakites. Gondwana Res. 16, 216–226. doi:10.1016/j.gr.2009.03.001
Zheng, B., An, F., and Zhu, Y. (2009). Native bismuth found in Baogutu gold deposit and its geological significance (in Chinese with English abstract). Acta Petrol. Sin. 25, 1426–1436.
Zheng, B., Zhu, Y., An, F., Huang, Q. Y., and Qiu, T. (2015). As-Sb-Bi-Au mineralization in the Baogutu gold deposit, Xinjiang, NW China. Ore Geol. Rev. 69, 17–32. doi:10.1016/j.oregeorev.2015.01.019
Keywords: western Junggar, Baogutu, AMT, electrical resistivity structure, porphyry copper belt
Citation: Yang B, Meng X, Wu Y, Yang L and Xu Y (2025) Imaging Baogutu granitic intrusions in Western Junggar, NW China using an audio-frequency magnetotelluric array. Front. Earth Sci. 13:1519524. doi: 10.3389/feart.2025.1519524
Received: 30 October 2024; Accepted: 03 March 2025;
Published: 21 March 2025.
Edited by:
Yohan Guyodo, UMR7154 Institut de Physique du Globe de Paris (IPGP), FranceReviewed by:
Rong-wen Guo, Central South University, ChinaCopyright © 2025 Yang, Meng, Wu, Yang and Xu. This is an open-access article distributed under the terms of the Creative Commons Attribution License (CC BY). The use, distribution or reproduction in other forums is permitted, provided the original author(s) and the copyright owner(s) are credited and that the original publication in this journal is cited, in accordance with accepted academic practice. No use, distribution or reproduction is permitted which does not comply with these terms.
*Correspondence: Yixian Xu, eHl4aWFuQHpqdS5lZHUuY24=; Bo Yang, Ym8ueWFuZ0B6anUuZWR1LmNu
Disclaimer: All claims expressed in this article are solely those of the authors and do not necessarily represent those of their affiliated organizations, or those of the publisher, the editors and the reviewers. Any product that may be evaluated in this article or claim that may be made by its manufacturer is not guaranteed or endorsed by the publisher.
Research integrity at Frontiers

Learn more about the work of our research integrity team to safeguard the quality of each article we publish.