 Haomin Liu1*
 Ran Zhang
 Ruikang Cui
95% of researchers rate our articles as excellent or good
Learn more about the work of our research integrity team to safeguard the quality of each article we publish.
Find out more
METHODS article
Front. Earth Sci. , 19 February 2025
Sec. Solid Earth Geophysics
Volume 13 - 2025 | https://doi.org/10.3389/feart.2025.1519040
This article is part of the Research Topic Advances in Petrophysics of Unconventional Oil and Gas View all 9 articles
The quantity of gas adsorbed by shale, typically quantified using the Langmuir equation in isothermal adsorption experiments, is a critical metric for evaluating the gas content and resource potential of shale formations. However, the Langmuir equation frequently underestimates the actual adsorption capacity of shale gas reservoirs because it does not differentiate between excess and absolute adsorption capacities. To address this limitation, the simplified local density (SLD) model effectively characterizes excess adsorption in porous materials. Consequently, the SLD model was employed alongside isothermal adsorption experiments conducted under diverse conditions. The Levenberg-Marquardt (LM) algorithm was utilized to develop a shale adsorption model that integrates the effects of pressure, temperature, and moisture. To achieve this, several isothermal adsorption experiments with methane were conducted at various temperatures and water saturation levels, facilitating a detailed analysis of adsorption mechanisms influenced by temperature and moisture individually. Additionally, the combined effects of these factors on the adsorption mechanism were examined, resulting in a predictive adsorption model that incorporates both temperature and moisture variables, based on the SLD model and LM algorithm. The findings demonstrate that the SLD model effectively fits shale gas adsorption data under varied conditions, with average absolute deviations remaining below 10%. When both temperature and moisture simultaneously impact the adsorption capacity of shale gas, their effects tend to counteract each other, as they primarily influence methane adsorption within the same shale pores. The temperature- and moisture-responsive model derived from the SLD framework can predict the quantity of gas adsorbed in shale under varying temperatures and water saturation conditions. Experimental data from isothermal adsorption studies of Longmaxi shale, along with corroborating literature, confirm the model’s validity and applicability.
Shale gas leads the oil and gas exploration sector, with resource assessment serving as the foundation for comprehensive planning in gas field development and potential evaluation. In shale reservoirs, gas is primarily stored within the pore-fracture systems of shale formations, manifesting as adsorbed gas, free gas, and dissolved gas. Notably, adsorbed gas accounts for 25%–85% of the total reserves (Curtis, 2002). Therefore, it is essential to develop a comprehensive understanding of the adsorption mechanisms of shale gas under complex environmental conditions and to establish a reliable adsorption model for accurately estimating the storage, exploration, and development capacities of shale gas resources.
Currently, the evaluation of adsorbed gas content predominantly relies on indoor isothermal adsorption experiments. However, these experiments typically use dry cores (Babatunde et al., 2022; Jeong et al., 2022). Most research focuses on how pressure and temperature influence the adsorption characteristics of shale. Generally, increasing temperature inhibits adsorption, as the binding capacity of methane to shale decreases with rising heat. Nevertheless, actual shale reservoirs usually contain water (Ali et al., 2022; Ren et al., 2019), which further reduces methane adsorption. Consequently, the effect of moisture on shale adsorption characteristics is both significant and cannot be ignored (Li et al., 2017; Li et al., 2016; Yang et al., 2017).
In estimating adsorbed gas content under reservoir conditions, the Langmuir equation is primarily used to fit data from isothermal adsorption experiments. However, these experiments measure excess adsorption rather than absolute adsorption (Clarkson and Haghshenas, 2013), leading to significant underestimation of gas content. To address this, various theories and methods have been developed to explore shale’s adsorption characteristics, including molecular simulation (Yang et al., 2023), density functional theory (Yan and Yang, 2005), and the simplified local density (SLD) model (Huang et al., 2022; Qi et al., 2019).
Despite their potential, molecular simulation and density functional theory are often unsuitable for modeling macroscopic gas adsorption in shale due to their inherent complexity and high computational cost. The simplified local density (SLD) model, however, effectively simulates the isothermal adsorption curve by considering interactions between the adsorbent and adsorbate. Initially proposed by Rangarajan et al. (1995), this mean-field model accounts for both fluid-fluid and fluid-solid interaction potentials, with the selection of the equation of state (EOS) significantly influencing the simulation results.
Subsequent enhancements introduced various EOS, such as PR EOS (Subramanian et al., 1995), ESD EOS (Soule et al., 2001), Bender EOS (Puziy et al., 2003), PTV EOS (Zeng, 2017), and RKS EOS (Wu et al., 2022), to refine calculations of fluid fugacity, bulk phase fugacity, and fluid density, thereby improving model accuracy. To further enhance precision under high-pressure conditions, Fitzgerald et al. (2003) introduced an empirical parameter to adjust the co-volume parameter. These modifications have broadened the SLD model’s application, particularly in simulating gas adsorption in porous media (Chareonsuppanimit et al., 2012; Fitzgerald, 2005; Fitzgerald et al., 2006; Huang et al., 2022; Qi et al., 2019).
Notably, Fitzgerald et al. (2006) extended the SLD model to incorporate mixture adsorption by integrating fluid mixing rules, whereas Chareonsuppanimit et al. (2012) utilized it to predict the isothermal adsorption curves of carbon dioxide and methane in shale. These studies primarily focus on validating the applicability of the SLD model for various adsorbents or predicting adsorption using existing data. However, research examining temperature- and moisture-dependent supercritical adsorption models remains limited. In summary, although the SLD model has been extensively studied, it has not been applied under actual formation conditions. Some researchers contend that implementing a method in practice can be as challenging as developing a new one entirely.
The adsorption properties of shale are influenced by multiple factors during the shale gas adsorption process, yet most studies tend to isolate a single factor—such as temperature or moisture—in evaluating adsorption. Investigations exploring the combined influence of pressure, temperature, and moisture on shale’s adsorption mechanism are rare. In real shale reservoirs, the adsorbed gas content is affected by a variety of interrelated factors. To accurately estimate the adsorbed gas content under reservoir conditions, it is crucial to account for the combined effects of these variables. Developing a temperature- and moisture-dependent model, based on the SLD model, would provide a more reliable estimate of gas content under the complex conditions found in real-world shale formations.
Current research primarily focuses on validating the SLD model for diverse adsorbents or predicting adsorption using existing data. However, there is a paucity of studies on supercritical adsorption models incorporating both temperature and moisture. Although the SLD model has been extensively explored, it has not been fully applied under actual formation conditions. Researchers emphasize that implementing a theoretical method in practice can be as challenging as developing a new one. Shale adsorption properties are influenced by multiple factors; however, most studies examine only one factor at a time, such as temperature or moisture. The combined effects of pressure, temperature, and moisture on shale adsorption have been rarely investigated. In actual shale reservoirs, multiple factors influence the adsorbed gas content. To accurately determine this under reservoir conditions using the SLD model, it is essential to consider these combined influences and develop a model that accounts for dependencies on temperature and moisture. This approach would offer a more accurate representation of gas content in complex, real-world conditions.
The shale samples analyzed in this study were collected from the Sichuan Basin, China. As illustrated in Figure 1, the Sichuan Basin, situated in the eastern Qinghai-Tibet Plateau and the northwestern Yangtze Plate, is a multi-cycle, rhombohedral sedimentary superimposed basin that has undergone multi-stage and multidirectional deep fault activity throughout its geological history (Liu et al., 2018). Over geological time, a series of marine shale formations were deposited in the Ordovician Wufeng Formation and Silurian Longmaxi Formation within the Sichuan Basin. The burial depth of the shale reservoir generally ranges from 2,000 to 5,500 m. The Wufeng Formation predominantly contains black graptolite-rich siliceous shales and ash-bearing siliceous shales throughout the region, while gray shales or silty shales are found near the paleo-uplift. The thickness of this shale sequence is generally less than 10 m (Nie et al., 2017). Conversely, the Longmaxi Formation is characterized by extensive deposits of black graptolite-rich, organic-rich shales with thicknesses ranging from approximately 85–105 m.
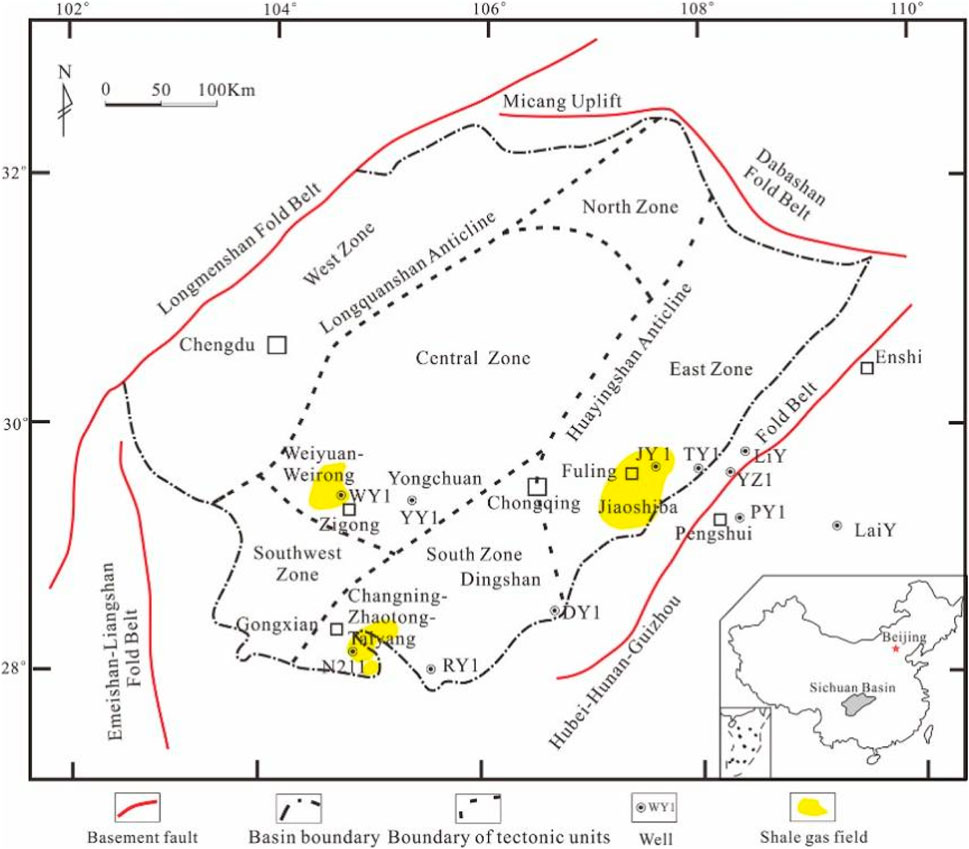
Figure 1. Geographical location of the study area (Nie, et al., 2021).
Table 1 summarizes the physical properties of the shale samples. Following established experimental protocols, porosity was measured using the helium method, and total organic carbon (TOC) was determined through high-temperature combustion of powdered samples. Specific surface area and pore size were determined through liquid nitrogen (N₂) adsorption experiments. Shale pore structure was characterized by analyzing the adsorption and desorption curves of N₂ within shale pores under low temperatures (77.4 K) and pressure. These data enable the calculation of specific surface area and pore size. Specific surface area was calculated using the BET equation (Brunauer et al., 1938), while pore size was determined through the BJH equation (Barrett et al., 1951). Whole-rock mineral composition and the relative content of clay minerals were analyzed using an X-ray diffractometer. Images of shale samples are provided in Figure 2.
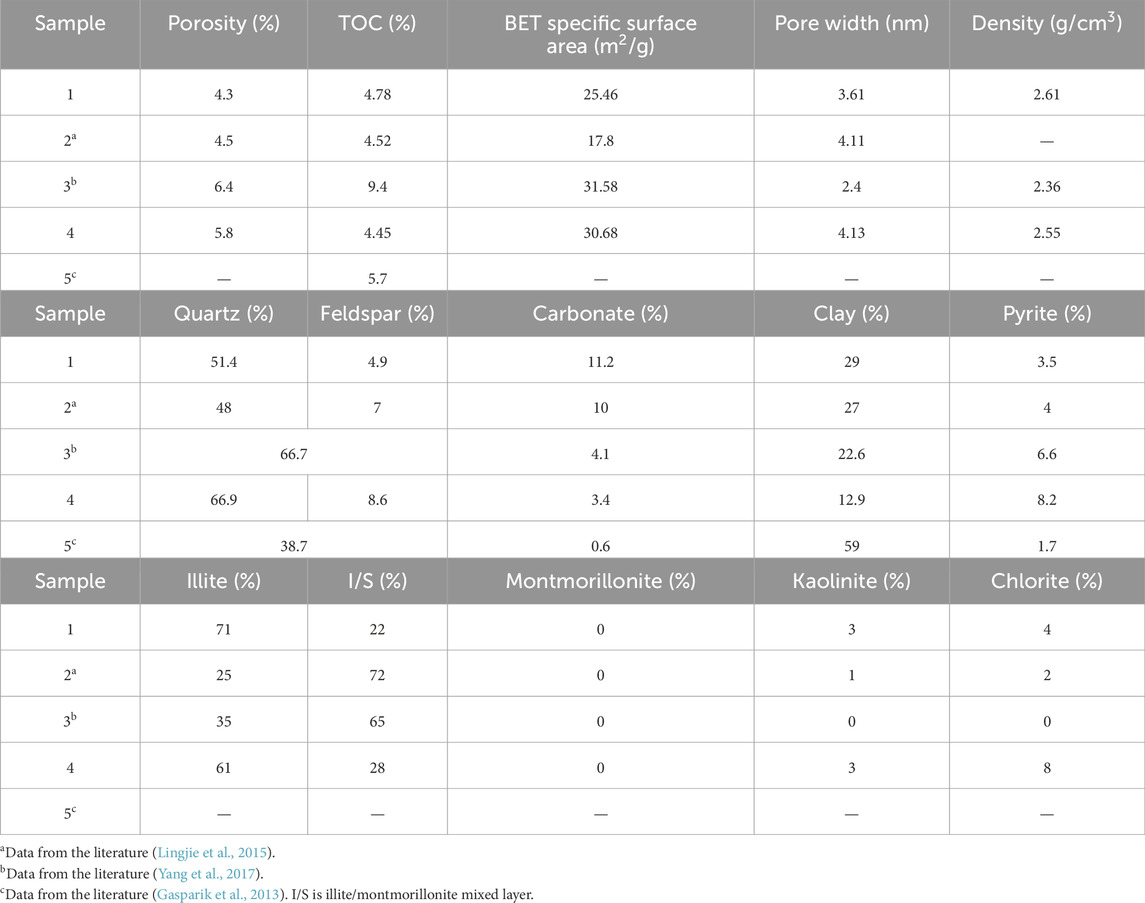
Table 1. Physical properties of shale samples.
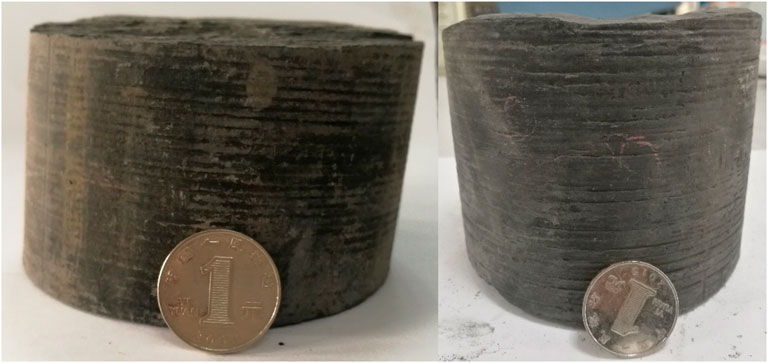
Figure 2. Photos of original full diameter samples of sample 1 and 2.
Table 2 details the isothermal adsorption data and conditions gathered in this research. It includes data for samples No. 1-5 from Table 1, collected under varying temperatures and water saturation levels. This information was analyzed to develop models dependent on both temperature and moisture. Specifically, data from samples 1 and 2 were used to explore how temperature affects the adsorption mechanism of shale, while samples 1 and 3 provided insights into the impact of water saturation. Additionally, samples 4 and 5 were examined to understand the combined effects of temperature and moisture. Through comprehensive analysis of these samples, a model accounting for both temperature and moisture influences was developed.
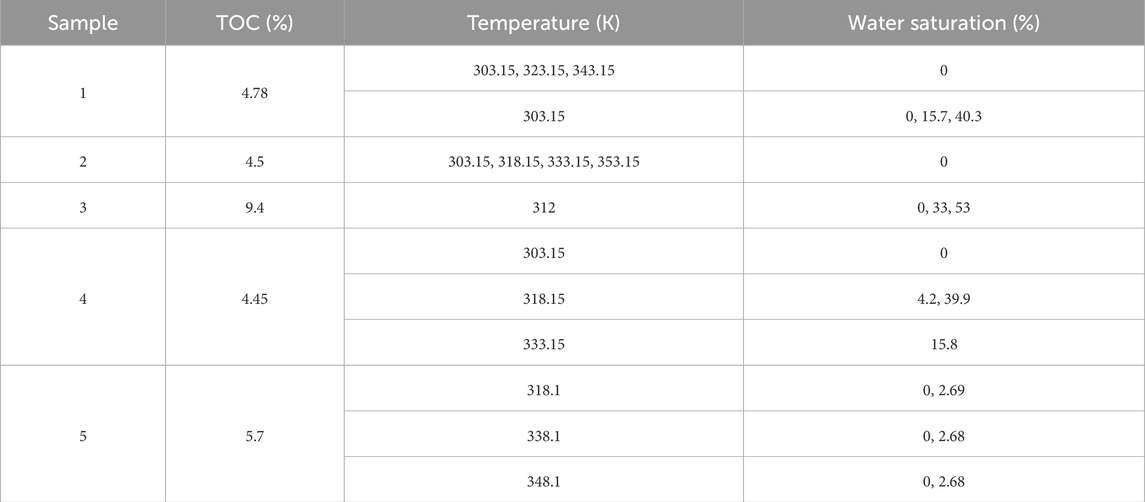
Table 2. Experiments and corresponding experimental conditions.
The isothermal adsorption method is widely recognized as the standard approach for evaluating shale’s adsorption properties. This technique evaluates the gas adsorption capacity of shale per unit mass by maintaining constant temperature and varying pressure. In this study, the volumetric method was used to quantify shale’s adsorption capacity per unit mass. The volumetric technique involves placing the shale sample in a chamber, introducing helium to fill the non-adsorbed space, followed by methane gas. Methane is partially adsorbed by the shale, reaching equilibrium over time. The adsorption capacity per unit mass is determined by the change in gas volume within the chamber. At a constant temperature, methane is adsorbed at different pressures, forming a characteristic adsorption layer on the shale surface. However, as the adsorbed phase volume cannot be directly measured, the absolute adsorption amount remains inaccessible. The excess adsorption amount (or experimental adsorption amount) is measured, with the relationship between excess and absolute adsorption amounts provided by the following conversion formula:
Where mabs represents the absolute adsorption amount, g; mex is the excess adsorption amount, g; ρg is the density of methane, mol·m−3; ρɑ refers to the density of the adsorbed phase, mol·m−3.
Rangarajan et al. (1995) applied the mean-field approximation to general density functional theory, leading to the formulation of the simplified local density (SLD) model. This model posits that interactions between adsorbate molecules, as well as those between adsorbates and adsorbent surfaces, collectively govern the adsorption process. Specifically, fluid-fluid interactions among adsorbate molecules and fluid-solid interactions between adsorbates and the adsorbent surface are both critical to the adsorption process. Interactions among adsorbate molecules are modeled using an equation of state (EOS), whereas those between adsorbates and pore walls are represented by potential energy functions. As shown in Figure 3, the SLD model simplifies the pores of the adsorbent into slit pores. The adsorbates with z from one pore wall are located between the pore walls with a pore width of L, and the adsorbates are simultaneously subjected to the common forces of both pore walls and other adsorbates.
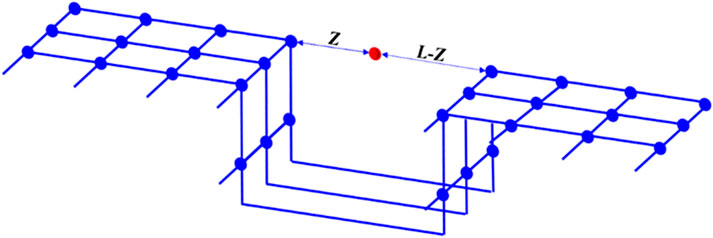
Figure 3. Schematic diagram of simplified local density model. It is assumed that the pores of the adsorbent are slit pores and the adsorbates are located between the two pore walls.
At adsorption equilibrium, the chemical potential of adsorbates at a specific position z includes both fluid-fluid and fluid-solid chemical potentials, equating to the chemical potential in the bulk phase.
Where μ(z) is the chemical potential at the z position in the pore, J·mol−1; z is the distance between the adsorbates and the pore wall, nm; μff(z) is the fluid-fluid interaction chemical potential at position z in the pore, J·mol−1; μfs(z) is the fluid-solid interaction chemical potential at position z in the pore, J·mol−1; μbulk is the bulk chemical potential in the pore, J·mol−1.
According to thermodynamic equilibrium, chemical potential can be expressed by fugacity in nanopores:
Where μ0(T) represents any reference state chemical potential, J·mol-1; ƒ0 refers to the fugacity of any reference state, Pa; ƒbulk and ƒff(z) are respectively the bulk fugacity and the adsorption phase fugacity at z position in the pore, Pa.
In nanopores, the adsorbates are subjected to the force of the pore walls on both sides, and the chemical potential generated can be expressed as follows (Rangarajan et al., 1995):
Where NA is Avogadro’s number; Ψfs(z) and Ψfs(L-z) are the potential energy generated by the interaction between adsorbates at position z in the pore and the pore walls on both sides, J.
Equations 1–4 can be obtained simultaneously:
Where k refers to Boltzmann’s constant, 1.3806505 × 10⁻²³ J·K−1.
The potential energy generated by the interaction between adsorbates at position z in the pore and the pore walls on both sides can be calculated by Lee’s 10–4 potential model (Lee and Brenner, 1988):
where,
Where ρatmos is the density of carbon atoms, 38.2 atoms·nm−2; εfs is the fluid-solid interaction energy, J; εfs is the fluid-fluid interaction energy, J; εss is the solid-solid interaction energy, J; σfs is the diameter of fluid-solid, m; σss is the interplanar distance of carbon, 3.35 × 10⁻¹⁰ m.
In the SLD model, the fluid equation of state is used to determine parameters like fluid fugacity, bulk fugacity, and fluid density. In this study, after evaluating various fluid equations of state, the PR-EOS was selected for computing these parameters. The equation is given by Subramanian et al. (1995):
where
The term α(T) is expressed as (Gasem et al., 2001):
Where P represents pressure, Pa; ρb is the bulk density, mol·m−3; ɑ and b are respectively the attraction parameter and covolume, m3·mol−1; ω is the eccentricity factor, Tc is the critical temperature, K; Pc is the critical pressure, Pa. The related physical properties of methane are shown in Table 3 Reid et al. (1987).

Table 3. The physical properties of methane.
In the PR-EOS, the bulk fugacity is calculated as follows.
Similarly, considering the fluid-fluid interaction, the fluid fugacity in situ of the nanopore is calculated as follows:
Where ρ(z) refers to the fluid density in situ of the nanopore, mol·m−3; ɑ(z) is the attraction parameter, J·m3·mol−2. ɑ(z) is the position function of adsorbate molecules in nanopores, which can be calculated by the formula proposed by (Chen et al., 1997).
By combining Equations 5–14, density distribution of shale gas in nanopores is thus calculated. The expression of excess adsorption amount is as follows:
Where nex is the excess adsorption amount, m3·g−1; A is BET specific surface area, m2·kg−1; The lower limit and upper limit of the integral are respectively 3/8σff and L-3/8σff (Qi et al., 2019); Z is the gas compression factor.
To determine the in situ fluid density using the SLD model, the pores were divided into intervals of 0.01 nm. The local in situ fluid density for each interval was calculated, and the excess adsorption was determined using the composite Simpson’s method for integration.
The aim of this research is to develop a shale gas adsorption model that considers variations in temperature and moisture content, using data from isothermal adsorption experiments alongside the SLD model. This approach enables the direct calculation of shale gas adsorption under different conditions. The problem of parameter regression is reframed as a least-squares error minimization problem with two input and two output parameters (Golsanami et al., 2019; Yang et al., 2016). To address this, the paper uses the Levenberg-Marquardt (LM) algorithm to solve the least squares problem.
The core idea of the LM algorithm is its integration with the trust region method, allowing the objective function to satisfy the linearization condition within a specific interval, thereby effectively solving nonlinear least squares problems. The core idea is to balance the convergence speed and stability of the algorithm by dynamically adjusting the damping factor, combining the advantages of Gauss-Newton method and gradient descent method. The calculation formula of LM method is:
Where yi is the experimental result and fi(x) is the predicted value of the model.
Temperature is a condition that cannot be ignored when studying the adsorption characteristics of shale. In this section, methane adsorption characteristics of two shales at different temperatures (303.15K-353.15K) are studied. The isothermal adsorption experiment results are shown in Figure 4 and Table 4. In this paper, the mean absolute error generated when calculating model regression by %AAD is used to characterize model accuracy:
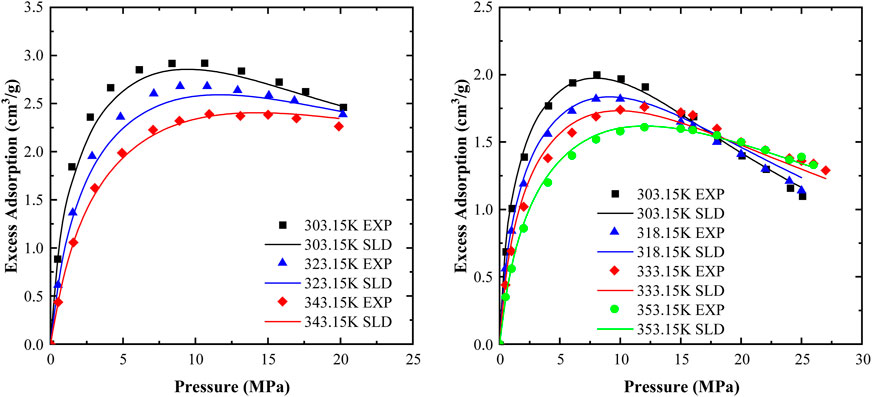
Figure 4. Experimental and modeling results at different temperatures.
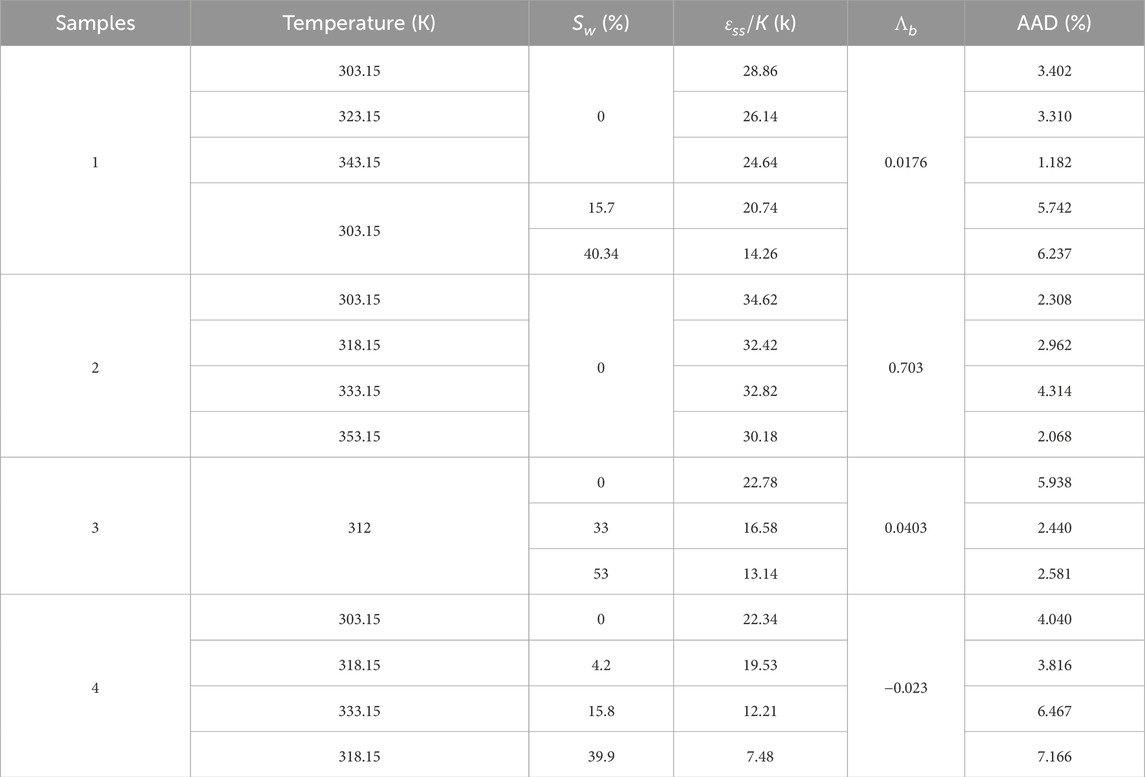
Table 4. SLD model regression results.
Where ni,calculated and ni,test are respectively calculated adsorption capacity and experimental adsorption capacity at adsorption equilibrium, m3·g−1. N represents the number of equilibrium adsorption points.
As can be seen from Figure 4, when the temperature remains unchanged, the excess adsorption amount rises sharply with the increase of pressure at the low-pressure stage. With the pressure increasing gradually, the excess adsorption amount increases slowly and reaches the maximum value at about 12 MPa. As the pressure continues to increase, the excess adsorption amount gradually decreases. The excess adsorption amount gradually decreases with the increase of temperature at the low-pressure stage. In the high-pressure phase, there is a reversal phenomenon, that is, with the increase of temperature, the excess adsorption amount gradually increases. This is because the adsorption of methane by shale is physical adsorption, which is an exothermic process. As the temperature rises, the kinetic energy of adsorbed methane increases, resulting in the reduction of the force between methane and the solid surface, thus weakening the adsorption capacity of shale (Chen et al., 2019; Heller and Zoback, 2014; Huang et al., 2022; Li et al., 2016). In addition, it is found that the adsorption of gas in shale is positively correlated with the number of micropores. The increase of temperature will change the pore structure of shale, resulting in the blocking or reduction of the number of micropores, and further weakening the methane adsorption capacity of shale (Li et al., 2021a; Mu et al., 2022).
Water generally exists in shale reservoirs, which can affect the gas adsorption capacity of shale reservoirs. The initial water saturation range of shale reservoir is 0%–70% (Ali et al., 2022; Ren et al., 2019). Therefore, this section studies the adsorption characteristics of shale in the 0%–70% water saturation range of two Longmaxi shales. The isothermal adsorption experiment data are shown in Figure 5. The SLD model is used to fit the data, and the regression results are shown in Table 4.
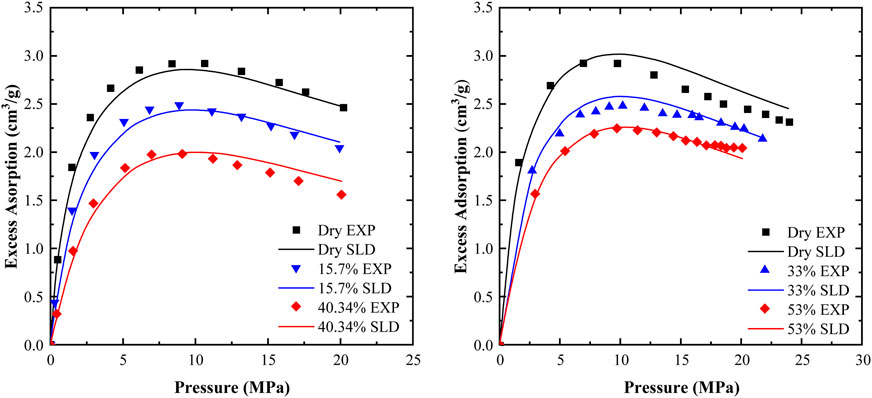
Figure 5. Experimental and modeling results at different water saturation.
Figure 5 illustrates that with constant water saturation, the excess adsorption increases sharply as pressure rises during the low-pressure phase. As pressure continues to rise, the rate of excess adsorption increase progressively slows. After reaching its peak, the excess adsorption gradually decreases as pressure continues to increase. With constant pressure, the excess adsorption gradually decreases as water saturation increases. Unlike the effect of temperature on isothermal adsorption, inversion of excess adsorption does not occur during the high-pressure phase.
Water molecules inhibit methane adsorption on shale pore surfaces. The adsorption process of shale with water is shown in Figure 6. The interaction between liquid, gas and solid phases in shale pores affects the adsorption characteristics of methane molecules in shale (Li et al., 2016). At low water saturation, water and methane molecules compete for adsorption. However, the molecular force between water molecules and the pore surface of shale is hydrogen bond (Ma and Yu, 2022; Yang et al., 2020a), and the molecular force between methane molecules and the pore surface is van der Waals force. The hydrogen bonds are stronger than van der Waals forces. Water preferentially adsorbs and occupies the methane adsorption potential, which leads to the decrease of methane adsorption capacity. At high water saturation, water molecules form water films on the pore surface of shale and even produce capillary condensation in the nanopores, blocking the pore size. The production and thickening of water film narrow the diffusion path of methane molecules (Zhang and Yu, 2022), resulting in methane molecules unable to contact the pore surface of shale.
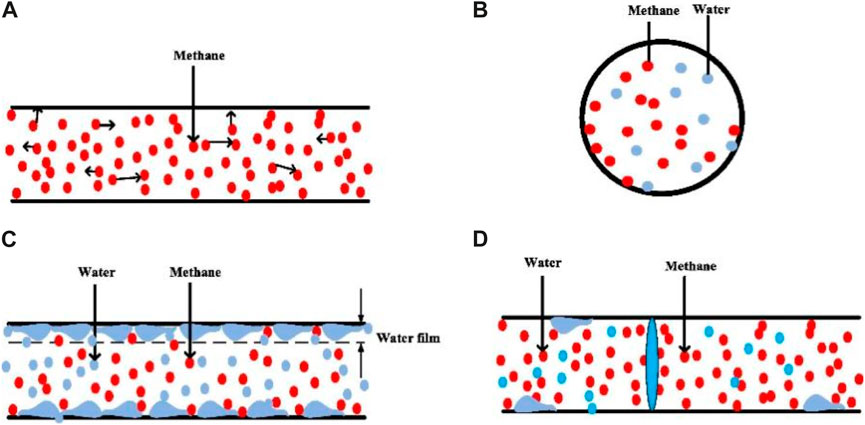
Figure 6. Effect of water on shale methane adsorption (Li et al., 2021b). Water and methane are in competitive adsorption state in shale pores. Due to the stronger adsorption capacity between shale and water, water molecules are first adsorbed on the pore surface and form a water film, which hinders the adsorption and flow of methane. As water saturation increases, water molecules generate capillary condensation in the nanopore, clogging the pore. (A) Dry, (B) Competitive adsorption, (C) Water film effect, (D) Blocking effect.
The effect of moisture on pore size of shale is another factor affecting the adsorption capacity of shale. Methane preferentially adsorbs in pores with strong adsorption capacity, and micro-pore filling occurs with the increase of pressure (Mu et al., 2022; Yang et al., 2020b) found that the maximum adsorption phase density occurred in the mesopore with a pore size of 4 nm. The competitive adsorption between water and methane is mainly concentrated in the mesopore (Zhang and Yu, 2022), and the affinity of pores to water is higher than that to methane in pores with pore size less than 30 nm (Ruppert et al., 2013; Sun, 2020) found this by studying pore widths in dry and moisture samples. Compared with dry samples, the content of pores with pore width less than 10 nm in moisture samples is significantly reduced, while the content of pores with pore width more than 10 nm is not significantly different, indicating that water in shale mainly affects pores with pore width less than 10 nm. Therefore, water content in shale decreases the mesopore content of methane, which leads to the decrease of adsorption capacity of shale.
Under actual reservoir conditions, high temperature and moisture coexist, which have synergistic negative effects on gas adsorption capacity. This section studies the methane adsorption characteristics of two shales under different temperature and water saturation states. The isothermal adsorption experiment results are shown in Figure 7. The SLD model and LM algorithm are used to fit the data (sample 5 lacks specific surface area and other experimental results, and is not fitted by the SLD model). The regression results are shown in Table 4. The relatively low %AADs listed in Table 4 indicate that the experimental results are in good agreement with those calculated using the SLD model.
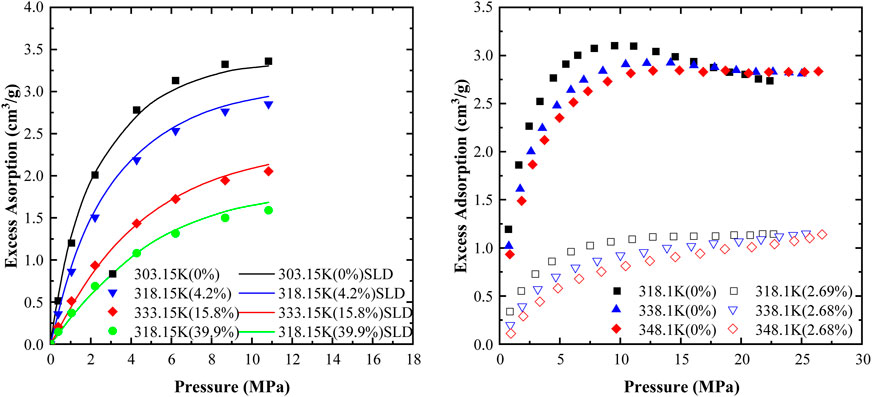
Figure 7. Experimental and modeling results at different temperatures and water saturation.
According to Figure 7, during the change of methane pressure, the variation law of excess adsorption amount in shale is basically consistent with that described above. Compared with dry shale, the adsorption capacity of methane in moisture shale is significantly lower.
Temperature and moisture individually reduce the gas adsorption capacity of shale reservoirs; however, their coexistence results in combined effects. Previous studies have shown that water molecules preferentially occupy micropores in water-containing shale, while methane is adsorbed in micropores larger than 1.5 nm. Increasing temperatures can alter the pore structure of shale, leading to clogged or reduced pore sizes. In such cases, temperature and moisture may counteract each other as they primarily influence methane adsorption within the same shale pores. Gasparik et al. (2013) and Zou et al. (2019) also concluded that water and high temperature counteract each other based on their study of shale’s thermodynamic parameters.
According to the above analysis and discussion, the SLD model can well fit the adsorption capacity of shale under different specific conditions. According to Table 4, εss varies with water saturation and temperature, which indicates that there is a specific functional relationship between εss and them (Fitzgerald, 2005).found a linear relationship between εss and temperature through extensive experiments:
Where εss,T and εss,0 are the solid-solid interaction energy at temperature T and T0, respectively; α is the regression coefficient.
Studies have found that the relationship between excess adsorption amount and water saturation is not simply linear, but exponential decay (Chen et al., 2012; Li et al., 2021b).Therefore, to characterize the influence of moisture on εss, the following exponential function is introduced:
Where εss,w and εss,0 are the solid-solid interaction energy at temperature Sw and 0, respectively; δ is the regression coefficient.
Under actual reservoir conditions, high temperature and moisture coexist, which have synergistic negative effects on gas adsorption capacity. Therefore, the prediction model of shale gas content considering the influence of temperature, pressure and moisture is:
Equation 15 and Equation 16 are used to globally fit all the excess adsorption data of different temperatures and water saturation in this study. The results of rock physics modeling using the LM algorithm are shown in Table 5 and Figure 8.
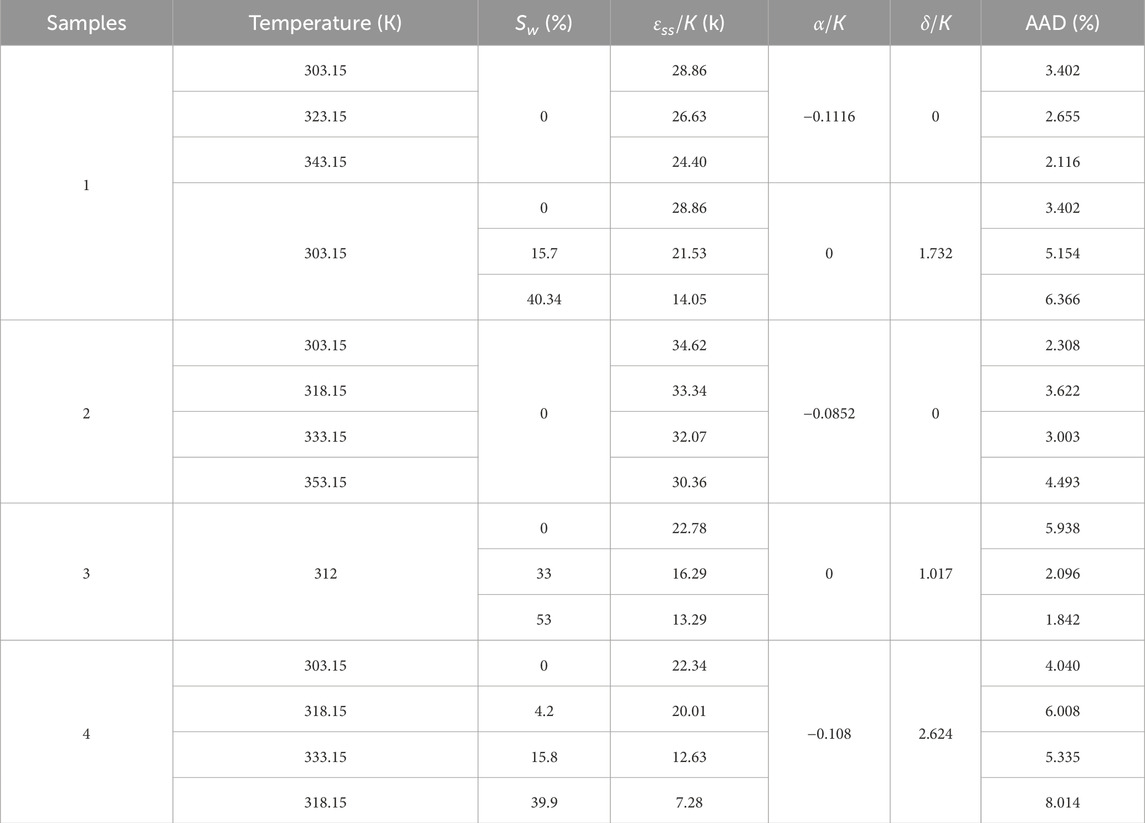
Table 5. SLD model prediction results.
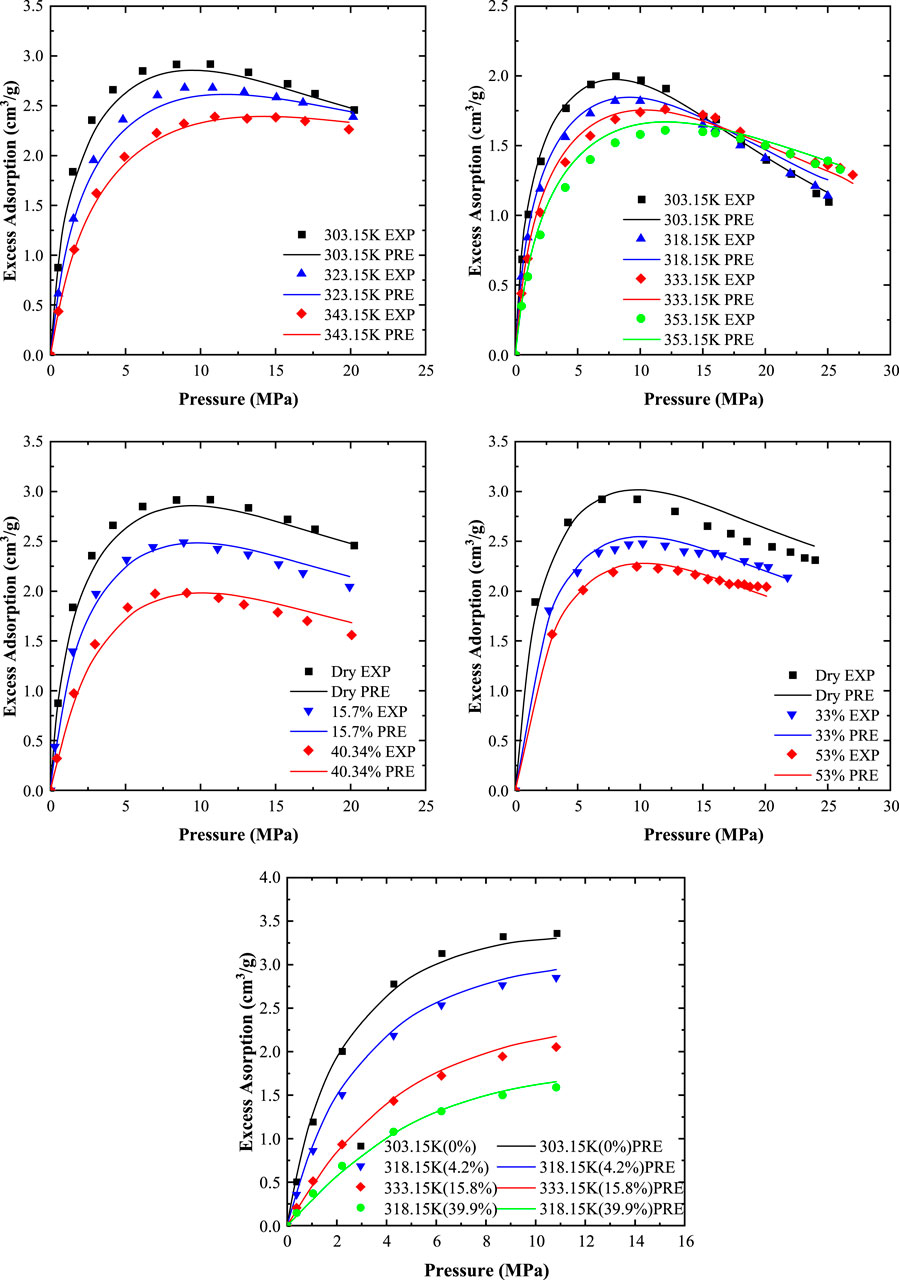
Figure 8. Experimental and modeling results at different temperatures and water saturation.
For the convenience of comparison, only the isothermal adsorption curves of shale at different temperatures and water saturations with corresponding experimental data are predicted. It can be seen from Table 5 and Figure 8 that the adsorption data calculated based on the temperature- and moisture-dependent model are very consistent with the experimental data, with %AAD between 1.8% and 8%, indicating that the model has a good fitting effect. The coefficients in the temperature- and moisture-dependent model shown in Table 5 may change due to the different geological conditions and reservoir properties of different shale gas reservoirs. This study aims to provide an idea for the establishment of a multi-factor shale gas adsorption model. According to this idea, the relationship between the adsorption capacity of shale in shale gas reservoir and various influencing factors is explored through experimental measurement, and a multi-factor adsorption model suitable for this reservoir is established, which can not only reduce the workload of experimental measurement on the premise of ensuring the calculation accuracy, but also provide guidance for the evaluation of adsorption gas.
In this study, we used the isothermal adsorption experiment to explore the shale adsorption mechanism under the combined action of temperature and water, and built the temperature- and moisture-dependence model based on the SLD model, which realized the direct calculation of the adsorption amount of shale gas under different conditions. At present, the researches on the influence of different factors on the adsorption characteristics of shale mainly consider only the single factor such as temperature or moisture, and few consider the influence of multiple factors. In the actual shale reservoir, shale adsorption is affected by many factors, so it is necessary to study the adsorption mechanism of shale under the combined action of many factors. The SLD model is widely used to describe the adsorption behavior of gas in porous media, but the SLD model is derived based on slit pores and constant pore width. As shown in Figures 9, 10, the gas density distribution is not only related to temperature and pressure, but also to pore size and pore geometry. Therefore, the SLD model has errors in characterizing the adsorption properties of shale with complex pore structure. This is one of the major limitations of our study. Secondly, this study focuses on the influence of multiple factors on the adsorption characteristics of shale, and does not consider the adsorption of multi-component gases. In fact, the gas in shale reservoir is multi-component gas, including CO2, C3H8 and other components. Therefore, in the next study, we will further integrate the pore geometry and pore size distribution into the SLD model, and then use the modified SLD model to analyze the multi-component gas adsorption mechanism in shale under the comprehensive influence of temperature and water saturation. In order to better understand the adsorption mechanism of shale gas under reservoir conditions, it is necessary to overcome these limitations and further strengthen the research.
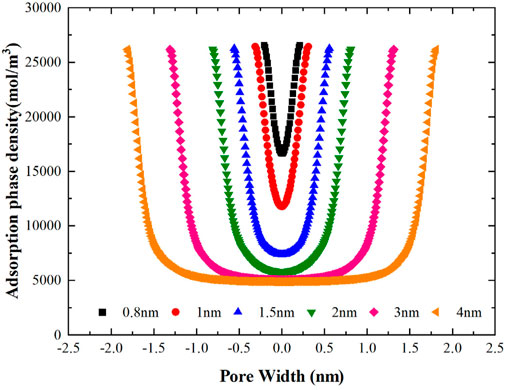
Figure 9. Gas density distribution curves with different pore widths.
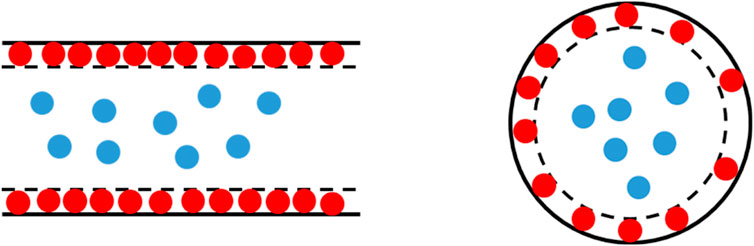
Figure 10. Schematic diagram of gas adsorption in slit pores and cylindrical pores.
In this paper, the influence mechanism of temperature and moisture on shale adsorption was studied, and a shale adsorption model considering the influence of pressure, temperature and moisture was constructed. The effectiveness and applicability of the model were verified by isothermal adsorption experimental data and published experimental data of Longmaxi shales. The main conclusions are as follows:
(1) Under different specific conditions, the SLD model can well fit the adsorption data of shale gas, and the %AAD is less than 10%. However, the SLD model does not consider the relationship between excess adsorption and various external factors, such as temperature and moisture, so it cannot directly predict the adsorption gas content under different conditions.
(2) Temperature and moisture individually have negative impacts on shale adsorption characteristics and exhibit synergistic negative effects. Excess adsorption decreases with increasing temperature and water saturation, decreases linearly with temperature, and exhibits adsorption inversion at high pressure. Excess adsorption decreases exponentially with increasing water saturation. When temperature and water simultaneously influence shale gas adsorption capacity, they counteract each other, primarily affecting adsorption in the same shale pores.
(3) The SLD model method can be used to predict the isothermal adsorption curve of shale under different temperatures and water saturation. The solid-solid interaction energy only changes with temperature and water saturation. Once the relationship between εss and both is determined, the isothermal adsorption curve at another temperature and water saturation can be calculated with the help of the SLD model.
(4) The temperature- and moisture-dependent model based on the SLD model has high fitting accuracy to the isothermal adsorption data and published experimental data of shale. It can accurately predict the adsorption amount of shale under different pressure, temperature and water saturation conditions.
The original contributions presented in the study are included in the article/supplementary material, further inquiries can be directed to the corresponding authors.
HL: Writing–original draft, Writing–review and editing. RZ: Writing–original draft, Writing–review and editing. RC: Writing–original draft.
The author(s) declare that financial support was received for the research, authorship, and/or publication of this article. This work was supported by the National Natural Science Foundation of China (No. 72303242).
Author HL was employed by SINOPEC. Author RZ was employed by Sinopec Matrix Corporation and Sinopec Key Laboratory of Well Logging.
The remaining author declares that the research was conducted in the absence of any commercial or financial relationships that could be construed as a potential conflict of interest.
The author(s) declare that no Generative AI was used in the creation of this manuscript.
All claims expressed in this article are solely those of the authors and do not necessarily represent those of their affiliated organizations, or those of the publisher, the editors and the reviewers. Any product that may be evaluated in this article, or claim that may be made by its manufacturer, is not guaranteed or endorsed by the publisher.
Ali, N., Chen, J., Fu, X., Hussain, W., Ali, M., Hussain, M., et al. (2022). Prediction of cretaceous reservoir zone through petrophysical modeling: insights from kadanwari gas field, middle indus basin. Geosystems Geoenvironment 1 (3), 100058. doi:10.1016/j.geogeo.2022.100058
Babatunde, K. A., Negash, B. M., Jufar, S. R., Ahmed, T. Y., and Mojid, M. R. (2022). Adsorption of gases on heterogeneous shale surfaces: a review. J. Petroleum Sci. Eng. 208, 109466. doi:10.1016/j.petrol.2021.109466
Barrett, E. P., Joyner, L. G., and Halenda, P. P. (1951). The determination of pore volume and area distributions in porous substances. I. Computations from nitrogen isotherms. J. Am. Chem. Soc. 73 (1), 373–380. doi:10.1021/ja01145a126
Brunauer, S., Emmett, P. H., and Teller, E. (1938). Adsorption of gases in multimolecular layers. J. Am. Chem. Soc. 60 (2), 309–319. doi:10.1021/ja01269a023
Chareonsuppanimit, P., Mohammad, S. A., Robinson Jr, R. L., and Gasem, K. A. (2012). High-pressure adsorption of gases on shales: measurements and modeling. Int. J. Coal Geol. 95, 34–46. doi:10.1016/j.coal.2012.02.005
Chen, D., Pan, Z., Liu, J., and Connell, L. D. (2012). Modeling and simulation of moisture effect on gas storage and transport in coal seams. Energy and Fuels 26 (3), 1695–1706. doi:10.1021/ef2014327
Chen, J. H., Wong, D. S. H., Tan, C. S., Subramanian, R., Lira, C. T., and Orth, M. (1997). Adsorption and desorption of carbon dioxide onto and from activated carbon at high pressures. Industrial and Eng. Chem. Res. 36 (7), 2808–2815. doi:10.1021/ie960227w
Chen, L., Zuo, L., Jiang, Z., Jiang, S., Liu, K., Tan, J., et al. (2019). Mechanisms of shale gas adsorption: evidence from thermodynamics and kinetics study of methane adsorption on shale. Chem. Eng. J. 361, 559–570. doi:10.1016/j.cej.2018.11.185
Clarkson, C. R., and Haghshenas, B. (2013). “Modeling of supercritical fluid adsorption on organic-rich shales and coal,” in Paper presented at the SPE unconventional resources conference-USA.
Curtis, J. B. (2002). Fractured shale-gas systems. AAPG Bull. 86 (11), 1921–1938. doi:10.1306/61eeddbe-173e-11d7-8645000102c1865d
Fitzgerald, J., Sudibandriyo, M., Pan, Z., Robinson Jr, R., and Gasem, K. (2003). Modeling the adsorption of pure gases on coals with the SLD model. Carbon 41 (12), 2203–2216. doi:10.1016/s0008-6223(03)00202-1
Fitzgerald, J. E. (2005). Adsorption of pure and multi-component gases of importance to enhanced coalbed methane recovery: measurements and simplified local density modeling. PhD dissertation. Stillwater, OK: Oklahoma State University.
Fitzgerald, J. E., Robinson, R. L., and Gasem, K. A. (2006). Modeling high-pressure adsorption of gas mixtures on activated carbon and coal using a simplified local-density model. Langmuir 22 (23), 9610–9618. doi:10.1021/la060898r
Gasem, K., Gao, W., Pan, Z., and Robinson, Jr R. (2001). A modified temperature dependence for the Peng–Robinson equation of state. Fluid phase equilibria 181 (1-2), 113–125. doi:10.1016/s0378-3812(01)00488-5
Gasparik, M., Ghanizadeh, A., Gensterblum, Y., and Krooss, B. M. (2013). “Multi-temperature” method for high-pressure sorption measurements on moist shales. Rev. Sci. Instrum. 84 (8), 085116. doi:10.1063/1.4817643
Golsanami, N., Sun, J., Liu, Y., Yan, W., Lianjun, C., Jiang, L., et al. (2019). Distinguishing fractures from matrix pores based on the practical application of rock physics inversion and NMR data: a case study from an unconventional coal reservoir in China. J. Nat. Gas Sci. Eng. 65, 145–167. doi:10.1016/j.jngse.2019.03.006
Heller, R., and Zoback, M. (2014). Adsorption of methane and carbon dioxide on gas shale and pure mineral samples. J. Unconv. oil gas Resour. 8, 14–24. doi:10.1016/j.juogr.2014.06.001
Huang, X., Gu, L., Li, S., Du, Y., and Liu, Y. (2022). Absolute adsorption of light hydrocarbons on organic-rich shale: an efficient determination method. Fuel 308, 121998. doi:10.1016/j.fuel.2021.121998
Jeong, S. R., Park, J. H., Lee, J. H., Jeon, P. R., and Lee, C.-H. (2022). Review of the adsorption equilibria of CO2, CH4, and their mixture on coals and shales at high pressures for enhanced CH4 recovery and CO2 sequestration. Fluid Phase Equilibria 564, 113591. doi:10.1016/j.fluid.2022.113591
Lee, L. L., and Brenner, H. (1988). Molecular thermodynamics of nonideal fluids. Butterworth-Heinemann
Li, A., Ding, W., Zhou, X., Cao, X., Zhang, M., Fu, F., et al. (2017). Investigation of the methane adsorption characteristics of marine shale: a case study of Lower Cambrian Qiongzhusi Shale in eastern Yunnan Province, South China. Energy and Fuels 31 (3), 2625–2635. doi:10.1021/acs.energyfuels.6b03168
Li, J., Li, B., and Gao, Z. (2021a). Water vapor adsorption behavior in shale under different temperatures and pore structures. Nat. Resour. Res. 30 (3), 2789–2805. doi:10.1007/s11053-021-09846-0
Li, J., Li, B., Gao, Z., Zhang, Y., and Wang, B. (2021b). Adsorption behavior, including the thermodynamic characteristics of wet shales under different temperatures and pressures. Chem. Eng. Sci. 230, 116228. doi:10.1016/j.ces.2020.116228
Li, J., Li, X., Wang, X., Li, Y., Wu, K., Shi, J., et al. (2016). Water distribution characteristic and effect on methane adsorption capacity in shale clay. Int. J. Coal Geol. 159, 135–154. doi:10.1016/j.coal.2016.03.012
Lingjie, Y., Ming, F., Hongyu, C., Weixing, L., Wentao, Z., and Ershe, X. (2015). Isothermal adsorption experiment of organic-rich shale under high temperature and pressure using gravimetric method. Acta Pet. Sin. 36 (5), 557. doi:10.7623/syxb201505004
Liu, S., Deng, B., Jansa, L., Li, Z., Sun, W., Wang, G., et al. (2018). Multi-stage basin development and hydrocarbon accumulations: a review of the Sichuan Basin at eastern margin of the Tibetan Plateau. J. Earth Sci. 29, 307–325. doi:10.1007/s12583-017-0904-8
Ma, L., and Yu, Q. (2022). Experimental investigation into simultaneous adsorption of water vapor and methane onto shales. J. Hydrology 604, 127200. doi:10.1016/j.jhydrol.2021.127200
Mu, Z., Ning, Z., and Ren, C. (2022). Methane adsorption on shales and application of temperature-related composite models based on dual adsorption modes. J. Petroleum Sci. Eng. 208, 109379. doi:10.1016/j.petrol.2021.109379
Nie, H., Chen, Q., Zhang, G., Sun, C., Wang, P., and Lu, Z. (2021). An overview of the characteristic of typical Wufeng–Longmaxi shale gas fields in the Sichuan Basin, China. Nat. Gas. Ind. B 8 (3), 217–230. doi:10.1016/j.ngib.2021.04.001
Nie, H., Jin, Z., Ma, X., Liu, Z., Lin, T., and Yang, Z. (2017). Dispositional characteristics of ordovician Wufeng Formation and silurian Longmaxi Formation in Sichuan Basin and its adjacent areas. Petroleum Res. 2 (3), 233–246. doi:10.1016/j.ptlrs.2017.01.003
Puziy, A. M., Herbst, A., Poddubnaya, O. I., Germanus, J., and Harting, P. (2003). Modeling of high-pressure adsorption using the bender equation of state. Langmuir 19 (2), 314–320. doi:10.1021/la026062f
Qi, R., Ning, Z., Wang, Q., Huang, L., Wu, X., Cheng, Z., et al. (2019). Measurements and modeling of high-pressure adsorption of CH4 and CO2 on shales. Fuel 242, 728–743. doi:10.1016/j.fuel.2018.12.086
Rangarajan, B., Lira, C. T., and Subramanian, R. (1995). Simplified local density model for adsorption over large pressure ranges. AIChE J. 41 (4), 838–845. doi:10.1002/aic.690410411
Ren, W., Guo, J., Zeng, F., and Wang, T. (2019). Modeling of high-pressure methane adsorption on wet shales. Energy and Fuels 33 (8), 7043–7051. doi:10.1021/acs.energyfuels.9b01024
Ruppert, L. F., Sakurovs, R., Blach, T. P., He, L., Melnichenko, Y. B., Mildner, D. F., et al. (2013). A USANS/SANS study of the accessibility of pores in the Barnett Shale to methane and water. Energy and Fuels 27 (2), 772–779. doi:10.1021/ef301859s
Soule, A. D., Smith, C. A., Yang, X., and Lira, C. T. (2001). Adsorption modeling with the ESD equation of state. Langmuir 17 (10), 2950–2957. doi:10.1021/la000311n
Subramanian, R., Pyada, H., and Lira, C. T. (1995). An engineering model for adsorption of gases onto flat surfaces and clustering in supercritical fluids. Industrial and Eng. Chem. Res. 34 (11), 3830–3837. doi:10.1021/ie00038a021
Sun, J., Xiao, X., Wei, Q., Cheng, P., Tian, H., and Wu, Y. (2020). Gas in place and its controlling factors of the shallow Longmaxi shale in the northern Guizhou area. Guizhou, China: Journal of Natural Gas Science and Engineering 77, 103272.
Wu, X., He, Y., Ning, Z., Lyu, F., Dou, X., and Wu, B. (2022). Mechanistic insights into confined methane adsorption in carbon nanopores at the molecular level. Chem. Eng. Sci. 250, 117374. doi:10.1016/j.ces.2021.117374
Yan, B., and Yang, X. (2005). Adsorption prediction for three binary supercritical gas mixtures on activated carbon based on a NDFT/PSD approach. Chem. Eng. Sci. 60 (12), 3267–3277. doi:10.1016/j.ces.2005.01.035
Yang, F., Xie, C., Ning, Z., and Krooss, B. M. (2017). High-pressure methane sorption on dry and moisture-equilibrated shales. Energy and Fuels 31 (1), 482–492. doi:10.1021/acs.energyfuels.6b02999
Yang, R., Jia, A., He, S., Hu, Q., Dong, T., Hou, Y., et al. (2020a). Water adsorption characteristics of organic-rich Wufeng and Longmaxi shales, Sichuan Basin (China). J. Petroleum Sci. Eng. 193, 107387. doi:10.1016/j.petrol.2020.107387
Yang, S., Zhao, C., Ji, B., and He, Y. (2023). Adsorption isotherm calculation and mechanism of high pressure and high temperature shale gases. Fuel 331, 125854. doi:10.1016/j.fuel.2022.125854
Yang, X., Zhou, W., Liu, X., and Yan, Y. (2020b). A multiscale approach for simulation of shale gas transport in organic nanopores. Energy 210, 118547. doi:10.1016/j.energy.2020.118547
Yang, Z., Wang, W., Dong, M., Wang, J., Li, Y., Gong, H., et al. (2016). A model of dynamic adsorption–diffusion for modeling gas transport and storage in shale. Fuel 173, 115–128. doi:10.1016/j.fuel.2016.01.037
Zeng, Q. (2017). Experimental and modeling studies on coalbed methane recovery mechanism in deep coal seams. Beijing: China University of Petroleum.
Zhang, Z., and Yu, Q. (2022). The effect of water vapor on methane adsorption in the nanopores of shale. J. Nat. Gas Sci. Eng. 101, 104536. doi:10.1016/j.jngse.2022.104536
Keywords: shale gas, simplified local density model, gas content prediction model, temperature, moisture
Citation: Liu H, Zhang R and Cui R (2025) Gas content prediction model considering multi-factor coupling on shale by simplified local density model. Front. Earth Sci. 13:1519040. doi: 10.3389/feart.2025.1519040
Received: 29 October 2024; Accepted: 17 January 2025;
Published: 19 February 2025.
Edited by:
Xin Sun, Sinopec Matrix Co., Ltd., ChinaReviewed by:
Jiao Wang, NASA Jet Propulsion Laboratory (JPL), United StatesCopyright © 2025 Liu, Zhang and Cui. This is an open-access article distributed under the terms of the Creative Commons Attribution License (CC BY). The use, distribution or reproduction in other forums is permitted, provided the original author(s) and the copyright owner(s) are credited and that the original publication in this journal is cited, in accordance with accepted academic practice. No use, distribution or reproduction is permitted which does not comply with these terms.
*Correspondence: Ran Zhang, emhhbmdyOTI4NC5vc2p3QHNpbm9wZWMuY29t; Haomin Liu, bGl1aG05MTA1QDE2My5jb20=
Disclaimer: All claims expressed in this article are solely those of the authors and do not necessarily represent those of their affiliated organizations, or those of the publisher, the editors and the reviewers. Any product that may be evaluated in this article or claim that may be made by its manufacturer is not guaranteed or endorsed by the publisher.
Research integrity at Frontiers
Learn more about the work of our research integrity team to safeguard the quality of each article we publish.