 Yingwei Li
 Yanhui Zhu
95% of researchers rate our articles as excellent or good
Learn more about the work of our research integrity team to safeguard the quality of each article we publish.
Find out more
ORIGINAL RESEARCH article
Front. Earth Sci. , 03 April 2025
Sec. Solid Earth Geophysics
Volume 13 - 2025 | https://doi.org/10.3389/feart.2025.1512811
This article is part of the Research Topic Experimental and Numerical Simulations of Rock Physics View all 17 articles
The continental deep strata in the Panyu 4 Sag of the Pearl River Mouth Basin in the South China Sea are characterized by complex lithology and tight sandstone reservoirs with low porosity and low permeability. Predicting porosity and lithology in this area has long been a challenge in seismic reservoir prediction. Traditional methods, which rely on linear mapping based on well data or probabilistic mapping through multi-attribute fusion, struggle to capture the complex nonlinear relationships between reservoir parameters and seismic attributes. To address this issue, this paper proposes a method using a convolutional neural network for predicting porosity and facies distribution. Based on rock physics analysis and pre-stack elastic impedance inversion data, this approach first takes the effective porosity and shale content (VCL) from well-log interpretation as training targets. It then constructs training samples by simulating different lithologies and extracting the corresponding elastic parameters from well-log data. Through optimal evaluation, the model parameters of the deep learning network are determined, and a nonlinear mapping relationship between elastic parameters and reservoir parameters, such as porosity, is established. Finally, the trained deep learning model is applied to the elastic parameter bodies to obtain predictions of effective porosity and VCL, thereby achieving a quantitative characterization of high-quality deep sandstone reservoirs. The application of this method in the deltaic sediments of the Panyu 4 Sag in the Pearl River Mouth Basin shows that the deep learning-based predictions of facies distribution and porosity are consistent with well data and geological understanding. The fractured well, designed on the basis of the prediction results, achieved significant productivity enhancement following drilling, thereby demonstrating the efficacy of this method as a reservoir parameter prediction tool.
The Paleogene continental deep sandstone reservoirs in the Pearl River Mouth Basin are characterized by significant burial depth, poor physical properties, and pronounced reservoir heterogeneity. These tight sandstone reservoirs typically exhibit porosity ranging from 8% to 14%, permeability between 0.1 and 5 mD, and natural productivity often below the economic production threshold. In hydrocarbon exploration and development, sandstone distribution and porosity are routinely employed for reserve evaluation and stimulation strategy optimization (Ehsan et al., 2018; Yasin et al., 2019; Ali et al., 2021; Ashraf et al., 2021). Consequently, the prediction of reservoir parameters such as porosity and lithofacies distribution has become a research priority for geophysicists, petrophysicists, and petroleum engineers (Ehsan et al., 2018; Ashraf et al., 2019; Radwan, 2020; Vo Thanh et al., 2020; Ashraf et al., 2021; Kassem et al., 2021; Ullah et al., 2022; Anees et al., 2022).
Seismic inversion serves as a key technology for the identification of the reservoir’s porosity and lithofacies distribution (Saussus and Sams, 2012; Sa et al., 2015). The post-stack inversion, while operationally convenient through direct utilization of well-log data, frequently compromises the effective information contained in amplitude versus offset (AVO) responses (Downton, 2005; Gan et al., 2005). In contrast, pre-stack AVO inversion, grounded in the Zoeppritz equations, employs various algorithms to derive multiple elastic parameters that quantitatively characterize lithology and fluid properties in target formations (Sheuey, 1985; Connolly, 1999; Hampson et al., 2005). Rock physics analysis as an essential bridge connecting petrophysical parameters (e.g., lithofacies and porosity) with reservoir elastic properties (Li et al., 2007; Yan et al., 2002; Yin et al., 2015; Abdolahi et al., 2022). This methodology establishes linear functional relationships between porosity, clay content, and sensitive elastic parameters, thereby enabling the derivation of critical reservoir parameters. However, for continental deep formations characterized by substantial spatial variability and strong heterogeneity, it remains challenging to identify linearly correlated and effective elastic parameters. The application of Bayesian statistical principles to convert elastic parameters into maximum probability volumes of sandstone-shale distributions and corresponding porosity volumesnecessitates large sample sizes, resulting in limited accuracy for offshore exploration with sparse well control (Mavko et al., 1988; Mukerji et al., 2001; Hu et al., 2017). Alternatively, nonlinear approaches employing multi-attribute fusion or neural networks exhibit enhanced prediction accuracy but impose stringent requirements on seismic attributes (Wu et al., 2008; Zhang et al., 2014). Conventional network architectures (e.g., Back Propagation (BP) networks (Saffarzadeh and Shadizadeh 2012; Huang et al., 2016))suffer from structural simplicity, constrained computational units, and limited learning capacity, hindering their ability to precisely characterize the complex nonlinear mapping relationships between seismic attributes and porosity in tight sandstone reservoirs. Furthermore, operational instability and significant variability in inversion results restrict their large-scale implementation.
Recent advancements in machine learning have driven the widespread adoption of deep learning across domains including image processing, natural language processing, and industrial design. Geophysicists have begun integrating deep learning algorithms with enhanced hidden layers, advanced architectures, and superior computational efficiency to address complex geological challenges (Hu Ying et al., 2013). Among these, Convolutional Neural Networks (CNNs), as a rapidly evolving artificial neural network paradigm, demonstrate exceptional capabilities in modeling nonlinear mapping relationships of complex functions. Their inherent advantages in solving large-scale nonlinear inversion problems have fostered extensive applications in geophysics (Gao et al., 2020; Hinton et al., 2006; Liu et al., 2020; Li et al., 2023).
The study area is located in the Panyu 4 Sag of the Pearl River Mouth Basin in the South China Sea. Panyu 4 Sag has been explored for nearly 4 decades for hydrocarbon resources, but Paleogene Wenchang Formation exploration began only 5 years ago. To date, significant hydrocarbon discoveries have been made in the Paleogene Enping and Wenchang formations, highlighting the exploration potential of these strata. However, multiple drilled wells reveal that the Wenchang Formation reservoirs exhibit poor physical properties and strong heterogeneity, with the distribution of high-quality porouszones remaining unclear. Recent studies on the Paleogene strata in the Panyu 4 Sag have focused on geological aspects such as hydrocarbon migration, sedimentary facies classification, and tectonic evolution. Geophysical research has predominantly addressed seismic interpretation and post-stack inversion, with limited attention to porosity estimation and lithofacies identification.
This study attempts to investigate lithofacies distribution and porosity estimation in the Paleogene Wenchang Formation (FM.WC) of the Panyu 4 Sag. Based on rock physical analysis and pre-stack AVO inversion, we establish a nonlinear mapping relationship among porosity, VCL, and elastic parameters using the CNN deep learning model. This approach enables the conversion of elastic parameters into reservoir characterization parameters, thereby obtaining more accurate sandstone distribution and porosity characterization. Our methodology aims to facilitate reserve estimation and optimize stimulation strategies through the prediction of high-porous zones, which will be helpful for the future oil exploration in the Paleogene strata of the Panyu 4 Sag.
The Panyu 4 Subsag is located in the southern margin of the Xijiang Sag within the Zhu I Depression of the Pearl River Mouth Basin, South China Sea. Its structural framework manifests as a composite dustpan-shaped subsag characterized by northwestern overlap and southeastern faulting (Cai et al., 2022). It connects to the Xijiang Mid-Low Uplift and Xijiang 36 Subsag structural belt to the north, abuts the Xi’en Low Uplift to the west, and adjoins the Dongsha Uplift and Panyu Low Uplift to the east and south, respectively. Inheriting the basin’s tectonic evolution characterized by “lower faulting and upper depression, terrestrial followed by marine phases,” its stratigraphic development is dominated by Cenozoic sequences: the basement comprises Mesozoic granite overlain by Paleogene Wenchang, Enping, and Zhuhai formations, along with Neogene Zhujiang, Hanjiang, and Yuehai formations (Figure 1) (Ma et al., 2021).
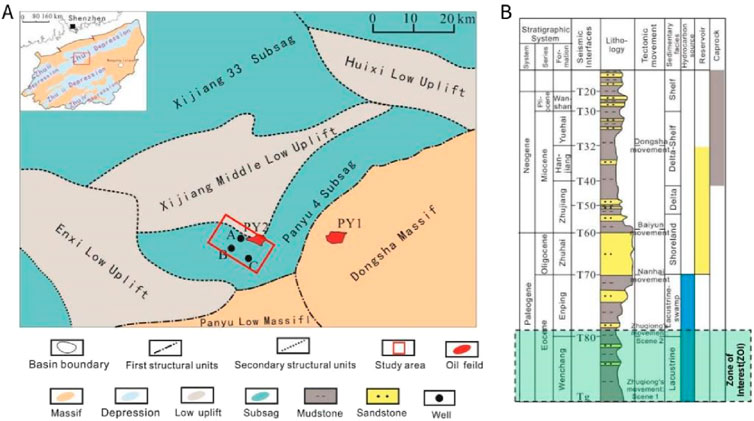
Figure 1. Location (A) and stratigraphic column (B) of Panyu 4 Sag in Pearl River Mouth Basin. The highlighted region shows the targeted reservoir formations and ZOI.
The Paleogene Wenchang Formation features lacustrine-fluvial depositional systems with high-organic-matter source rocks exhibiting robust hydrocarbon generation potential. Reservoir systems primarily occur in transitional marine-terrestrial to marine sandstones within the Zhuhai, Zhujiang, and Hanjiang formations (Zhang et al., 2021). Current exploration data indicate that although over 80% of proven hydrocarbon resources are concentrated in Neogene strata, research emphasis has shifted to the Paleogene Wenchang Formation as Neogene structural traps approach exploration maturity (Peng et al., 2022).
This study focuses on critical blocks along the northern margin of Panyu 4 Subsag adjacent to the Xijiang Mid-Low Uplift provenance area. The Zone of Interest (ZOI) contains hydrocarbon reservoirs within the Wenchang Formation. Sequence stratigraphic analysis reveals three third-order sequences developed during the FM. WC depositional period (Zhang et al., 2022). Wenchang IV Member (FM.WC4) is characterized by fan-delta facies, hosting thick, box-shaped sandstone reservoirs with poor physical properties due to significant burial depth. Wenchang III Member (FM.WC3) consists of shallow lacustrine mudstones, serving as a regional effective seal layer. Wenchang II Member (FM.WC2), dominated by braided river delta facies, contains multiple thin sandstone layers with relatively favorable reservoir quality, though notable lateral variations in lithology and sandbody thickness are observed (Li et al., 2024). The transitional depositional features between the braided delta front and shore-shallow lake facies in FM. WC2 create favorable conditions for lithologic trap development, while the vertical stacking of sandstone-mudstone sequences establishes effective reservoir-caprock configurations. This stratigraphic architecture provides critical geological prerequisites for hydrocarbon accumulation in the study area.
Deep learning is a type of multi-layer neural network that includes three or more hidden layers, capable of gradually extracting higher-level features from raw data. Compared to traditional BP neural networks, deep learning has a stronger ability to simulate complex nonlinear relationships with higher precision. There are various mainstream neural network algorithms in deep learning, with Convolutional Neural Networks (CNNs) being one of the most representative (Figure 2).
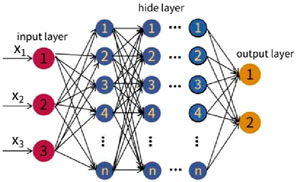
Figure 2. Deep learning network.
The working principle of CNNs is similar to that of BP neural networks, where features are extracted layer by layer during forward propagation, and in backward propagation, the gradient descent algorithm is used to minimize the loss function error, adjusting the training parameters to complete the weight update. CNNs essentially perform a nonlinear mapping from input to output and do not require precise mathematical expressions. With simple model training, CNNs can complete complex classification tasks and exhibit strong “feature learning” capabilities (Di et al., 2021).
A CNN network typically consists of input layers, convolutional layers, pooling layers, and fully connected layers. The input layer serves as the entry point for training data, and the input can be a one-dimensional, two-dimensional, or three-dimensional vector. The convolutional layer is the feature mapping layer, where each feature map consists of multiple neurons, and the input features are extracted using convolution filters. The mathematical expression for convolution is as follows Equation 1:
In the equation:
The convolutional layer is sequentially connected to a pooling layer, which performs local averaging and subsampling operations to achieve feature selection and information filtering, thereby reducing the dimensionality of feature maps. The mathematical formulation of the pooling layer is presented below Equation 2:
where P is the pooling function.
The fully connected layer typically consists of 1-3 layers and is responsible for converting the features output by the convolutional and pooling layers into a one-dimensional feature map, which is then mapped to the sample label space for classification.
The CNN-based reservoir parameter prediction model consists of four main components: data preparation, sample set construction, model training, and model application.
1. Data preparation: This consists of two parts. First, a suitable rock physics model is established based on logging data. Second, pre-stack elastic parameter inversion is performed, predicting P-wave impedance (PI), S-wave impedance (SI), and density as low-frequency models, followed by pre-stack AVO inversion to obtain the elastic parameter volumes.
2. Sample set construction: Constructing the sample set is key to establishing the deep learning model. The sample set must be complete, encompassing all data types. In offshore exploration, due to the sparse distribution of well locations, random sampling may result in missing rare lithology types. In this study, elastic parameters predicted by the rock physics model are selected as sample inputs, which not only clarify the relationship between reservoir parameters and elastic parameters but also reduce data randomness, enhancing the sample set’s rationality.
3. Model training: The elastic parameters predicted by the rock physics model are used as inputs, and VCL and porosity are chosen as training targets. By combining the conjugate gradient method with the steepest descent method, the deep learning network parameters are optimized, establishing a nonlinear mapping between elastic parameters and reservoir parameters.
4. Model application: The trained deep learning model is applied to the elastic parameter volumes obtained from pre-stack AVO inversion, predicting VCL and effective porosity to guide well placement and optimize design.
The study area encompasses 300 km2of full-fold 3D seismic coverage with the following acquisition parameters: streamer length of 6,000 m, bin dimensions of 12.5 m × 25 m, and 80-fold coverage. The water depth averages 100 m with minimal variations. Three wells (Well A, B, and C) are located within the ZOI. Wells A and C provide comprehensive logging suites including acoustic slowness (DT) (μs/m), density (DEN) (g/cm3), deep resistivity (LLD) (ohmm), shallow resistivity (LLS) (ohmm), compensated neutron porosity (CNL) (%), and gamma ray (GR) (API). Additionally, Well A contains S-wave slowness (DTS) measurements. Well B, a high-angle sidetrack of Well A, only offers limited logging data (GR and DEN) acquired during drilling operations.
In the initial phase, seismic stratigraphic and structural interpretation identified four key horizons: T80, T82, T83, and the basement Tg. Reservoir intervals are primarily developed in the FM. WC 2 (between T80-T82) and FM. WC 4 (between T83-Tg).
S-wave velocity prediction is the foundation for pre-stack AVO inversion and petrophysical analysis. Establishing an appropriate petrophysical model enables the characterization of relationships among reservoir lithology, physical property parameters, and elastic parameters, thereby predicting acoustic and shear wave velocities (Han, 1986; Haas and Dubrule, 1994; Hinton et al., 2006). In the study area, only Well A within the WC. FM contains measured shear wave velocity data, which serves as critical validation for the model. The Wenchang Formation primarily comprises mudstone, siltstone, sandstone, and minor carbonaceous mudstone. By applying the Xu-White sand-mudstone petrophysical model theory, input parameters including mineral volume fractions, porosity, and fluid saturation were utilized to predict both acoustic and shear wave velocities. This approach successfully established the petrophysical framework for the study area (Mavko et al., 1988; Xu and White, 1995; Xu and White, 1996; Keys and Xu, 2002; Li et al., 2007).
As shown in Figure 3, the cross-plot results of the three parameters PI, density, and Vp/Vs) between the model data and the measured data (logging points) show good consistency, indicating the reliability of the model. Mudstone has lower PI and higher Vp/Vs, while sandstone and siltstone exhibit higher PI and lower Vp/Vs.
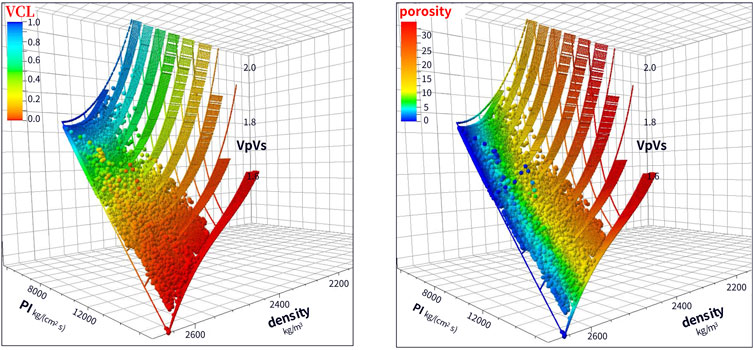
Figure 3. Cross plots of PI, Vp/Vs, and Density.
Based on prediction data from the rock physical model, polynomial regression analysis was employed to establish functional relationships between porosity and PI for sandstone (clay content <35%) and mudstone (clay content ≥35%), respectively (Figure 4). The analysis reveals a negative correlation between PI and porosity in sandstone, where high-porosity sandstone exhibits relatively low PI. With accurate lithological differentiation between sandstone and mudstone, the sandstone fitting relationship demonstrates a correlation coefficient of 0.73 and a relative error of 0.18.
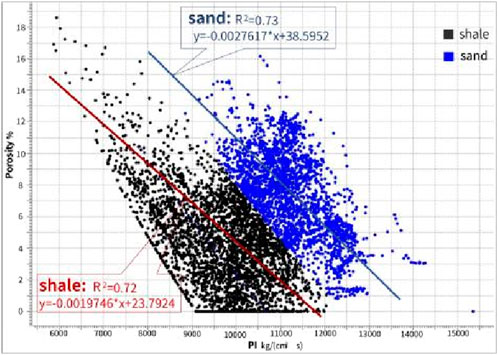
Figure 4. A cross plot between the PI and porosity shows a negative slope trend line.
Based on the lithology encountered by drilled wells, logging data were divided into three rock types: sandstone, mudstone, and carbonaceous mudstone. Sample points were extracted, with 200 points each for sandstone and mudstone and 30 points for carbonaceous mudstone, forming a sample set. Effective porosity and VCL curves, obtained through detailed logging interpretation, were used as target samples for learning. The selection of input variables needs to have strong correlations with reservoir parameters. Based on comprehensive rock physics analysis and pre-stack inversion results, PI and Vp/Vs were selected as input variables for the training samples.
After extensive testing, the optimal hidden layer and node numbers were determined, and a nonlinear mapping relationship between elastic parameters and reservoir parameters was established. The test results show that when here are four hidden layers and 12 nodes, the correlation coefficient is the highest, and the root mean square error is the smallest, indicating the best prediction performance. The trained deep learning model was applied to the well section data. In Figure 5, the predicted VCL and porosity showed very small errors compared to the actual logging interpretation.
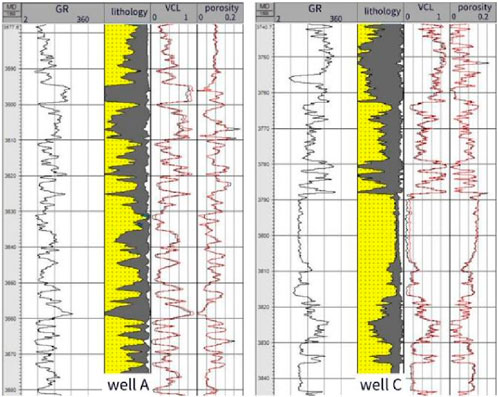
Figure 5. Comparison between predicted curves and logging interpreted curves. Red curves are predicted data, and black curves are logging interpretations.
Figure 6 presents a comparative analysis of well-log porosity predictions derived from the fitting formula method and the CNN deep learning model. The results demonstrate that over 90% of the porosity values predicted by the CNN model fall within a ±10% error margin. In contrast, the fitting formula method exhibits significantly larger prediction errors, exceeding those of the deep learning model by more than threefold.
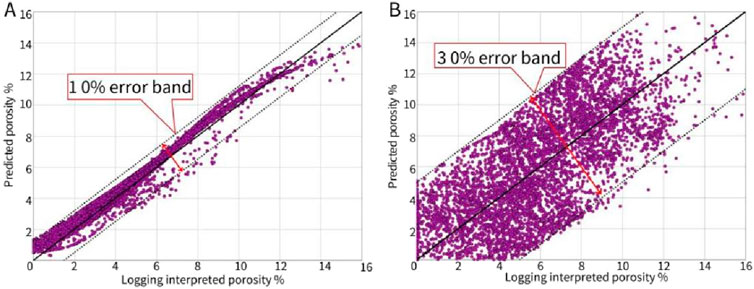
Figure 6. (A) A cross plot of logging interpreted porosity and deep learning model predicted porosity. (B) A cross plot of logging interpreted porosity and deep learning model predicted porosity.
Seismic data, as the core input for pre-stack inversion, critically determines inversion accuracy through its quality and fidelity (Nickel and Sonneland, 1999; Zhang et al., 2013). In the study area, the primary target zone exhibits two-way travel times between 2.3–3 s with deep burial depth. The original seismic data shows notable interbed noise, severe energy attenuation, and low resolution. To enhance signal-to-noise ratio, broaden effective frequency bandwidth, and establish high-quality data foundations for pre-stack inversion and reservoir prediction, we implemented advanced reprocessing techniques including Adaptive Deghosting technology and Fault-Controlled velocity modeling (Shi et al., 2024). An integrated interactive workflow was established to iteratively optimize seismic processing and inversion parameter (Liu et al., 2019).
To achieve optimal inversion results, this study conducted over 30 iterations of integrated seismic processing-inversion tests, with particular focus on the Wenchang Formation sandstone reservoirs. Through detailed analysis of angle-dependent amplitude responses, the optimal angle ranges for pre-stack inversion were determined as 3°–13°, 13°–23°, and 23°–33° based on comprehensive angle gather testing (Liu et al., 2020).
Wavelet extraction was performed using the optimized seismic data. By integrating three angle-stacks and conducting refined well-to-seismic calibration, wavelets were extracted from the T80-Tg interval. The synthetic seismograms exhibited strong correlation (≥80%) with actual seismic data across all angle stacks (Figures 7A–C). A composite wavelet derived from three key wells was ultimately selected as the final wavelet (Figure 7D).
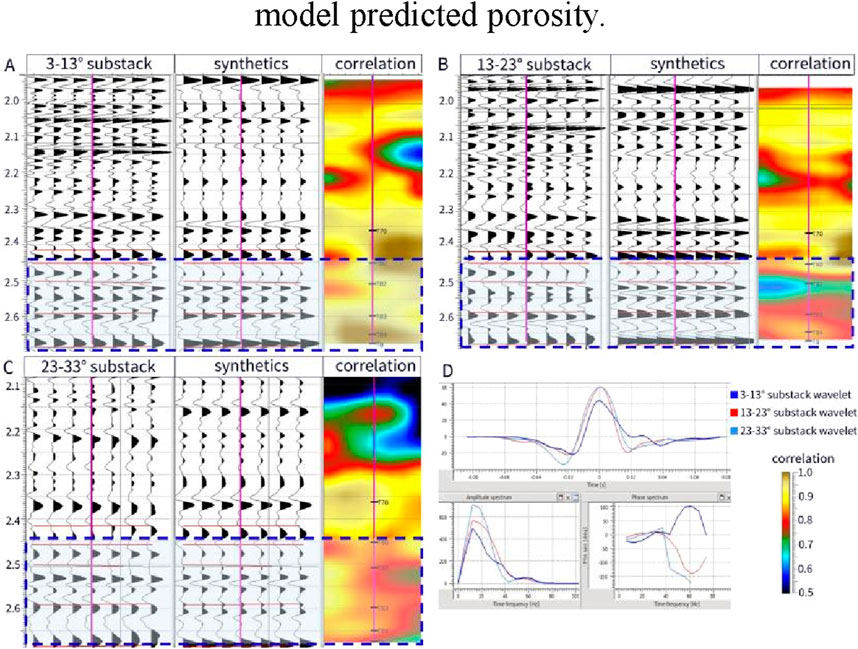
Figure 7. The well editing windows for the near-angle (A), mid-angle (B), and far-angle (C) substacks display the synthetic seismogram derived from Well (C). The first panel shows seismic data from well traces. The second panel show synthetics, and third shows the correlation between the seismic and synthetics. The highlighted region delineates the ZOI. (D) An average wavelet along with amplitude and phase spectrums were made by utilizing the wavelets of all the studied wells.
For the target interval (2,300–3,000 ms), spectral analysis revealed low energy below 4 Hz and weak signal between 4–6 Hz. A low-frequency prior model was constructed using well data (0–6 Hz) and seismic velocity trends as constraints. The AVO inversion employed simulated annealing global optimization to maximize resolution, yielding high-quality inversion volumes for PI, Vp/Vs, and density.
The elastic parameters obtained from the inversion were compared with the measured values (filtered at 60 Hz) for two wells, and the results showed a high degree of agreement (Figure 8A). Figure 8B shows the profiles of PI and Vp/Vs obtained from the inversion. In Well B, the thick sandstone reservoir at the top of the FM. WC4, with relatively good physical properties, shows a clear response of high PI and low Vp/Vs on the inversion profile, while Well C encountered a clayey sandstone layer with high clay content, and the dry layer shows low PI and high Vp/Vs. This indicates that the elastic parameters derived from pre-stack AVO inversion are feasible as input for predicting effective porosity and clay content in the study area.
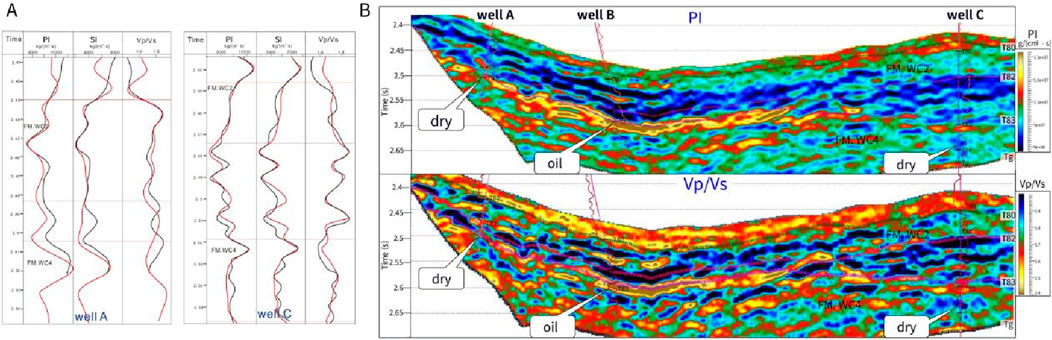
Figure 8. (A) 1D QC plot of AVO inversion result. Red curves are inverted data extracted along well, and black curves are measured logs with 60 Hz low pass filter (B) Inverted PI and Vp/Vs section with GR at well location with 60 Hz low pass filter.
The trained deep learning model was applied to the elastic parameter volume in the study area. Figure 9 shows a cross-sectional view of the prediction results, where the well curves represent the 60 Hz low-pass filtered density-modulated display of corresponding logging interpretation curves. In Figure 9, the predicted clay content and porosity generally align with the logging interpretation results, with minor errors. In the FM. WC 2, Wells A and B are located in the same sedimentary delta lobe, and the predicted sandstone bodies are clearly delineated, with porosity ranging from 10% to 14%. Well C is located at the delta front, where VCL is higher, and porosity is lower. At the top of the FM. WC4, Well A encountered a dense dry sandstone layer, while Well B encountered a thick sandstone layer with good physical properties. The prediction results match the drilling findings.
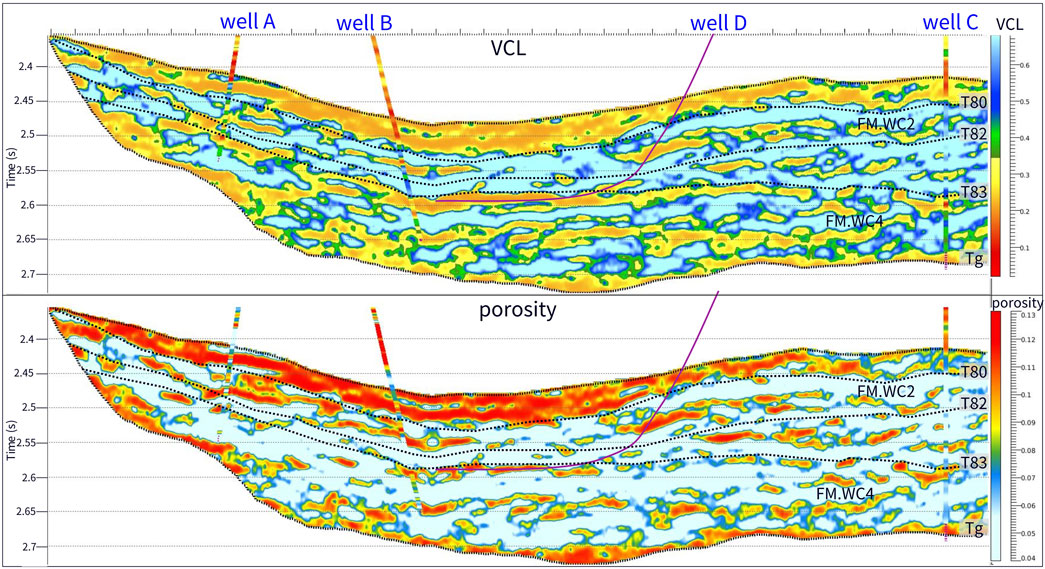
Figure 9. Predicted shale content section with VCL log at well location and porosity section with porosity log at well location.
Based on the clay content volume, we delineated the sandstone bodies within the T80-T82 interval of the FM. WC2, generating a sandstone time-thickness map. Subsequently, the sandstone depth-thickness distribution was calculated using average velocity conversion. As shown in Figure 10, the predicted sandstone thickness map (Figures 10A, B) exhibits strong consistency with regional sedimentary facies interpretations (Figure 10C), demonstrating the geological rationality of our sandstone predictions. Current drilling operations have primarily targeted the margins of braided river delta lobes, where encountered sand layers are relatively thin. Notably, the central zone within the polygon demonstrates thickened sandstone accumulations, representing high-priority exploration targets for future well placement.

Figure 10. Sand thinkness (A), porosity map of characterized sand bodies (B) and sedimentary facies (C) of FM. WC2.
In the upper FM. WC4, thick sandstone packages were encountered with poor reservoir quality. Integrating predicted sandstone thickness and porosity distributions (Figure 11), we recalculated reserves and conducted economic viability assessments. This analysis guided the deployment of a horizontal fracturing well (Well D) within a stable, high-porosity thick sand zone, achieving significant production enhancement through post-drilling stimulation.
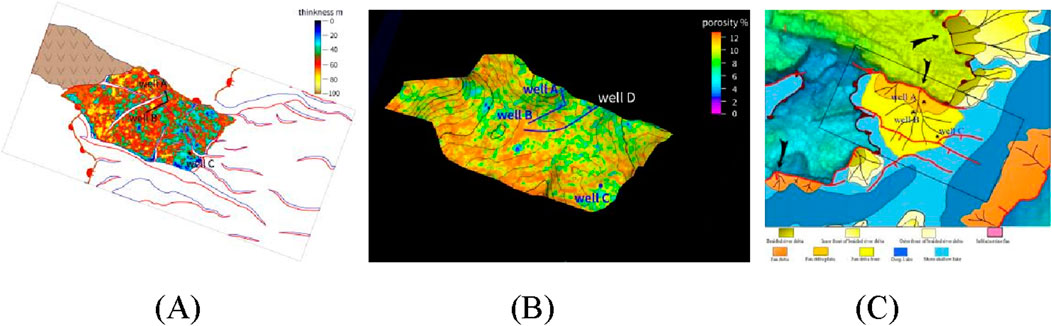
Figure 11. Sand thinkness (A), porosity map of characterized sand bodies (B) and sedimentary facies (C) of the upper FM. WC4.
The study has achieved favorable application results, and we will promote the application of this methodology throughout the Wenchang Formation in the Panyu 4 Subsag. For futuret research, we will further integrate geological research findings with methods such as seismic forward modeling and sedimentary facies-controlled inversion to enhance the accuracy of predictive results.
The CNN deep learning method for reservoir parameter prediction demonstrates significant advantages in predicting complex lithologies and porosity. The specific benefits are as follows:
1. The CNN deep learning method uses a deep network structure with multiple hidden layers, allowing it to extract effective information from logging data and establish nonlinear relationships with lithology and porosity. When applied to pre-stack AVO inversion results, it achieves higher prediction accuracy compared to traditional linear and probabilistic mapping methods.
2. Deep learning has strong nonlinear representation capabilities, and CNN excel at handling classification problems. As a result, they perform well in identifying different lithologies and predicting porosity. The practical application results show that the prediction errors are small, and the accuracy is high.
However, the method also has some limitations, primarily relying on the quality of pre-stack AVO inversion results. Nevertheless, the method has been successfully applied to the low-porosity, low-permeability sand-mudstone reservoirs of the Paleogene in the Panyu 4 Sag of the Pearl River Mouth Basin. The fractured well designed based on the prediction results, achieved significant productivity improvement after drilling and has been put into production, proving that this method is suitable for lithology identification and porosity prediction in low-porosity, low-permeability sandstone reservoirs.
The datasets presented in this article are not readily available because just for reading. Requests to access the datasets should be directed to YL, bGl5dzE3QGNub29jLmNvbS5jbg==.
YL: Data curation, Investigation, Methodology, Writing–original draft, Writing–review and editing. YZ: Formal Analysis, Methodology, Writing–review and editing. ZL: Project administration, Writing–review and editing. XZ: Data curation, Formal Analysis, Software, Writing–review and editing. GC: Conceptualization, Data curation, Formal Analysis, Writing–review and editing.
The author(s) declare that financial support was received for the research and/or publication of this article. This research was supported by CNOOC Major Exploration and Production Research Project: 3D Seismic Data Reprocessing for the Enping 17 Sag South (Grant Nos. SCKY-2025-SZ-YJYKT-13) and 3D Seismic Data Reprocessing for the Buried Hill in Panyu 4 Sag (Grant Nos. SCKY-2025-SZ-YJYKT-14).
YL and YZ are grateful to the project manager ZL for providing essential support to this research, including data, equipment, funding, and other resources. We also extend our gratitude to Shenzhen Branch of CNOOC Ltd. for their financial sponsorship of this project.
Authors YL, YZ, ZL, XZ, and GC were employed by Shenzhen Branch of CNOOC Ltd.
The authors declare that this study received funding from CNOOC. The funder had the following involvement in the study: study design.
The author(s) declare that no Generative AI was used in the creation of this manuscript.
All claims expressed in this article are solely those of the authors and do not necessarily represent those of their affiliated organizations, or those of the publisher, the editors and the reviewers. Any product that may be evaluated in this article, or claim that may be made by its manufacturer, is not guaranteed or endorsed by the publisher.
Abdolahi, A., Chehrazi, A., Kadkhodaie, A., and Babasafari, A. A. (2022). Seismic inversion as a reliable technique for anticipating of porosity and facies delineation, a case study on Asmari Formation in Hendijan field, southwest part of Iran. J. Pet. Explor. Prod. Technol., 1–14. doi:10.1007/s13202-022-01497-y
Ali, M., Jiang, R., Ma, H., Pan, H., Abbas, K., Ashraf, U., et al. (2021). Machine learning-A novel approach of well logs similarity based on synchronization measures to predict shear sonic logs. J. Pet. Sci. Eng. 203, 108602. doi:10.1016/j.petrol.2021.108602
Anees, A., Zhang, H., Ashraf, U., Wang, R., Liu, K., Abbas, A., et al. (2022). Sedimentary facies controls for reservoir quality prediction of lower Shihezi member-1 of the Hangjinqi area, Ordos Basin. Minerals 12, 126. doi:10.3390/min12020126
Ashraf, U., Zhang, H., Anees, A., Mangi, H. N., Ali, M., Zhang, X., et al. (2021). A core logging, machine learning and geostatistical modeling interactive approach for subsurface imaging of lenticular geobodies in a clastic depositional system, SE Pakistan. Nat. Resour. Res. 30 (3), 2807–2830. doi:10.1007/s11053-021-09849-x
Ashraf, U., Zhu, P., Yasin, Q., Anees, A., Imraz, M., Mangi, H. N., et al. (2019). Classification of reservoir facies using well log and 3D seismic attributes for prospect evaluation and field development: a case study of sawan gas field, Pakistan. J. Pet. Sci. Eng. 175, 338–351. doi:10.1016/j.petrol.2018.12.060
Cai, G., Peng, G., Wu, J., Bai, H., Li, Y., Xu, X., et al. (2022). Sedimentary filling response to detachment structural deformation in Shallow⁃Water continental shelf of Pearl River Mouth basin: a case study of enping sag. Chin. J. Earth Sci. 47 (7), 2391–2409. doi:10.3799/dqkx.2022.215
Downton, J. (2005). “Seismic parameter estimation from AVO inversion,” in Department of geology and geophysics. Calgary,Canada: University of Calgary.
Ehsan, M., Gu, H., Akhtar, M. M., Abbasi, S. S., and Ullah, Z. (2018). Identification of hydrocarbon potential of Talhar shale: member of lower Goru Formation using well logs derived parameters, southern lower Indus basin, Pakistan. J. Earth Sci. 29, 587–593. doi:10.1007/s12583-016-0910-2
Ehsan, M., Gu, H., Akhtar, M. M., Abbasi, S. S., and Ullah, Z. (2018). Identification of hydrocarbon potential of Talhar shale: member of lower Goru Formation using well logs derived parameters, southern lower Indus basin, Pakistan. J. Earth Sci. 29 (3), 587–593. doi:10.1007/s12583-016-0910-2
Gan, L., Zhao, B., Du, W., and Li, L. (2005). The potential analysis of elastic impedance in the lithology and fluid prediction. Geo-physical Prospect. Petroleum. 44 (5), 504⁃508.
Gao, J., Song, Z., Gui, J., and Yuan, S. (2020). Gas-bearing prediction using transfer learning and CNNs: an application to a deep tight dolomite reservoir. IEEE Geoscience Remote Sens. Lett. 19 (99), 1–5. doi:10.1109/LGRS.2020.3035568
Hampson, D. P., Russell, B. H., and Bankhead, B. (2005). “Simul-taneous inversion of pre-stack seismic data,” in SEG annual meeting. Houston, 1635⁃1638.
Han, D. H., Nur, A., and Morgan, D. (1986). Effects of porosity and clay content on wave velocities in sandstones. Geophysics 51 (11), 2093–2107. doi:10.1190/1.1442062
Hinton, G. E., Osindero, S., and Then, Y. (2006). A faset learning algorithm for deep belief nets. Neural Omputation 18 (7), 1527–1554. doi:10.1162/neco.2006.18.7.1527
Hu, Y., Chen, H., He, Z., Huang, D., and Wen, X. (2017). Seismic facies classification based on seismic texture attributes and fuzzy clustering. Oil Geothysical Prospeting 48 (1), 114–120. doi:10.13810/j.cnki.issn.1000-7210.2013.01.018
Huang, F., Xia, Z., Gui, H., Zhang, M., Gui, Z., and Wang, Y. (2016). The application of BP neural network to DMT Hill metamorphic fracture prediction. Chin. J. Eng. Geophys. 13 (4), 483–490. doi:10.3969/j.issn.1672-7940.2016.04014
Kassem, A. A., Hussein, W. S., Radwan, A. E., Anani, N., Abioui, M., Jain, S., et al. (2021). Petrographic and diagenetic study of siliciclastic Jurassic sediments from the Northeastern Margin of Africa: implication for reservoir quality. J. Pet. Sci. Eng. 200, 108340. doi:10.1016/j.petrol.2020.108340
Keys, R. G., and Xu, S. (2002). An approximation for the Xu-White velocity model. Geophysics 67 (5), 1406–1414. doi:10.1190/1.1512786
Li, K., Wang, T., Zhao, H., Tang, X., Tian, D., Zheng, X., et al. (2023). Porosity prediction of tight sandstone reservoir based on deep feedforward neural network. Petroleum Geol. Oilfield Dev. Daqing. 202212004. doi:10.19597/J.ISSN.1000-3754
Li, W., Shi, G., Wang, H., and Yao, Z. (2007). The study on the relation-ships of elastic properties of rock physics. Prog. Geophys. 22 (5), 1380⁃1385. doi:10.3969/j.issn.1004-2903.2007.05.007
Li, Z., Peng, G., Chen, W., Cai, G., Zhang, L., and Huang, R. (2024). Coupling relationship between structure and sedimentary of the Paleogene Wenchang Formation in Panyu 4 sag, Pearl River Mouth basin. Chin. J. Mar. Geol. Front. 40 (2), 50–58. doi:10.16028/j.1009-2722.2023.032
Lin, N., Zang, D., Zhang, K., Wang, S., Fu, C., and Zhang, J. (2018). Prediction distribution of hydrocarbon reservoirs with seismic data based on learning of the small-sample convolution neural network. Chin. J. Geophys. 61 (10), 4110–4125. doi:10.038/cjg2018j0775
Liu, L., Liang, D., Peng, G., Ruan, X., Li, Y., Xu, J., et al. (2020). Seismic integrated study for offshore deep- and thin-stratum characterization: a case study from the Enping sag within the Pearl River Mouth Basin. Lead. Edge 39 (3), 176–181. doi:10.1190/tle39030176.1
Liu, L., Lu, R., and Yang, W. (2019). Seismic lithofacies inversion based on deep learning. Geophys. Prospect. Petrolum. 58 (1), 123–129. doi:10.3969/j.issn.1000-1441.2019.01.014
Ma, X., Liu, J., Zhu, D., Li, S., Li, Y., Suo, Y., et al. (2021). Sedimentary response of multi-stage pull-apart basin: insights from the Pearl River Mouth Basin in the northern south China Sea margin. Chin. J. Geotect. Metallogenia 45 (1), 64–78. doi:10.16539/j.ddgzyckx.2021.01.006
Mavko, G., Mukerji, T., and Dvorikin, J. (1988). The rock physics handbook: tools for seismic analysis in porous media. United Kingdom: Cambridge University Press.
Mukerji, T., Jorstad, A., and Avseth, P. (2001). Mapping lithofacies and pore-fluid probabilities in the North Sea reservoir: seismic inversions and statistical rock physics. Geophysics 66 (4), 998–1001. doi:10.1190/1.1487078
Nickel, m., and Sonneland, L. (1999). “Non-rigid matching of migrated timelapse seismic,” in 69th SEG annual international meeting. SEG, Expanded Abstracts, 872–875. doi:10.1190/1.1821191
Peng, G., Pang, X., Xu, Z., Luo, R., Yu, S., Li, H., et al. (2022). Characteristics of Paleogene whole petroleum system and orderly distribution of oil and gas reservoirs in south lufeng depression, Pearl River Mouth basin. Chin. J. Earth Sci. 47 (7), 2494–2508. doi:10.3799/dqkx.2022.253
Radwan, A. E. (2020). Hydrocarbon type estimation using the synthetic logs: a case study in baba member. Gulf of Suez, Egypt: AAPG/datapages search and discovery.
Sa, L., Yang, W., Yao, F., Yin, X., and Yong, X. (2015). Past present and future of geophysical inversion. Oil Geophys. Prospccting 50 (1), 184⁃202. doi:10.13810/j.cnki.issn.1000-7210.2015.01.028
Saffarzadeh, S., and Shadizadeh, S. R. (2012). Reservoir rock permeability prediction using support vector regression in an Iranian oil field. J. Geophys. Eng. 9 (3), 336–344. doi:10.1088/1742-2132/9/3/336
Saussus, D., and Sams, M. (2012). Facies as the key to using seismic inversion for modelling reservoir properties. First Break 30, 45–52. doi:10.3997/1365-2397.2012009
Shi, Y., Chen, R., Xu, Y., Yang, J., Li, Y., and Huang, N., (2024). Key technologies for improving the imaging of Paleogene interior structure: a case study on the gentle slope zone in Panyu 4 sag, the Pearl River Mouth Basin. 63 (2):357–369.
Shuey, R. T. (1985). A simplification of the zoeppritz equations. Geophysics 50 (4), 609–614. doi:10.1190/1.1441936
Spikes, K., Mukerji, T., Dvorkin, J., and Mavko, G. (2007). Probabilistic seismic inversion based on rock-physics models. Geophysics 72 (5), 87–97. doi:10.1190/1.2760162
Ullah, J., Luo, M., Ashraf, U., Pan, H., Anees, A., Li, D., et al. (2022). Evaluation of the geothermal parameters to decipher the thermal structure of the upper crust of the Longmenshan fault zone derived from borehole data. Geothermics 98, 102268. doi:10.1016/j.geothermics.2021.102268
Vo Thanh, H., Sugai, Y., and Sasaki, K. (2020). Impact of a new geological modelling method on the enhancement of the CO2 storage assessment of E sequence of Nam Vang field, offshore Vietnam. Util. Environ. Eff. 42, 1499–1512. doi:10.1080/15567036.2019.1604865
Wang, H., Qu, Y., and Zhang, Q. (2017). Tight sandstone reservoir prediction of the deep shahe-zi Formation in songliao basin. Pet. Geophys. Prospect. 52 (2), 129–134. doi:10.13810/.cnki.issn.1000-7210.2017.s2.022
Wang, J., Wen, X., He, Y., Lan, Y., and Zhang, C. (2022). Logging curve prediction based on a CNN-GRU neural network. Geophys. Prospect. Peltroleum. 61 (2), 276–285. doi:10.3969/j.cnki.issn.1000-1441.2022.02.009
Wu, M., Fu, L., and Li, W. (2008). Inversion method and application of high-resolution nonlinear reservoir physical parameters. Chin. J. Geophys. 51 (2), 546–557.
Xu, S., and White, R. E. (1995). A new velocity model for clay-sand mixtures. Geophys. Prospect. 43 (1), 91–118. doi:10.1111/j.1365-2478.1995.tb00126.x
Xu, S., and White, R. E. (1996). A physical model for shear-wave velocity prediction. Geophys. Prospect. 44 (4), 687–717. doi:10.1111/j.1365-2478.1996.tb00170.x
Yan, J., Li, X., and Liu, E. (2002). Effects of pore aspect ratios on velocity prediction from well-log data. Geophys. Prospect. 50 (3), 289–300. doi:10.1046/j.1365-2478.2002.00313.x
Yasin, Q., Du, Q., Ismail, A., and Shaikh, A. (2019). A new integrated workflow for improving permeability estimation in a highly heterogeneous reservoir of Sawan Gas Field from well logs data. Geomech. Geophys. Geo. Energy. Ge. Resour. 5 (2), 121–142. doi:10.1007/s40948-018-0101-y
Yin, X., Zong, Z., and Wu, G. (2015). Research on seismic fluid identification driven by rock physics. Sci. China(Earth Sci.) 45 (1), 8⁃21. doi:10.1007/s11430-014-4992-3
Zhang, F., Liu, H., and Niu, X. (2014). High-resolution seismic inversion of convolutional neural network. Pet. Geophys. Prospect. 49 (6), 1165–1169. doi:10.13810/j.cnki.issn.1000-7210.2014.06.019
Zhang, L., Wu, J., Cai, G., Li, Z., and Chen, S. (2022). Resrvoir characteristics and main controlling factors of wencghang formation in PY4 depresddion, Pearl River mouth basin. Mineralogy Petrology 42 (4), 116–127. doi:10.19719/j.cnki.1001-6872.2022.04.11
Zhang, W., Liu, J., Liu, L., Zhang, X., Bai, H., and Yang, D. (2022). Lithology prediction technology and its application of Paleogene Wenchang Formation in Panyu 4 depression, Pearl River Mouth basin. Lithol. Reserv. 34 (6), 118–125. doi:10.12108/yxyqc.20220610
Zhang, X., Liu, P., Wang, W., Du, J., and Chen, W. (2021). Controlling effect of tectonic transformation in Paleogene Wenchang Formation on oil and gas accumulation in Zhu Ⅰ depression. Chin. J. Earth Sci. 46 (5), 1797–1813. doi:10.3799/dqkx.2020.106
Keywords: deep learn, reservoir evaluation, rock physics, porosity prediction, shale content prediction
Citation: Li Y, Zhu Y, Li Z, Zhang X and Cai G (2025) Reservoir parameter prediction technology based on deep learning and its application in the Panyu 4 Sag, Pearl river mouth Bain. Front. Earth Sci. 13:1512811. doi: 10.3389/feart.2025.1512811
Received: 17 October 2024; Accepted: 07 March 2025;
Published: 03 April 2025.
Edited by:
Yihuai Zhang, University of Glasgow, United KingdomReviewed by:
Umar Ashraf, Yunnan University, ChinaCopyright © 2025 Li, Zhu, Li, Zhang and Cai. This is an open-access article distributed under the terms of the Creative Commons Attribution License (CC BY). The use, distribution or reproduction in other forums is permitted, provided the original author(s) and the copyright owner(s) are credited and that the original publication in this journal is cited, in accordance with accepted academic practice. No use, distribution or reproduction is permitted which does not comply with these terms.
*Correspondence: Yingwei Li, bGl5dzE3QENOT09DLmNvbS5jbg==
Disclaimer: All claims expressed in this article are solely those of the authors and do not necessarily represent those of their affiliated organizations, or those of the publisher, the editors and the reviewers. Any product that may be evaluated in this article or claim that may be made by its manufacturer is not guaranteed or endorsed by the publisher.
Research integrity at Frontiers
Learn more about the work of our research integrity team to safeguard the quality of each article we publish.