 Jian Zhang
 Shidong Zhang1,3
94% of researchers rate our articles as excellent or good
Learn more about the work of our research integrity team to safeguard the quality of each article we publish.
Find out more
ORIGINAL RESEARCH article
Front. Earth Sci., 13 March 2025
Sec. Geoscience and Society
Volume 13 - 2025 | https://doi.org/10.3389/feart.2025.1512780
This article is part of the Research TopicGross Ecosystem Product: Valuation of Nature’s Contribution to Human Well-BeingView all 6 articles
Natural ecosystems and water infrastructure (such as reservoirs) jointly exert an influence water flow by means of retaining, regulating, storing, and releasing water, thereby enhancing the availability of water resources to satisfy human demands. Previous research has predominantly concentrated on the role of natural ecosystems in water provision services; however, studies that integrate the contributions of both natural ecosystems and infrastructure to quantify their respective impacts on water provisioning services remain scarce. Here we utilize the SWAT hydrological model to simulate the spatiotemporal dynamics of water provisioning services in the Qinling-Danjiang watershed—an area prone to seasonal water shortages. The study delineates the supply and beneficiary areas, quantifying the relative contributions of natural ecosystems and infrastructure to watershed water provisioning services and their ecosystem service values were respectively evaluated by delineating the supply and beneficiary areas of water provisioning services and using scenario analyses. The annual water provision in the Danjiang watershed was 2.394 × 10³ million m3, with significant variation across watershed and months. The total water demand from stakeholders was 1.122 × 10³ million m3, with agricultural irrigation being the largest consumer, and 52.81% of the area experiencing a supply deficit. Under the baseline scenario, the value of water provisioning services was 14.602 billion CNY. In a scenario without reservoir infrastructure, water provision of natural ecosystems increased by approximately 27% to 3.039 × 10³ million m3 (about 18.538 billion CNY), but exacerbated seasonal imbalances. Conversely, in a scenario without natural ecosystems, the water provision of reservoir infrastructure dropped by over 90% to 193 million m3 (about 1.179 billion CNY), which was insufficient to meet regional demands. This study provides a novel perspective for understanding the interactions between natural ecosystems and infrastructure in water provisioning services and offers a new approach to distinguish their relative contribution in water provisioning services, which is of great significance for accounting nature’s contribution to people.
Water resources, as a core element of ecosystem services, not only support ecosystem functions and biodiversity but also form the foundation for sustainable human development (Daily, 2013; Wang et al., 2019). In recent years, significant progress has been made in global research on water-related ecosystem services particularly with a growing focus on the dynamic balance between water supply and demand and the complex mechanisms underlying this balance (Cong et al., 2020; Maskey et al., 2022; Wang et al., 2023). Water provision services are primarily driven by natural ecosystems through hydrological processes, such as precipitation, groundwater recharge, and surface runoff, which directly influence the quantity and quality of water resources within watersheds and downstream regions (Brauman et al., 2007; Booth et al., 2016).
However, with the increasing pressures from population growth and intensified economic activities, the demand for water across various sectors—agricultural irrigation, industrial production, urban and rural residential use, and ecological requirements—continues to rise, leading to an increasingly strained water supply-demand relationship (Li et al., 2022). It is essential to study water resource ecosystem services from the perspective of beneficiaries, as quantifying beneficiary groups and their range can enhance our understanding and assessment of the social, economic, and environmental impacts of water resource management decisions. This approach also aids in optimizing water allocation and mitigating social conflicts arising from unequal resource distribution (Hou et al., 2020). Therefore, in-depth research on the water supply-demand relationship from the beneficiaries' perspective is crucial for the formulation of scientifically sound water resource management policies.
At the watershed scale, the synergistic effects of natural ecosystems and infrastructure on water provisioning have garnered significant attention (Chenoweth et al., 2018; Dai et al., 2021). Natural ecosystems, such as forests, wetlands, and rivers, make irreplaceable contributions to watershed water provision through functions like water retention, runoff regulation, and water quality purification (Zhang et al., 2024). In contrast, infrastructure, including reservoirs, diversion channels, and irrigation systems, significantly enhances the efficiency and reliability of water resource utilization within the watershed by facilitating the storage, management, and distribution of water, thereby shaping the water provisioning landscape (Tiwary and Kumar, 2014; Zahoor et al., 2023).
However, most current studies tend to assess the contributions of natural or artificial systems in isolation, overlooking the complex interactions between the two and their combined impact on water provision services. Some studies emphasize the role of infrastructure in ensuring stable water provisioning while underestimating the long-term sustainability contributions of natural ecosystems (Boithias et al., 2014; Bellezoni et al., 2021). Distinguishing the impacts of both on water ecosystem services can aid policymakers in developing more balanced and sustainable water resource management strategies, avoiding over-reliance on any one component (Zheng et al., 2023). Additionally, it can increase public awareness of the importance of natural ecosystems, promoting investment in ecological protection and restoration, which is crucial for achieving sustainable water resource management (Veerkamp et al., 2021; Xu et al., 2024). Therefore, emphasizing the distinction between natural ecosystems and infrastructure is not only about optimizing resource allocation but also about ensuring long-term sustainable water resource management.
However, most studies on water ecosystem services typically evaluate the contributions of natural ecosystems and infrastructure independently, often neglecting the complex interactions between the two and their combined impact on water provisioning. While infrastructure is frequently emphasized for its role in ensuring stable water supply, the long-term sustainability provided by natural ecosystems is often undervalued (Boithias et al., 2014; Bellezoni et al., 2021). To address this gap, it is crucial to distinguish between the contributions of both systems, not only to optimize resource allocation but also to guide the development of more balanced and sustainable water resource management strategies. By recognizing the complementary roles of natural ecosystems and infrastructure, policymakers can avoid over-reliance on any single component, fostering more adaptive and resilient approaches to water management (Zheng et al., 2023). In areas where natural ecosystems are still relatively intact, policies should prioritize ecological protection to preserve natural water regulation functions. In contrast, in regions heavily dependent on infrastructure, the focus should be on enhancing infrastructure efficiency while simultaneously promoting ecological restoration in surrounding areas. An integrated approach that considers both infrastructure and natural ecosystems is essential for achieving sustainable water resource management. It also raises public awareness of the value of ecosystems, encouraging investment in ecological protection and restoration, which is crucial for long-term sustainability (Veerkamp et al., 2021; Xu et al., 2024). Therefore, understanding the distinct yet interdependent roles of natural ecosystems and infrastructure is key to balancing sustainable water resource use with the needs of various stakeholders.
The Danjiang River Basin (DJRB), located on the southeastern side of the Qinling Mountains, serves as a crucial water source for the South-to-North Water Diversion Middle Route Project (SNWDP) in China. However, the basin faces significant challenges due to seasonal water shortages, leading to pronounced conflicts between water supply and demand. The interactions between natural ecosystems and infrastructure within the basin are complex and diverse, particularly under the combined pressures of climate change and human activities, posing severe challenges for watershed water resource management (Li et al., 2021; Zhang et al., 2022; Liu et al., 2023). Currently, water resource management in the DJRB largely relies on the regulation of natural ecosystems and reservoir infrastructure, yet the differential contributions of these two elements to water provision, along with the corresponding ecosystem service values, remain unclear.
This study focuses on the DJRB to systematically explore the contributions of natural systems and infrastructure to water provision services through the following three research objectives (Ahmadzadeh et al., 2022): Quantitatively assess the basin’s seasonal water supply capacity using the SWAT model to simulate hydrological processes (Ahmed et al., 2021); Calculate the water demand across different sectors within the basin and identify potential imbalances between supply and demand (Bellezoni et al., 2021); Propose a quantitative assessment method to differentiate the relative contributions of natural ecosystems and infrastructure to watershed water provision services and calculate the associated ecosystem service values. This research aims to provide a theoretical foundation and decision-making support for water resource management in the DJRB and similar regions, promoting the coordinated management of natural ecosystems and infrastructure to achieve sustainable water resource utilization.
The Danjiang River, the longest tributary of the Hanjiang River, originates from the southern slopes of Mount Fenghuang in the northwestern part of Shangluo City, within the Qinling Mountains. The main river channel extends approximately 390 km, draining a watershed area of about 8,912 km2. The Erlongshan Reservoir (33.91°N, 109.91°E), situated in the upper reaches of the Danjiang River, has a dam height of 63.7 m and a total storage capacity of 81 million m3. Designed to withstand a flood with a 2% probability (a 50-year return period), the reservoir’s peak flood discharge is 1,900 m3/s. The reservoir plays a significant role in irrigation and flood control and serves as a crucial water source for Shangluo City (Figure 1).
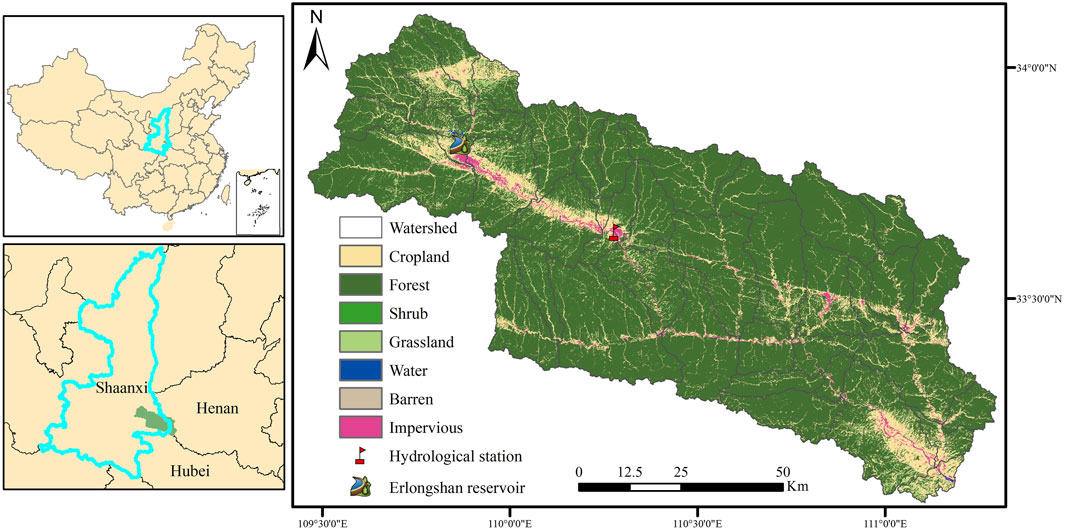
Figure 1. Location and land use map of study area.
The DJRB straddles the northern subtropical and warm temperate zones, with a mean annual temperature ranging from 7.8°C to 13.9°C and an average annual precipitation between 696.8 and 830.1 mm. The basin experiences distinct wet and dry seasons, with over 80% of the annual rainfall occurring during the rainy season (May to October), while the dry season (November to April) coincides with peak water demand for irrigation and other uses. The basin’s forest ecosystems cover a large portion of the area, with vegetation primarily consisting of warm temperate deciduous broadleaf forests, shrubs, and herbaceous plants. Additionally, the DJRB serves as a critical water source protection area for SNWDP, providing key ecosystem services such as water retention, water quality purification, and flood regulation. However, increasing demands for water due to population growth, agriculture, and industrial activities, coupled with pronounced seasonal water shortages, have exacerbated the region’s water supply-demand conflicts (Liu et al., 2023; Li et al., 2021).
The research framework is outlined in Figure 2. First, the SWAT hydrological model is used to simulate water supply within the watershed. Then, monthly water demand is calculated for various sectors, including agriculture, industry, residential (urban and rural), and ecological needs (such as maintaining river base flow). In the third step, two scenarios are established: Natural ecosystem scenario excludes upstream reservoirs and focuses on assessing the contribution and value of natural ecosystems in meeting water demands; Water infrastructure scenario excludes natural ecosystems to evaluate the role and value of reservoir infrastructure. Finally, by integrating local water pricing and using the market value method, the distinct contributions of natural ecosystems and infrastructure to watershed water provision services are quantified.

Figure 2. Research framework.
The data used in this study are summarized in Table 1. This includes information on climate, soil, land use and cover maps, hydrological station monitoring data, industrial and domestic water demand, as well as downstream river ecological flow requirements.
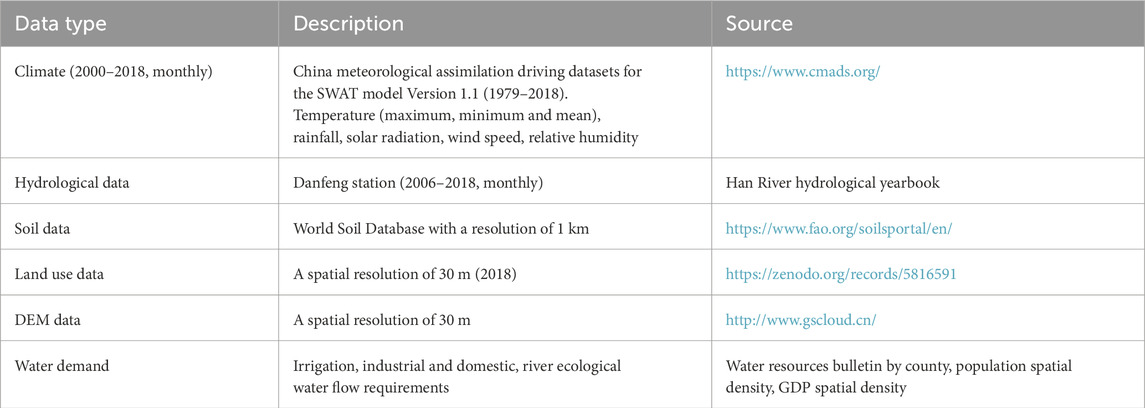
Table 1. Summary of data sources for this study.
The SWAT model, developed by the U.S. Department of Agriculture, is designed to simulate both the quantity and quality of surface and groundwater, and to predict the environmental impacts of land use, land management practices, and climate change (Neitsch et al., 2011). As one of the most widely used hydrological models, SWAT is capable of simulating water provision capacity under various scenario modes within a watershed (Ahmadzadeh et al., 2022; Nedkov et al., 2022). SWAT has also been effectively applied to model water-related services in the Qinling Mountains and the Hanjiang River Basin, demonstrating reliable and valid results. Therefore, we utilize SWAT to quantify the water provision services in the DJRB.
The hydrological processes simulated by the SWAT model are primarily divided into two stages: the land phase of the hydrological cycle, which includes runoff generation and hillslope routing, and the routing phase, which encompasses the flow routing through the river channels. The entire process is driven by the principles of water balance, strictly adhering to the water balance equation (Nguyen et al., 2022). During the model’s operation, the watershed is divided into 43 sub-watershed based on the terrain and river network characteristics, with the total water volume in the main river channel after flow routing being used as the water supply for each watershed. The SWAT-CUP tool is utilized for the calibration and validation of the simulation results for the DJRB. Using observed runoff data from the Danfeng Station in the study area, the period from January 2000 to December 2005 is selected as the warm-up period, January 2006 to December 2015 as the calibration period, and January 2016 to December 2018 as the validation period. Calibration and validation are performed by adjusting 28 model parameters. The performance of the SWAT model is assessed using the Nash-Sutcliffe Efficiency (NSE) and the coefficient of determination (R2). During both the calibration and validation periods, NSE and R2 values exceeded 0.5 (Figure 3), indicating that the SWAT model performed well in simulating the hydrological processes of the DJRB.
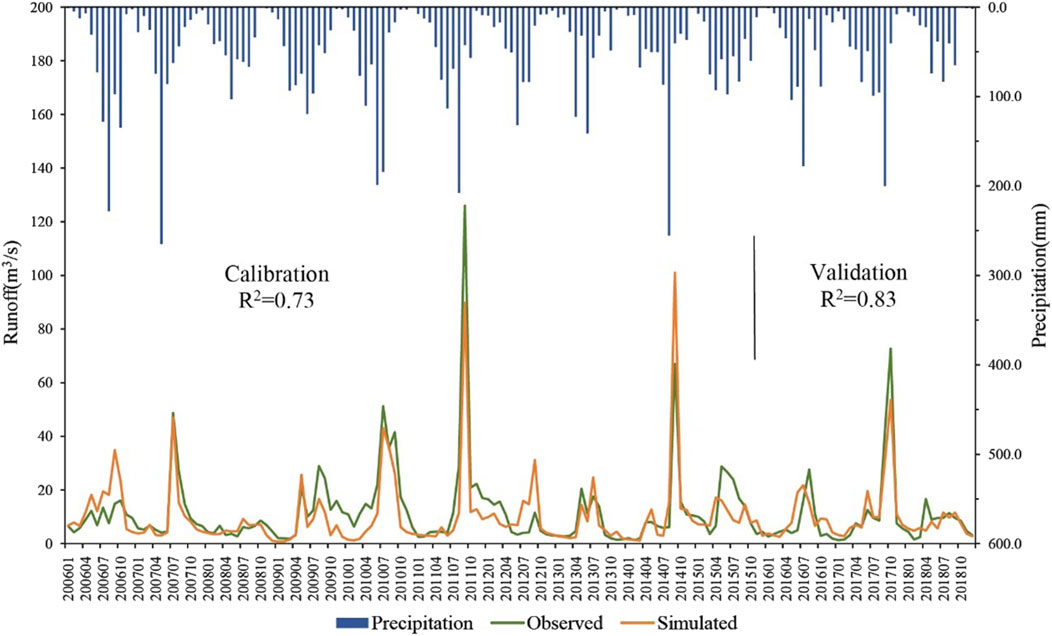
Figure 3. Comparison of simulated and observed monthly runoff values. Note: comparison of simulated and observed runoff data for two periods (2005–2015 and 2016–2018) shows the accuracy of the SWAT model and supports the reliability of the findings.
Water demand refers to the amount of water consumed by human activities within a watershed to meet production and living needs, excluding water losses due to natural processes such as plant uptake, pond retention, and transport (Guan et al., 2023). In this study, the water demand in the DJRB is categorized into four main types: agricultural water use, industrial water use, domestic water use (including urban and rural residents), and ecological water use (river baseflow). Using water usage data from the water resources bulletins of various counties within the study area, as well as the Shangluo City Water Resources Bulletin, we obtained water consumption data for each sector. These data were then spatially visualized by integrating them with land use types, population density, and GDP spatial density data. To align with the spatial scale of the water supply model, the spatially distributed water demand raster data were aggregated to the watershed scale using the spatial statistical analysis tools in ArcGIS, resulting in the estimation of water demand at the watershed level.
Given that this study is conducted on a monthly scale, the agricultural irrigation periods were determined based on local crop planting schedules, phenology, and climatic conditions. Irrigation is required during March to June and September to October. The river baseflow also varies with monthly demand, and the baseflow was determined based on relevant observational and modeling studies.
To explore the relationship between ecosystem services (ESs) supply and demand, the supply-to-demand ratio (S:D) was used within the watershed. Following the methodology of Lyu and Wu (2023) and Wei et al. (2023), the Ri ratio was employed to reflect the supply-demand characteristics across the various watershed of the DJRB.
In this study, 43 sub-watershed were analyzed, where Ri represents the supply-to-demand ratio of ecosystem services in watershed i, Si is the supply of water provision services or soil retention services in watershed i, and Di is the demand for these services in watershed i. When Ri = 1, it indicates a balance between the supply and demand of ecosystem services. If Ri >1, the supply exceeds the demand; if Ri <1, the supply is less than the demand, indicating a need to improve the supply-demand relationship. To determine the water provision services' supply-demand relationship, the supply-to-demand ratio was classified into four categories at intervals of 0.5: <0.5, 0.5–1, 1–1.5, and >1.5.
The market value method was employed to separately calculate the contribution of natural ecosystems and infrastructure to the value of water provision services in the DJRB (Ouyang et al., 2020; Liu et al., 2024). The specific formula used is as follows:
ESVwater is the value of water provisioning (yuan), Wi is the natural or infrastructure water supply (m3), and P is the price of water in the area (yuan/m3). Based on the actual conditions of the study area, the residential water price was averaged, resulting in a value of 6.1 (yuan/m3).
As shown in Figure 4, the total water supply in the DJRB in 2018 reached 2.394 × 10³ million m3, with an average of 56 million m3 per watershed. Some watersheds demonstrated significantly higher water provision capacities, with the most productive watershed contributing 304 million m3, while others exhibited the weakest supply, providing as little as 21 million m3. Spatially, the central watershed demonstrated the strongest water provision capabilities, whereas the other tributaries had relatively weaker capacities. The total water supply in the basin is influenced by various factors, including land use types, soil properties, and catchment areas, all of which contribute to the varying water volumes entering the main river channels. As illustrated in Figure 6B, due to climatic and precipitation factors, the water supply peaks in May at 505 million m3 and reaches its lowest in December at 7 million m3.
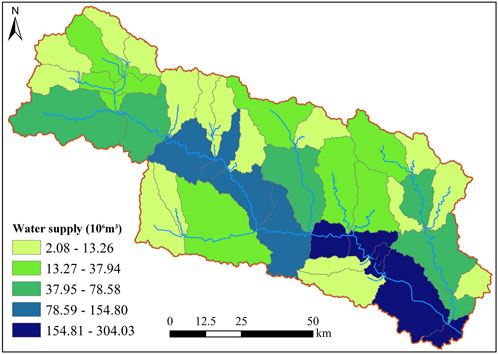
Figure 4. Spatial distribution map of water supply in the DJRB. Note: displays the spatial distribution of water supply in the Danjiang River Basin, highlighting regional differences in water availability.
In 2018, total water demand in the DJRB reached 1.122 × 10³ million m3, with 376 million m3 for agriculture, 194 million m3 for domestic use, 247million m3 for industry, and 305 million m3 for river base flow (Figure 5). Water demand was lower in boundary watersheds dominated by natural ecosystems. As shown in Figure 6B, demand fluctuated from March to June and September to October, driven by river base flow and irrigation needs, peaking in September at 141 million m3 and dropping to 44 million m3 in February. Some watersheds show a supply-to-demand ratio between 0.2 and 0.5, where supply falls short, affecting 52.81% of the area (Figure 6A). In contrast, watersheds along the central mainstem have ratios above 1.5, with peaks up to 6.5, providing surplus water for downstream regions while meeting local needs.
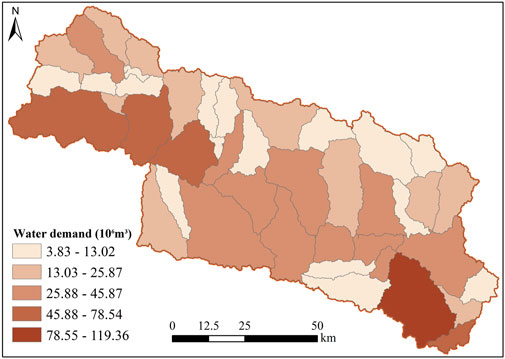
Figure 5. Spatial distribution map of water demand in the DJRB. Note: shows the spatial distribution of water demand, providing insight into regional variations in consumption and the water supply-demand relationship.
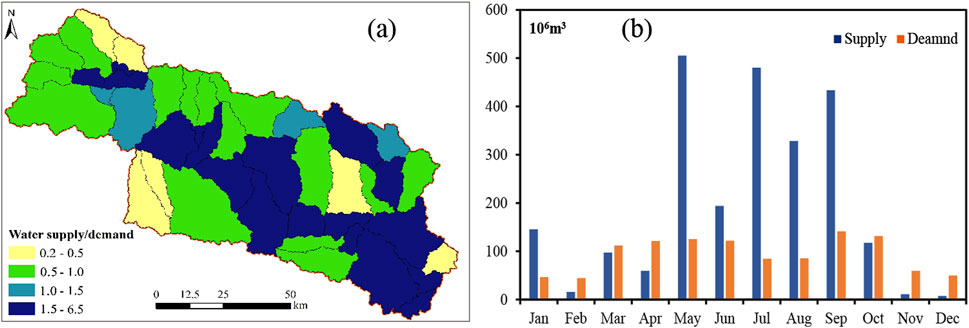
Figure 6. (a) Water supply and demand relationship; (b) Water supply and demand on a monthly basis.
Monthly variations reveal that water demand exceeds supply from February to April and October to December, with a total shortfall of 210 million m3 (Figure 6A). Overall, no significant shortages occurred, thanks to natural ecosystems releasing stored water during dry periods and reservoirs balancing supply. From May to September, water supply surpasses demand by 1.383 ×10³ million m3, with the surplus managed through ecosystem regulation and reservoir storage to mitigate risks and ensure water security.
Through two scenarios, we evaluated the impact of natural ecosystems and reservoir infrastructure on water provision (Figure 7). In the natural ecosystem scenario, excluding reservoirs, water supply increased by approximately 27% to 3.039 × 10³ million m3, a 22% increase from May to September due to reduced evapotranspiration and water loss. However, reservoirs are essential for balancing supply by storing water during wet periods and releasing it during dry ones. In the infrastructure-only scenario, excluding ecosystems, water supply dropped by over 90% to 193 million m3, relying solely on upstream inflows. The study concludes that reservoirs alone cannot meet regional water demand or ensure water security without the role of natural ecosystems.
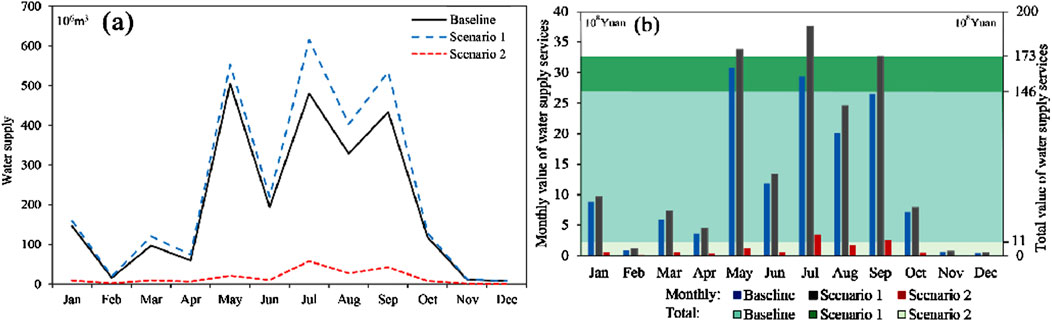
Figure 7. (a) Water provisioning under three scenario simulations and (b) ESV under three scenario simulations. Note: compares water supply and ecosystem service value changes under three scenarios, highlighting the role of ecosystems and infrastructure in different conditions.
Using unit prices for agricultural, residential, and industrial water, the water resource provision value in the DJRB is set at 6.1 Yuan/m3. Under the baseline scenario, the total value amounts to 14.602 billion CNY. In the natural ecosystem scenario, the value rises to 18.538 billion CNY, while in the infrastructure-only scenario, it drops to 1.179 billion CNY. Although natural ecosystems provide the highest value, reservoirs remain essential for balancing water distribution. However, infrastructure alone cannot meet regional water needs, highlighting the critical role of ecosystems in water resource provision.
This study employed the SWAT model to simulate monthly water supply volumes for 2018, demonstrating the model’s capability to capture the spatiotemporal variations in water resources within the study area effectively. The results revealed a pronounced seasonal variation in water supply, closely linked to seasonal fluctuations in precipitation. Specifically, water supply significantly increases during the wet season and markedly decreases during the dry season. Previous studies have also highlighted the SWAT model’s widespread application in simulating water resource conditions across different watersheds, such as the Yangtze River Basin (Nie et al., 2023), the Lancang-Mekong River (Li et al., 2023), and Brazil (Rodrigues et al., 2014). Notably, the model provides reliable simulations and future predictions, especially in modeling seasonal precipitation and hydrological responses.
Additionally, this study explores water demand from the perspectives of various stakeholders. It was found that water demand fluctuates with seasonal changes, particularly with agricultural irrigation needs being lower during the wet season due to ample rainfall and surging during the dry season. Urban and industrial users, on the other hand, have higher stability requirements for water supply. During dry periods, insufficient water supply could lead to shortages affecting both daily life and production. The supply-demand relationships further reveal spatial imbalances that exacerbate conflicts among stakeholders (Wang et al., 2023).
To clarify the characteristics of water demand from different stakeholders and the watershed’s supply-demand relationships, we compared three scenarios to elucidate the impacts of natural ecosystems and infrastructure on water resources. The findings indicate that if only natural ecosystems are present without infrastructure, while the total water supply and ecosystem service value increase by 15.88%, water demand cannot be fully met during dry periods. This leads to severe water shortages in areas with weaker natural ecosystems, heightening conflicts among stakeholders. Conversely, if only infrastructure is present without natural ecosystems, the water supply volume decreases by 92%, further intensifying regional water conflicts and potentially leading to extreme situations of water scarcity during dry periods. Therefore, the synergistic effects of natural ecosystems and infrastructure play a crucial role in alleviating conflicts among water users, ensuring that water storage and release are managed effectively during both wet and dry periods to meet the diverse needs of various watersheds.
Natural ecosystems, such as forests, shrubs, and grasslands, play a vital role in water provision through canopy interception, soil infiltration, and evapotranspiration, regulating precipitation and groundwater recharge (Tiwary and Kumar, 2014; Peng et al., 2019). Vegetation roots enhance soil structure, reduce runoff, and increase water infiltration, promoting groundwater storage. They also buffer the impacts of climate change, mitigating extreme events like storms and droughts. However, land use changes and urbanization have degraded these ecosystems, compromising their water provisioning capacity (Xu et al., 2024). Quantifying their contributions remains challenging due to complex ecological processes, spatial heterogeneity, and temporal dynamics (Wu et al., 2024).
Water resource infrastructure, including reservoirs, dams, and diversion projects, directly enhances the stability and sustainability of water provisioning services through regulation and storage of water resources, flow control, and water quality assurance. Reservoirs, in particular, capture river flow and store excess water during wet periods, providing a stable water source during dry seasons to meet agricultural, industrial, and urban demands, thus effectively alleviating seasonal water shortages and enhancing regional economic resilience (Ahmed et al., 2021). Dams also play a crucial role in flood control by regulating flood flows, protecting downstream areas from flood hazards, and safeguarding residential areas, farmland, and infrastructure (Scanlon et al., 2023). However, the construction of such infrastructure faces challenges, including high costs that may exceed the financial capacity of many developing regions (Nie et al., 2023). Additionally, maintenance and upgrading of infrastructure involve long-term efforts, with increasing costs associated with aging facilities and heightened usage. Climate change further challenges the adaptability and flexibility of traditional water resource infrastructure in responding to extreme weather events (Veerkamp et al., 2021).
While natural ecosystems and infrastructure play distinct roles in water provisioning, they are often viewed as a unified system, overlooking their unique values and limitations. This study highlights the independent contributions of both components, providing a scientific basis for developing comprehensive and sustainable water resource management strategies. Particularly under the context of climate change, where uncertainties in natural hydrological cycles are increasing, balancing water provisioning security with ecosystem health remains a pressing issue. Future water resource management should focus on the coordinated development of natural systems and infrastructure, leveraging their complementary roles to ensure the sustainability and efficiency of water provision.
While our study advances understanding of the contributions of natural ecosystems and infrastructure to water provisioning and highlights their synergy in meeting diverse stakeholder needs, challenges remain. Infrastructure development can disrupt river connectivity and biodiversity (Flecker et al., 2022), underscoring the need to prioritize nature-based solutions (Chung et al., 2021). Limitations include the inability to model reservoir operations accurately and potential inaccuracies in monthly water demand data. Future research should advocate for a greater consideration of the mutual benefits between natural ecosystems and infrastructure (Sun et al., 2022). Integrating nature-based solutions into multi-objective optimization methods for ecosystem service flow regulation within the context of ecosystem management will enhance collective stakeholder interests. Furthermore, future studies should clarify ecosystem service flows to enable accurate accounting of regional GEP from the beneficiaries’ perspective.
This study examines the Qinling-Danjiang watershed, a region prone to seasonal water shortages, by using the SWAT hydrological model to simulate the spatiotemporal dynamics of water provisioning services. The total water supply in 2018 was 2.394 × 10³ million m3, with peak provision in May and notable spatial variations. However, 52.81% of the watershed experienced a supply deficit, with agricultural irrigation being the largest consumer of the 1.122 × 10³ million m3 total demand. Scenario analyses revealed that natural ecosystems alone could increase water provision to 3.039 × 10³ million m3 but worsen seasonal imbalances, while reservoir infrastructure alone supplied only 193 million m3—insufficient to meet demand. Under the baseline scenario, water services were valued at 14.602 billion CNY, rising to 18.538 billion CNY in the ecosystem-only scenario and dropping to 1.179 billion CNY with only infrastructure. This research advances understanding of the complementary roles of ecosystems and infrastructure in water provisioning, offering new insights into their integration for sustainable water resource management. It underscores the importance of balancing natural and artificial systems to enhance water availability, ensure regional water security, and inform policy decisions in similar water-scarce areas.
Publicly available datasets were analyzed in this study. This data can be found here: https://www.cmads.org/.
JZ: Conceptualization, Writing–original draft, Writing–review and editing. SZ: Conceptualization, Software, Writing–review and editing. YH: Data curation, Methodology, Writing–review and editing. FF: Data curation, Methodology, Writing–review and editing. JM: Software, Supervision, Writing–review and editing. HZ: Conceptualization, Funding acquisition, Supervision, Writing–review and editing.
The author(s) declare that financial support was received for the research, authorship, and/or publication of this article. This work was supported by the National Natural Science Foundation of China (Grant No.: 72349001, 4240011515).
The authors declare that the research was conducted in the absence of any commercial or financial relationships that could be construed as a potential conflict of interest.
The authors declare that no Generative AI was used in the creation of this manuscript.
All claims expressed in this article are solely those of the authors and do not necessarily represent those of their affiliated organizations, or those of the publisher, the editors and the reviewers. Any product that may be evaluated in this article, or claim that may be made by its manufacturer, is not guaranteed or endorsed by the publisher.
Ahmadzadeh, H., Mansouri, B., Fathian, F., and Vaheddoost, B. (2022). Assessment of water demand reliability using SWAT and RIBASIM models with respect to climate change and operational water projects. Agr. Water. mange. 261, 107377. doi:10.1016/j.agwat.2021.107377
Ahmed, S. S., Bali, R., Khan, H., Mohamed, H. I., and Sharma, S. K. (2021). Improved water resource management framework for water sustainability and security. Environ. Res. 201, 111527. doi:10.1016/j.envres.2021.111527
Bellezoni, R. A., Meng, F., He, P., and Seto, K. C. (2021). Understanding and conceptualizing how urban green and blue infrastructure affects the food, water, and energy nexus: a synthesis of the literature. J. Clean. Prod. 289, 125825. doi:10.1016/j.jclepro.2021.125825
Boithias, L., Acuña, V., Vergoñós, L., Ziv, G., Marcé, R., and Sabater, S. (2014). Assessment of the water supply: demand ratios in a Mediterranean basin under different global change scenarios and mitigation alternatives. Sci. Total Environ. 470, 567–577. doi:10.1016/j.scitotenv.2013.10.003
Booth, E. G., Zipper, S. C., Loheide, I. I. S. P., and Kucharik, C. J. (2016). Is groundwater recharge always serving us well? Water supply provisioning, crop production, and flood attenuation in conflict in Wisconsin, USA. Ecosyst. Serv. 21, 153–165. doi:10.1016/j.ecoser.2016.08.007
Brauman, K. A., Daily, G. C., Duarte, T. K. e., and Mooney, H. A. (2007). The nature and value of ecosystem services: an overview highlighting hydrologic services. Annu. Rev. Environ. Resour. 32 (1), 67–98. doi:10.1146/annurev.energy.32.031306.102758
Chenoweth, J., Anderson, A. R., Kumar, P., Hunt, W., Chimbwandira, S. J., and Moore, T. L. (2018). The interrelationship of green infrastructure and natural capital. Land. use. Policy. 75, 137–144. doi:10.1016/j.landusepol.2018.03.021
Chung, M. G., Frank, K. A., Pokhrel, Y., Dietz, T., and Liu, J. (2021). Natural infrastructure in sustaining global urban freshwater ecosystem services. Nat. Sustain. 4 (12), 1068–1075. doi:10.1038/s41893-021-00786-4
Cong, W., Sun, X., Guo, H., and Shan, R. (2020). Comparison of the SWAT and InVEST models to determine hydrological ecosystem service spatial patterns, priorities and trade-offs in a complex basin. Ecol. Indic. 112, 106089. doi:10.1016/j.ecolind.2020.106089
Dai, X., Wang, L., Tao, M., Huang, C., Sun, J., and Wang, S. (2021). Assessing the ecological balance between supply and demand of blue-green infrastructure. J. Environ. Manage. 288, 112454. doi:10.1016/j.jenvman.2021.112454
Daily, G. C. (2013). Nature’s services: societal dependence on natural ecosystems (1997). in The future of nature. Yale University Press, 454–464.
Flecker, A. S., Shi, Q., Almeida, R. M., Angarita, H., Gomes-Selman, J. M., García-Villacorta, R., et al. (2022). Reducing adverse impacts of Amazon hydropower expansion. Science 375 (6582), 753–760. doi:10.1126/science.abj4017
Guan, D., Deng, Z., Zhou, L., Fan, X., Yang, W., Peng, G., et al. (2023). How can multiscenario flow paths of water supply services be simulated? A supply-flow-demand model of ecosystem services across a typical basin in China. Sci. Tota.l Environ. 893, 164770. doi:10.1016/j.scitotenv.2023.164770
Hou, Y., Ding, S., Chen, W., Li, B., Burkhard, B., Bicking, S., et al. (2020). Ecosystem service potential, flow, demand and their spatial associations: a comparison of the nutrient retention service between a human- and a nature-dominated watershed. Sci. Total. Environ. 748, 141341. doi:10.1016/j.scitotenv.2020.141341
Li, M., Liang, D., Xia, J., Song, J., Cheng, D., Wu, J., et al. (2021). Evaluation of water conservation function of Danjiang River Basin in qinling Mountains, China based on InVEST model. J. Environ. Manage. 286, 112212. doi:10.1016/j.jenvman.2021.112212
Li, R., Huang, H. Q., Wang, Z., and Zhao, R. (2023). Quantitative assessment of the impacts of climate and human activities on streamflow of the Lancang-Mekong river over the recent decades. Front. Earth. Sc-Switz 10, 1024037. doi:10.3389/feart.2022.1024037
Li, T., Wang, H., Fang, Z., Liu, G., Zhang, F., Zhang, H., et al. (2022). Integrating river health into the supply and demand management framework for river basin ecosystem services. Sustain. Prod. Consump. 33, 189–202. doi:10.1016/j.spc.2022.06.025
Liu, W., Wu, J., Xu, F., Mu, D., and Zhang, P. (2023). Modeling the effects of land use/land cover changes on river runoff using SWAT models: a case study of the Danjiang River source area, China. Environ. Res. 242, 117810. doi:10.1016/j.envres.2023.117810
Liu, Y., Kong, L., Jiang, C., Zhang, X., and Ouyang, Z. (2024). Accounting of value of ecosystem services in the desert: an example of the Kubuqi Desert ecosystem. Front. Earth. Sc-Switz. 11, 1247367. doi:10.3389/feart.2023.1247367
Lyu, Y., and Wu, C. (2023). Managing the supply-demand mismatches and potential flows of ecosystem services from the perspective of regional integration: a case study of Hangzhou, China. China. Sci. total. Environ. 902, 165918. doi:10.1016/j.scitotenv.2023.165918
Maskey, M. L., Facincani Dourado, G., Rallings, A. M., Rheinheimer, D. E., Medellín, A. J., and Viers, J. H. (2022). Assessing hydrological alteration caused by climate change and reservoir operations in the san joaquin River Basin, California. Front. Env. Sci-Switz. 10, 765426. doi:10.3389/fenvs.2022.765426
Nedkov, S., Campagne, S., Borisova, B., Krpec, P., Prodanova, H., Kokkoris, I. P., et al. (2022). Modeling water regulation ecosystem services: a review in the context of ecosystem accounting. Ecosyst. Serv. 56, 101458. doi:10.1016/j.ecoser.2022.101458
Neitsch, S., Arnold, J., Kiniry, J., and Kiniry, J. (2011). Soil and water assessment tool theoretical documentation version 2009. Texas: Texas Water Resources Institute.
Nguyen, T. V., Dietrich, J., Dang, T. D., Tran, D. A., Van Doan, B., Sarrazin, F. J., et al. (2022). An interactive graphical interface tool for parameter calibration, sensitivity analysis, uncertainty analysis, and visualization for the Soil and Water Assessment Tool. Environ. Modell. Softw. 156, 105497. doi:10.1016/j.envsoft.2022.105497
Nie, N., Li, T., Miao, Y., Zhang, W., Gao, H., He, H., et al. (2023). Asymmetry of blue and green water changes in the Yangtze river basin, China, examined by multi-water-variable calibrated SWAT model. J. Hydrol. 625, 130099. doi:10.1016/j.jhydrol.2023.130099
Ouyang, Z. Y., Song, C., Zheng, H., Polasky, S., Xiao, Y., Bateman, I. J., et al. (2020). Using gross ecosystem product (GEP) to value nature in decision making. P. Natl. Acad. Sci. U. S. A. 117 (25), 14593–14601. doi:10.1073/pnas.1911439117
Peng, J., Wang, A., Luo, L., Liu, Y., Li, H., Hu, Y., et al. (2019). Spatial identification of conservation priority areas for urban ecological land: an approach based on water ecosystem services. Land. Degrad. Dev. 30 (6), 683–694. doi:10.1002/ldr.3257
Rodrigues, D. B., Gupta, H. V., and Mendiondo, E. M. (2014). A blue/green water-based accounting framework for assessment of water security. Water. Resour. Res. 50 (9), 7187–7205. doi:10.1002/2013wr014274
Scanlon, B. R., Fakhreddine, S., Rateb, A., de Graaf, I., Famiglietti, J., Gleeson, T., et al. (2023). Global water resources and the role of groundwater in a resilient water future. Nat. Rev. Earth.Env. 4 (2), 87–101. doi:10.1038/s43017-022-00378-6
Sun, Q., Wang, J., Zhang, J., and Xing, Z. (2022). Selecting reservoir reconstruction schemes from an ecological-economic trade-off perspective: model building and case study. J. Clean. Prod. 376, 134183. doi:10.1016/j.jclepro.2022.134183
Tiwary, A., and Kumar, P. (2014). Impact evaluation of green–grey infrastructure interaction on built-space integrity: an emerging perspective to urban ecosystem service. Sci. Tota.l Environ. 487, 350–360. doi:10.1016/j.scitotenv.2014.03.032
Veerkamp, C. J., Schipper, A. M., Hedlund, K., Lazarova, T., Nordin, A., and Hanson, H. I. (2021). A review of studies assessing ecosystem services provided by urban green and blue infrastructure. Ecosyst. Serv. 52, 101367. doi:10.1016/j.ecoser.2021.101367
Wang, L., Zheng, H., Chen, Y., Long, Y., Chen, J., Li, R., et al. (2023). Synergistic management of forest and reservoir infrastructure improves multistakeholders’ benefits across the forest-water-energy-food nexus. J. Clean. Prod. 422, 138575. doi:10.1016/j.jclepro.2023.138575
Wang, L., Zheng, H., Wen, Z., Liu, L., Robinson, B. E., Li, R., et al. (2019). Ecosystem service synergies/trade-offs informing the supply-demand match of ecosystem services: framework and application. Ecosyst. Serv. 37, 100939. doi:10.1016/j.ecoser.2019.100939
Wei, W., Nan, S., Xie, B., Liu, C., Zhou, J., and Liu, C. (2023). The spatial-temporal changes of supply-demand of ecosystem services and ecological compensation: a case study of Hexi Corridor, Northwest China. Ecol. Eng. 187, 106861. doi:10.1016/j.ecoleng.2022.106861
Wu, S., Liu, K.-D., Zhang, W., Dou, Y., Chen, Y., Zhang, T., et al. (2024). An integrated analysis framework of supply, demand, flow, and use to better understand realized ecosystem services. Ecosyst. Serv. 69, 101649. doi:10.1016/j.ecoser.2024.101649
Xu, Z., Ma, J., Zheng, H., Wang, L., Ying, L., Li, R., et al. (2024). Quantification of the flood mitigation ecosystem service by coupling hydrological and hydrodynamic models. Ecosyst. Serv. 68, 101640. doi:10.1016/j.ecoser.2024.101640
Zahoor, A., Xu, T., Wang, M., Dawood, M., Afrane, S., Li, Y., et al. (2023). Natural and artificial green infrastructure (GI) for sustainable resilient cities: a scientometric analysis. Environ. Impact. Asses. 101, 107139. doi:10.1016/j.eiar.2023.107139
Zhang, J., Guo, W., Cheng, C., Tang, Z., and Qi, L. (2022). Trade-offs and driving factors of multiple ecosystem services and bundles under spatiotemporal changes in the Danjiangkou Basin, China. Ecol. Indic. 144, 109550. doi:10.1016/j.ecolind.2022.109550
Zhang, J., Guo, W., Wang, Y., Tang, Z., and Qi, L. (2024). Identifying the regional spatial management of ecosystem services from a supply and demand perspective: a case study of Danjiangkou reservoir area, China. Ecol. Indic. 158, 111421. doi:10.1016/j.ecolind.2023.111421
Keywords: natural ecosystems, water infrastructures, supply and demand relationship, ecosystem service values (ESVs), Qinling-Danjiang watershed
Citation: Zhang J, Zhang S, Huang Y, Fan F, Ma J and Zheng H (2025) Distinguishing the contributions of natural ecosystems and water infrastructures to water provisioning services at watershed scale. Front. Earth Sci. 13:1512780. doi: 10.3389/feart.2025.1512780
Received: 17 October 2024; Accepted: 19 February 2025;
Published: 13 March 2025.
Edited by:
Guoxia Ma, Chinese Academy for Environmental Planning, ChinaReviewed by:
Meng Zhu, Key Laboratory of Ecohydrology of Inland River Basin, Northwest Institute of Eco-Environment and Resources, Chinese Academy of Sciences (CAS), ChinaCopyright © 2025 Zhang, Zhang, Huang, Fan, Ma and Zheng. This is an open-access article distributed under the terms of the Creative Commons Attribution License (CC BY). The use, distribution or reproduction in other forums is permitted, provided the original author(s) and the copyright owner(s) are credited and that the original publication in this journal is cited, in accordance with accepted academic practice. No use, distribution or reproduction is permitted which does not comply with these terms.
*Correspondence: Hua Zheng, emhlbmdodWFAcmNlZXMuYWMuY24=
†Present address: Hua Zheng, Institute of Urban Environment, Chinese Academy of Sciences, Xiamen, China
Disclaimer: All claims expressed in this article are solely those of the authors and do not necessarily represent those of their affiliated organizations, or those of the publisher, the editors and the reviewers. Any product that may be evaluated in this article or claim that may be made by its manufacturer is not guaranteed or endorsed by the publisher.
Research integrity at Frontiers
Learn more about the work of our research integrity team to safeguard the quality of each article we publish.