 Xinyuan Ji
 Chunqiang Xu
- China National Offshore Oil Corporation Limited, Tianjin, China
Introduction: Source-to-sink (S2S) analysis plays a crucial role in sedimentological studies, serving as an effective tool for reconstructing sediment-routing processes and guiding hydrocarbon exploration. Numerous studies on S2S systems have focused on examining the correlations among subsystems by statistically analyzing and characterizing the parameters of the S2S system. However, few studies focus on quantifying the degree of interaction (i.e., the coupling degree) between multiple sub-S2S systems, leading to a biased understanding of coupling mechanisms, S2S processes, and exploration potential.
Methods: To address this issue, we developed a quantitative model for coupling degree based on entropy weight-coupling theory (EW-CT), providing a novel framework for systematically evaluating the interactions within S2S systems. The Paleogene Chengbei Low Uplift (CBLU) in the Bozhong Sag, offshore Bohai Bay Basin (OBBB) in eastern China, serves as a case study to validate the model and examine the multi-hierarchy S2S coupling mechanisms as well as the exploration potential in an ancient uplift system.
Results: The main findings are: (1) the CBLU is divided into five second-level S2S systems (P/Q/R/S/T), with the study area (S) further subdivided into six third-level sub-S2S systems (S1–S6); (2) there is a positive correlation between EW-CT values and coupling degree in the S2S systems; (3) the coupling degree of the eastern braided-delta S2S systems (S4–S6) exceeds that of the northern fan-delta S2S systems (S1–S3); (4) among the braided-delta S2S systems, the S5 system shows the greatest exploration potential.
Discussion: Importantly, this study underscores the broader applicability of the EW-CT model across diverse geological settings, offering a quantitative approach to assess S2S interactions and identify high-potential areas for hydrocarbon exploration. The proposed framework has the potential to enhance sedimentological research and improve exploration strategies in various sedimentary basins worldwide, bridging the gap between theoretical studies and practical applications.
Highlights
• A quantitative coupling degree model for S2S systems is established based on EW-CT.
• The EW-CT values of S2S systems show a positive correlate with coupling degree.
• The dispersal models of S2S systems are identified and analyzed.
• The correlation between coupling degree and exploration potential is revealed.
• The exploration potential of the S2S systems is analyzed and ranked based on the EW-CT values.
1 Introduction
Modern landscapes are influenced by the dynamic interplay between the processes of rock uplift and erosion, both of which are intricately connected to the sediment (Allen, 2005; Allen, 2008; Carter et al., 2010; Cathy and Ingersll, 2011). The processes of denudation, transportation, and deposition of clastic materials form a complex coupled system referred to as the source-to-sink (S2S) system (Weltje and von Eynatten, 2004; Allen, 2008; Allen and Heller, 2011; Prizomwala et al., 2014; Helland-Hansen et al., 2016) (Figure 1A). Within the geological framework of S2S systems, sediment-routing processes can be analyzed more systematically (Sømme et al., 2009a; Sømme et al., 2009b; Carter et al., 2010; Romans et al., 2016). In recent decades, geologists have increasingly focused on studying S2S systems in the deep sea (Romans et al., 2016), lacustrine basins (Zhu et al., 2014; Kuehl et al., 2016), and continental margins (Carter et al., 2010; Walsh et al., 2016). Due to geological tectonic movements and denudation process (Figures 1B, C), S2S systems typically encounter significant challenges as multiple geological processes interact, leading to coupling effects (Haken, 1983). The varying degrees of coupling within S2S systems reflect diverse coupling mechanisms, sediment dispersal patterns, and exploration potential. Therefore, there is an urgent need to establish a systematic and quantitative method for analyzing the degree of coupling within S2S systems.
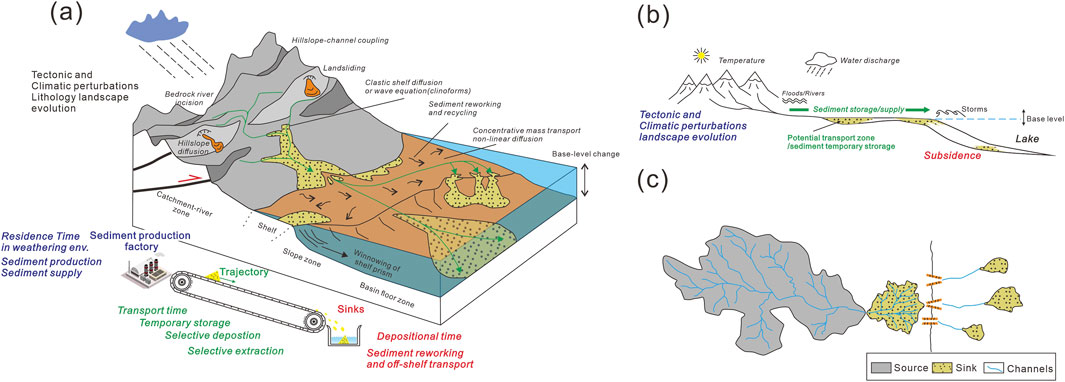
Figure 1. (A) Schematic diagram of the sediment-migration from source to sink (modified from Sømme et al., 2009a). (B) Typical profile of a S2S system showing erosion, migration, sedimentation, and significant influence factors of base-level fluctuations, climate changes, and tectonic perturbations (modified from Romans et al., 2016). (C) Graphical illustration of a S2S system containing the upstream sediment-supply area feature (modified from Helland-Hansen et al., 2016; Romans et al., 2016; Zhang et al., 2018).
Due to their unique structural and geological evolutionary characteristics, paleo-uplifts are critical regions for hydrocarbon generation, migration, and accumulation, making them a focal point in oil and gas exploration (Yang and Xu, 2004). Furthermore, research related to source-to-sink systems associated with paleo-uplifts is crucial for elucidating the evolution of sedimentary systems, predicting reservoir distribution, and understanding the process of hydrocarbon accumulation. This research not only enhances the success rate of hydrocarbon exploration but also has profound implications for the efficient development and utilization of resources (Liu et al., 2019; Zeng et al., 2019).
Therefore, numerous geologists have approached the S2S systems from multiple perspectives. Nyberg et al. (2018) introduced the Global Terrestrial Sink Catchment (GTSC) database, highlighting how tectonic regimes influence sediment discharge characteristics and the pivotal role of terrestrial sinks in modulating sediment signals before their preservation in marine sedimentary records (Nyberg et al., 2018). Zhang et al. (2018) utilized the BQART model to perform Monte Carlo simulations, modeling the empirical relationship between river catchment paleogeography, climate, and sediment supply (Zhang et al., 2018). Zeng et al. (2019) and Liu et al. (2020) conducted a detailed dissection of S2S systems in continental lacustrine basins, establishing corresponding sand body dispersion models and performing reservoir prediction (Zeng et al., 2019; Liu et al., 2020). Brewer et al. (2020) evaluated three sediment flux estimation methods: the BQART model, geomorphological scaling, and the “fulcrum” model, highlighting their respective accuracy, sensitivity to inputs, and suitability under conditions of data uncertainty (Brewer et al., 2020). Webb et al. (2021) demonstrated a complex sedimentary provenance for the Plio-Pleistocene Nicobar Fan through the application of Raman spectroscopy to heavy minerals (Webb et al., 2021). Wang et al. (2021) and Wang et al. (2022) examined the provenance evolution history of the Qinling Mountains and the Tibetan Plateau using river profile analysis methods (Wang et al., 2021; Wang et al., 2022). Li et al. (2023) and Saha et al. (2023) separately investigated the provenance heterogeneity of source-to-sink (S2S) systems in the mountainous rivers of southeastern China and the Padma River in Bangladesh through detailed geochemical analyses (Li et al., 2023; Saha et al., 2023). Although significant progress has recently been achieved in establishing nonlinear correlations through the analysis of key parameters, limited studies have quantitatively examined the coupling degree among sediment supply, transport, and sink subsystems within source-to-sink (S2S) systems.
In other words, these efforts often fall short of capturing the intricate coupling mechanisms and multifaceted complexity of S2S systems, leading to potential gaps in understanding and inaccuracies in model establishments (Syvitski and Milliman, 2007; Sømme et al., 2011; Sømme et al., 2013; Liu et al., 2019; Zeng et al., 2019). Thus, it is essential to quantitatively characterize the coupling degree among sub-S2S systems, which is critical for understanding the S2S coupling process, improving S2S models, and prioritizing exploration potential. Moreover, a more suitable index is required to better assess the coupling degree within S2S systems.
The S2S system is a well-known complex geological system composed of multiple subsystems, each containing a substantial amount of nonlinear and non-stationary geological information (Allen, 2005; Allen, 2008; Helland-Hansen et al., 2016). Therefore, traditional statistical methods and correlation analyses are insufficient for accurately characterizing the coupling mechanisms of S2S systems. Coupling values, however, provide the most effective and suitable index for measuring the degree of S2S coupling.
To address the research gap, this study proposes a quantitative coupling degree model for S2S systems based on entropy weight-coupling theory (EW-CT). EW-CT is capable of estimating the coupling degree among multiple geological systems characterized by non-linearity and non-stationarity. In this study, we applied EW-CT to the S2S systems of the Shahejie Formation in the Chengbei Low Uplift (CBLU). The primary contributions of this research are as follows:
1. This study is among the first to apply coupling theory to quantify the coupling degree within S2S systems.
2. The proposed model accounts for the complex interactions among multiple sub-S2S systems, providing quantitative results for coupling degree analysis.
3. A relationship between EW-CT values and exploration potential is established, offering an effective tool for coupling degree and exploration potential analysis, and serving as a reference for ranking hydrocarbon exploration prospects across diverse geological settings.
2 Geologic setting
The OBBB is a Cenozoic, multicyclic sedimentary basin characterized by complex tectonic movements. It is situated in the eastern region of the North China Craton and encompasses an area of approximately 20,000 km2 (Lin et al., 2005; Qi and Yang, 2010; Feng et al., 2016) (Figure 2A). The southern part of the OBBB primarily consists of Mesozoic volcanic debris. The tectonic activity of the OBBB is largely influenced by the subduction of the Pacific Plate beneath the eastern margin of Asia (Watson et al., 1987; Allen et al., 1997; Ren et al., 2002; Zhao and Zheng, 2005). This subduction, along with far-field effects between plates, contributed to the multi-episode rifting stages of the OBBB (Allen et al., 1997; Qi and Yang, 2010; Feng et al., 2013). There are typically four episodes in the synrift stage of the OBBB: (1) Rifting Episode 1 occurred from 65 to 42 Ma, covering the Kongdian Formation to Member 4 of the Shahejie Formation; (2) a more intense Rifting Episode 2 began at 42 Ma and lasted until 38 Ma (Member 3 of the Shahejie Formation); (3) a weakened Rifting Episode 3 spanned from 38 to 32.8 Ma (Members 1 and 2 of the Shahejie Formation); and (4) a strengthened Rifting Episode 4 persisted from 32.8 to 24 Ma (Dongying Formation) (Yang and Xu, 2004; Jiang et al., 2013).
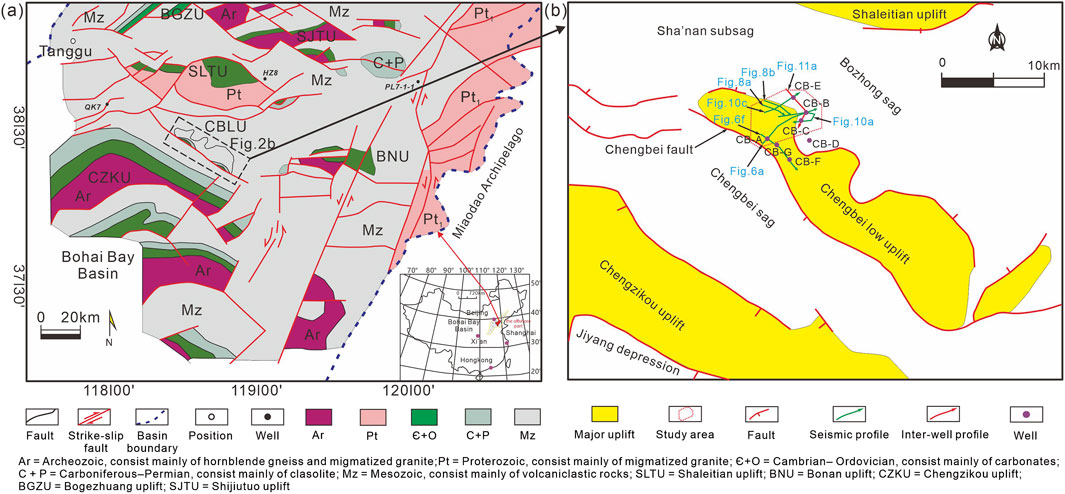
Figure 2. Structural units of OBBB showing the location of the CBLU. (A) Basement map of OBBB showing structural and lithological characteristics (modified from Yang and Xu, 2004; Xu, 2007) and (B) studied wells and inter-well seismic profiles analyzed in this study (modified from Li et al., 2021).
The Chengbei Low Uplift (CBLU) is a well-exposed intrabasin situated in the western part of the OBBB, encompassing a total area of 1,978 km2 (Figure 2B) (Jiang et al., 2011). The Bozhong, Chengbei, and Shanan sags formed around the CBLU and were part of the S2S systems during the Eocene (Guo et al., 2021). Acting as a significant sediment-supply area, the northern part of the CBLU consists of multiple hierarchical sub-units that provide detrital material to neighboring hydrocarbon-bearing sags, establishing a typical S2S system. The study area, located in the central CBLU, covers approximately 492 km2. The southern part of the CBLU is influenced by the NW-SE-oriented Chengbei fault system (Liu et al., 2022) (Figure 2B).
In the study area, the Eocene Shahejie Formation functions as a hydrocarbon-bearing system, with its primary oil-producing layer consisting of sandy reservoirs (Guo et al., 2021). The upper section of the Shahejie Formation (Es3U) represents one of the most promising reservoirs for hydrocarbon exploration and development, serving as the primary focus of this paper (Jia et al., 2019; Liu et al., 2019; Li et al., 2021). During the multi episodic synrift stage (Figure 3), Es3U persisted through the later tectonic Episode 2, resulting in cyclic movements of the basin. Due to the multicyclic sedimentation of sandstone and mudstone, Es3U typically consists of several fan deltas and braided deltas, composed of pebbly or fine-grained sandstones, grey mudstones, and shallow to deep lacustrine mudstones (Jia et al., 2019; Guo et al., 2021) (Figure 3). As the CBLU was an integrated S2S system during the Es3U stage, numerous braided deltas formed near the uplift margin, arising from the topographic differences within the CBLU’s catchment. These braided deltas contributed to the formation of the S2S systems in the small-scale, lacustrine basin. Overall, the CBLU provides an ideal natural laboratory for exploring the coupling relationships among the sediment-supply, sediment-transport, and sediment-sink subsystems within the integrated S2S system.

Figure 3. The comprehensive stratigraphic column of OBBB containing depositional systems, tectonic subsidence, lake level fluctuation, and climate changes (modified from Lin et al., 2005; Jia et al., 2019).
3 Database and method
3.1 Database
The primary data consists of drilling and seismic volumes The seismic data is derived from a time-migrated 3D seismic cube, with a bin spacing of 25 × 12.5 m and a two-way travel time trace length of 5 s. The 3D seismic volume covers the entire CBLU area, approximately 2,000 km2 (Figure 2B). The seismic data has a dominant frequency of 25 Hz, ranging from 10 to 50 Hz. A strong well-to-seismic correlation was established using a synthetic seismogram from five study wells. Of these, three wells (CB-A, CB-F, and CB-G), situated in the uplift area, were drilled into the Mesozoic strata, while the other wells, located in the sediment-sink area, were drilled into the E3U target layer. Wells CB-B and CB-C were successfully drilled to access the reservoir and were cored for comprehensively analyzing the depositional system and reservoir properties. The seismic volume, well data, and experimental data were acquired from the Tianjin Branch of the China National Offshore Oil Corporation. Porosity was measured using an UltraPoro-300, and permeability was measured using an UltraPerm-400, in accordance with the Chinese national standard GB/T 29172-2012. The 3D seismic data was interpreted and analyzed using Geoframe 2012, while Petrel 2018 was employed to produce the geomorphological map.
3.2 Methods
This section begins with an overview of the methods used for the identification and characterization of S2S systems (Section 3.2.1). Next, the coupling relationships within the S2S systems are established and demonstrated (Section 3.2.2.1). Following that, the theoretical foundations of entropy weight (EW) and coupling theory (CT) are reviewed (Sections 3.2.2.2 and 3.2.2.3). Finally, the concepts, calculation procedures, and analysis standards of the EW-CT model are presented in Section 3.2.2.4 and illustrated in Figures 4, 5.
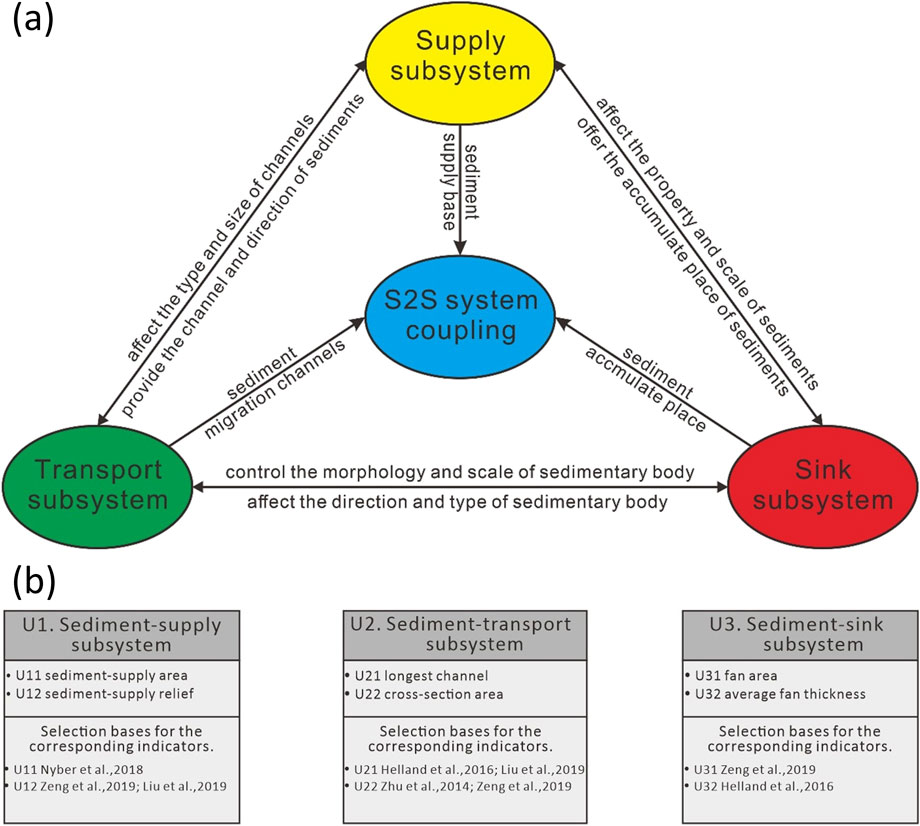
Figure 4. (A) Structures and relationships of S2S system. (B) S2S Multi-hierarchy indicator systems and the corresponding selection bases.
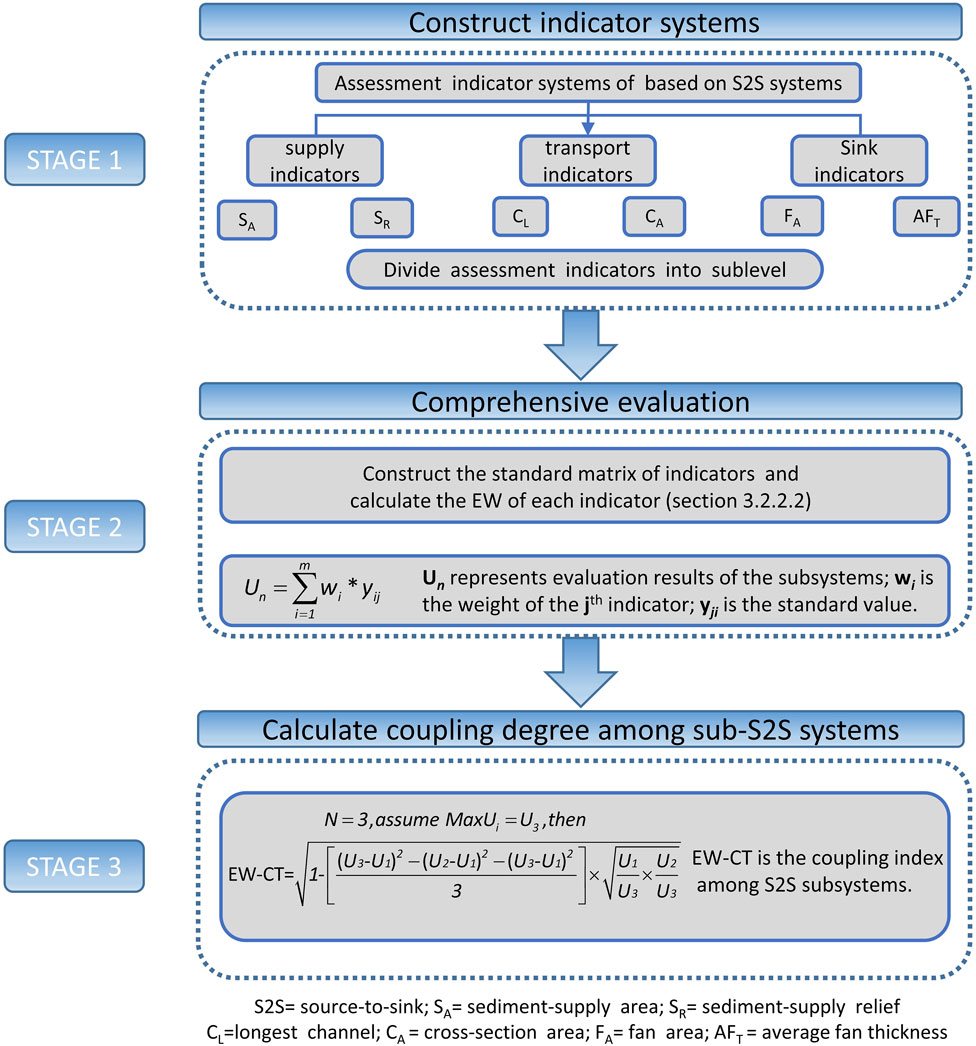
Figure 5. Schematic flowchart of the proposed EW-CT model for S2S systems.
3.2.1 Identification and characterization of S2S systems
The analytical methods for S2S systems in this study include: (1) microscopic observation of casting thin sections to identify the lithological characteristics of the bedrock and their corresponding responses in the sink area, integrated with well-to-seismic a comprehensive analysis to characterize the planar distribution of bedrock; (2) demarcation of multi-hierarchy sediment-supply units and spatiotemporal analysis of sediment transport based on seismic data; (3) comprehensive analysis of well-based data (e.g., lithologies, logging morphology, and petrography), seismic facies, and seismic waveform inversion to interpret the depositional environment; and (4) quantification of the coupling degree of the S2S systems using the EW-CT model. The specific details of the proposed EW-CT model are elaborated in the following section.
3.2.2 Entropy weight-coupling theory (EW-CT)
3.2.2.1 The coupling relationships among the sediment-supply subsystem, sediment-transport subsystem, and sediment-sink subsystem
The S2S system is a complex geological system comprising multiple subsystems, characterized by nonlinearity, systematicity, and uncertainty. These subsystems include sediment-supply, sediment-transport, and sediment-sink subsystems (Allen, 2008; Sømme et al., 2009a; Sømme et al., 2009b). Within a geological framework (Figure 4A), these subsystems exhibit intricate interrelationships, interacting and constraining each other, which significantly influences sandbody distribution and hydrocarbon exploration (Romans et al., 2016; Walsh et al., 2016). Therefore, a deeper understanding of the complex coupling relationships among sub-S2S systems is essential for advancing future reservoir prediction and hydrocarbon exploration efforts (Liu et al., 2019; Zeng et al., 2019; Li et al., 2020).
The sediment-supply subsystem provides the clastic material foundation for the S2S system. The size and relief of the supply area characterize the scale and driving mechanisms of the sediment-supply subsystem, respectively (Nyberg and et al., 2018; Liu et al., 2019; Zeng et al., 2019). Through the statistics analysis of these indicators, an indicator framework for the sediment-supply subsystem was developed.
The sediment-transport subsystem acts as a bridge between the sediment-supply and sediment-sink subsystems. The longest transport path is the most direct indicator of transport capacity. Additionally, we attempted to measure depositional fluxes within the transport subsystem using the cross-sectional area of the transport channels (Zhu et al., 2014; Helland-Hansen et al., 2016; Liu et al., 2019; Zeng et al., 2019). Based on these indicators, the sediment-transport subsystem framework was constructed.
The sediment-sink subsystem provides the deposition place for sediment material, determining the planar distribution and thickness of the sandbody (Helland-Hansen et al., 2016; Zeng et al., 2019). These indicators are directly related to hydrocarbon exploration and development. Thus, we characterized the sediment-sink subsystem using the maximum area and average thickness of the sandbody.
In conclusion, the S2S system is an integrated and complex geological framework composed of multiple interacting subsystems. Therefore, it is essential to systematically and quantitatively analyze the interactions among these subsystems, establish S2S coupling models, and characterize the coupling degree to guide future hydrocarbon exploration. Based on entropy weight and coupling theory, this study proposes the EW-CT model, constructs S2S indicator systems, and analyzes the relationships among the subsystems.
3.2.2.2 Indicator system construction
The coupling of the sediment-supply, sediment-transport, and sediment-sink subsystems in the CBLU is a complex system rich in geological information (Figure 4A). The selection of subsystem indicators is crucial for characterizing these subsystems from multiple dimensions and perspectives.
When considering the coupling relationships between supply, transport, and sink, and adhering to the principles of scientificity, comparability, and data availability, specific indicators were chosen (Weng et al., 2022). For the sediment-supply subsystem, the supply capacity and scale are characterized by source relief and area, respectively. The sediment-transport subsystem is assessed using cross-sectional area and the longest pathway. For the sediment-sink subsystem, indicators reflecting accommodation were selected, including the area and thickness of the fan body. Thus, the multi-hierarchy indicator system for the CBLU S2S system is constructed (Table 1), with the corresponding selection criteria presented in Figure 4B.
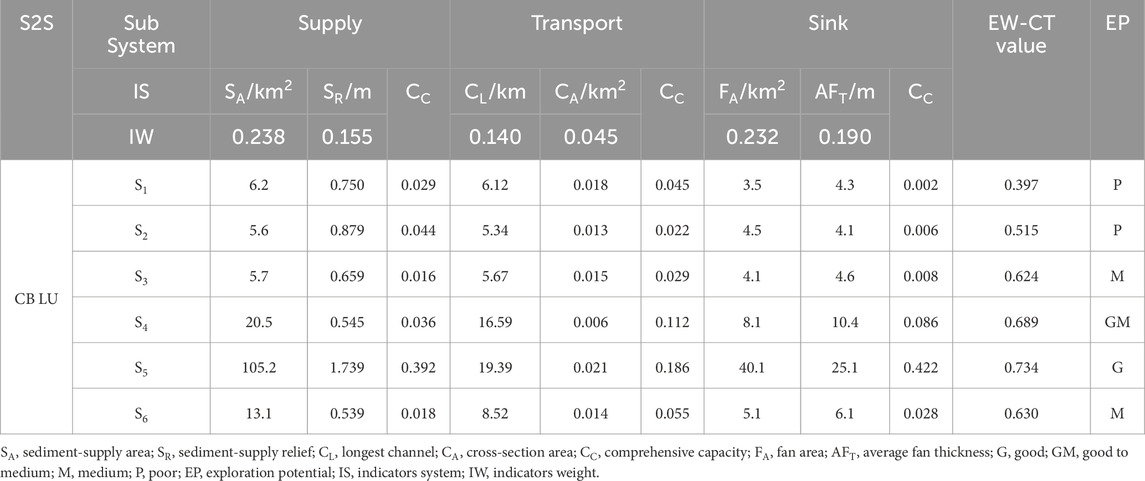
Table 1. Key parameters of the CBLU S2S systems and the corresponding exploration potential rank.
3.2.2.3 Comprehensive evaluation
Entropy, originally a thermodynamic concept, was extended to the information field by Shannon in 1948, providing a powerful tool for analyzing system order (Shannon, 1948). Based on the definition of information entropy, the Entropy Weight (EW) method assigns weights by analyzing the amount of useful information each indicator contains (i.e., the larger the entropy value, the more unreliable the information, thus carrying less useful content and resulting in a smaller weight; vice versa) (Khan and Bhuiyan, 2014; Yan et al., 2014). Compared to subjective weighting methods, the EW method is characterized by objectivity, comparability, and data availability. The construction of indicator weights involves three key steps:
1) Construct the indicator matrix:
Here, A is the offset value ensuring
2) Calculate the entropy value
Calculate the entropy value ej of the jth indicator: Utilizing Equations 2, 3 to compute the entropy value ej and Equation 4 for the entropy redundancy
3) Determine the EW of each indicator: Apply Equation 5 to compute the weight.
Finally, the comprehensive evaluation for each S2S subsystem is obtained through Equation 6.
Where, Wj is the EW of the jth indicator; Yij is the standard value. The results of the EW calculations and the comprehensive evaluations are presented in Table 1.
3.2.2.4 Coupling degree model
Thus far, many physical concepts such as entropy, power, and frequency have been introduced across various disciplines. Coupling theory, in particular, is used to describe the interaction relationships between multiple systems (Haken, 1983; Shiklomanov, 2000). The coupling indicator can quantitatively characterize the coupling mechanisms between complex systems, making it widely applicable in fields such as social research (Liu et al., 2007), economic research, environmental research (Snelder and Biggs, 2002), and geological research (Marconi, 2012). In this study, the coupling degree among the supply, transportation, and sink subsystems is acquired using Equation 7, where n represents the number of subsystems in the S2S systems. Here, n = 3.
The EW-CT values is the coupling index, representing the degree of coupling within the S2S systems. U1, U2, and U3 correspond to the comprehensive evaluation results of the sediment-supply subsystem, sediment-transport subsystem, and sediment-sink subsystem, respectively.
As outlined above, to achieve accurate coupling analysis within these subsystems, the EW-CT model is proposed, consisting of three main components: 1) Establish the indicator system. 2) Obtain the comprehensive evaluation results for each S2S subsystem. 3) Calculate the coupling indicator of each S2S system (Figure 5).
In summary, the proposed model takes into full consideration the complexity of geological frameworks and ensures the objectivity of the datasets. Furthermore, by combining coupling theory with S2S analysis (Haken, 1983), an analysis standard for the coupling degree of S2S systems has been developed. The larger the EW-CT values, the stronger the coupling degree among the sediment-supply, sediment-transport, and sediment-sink subsystems, which indicates a better exploration potential for the S2S system.
4 Results
4.1 Sediment-supply subsystem analysis
4.1.1 Bedrock properties, and distribution characteristics
The lithological and distributional characteristics of the sediment-supply area are comprehensively determined through well-to-seismic correlation analysis and microscopic observation of sidewall cores (Figure 6). The results indicate that the bedrock of the CBLU is primarily composed of volcanic clastic rocks containing tuffaceous debris.
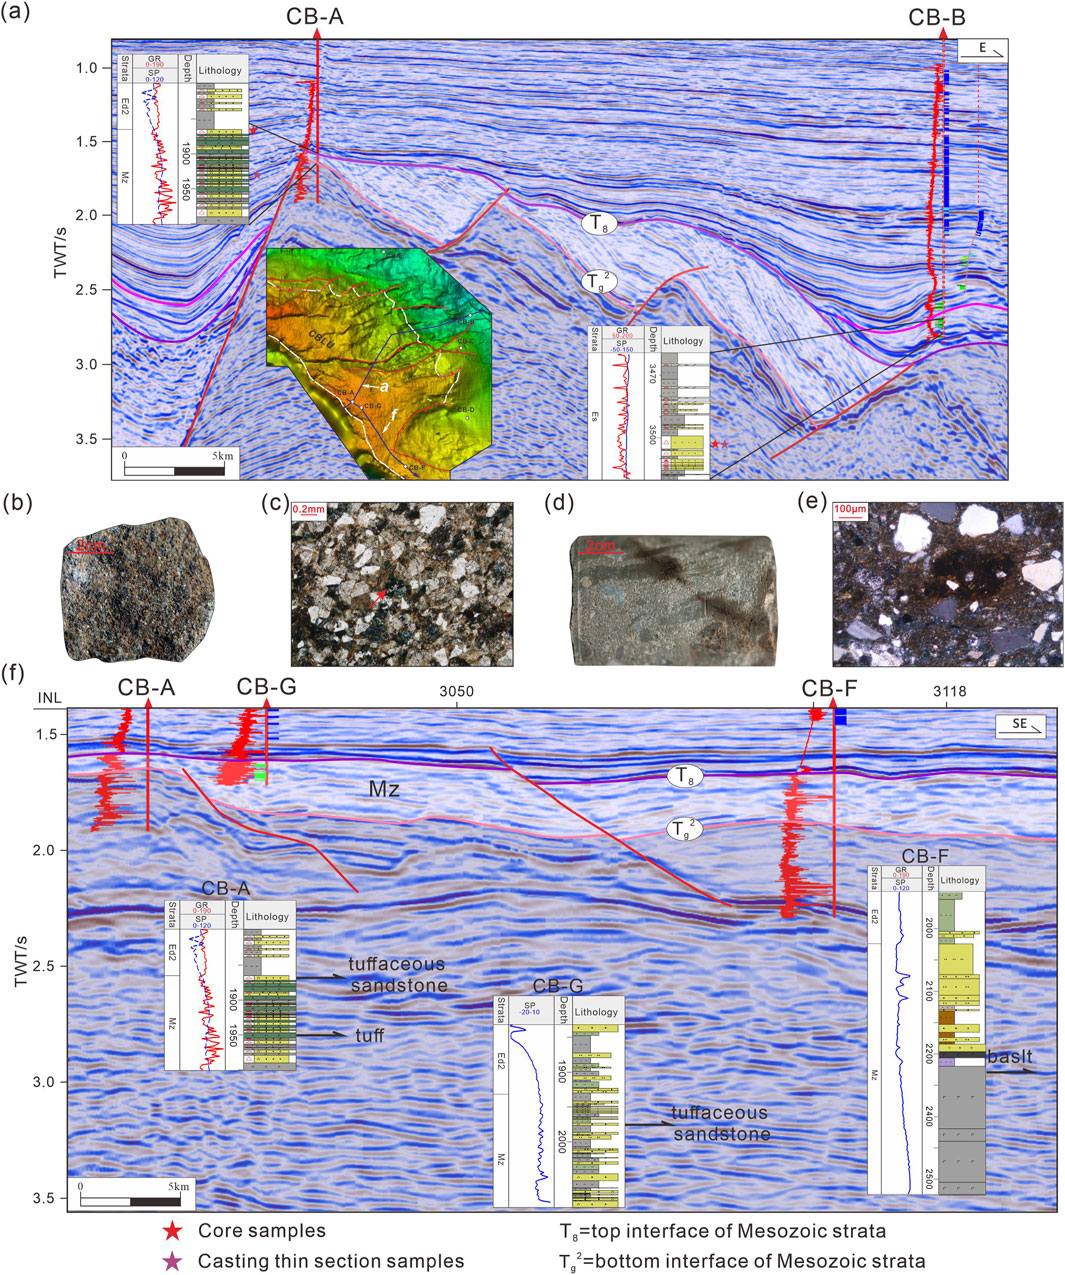
Figure 6. (A, F) are two mutually perpendicular inter-well profiles indicating seismic-reflection characteristics of pre-Paleogene bedrocks on the CBLU, OBBB. Sidewall core photos and casting section observations: (B) tuffaceous middle sandstone, well CB-A, 1865.5 m; (C) intergranular pores extensively filled with tuff, well CB-A, 1946 m; (D) fine sandstone, well CB-B, 3,353.75 m (E) intergranular pores extensively filled with tuff and chlorite, well CB-B, 3,353.75 m. See the profile location in Figure 2.
The detrital material supply in the sediment-supply area largely depends on the erosion of Mesozoic tuffaceous clastic rocks within the CBLU (Liu et al., 2016a; Liu et al., 2016b) (Figure 2A). As illustrated in Figures 6B, C, tuffaceous debris extensively fills the pores at a depth of 1946 m in well CB-A. Additionally, sandstone in the sediment-sink area reflects the bedrock characteristics of the sediment-supply area (Wandres et al., 2004) (Figures 6D, E). Microscopic observations of well CB-B’s braided delta sandstone in the studied layer further demonstrate significant amounts of tuffaceous debris.
In addition to well-based analysis, we performed well-to-seismic comparative analysis. Two mutually perpendicular seismic profiles passing through well CB-A were selected (Figure 2B). These profiles reveal that the seismic response of the Mesozoic stratum exhibits good stratification with medium-to-low frequency and weak continuity (Figures 6A, F). Based on this analysis, we have identified that detrital material in the sediment-sink area is derived from Mesozoic tuffaceous volcanic debris from the CBLU.
4.1.2 Multi-hierarchy sediment-supply unit demarcation
Structural uplift and denudation in the provenance area enabled the transportation of this detrital material to the sediment-sink area via sediment-transport channels (Zhu et al., 2014). By identifying ridge-lines and sub-drainage lines (Zeng et al., 2019), the study area was successfully divided into two first-level units and six second-level units. With this precise demarcation of the sediment-supply area, we can better understand the relationship between the sediment-supply area and the corresponding sediment-sink area.
1st and 2nd -level sediment-supply units. Based on denudation and tectonic activity, watersheds (i.e., a series of highest points) were identified, and the 1st-level sediment-supply unit was delineated using a yellow dashed line (Figure 7A). The southern 1st-level sediment-supply unit (P) primarily supplied detrital material to the steep slope zone, while the northern 1st-level unit, composed of Mesozoic volcaniclastic rocks, provided sediment to the gentle slope zone, covering an area of approximately 452 km2. The northern 1st-level unit was further subdivided into four 2nd-level sediment-supply units along a NE-trending axis, marked by a black dotted line (Q/R/S/T).
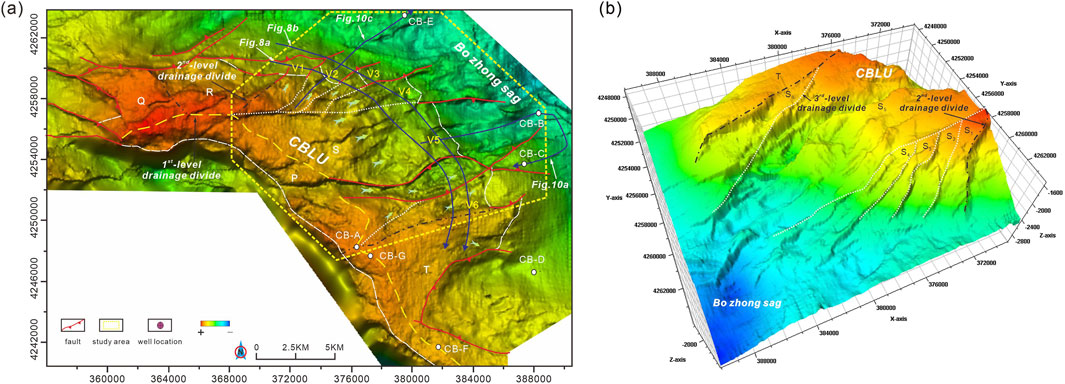
Figure 7. Planar and 3-D display of paleogeomorphology, showing (A) paleogeomorphic characteristics and (B) sediment-supply unit demarcation in Es3U, CBLU, OBBB.
3rd-level sediment-supply units. In the 2nd-level sediment-supply unit, sub-drainage lines were identified based on slope and altitude changes, allowing for further division using a white dashed line (Figure 7B). The study area is mainly located within unit S, which was subdivided into six third-level units: S1, S2, S3, S4, S5, and S6. Table 1 provides the specific parameters related to the S units.
4.2 Sediment-transport subsystem analysis
Based on paleogeomorphic restoration and sediment-supply unit demarcation, a NW-SE trending seismic profile perpendicular to the sediment migration direction was selected to analyze the type and scale of sediment-transport channels. Two channel types were identified in the study area: incised-valleys and fault troughs (Figure 8). To quantitatively evaluate the sediment-transport capacity of these channels, we introduced two indicators: the longest channel (CL) and the cross-sectional area (CA = 0.5* width* depth).

Figure 8. (A, B) are two parallel seismic profiles of sediment-transport channels showing the typical filling seismic reflection.
In the northern part of the CBLU, due to the tectonic uplift, weathering, and denudation, third-level units S1, S2, and S3 developed a series of single fault troughs (V1), and channels (V2 and V3) (Figure 8). The CL (6.12 km) and CA (0.018 km2) of V1 are larger than those of V2 and V3 (Table 1), indicating V1 has a higher transport capacity. In contrast, the central part of the CBLU, represented by third-level units S4, S5, and S6, developed a series of fault-trough channels (V4, V5, and V6) related to the NE-SW trending fracture system (Figure 8). Among these, V4 and V6, controlled by same-direction faults, exhibited smaller parameters and weaker transport capacity. However, V5, a confined channel formed by opposing faults, displayed large-scale sediment migration capacity. V5’s CL and CA are the largest, indicating the highest transport capacity.
4.3 Sediment-sink subsystem analysis
Controlled by tectonic movement and fault activity, various types and morphology of sedimentary systems developed in the sediment-sink area (Nottvedt et al., 1995; Lin, 2006). Based on fault activity characteristics, catchment system distribution, and the configuration of transport channels, the sediment-sink area was subdivided into four units (A∼D) (Figure 9). Units A to C were the focus of our current research. Two typical seismic profiles were selected to illustrate the scale and distribution characteristics of sand bodies (Figure 10). Additionally, using a combination of 3D seismic data and well-based analysis, the thickness and area parameters of the sand bodies were determined.
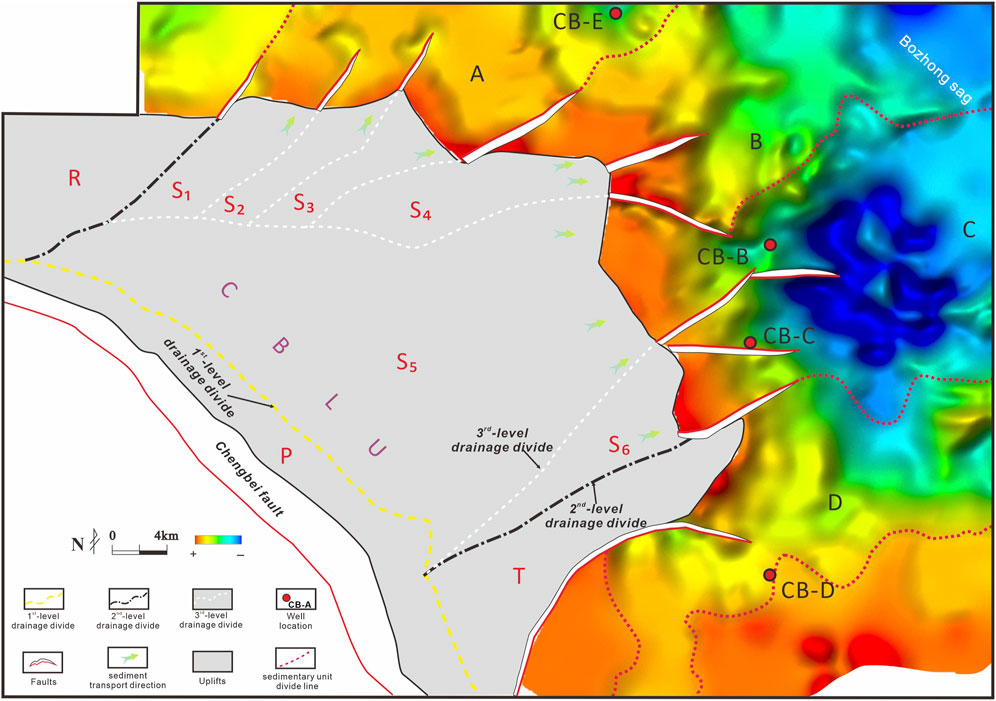
Figure 9. The paleogeomorphic map of sediment-sink areas showing the relationships between sediment-supply units and sediment-sink units.
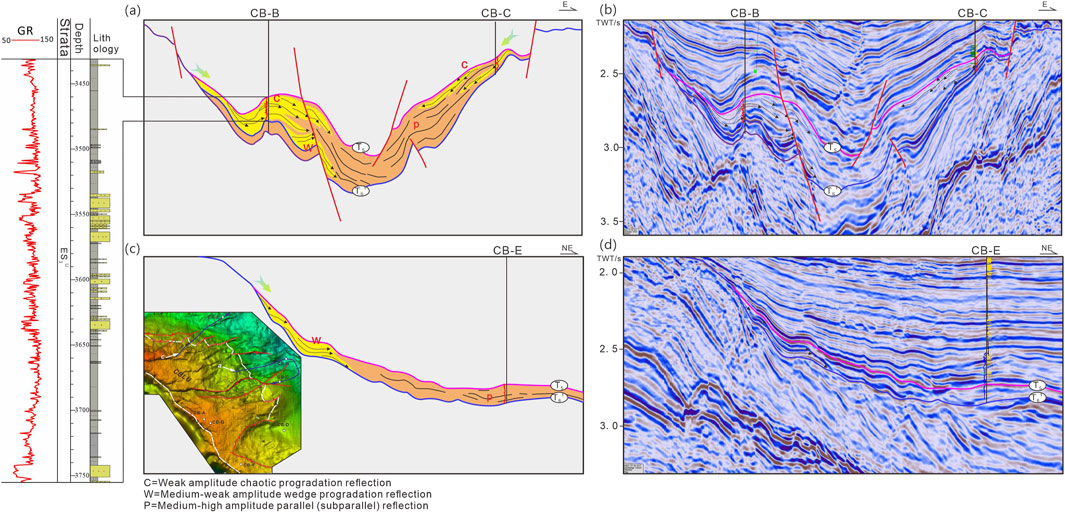
Figure 10. (A, C) located in sedimentary units (A, C), respectively) Seismic facies analysis of braided-delta depositional systems in target layer, CBLU, OBBB (B, D) Sedimentary facies analysis of braided-delta depositional systems. T61 = bottom interface of Es3U, T5 = top interface of Es3U. The location of these seismic profiles is illustrated in Figure 7A.
4.3.1 Seismic facies analysis
During the Es3U stage, which corresponded to the late phase of rift tectonic activity, the overall sedimentation rate was relatively low. Unit C, in particular, exhibited a larger accommodation space and greater stratigraphic thickness. On the seismic profiles (Figures 10A, B), clear large-scale wedge-shaped chaotic progradation reflection characteristics are visible. In the distal part, the seismic response transitions to a low to medium amplitude, with relatively continuous parallel reflections. In northern sedimentary units, smaller-scale fan deltas are primarily developed, reflected in the small-scale wedge-shaped characteristics in the seismic profiles (Figures 10C, D). These features are attributed to a weaker sediment-supply capacity or reduced accommodation.
4.3.2 Well-based sedimentological analysis
Furthermore, the lithofacies and sedimentary facies characteristics of different S2S systems were systematically analyzed through a detailed characterization of lithology, sidewall cores, rock types, thin sections, as well as porosity and permeability.
4.3.2.1 Lithologies and cores analysis
Three wells selected from the corresponding S2S systems are presented in Figure 11A. In Unit A, well CB-E exhibits extremely high mud content, which may reflect the insufficient debris supply capacity of the S3 system. The sidewall cores from well CB-B in Unit C reveal grey conglomeratic coarse sandstone with sandy pebbles and multiple sedimentary cycles. Meanwhile, the sidewall cores from well CB-C in Unit C indicate an interbedded structure comprising conglomeratic sandstone, sandstone, siltstone, and mudstone.
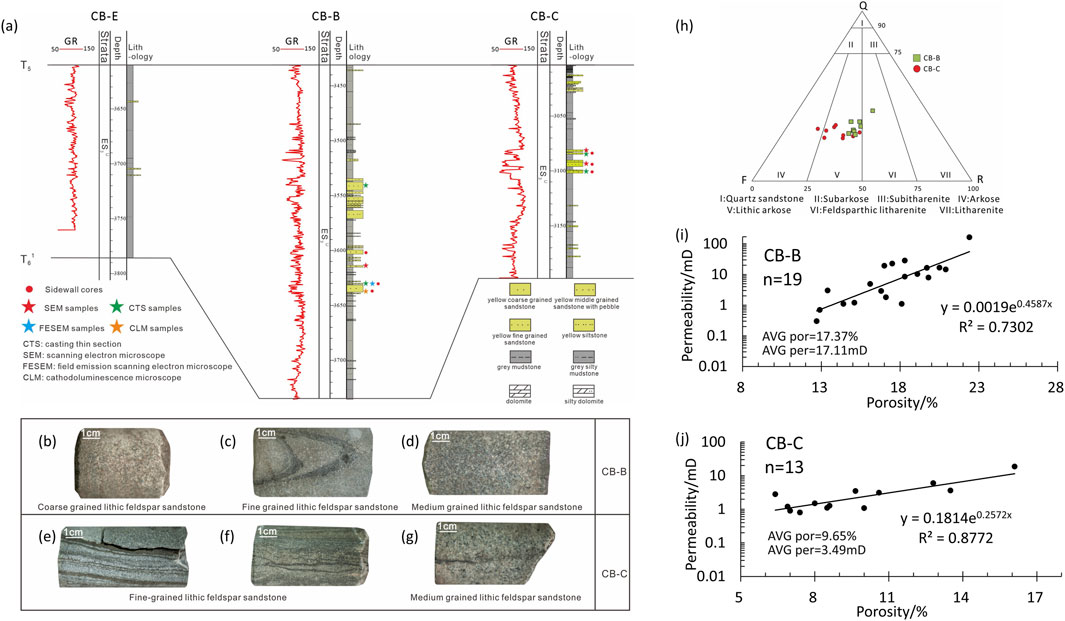
Figure 11. (A) Stratigraphic inter-wells section shows the lithologies and GR logging characteristics of the study layer in the Bozhong Sag. The profile position is shown as in Figure 2B. Lithological features of the study layer of the well CB-B and CB-C (B–G). (B–D) are sidewall cores of grey conglomeratic coarse sandstone with sandy pebble (2∼4 mm), representing braided delta front distributary channel deposits in unit C, 3,603.0 m (B), 3,630.0 m (C), 3,637.0 m (D), well CB-B; (E–G) are sidewall cores of grey fine sandstone/siltstone with cross bedding, wavy/lenticular bedding, mud clast, fracture surface and deformable structure, representing delta front deposition, 3,084.5 m (E), 3,094.0 m (F), 3,101.0 m (G), well CB-C. The positions of sidewall cores are shown in Figure 11A. (H) Is sandstone classification figure of the study layer from the well CB-B and well CB-C. (I, J) depict the correlation relationships between porosity and permeability for the corresponding wells, respectively.
4.3.2.2 Rock types analysis
Based on the Folk’s sandstone classification map, we can effectively identify rock type characteristics and gain a macroscopic understanding of the sedimentary features in the study area (Folk, 1974). The analysis results indicate that samples from various sedimentary units exhibit distinct lithological characteristics (Figures 11B–H). Well CB-E represents a typical mudstone feature, while samples from well CB-B and well CB-C display characteristics of sandy reservoirs. The 8 samples from well CB-B consist of lithic arkose and feldspathic litharenite, whereas the 9 samples from well CB-C are primarily composed of arkose and feldspar arkose.
4.3.2.3 Porosity and permeability characteristics analysis
The porosity and permeability data were obtained from casting thin section analysis and experimental methods, respectively. Based on this analysis, we established a porosity-permeability correlation map for the sediment-sink area (Figures 11I, J). Samples from well CB-B exhibit better average values of porosity (17.37%) and permeability (17.11 mD), while samples from well CB-C display lower average values of porosity (9.65%) and permeability (3.49 mD).
4.3.2.4 Thin sections characteristics analysis
In addition to macroscopic lithofacies analysis, microscopic observations further examine reservoir characteristics influenced by the S2S systems (Li et al., 2019; Liu et al., 2019; Zeng et al., 2019). As shown in Figures 12A–D, the CTS and SEM/FESEM images reveal primary pores (PP) and secondary pores (SP) formed by the dissolution of feldspar (F). The CLM image of well CB-B (Figure12E) indicates relatively weak calcite cementation. Well CB-B displays medium sorting and sub-angular grains composed of quartz (Q), feldspar (F), and rock fragments (R). The SEM images from well CB-C (Figures 12F, H) show a limited number of PPs formed by feldspar dissolution. The CTS images of well CB-C illustrate poor to medium sorting and sub-rounded grains with point-line contacts (Figures 12G, I).
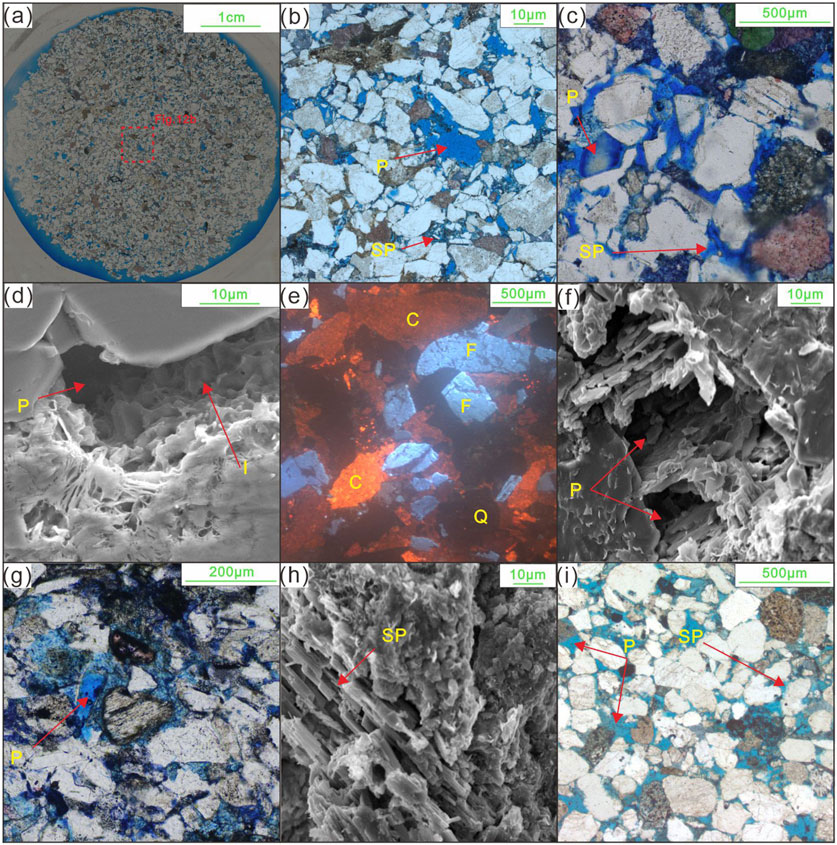
Figure 12. Typical CTS, FESEM or SEM photos, and CLM images showing petrographic and pore features of the sandstones in study layers. (A) CTS panoramic photo, well CB-B, 3540 m. (B) Intergranular pores and intragranular pores, well CB-B, 3540 m. (C) Intergranular pores and intragranular pores, well CB-B, 3630 m. (D) PP filled with (I), well CB-B, 3630 m. (E) CLM photo displays blue-purple Q and bright blue F, and C with bright orange, well CB-B, 3637 m. (F) F dissolution pores filled with authigenic Q and I, well CB-C, 3082 m. (G) Intergranular pore, well CB-C, 3,084.5 m. (H) F dissolution pores filled with k and I, well CB-C, 3094 m. (I) Intergranular pores and intragranular pores, well CB-C, 3101 m. CTS: casting thin section; SEM: scanning electron microscope; FESEM: field emission scanning electron microscope; CLM, cathodoluminescence microscope; Q, quartz; F, feldspar; C, calcite; K, kaolinite; I, illite.
4.3.3 Spatiotemporal characteristics analysis of sedimentary facies
In addition to the previously discussed seismic and well-based characteristic analyses, seismic waveform inversion analysis further elucidates the dispersion of sediments, thereby effectively mitigating the limitations imposed by the restricted number of drilling wells (Chen et al., 2020). This methodology aims to establish the correlation between seismic waveform structures and high-frequency logging curves through the efficient dynamic clustering of seismic waveforms. It enhances both the vertical and horizontal resolution of the inversion results. Furthermore, it facilitates true phase-controlled inversion by constructing a Bayesian inversion framework applicable to various seismic phase types.
As illustrated in the seismic waveform inversion diagram (Figure 13A), Bayesian discrimination clearly identifies three phases based on the correlations between seismic waveforms and sandstone content: sand-prone phases (red-yellow), transitional phases (green-bright blue), and mud-prone phases (dark blue). The diagram shows a clear trend of changing from sandstones to mudstones from the CBLU to the sedimentary center, reflecting the overall sediment routing process.
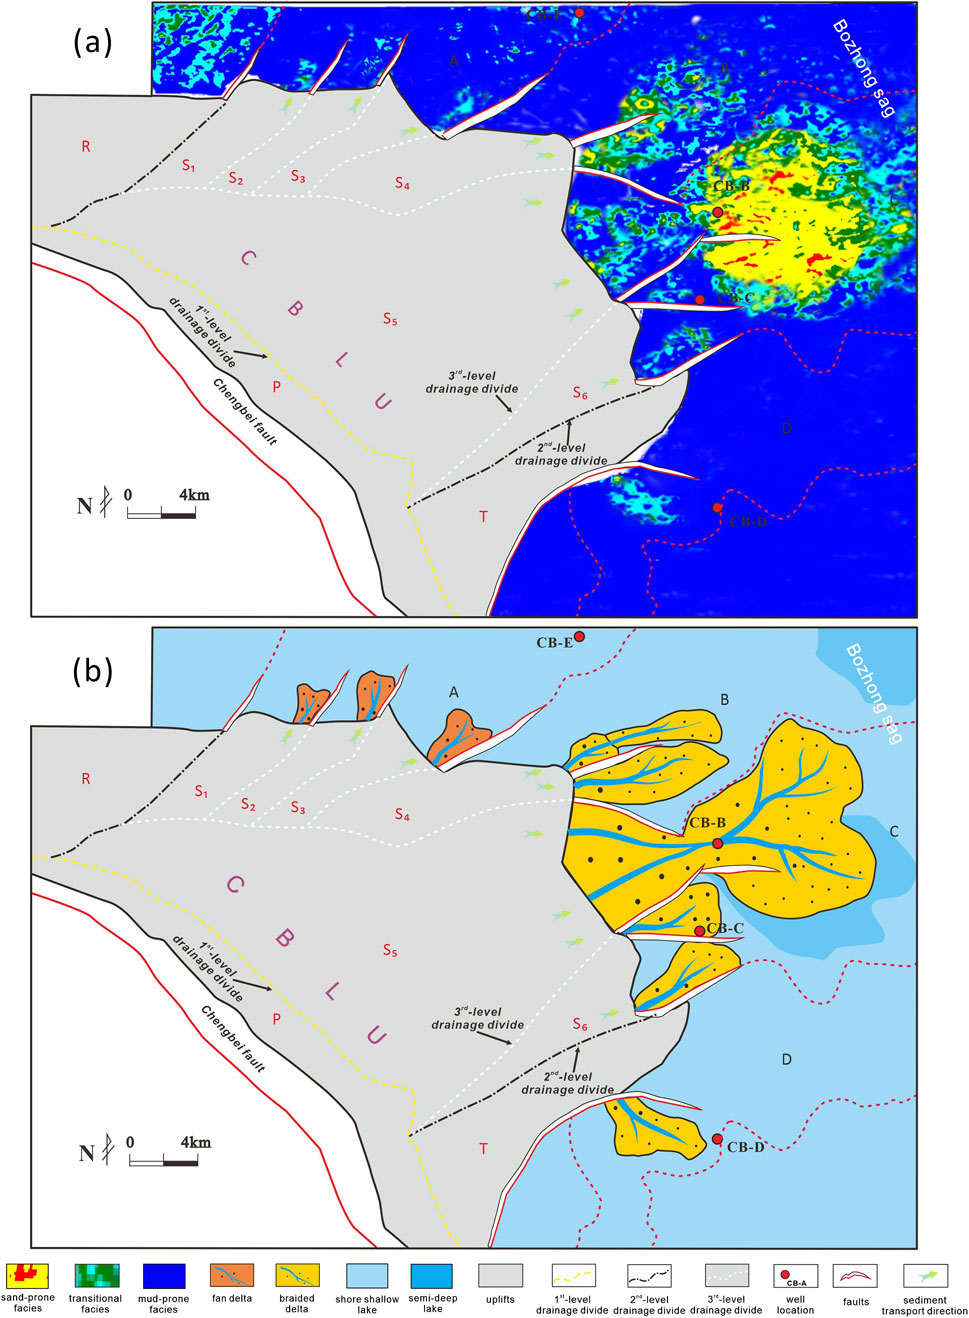
Figure 13. (A) The seismic waveform inversion diagram and (B) the corresponding sediment-dispersion characteristics of braided deltas S2S systems.
The rich sand facies located to the east of the central CBLU (S5) exhibits a narrow belt shape, aligned with the transport pathway direction. The dispersion of sedimentary facies is significantly influenced by the paleogeomorphic pattern, resulting in a dumbbell-shaped planar distribution. In contrast, smaller-scale deltas developed near the CBLU (S1/S2/S3/S4/S6) display characteristics of rich sand and transitional facies.
4.4 Interpretation
4.4.1 Sedimentary facies interpretation
Using comprehensive well-to-seismic calibration, seismic waveform inversion analysis, well-based sedimentology analysis, and sidewall core analysis, four sedimentary facies were identified: braided delta facies, fan delta facies, shore-shallow facies, and semi-deep lacustrine facies (Figure 13B).
In the gentle slope belt of S5, seismic analysis (Figures 10A, B) and well-based analysis (Figures 11, 12) at well CB-B reveal that the SMI anomalies (red and yellow) correspond to braided deltas with relatively long-distance sediment transport. The sandbody in well CB-B exhibits better physical properties and greater thickness, indicative of braided-delta channel facies. In contrast, the SMI anomalies (shallow blue and green) to the east of S6 are identified as braided-delta channel distal facies, characterized by poorer reservoir properties with less sandstone and more mudstone. Additionally, well CB-E, with the highest mud content, represents a different depositional environment, interpreted as shore-shallow facies.
4.4.2 Dispersal models of multi-hierarchy S2S systems in the CBLU
Based on seismic geomorphology analysis (including CBLU terrains, sediment-conduit channels, and sink areas) and sedimentary facies, two distinct dispersal models of the S2S system related to the CBLU were identified (Figure 13B): (1) eastern braided delta S2S systems that receive sediment from the CBLU through large-scale fault troughs and incised valleys, primarily corresponding to the S4-S6 systems; and (2) northern fan deltas in S2S systems, represented by the S1−S3 systems, are transported through incised valleys originating from the CBLU. The key indices of the S2S systems are presented in Table 1. These dispersal models exhibit varying degrees of coupling and exploration potential.
4.4.3 EW-CT results of multi-hierarchy S2S systems in the CBLU
In addition to traditional S2S parameter statistics, this study introduces a coupling degree model to quantify the coupling mechanisms within S2S systems and seeks to establish a correlation between coupling degree and exploration potential. Summarily, the EW-CT values offer an intuitive reflection of the coupling relationships within the S2S system. In this study, the EW-CT results for the six S2S systems ranged from 0.40 to 0.73, with an average of 0.60 (Table 1; Figure 14).
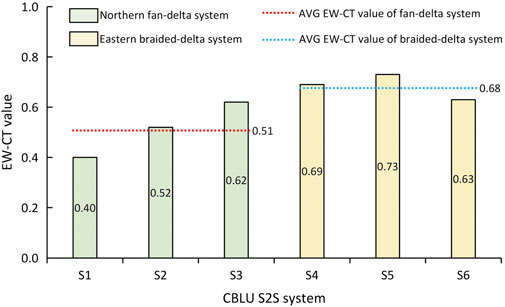
Figure 14. The rectangle portray the EW-CT results taken from different S2S systems.
5 Discussions
5.1 Coupling degree analysis based on the EW-CT results
Based on the coupling degree analysis standard depicted in Section 3.2.2.4, stronger coupling relationships among sub-S2S systems result in higher EW-CT values and, consequently, greater exploration potential. Detailed parameters of the S2S systems and their corresponding EW-CT values are presented in Table 1 and Figure 14.
As shown in Figure 14, taking the S5 S2S system as an example, it demonstrates the highest exploration potential due to its optimal coupling of subsystems (0.73). First, it has the strongest sediment-supply subsystem, with the largest sediment area (SA) and sediment range (SR), providing a solid material foundation for reservoir development. Second, its transportation subsystem is the largest, and the transport channels perfectly connect the sediment source and sink subsystems, facilitating the efficient migration of detrital materials. Lastly, the sediment-sink subsystem offers ample accommodation space for debris deposition. These subsystems interact throughout geologic evolution, achieving an ideal coupling state. As a result, the S5 system has the highest EW-CT value, signifying substantial exploration potential, which was confirmed by the test production of well CB-C (341 m³/d). In contrast, the S1–S3 systems have weaker sediment-supply capacities, resulting in sand bodies developing only near the uplift, as evidenced by the mudstone deposition in well CB-E. The S4 and S6 systems, while having moderate to good sediment-supply capacities, suffer from lower accommodation in their sink subsystems, resulting in poor developed sand bodies and exploration potential.
Based on the analysis and discussion above, the coupling degree of S2S systems can be effectively determined using EW-CT results. This method comprehensively accounts for the S2S system parameters and the complex coupling relationships within the system.
5.2 Exploration potential
Additionally, current hydrocarbon exploration has demonstrated that the Bozhong Sag holds significant hydrocarbon exploration potential (test production of 341 m³/d of well CB-B). The scale and properties of sandy reservoirs, however, are key factors limiting further exploration and development. In this study, sandy reservoirs developed within depositional systems are influenced by different S2S systems, resulting in diverse morphologies and physical properties. Clastic sediments near the CBLU exhibit limited distribution and poorer physical properties, whereas those supplied by the gentle slope have been transported over long distances, leading to higher reservoir maturity and improved properties.
Using the EW-CT results, the exploration potential of multi-hierarchy S2S systems was successfully ranked. As shown in Figure 13B, the eastern braided delta sandstones (S4/S5/S6), formed by long-distance transport through large-scale fault troughs, exhibit the highest exploration potential, with an average EW-CT value of 0.68. Among these, the S5 braided delta sandstones, supplied by the most efficient sediment source and transported through the longest and largest fault troughs, have the greatest exploration potential, corresponding to the highest EW-CT value of 0.73. In contrast, the northern fan delta (S1/S2/S3) sandstones have relatively lower exploration potential, with an average EW-CT value of 0.51. The sedimentology and coupling analysis of the S2S systems indicates that sediment-supply capacity and direction mainly contribute to the higher EW-CT values observed in the eastern S2S systems compared to the northern ones.
5.3 Applicability, uncertainty and future work
As previously discussed, the quantitative framework presented in this study, based on 3D seismic data and limited well controls, provides a systematic approach to analyzing the coupling degree of multi-hierarchy source-to-sink (S2S) systems. This approach is not limited to the studied Paleogene Chengbei Low Uplift (CBLU) but is broadly applicable to other sedimentary basins worldwide, where complex sediment-routing systems exist. By tailoring the indicator systems and weight assignments to region-specific S2S characteristics, this framework can be adapted to assess sediment-routing dynamics in various tectonic settings, such as foreland basins, intracratonic basins, and passive margins. Such adaptability makes this approach suitable for a wide range of applications, from hydrocarbon exploration to understanding sediment dispersal patterns in modern and ancient systems.
For example, this framework could be applied in deltaic, fluvial, and submarine fan systems globally, where sediment routing processes and coupling mechanisms play a critical role in resource distribution and basin evolution. Particularly in underexplored regions with limited drilling data, the integration of seismic-based analyses with regional geological data can provide valuable insights into depositional architectures and resource potential. Therefore, this study not only advances our knowledge of S2S systems in the Bohai Bay Basin but also offers a transferable methodology that can be applied to similar geological contexts worldwide.
Despite the utilization of extensively covered 3D seismic data in this study, only a limited number of wells have penetrated the targeted strata (the third member of the Shahejie Formation) due to economic constraints and exploration strategies. The limited number of drillings presents a significant obstacle to the detailed dissection of the S2S systems. Although drilling data provides high-resolution vertical geological information, its resolution is relatively low for lateral distribution studies. To address this uncertainty, we must fully leverage 3D seismic data (including structural geomorphology, seismic facies, and seismic inversion) in conjunction with published data. However, to some extent, seismic-based facies and attribute analysis may also exhibit uncertainties due to sparse or absent well control. Additionally, different S2S systems possess distinct characteristics, adding another layer of uncertainty. To tackle this issue, we should integrate regional S2S characteristics and adjust their indicator systems and weighting systems accordingly.
Looking forward, advancements in geophysical data processing and exploration technologies will significantly enhance the applicability and accuracy of S2S system analyses. Improved seismic data volumes, more precise paleomorphology reconstruction methods, high-resolution sedimentary facies imaging, and rational weight assignment techniques will enable more detailed and reliable evaluations of S2S systems. Furthermore, integrating depositional and tectonic parameters into the coupling framework could expand its applicability to broader geological and sedimentological studies, bridging the gap between theoretical research and practical resource exploration.
6 Conclusion
Using seismic phase analysis, sedimentological data, and reservoir inversion techniques, we characterized several key parameters related to the S2S systems, including the source area, source landscape, the cross-sectional area (CA) and longest length (CL) of channels, and the fan area (FA) and average thickness (AFT) of the sandbodies. Additionally, the coupling degree of each S2S system was quantified and ranked using the EW-CT model. The following critical conclusions were derived, with significant implications for both S2S research and practical applications:
1. Identification and characterization of multi-hierarchy S2S systems
The CBLU was subdivided into one steep (P) and four gentle (Q/R/S/T) second-level S2S systems, providing a hierarchical approach for analyzing sediment dispersal and deposition. Additionally, the sub-S2S system (S) was further divided into six third-level S2S systems, allowing for a more detailed analysis of sediment-routing processes on a finer scale. This workflow can be applied to deltas, submarine fans, and fluvial systems in other basins, thereby facilitating the study of sediment-routing processes.
2. Establishment of coupling models and differentiation of S2S systems
The coupling model for various sub-S2S systems was established, distinguishing between braided-delta systems and fan-delta systems. The eastern braided-delta systems demonstrated a higher coupling degree, indicating more efficient sediment routing and greater hydrocarbon exploration potential. This differentiation highlights the importance of coupling degree analysis in assessing the models and resource potential of S2S systems.
3. Correlation between coupling degree and exploration potential
The EW-CT model revealed a strong positive correlation between the coupling degree of S2S systems and their hydrocarbon exploration potential, underscoring the utility of the model in ranking exploration targets. By providing a quantitative framework for analyzing S2S systems, this study bridges the gap between sedimentological research and practical resource exploration, thereby supporting resource evaluation and decision-making in diverse geological contexts.
Data availability statement
The original contributions presented in the study are included in the article/supplementary material, further inquiries can be directed to the corresponding author.
Author contributions
XJ: Conceptualization, Formal Analysis, Investigation, Methodology, Software, Validation, Visualization, Writing–original draft, Writing–review and editing. CX: Funding acquisition, Project administration, Resources, Supervision, Writing–review and editing. WL: Formal Analysis, Investigation, Writing–review and editing. QW: Data curation, Software, Writing–review and editing. HH: Formal Analysis, Writing–review and editing.
Funding
The author(s) declare that financial support was received for the research, authorship, and/or publication of this article. The authors express their sincere thanks to China National Offshore Oil Corporation Limited (Tianjin Branch) (Grant No. CNOOCKJ135ZDXM36TJ08TJ and No. ZZKY-2022-TJ-JG-01).
Conflict of interest
Authors XJ, CX, WL, QW, and HH were employed by China National Offshore Oil Corporation Limited.
The authors declare that this study received funding from China National Offshore Oil Corporation Limited. The funder had the following involvement in the study: decision to publish.
Generative AI statement
The author(s) declare that no Generative AI was used in the creation of this manuscript.
Publisher’s note
All claims expressed in this article are solely those of the authors and do not necessarily represent those of their affiliated organizations, or those of the publisher, the editors and the reviewers. Any product that may be evaluated in this article, or claim that may be made by its manufacturer, is not guaranteed or endorsed by the publisher.
References
Allen, M. B., Macdonald, D., Xun, Z., Vincent, S., and Brouet-Menzies, C. (1997). Early Cenozoic two-phase extension and late Cenozoic thermal subsidence and inversion of the Bohai basin, northern China. Mar. Petroleum Geol. 14 (7-8), 951–972. doi:10.1016/s0264-8172(97)00027-5
Allen, P. A. (2008). From landscapes into geological history. Nature 451 (7176), 274–276. doi:10.1038/nature06586
Allen, P. A., and Heller, P. L. (2011). Dispersal and preservation of tectonically generated alluvial gravels in sedimentary basins. Tect. Sediment. basins, 111–130. doi:10.1002/9781444347166.ch6
Brewer, C. J., Hampson, G. J., Whittaker, A. C., Roberts, G. G., and Watkins, S. E. (2020). Comparison of methods to estimate sediment flux in ancient sediment routing systems. Earth-Science Rev. 207, 103217. doi:10.1016/j.earscirev.2020.103217
Carter, L., Orpin, A. R., and Kuehl, S. A. (2010). From mountain source to ocean sink – the passage of sediment across an active margin, Waipaoa Sedimentary System, New Zealand. Mar. Geol. 270 (1-4), 1–10. doi:10.1016/j.margeo.2009.12.010
Chen, Y., Bi, J., Qiu, X., Chen, Y., Yang, H., Cao, J., et al. (2020). A method of seismic meme inversion and its application. Petroleum Explor. Dev. 47 (06), 1235–1245. doi:10.1016/s1876-3804(20)60132-5
Feng, Y., Jiang, S., Hu, S., Li, S., Lin, C., and Xie, X. (2016). Sequence stratigraphy and importance of syndepositional structural slope-break for architecture of Paleogene syn-rift lacustrine strata, Bohai Bay Basin, E. China. Mar. Petroleum Geol. 69, 183–204. doi:10.1016/j.marpetgeo.2015.10.013
Feng, Y., Li, S., and Lu, Y. (2013). Sequence stratigraphy and architectural variability in late Eocene lacustrine strata of the dongying depression, Bohai Bay Basin, eastern China. Sediment. Geol. 295, 1–26. doi:10.1016/j.sedgeo.2013.07.004
Guo, J., Jiang, Z., Xie, X., Liang, C., Wang, W., Busbey, A. B., et al. (2021). Deep-lacustrine sediment gravity flow channel-lobe complexes on a stepped slope: an example from the Chengbei Low Uplift, Bohai Bay Basin, East China. Mar. Petroleum Geol. 124, 104839. doi:10.1016/j.marpetgeo.2020.104839
Helland-Hansen, W., Sømme, T. O., Martinsen, O. J., Lunt, I., and Thurmond, J. (2016). Deciphering earth's natural hourglasses: perspectives on source-to-sink analysis. J. Sediment. Res. 86 (9), 1008–1033. doi:10.2110/jsr.2016.56
Jia, Y., Lin, C., Eriksson, K. A., Niu, C., Li, H., and Zhang, P. (2019). Fault control on depositional systems and sequence stratigraphic architecture in a multiphase, rifted, lacustrine basin: a case study from the paleogene of the central Bohai Bay Basin, northeast China. Mar. Petroleum Geol. 101, 459–475. doi:10.1016/j.marpetgeo.2018.12.019
Jiang, S., Henriksen, S., Wang, H., Lu, Y., Ren, J., Cai, D., et al. (2013). Sequence-stratigraphic architectures and sand-body distribution in Cenozoic rifted lacustrine basins, east China. AAPG Bull. 97 (9), 1447–1475. doi:10.1306/03041312026
Jiang, Z., Liu, H., Zhang, S., and Su, X. (2011). Sedimentary characteristics of large-scale lacustrine beach-bars and their Formation in the Eocene boxing sag of Bohai Bay Basin, east China. Sedimentology 58 (5), 1087–1112. doi:10.1111/j.1365-3091.2010.01196.x
Khan, J. F., and Bhuiyan, S. M. (2014). Weighted entropy for segmentation evaluation. Opt. Laser Technol. 57, 236–242. doi:10.1016/j.optlastec.2013.07.012
Kuehl, S. A., Alexander, C. R., Blair, N. E., Harris, C. K., Marsaglia, K. M., Ogston, A. S., et al. (2016). A source-to-sink perspective of the Waipaoa River margin. Earth-Science Rev. 153, 301–334. doi:10.1016/j.earscirev.2015.10.001
Li, S., Zhu, H., Xu, C., Zeng, H., Liu, Q., and Yang, X. (2019). Seismic-based identification and stage analysis of overlapped compound sedimentary units in rifted lacustrine basins: an example from the Bozhong sag, Bohai Bay Basin, China. AAPG Bull. 103 (10), 2521–2543. doi:10.1306/02151916513
Li, W., Yue, D., Colombera, L., Du, Y., Zhang, S., Liu, R., et al. (2021). Quantitative prediction of fluvial sandbodies by combining seismic attributes of neighboring zones. J. Petroleum Sci. Eng. 196, 107749. doi:10.1016/j.petrol.2020.107749
Li, Y., Huang, X., Lian, E., Li, C., Xu, J., Yin, P., et al. (2023). Geochemical and provenance heterogeneity of small mountainous river systems in Southeast China. Glob. Planet. Change 230, 104271. doi:10.1016/j.gloplacha.2023.104271
Li, Y., Shao, L., Xu, J., Hou, H., Tang, Y., Yuan, Y., et al. (2020). Application of channel-belt scaling relationships to early Middle Jurassic source-to-sink system evolution in the southern Junggar Basin. Mar. Petroleum Geol. 117, 104356. doi:10.1016/j.marpetgeo.2020.104356
Lin, C. (2006). Tectono-stratigraphic analysis of sedimentary basins: a case study on the inland tectonically active basins in China. Geoscience 20 (2), 185–194.
Lin, C., Liu, J., and Zhang, Y. (2005). Sequence stratigraphy and tectono-stratigraphic analysis of tectonically active basins:A case study on the Cenozoic-Mesozoic lacustrine basins in China. Earth Sci. Front. 12 (4), 365–374.
Liu, H., Loon, A. J. T., Xu, J., Tian, L., Du, X., Zhang, X., et al. (2020). Relationships between tectonic activity and sedimentary source-to-sink system parameters in a lacustrine rift basin: a quantitative case study of the Huanghekou Depression (Bohai Bay Basin, E China). Basin Res. 32 (4), 587–612. doi:10.1111/bre.12374
Liu, J., Dietz, T., Carpenter, S. R., Alberti, M., Folke, C., Moran, E., et al. (2007). Complexity of coupled human and natural systems. Science 317 (5844), 1513–1516. doi:10.1126/science.1144004
Liu, Q., Zhu, X., Li, S., Li, H., and Shi, W. (2016a). Pre-palaeogene bedrock distribution and source-to-sink system analysis in the shaleitian uplift. Earth Sci. 41 (11), 1935–1949.
Liu, Q., Zhu, X., Yang, Y., Geng, M., Tan, M., Jiang, L., et al. (2016b). Sequence stratigraphy and seismic geomorphology application of facies architecture and sediment-dispersal patterns analysis in the third member of Eocene Shahejie Formation, slope system of Zhanhua Sag, Bohai Bay Basin, China. Mar. Petroleum Geol. 78, 766–784. doi:10.1016/j.marpetgeo.2015.11.015
Liu, Q., Zhu, X., Zeng, H., and Li, S. (2019). Source-to-sink analysis in an Eocene rifted lacustrine basin margin of western Shaleitian Uplift area, offshore Bohai Bay Basin, eastern China. Mar. Petroleum Geol. 107, 41–58. doi:10.1016/j.marpetgeo.2019.05.013
Liu, Y., Liu, L., Wu, Z., Li, W., and Hao, X. (2022). New insight into East Asian tectonism since the late Mesozoic inferred from erratic inversions of NW-trending faulting within the Bohai Bay Basin. Gondwana Res. 102, 17–30. doi:10.1016/j.gr.2020.01.022
Marconi, D. (2012). Environmental regulation and revealed comparative advantages in europe: is China a pollution haven? Rev. Int. Econ. 20 (3), 616–635. doi:10.1111/j.1467-9396.2012.01042.x
Nottvedt, A., Gabrielsen, R. H., and Steel, R. (1995). Tectonostratigraphy and sedimentary architecture of rift basins, with reference to the northern north-sea. Mar. Petroleum Geol. 12 (8), 881–901. doi:10.1016/0264-8172(95)98853-w
Nyberg, B., Gawthorpe, R. L., and Helland-Hansen, W. (2018). The distribution of rivers to terrestrial sinks: implications for sediment routing systems. Geomorphology 316, 1–23. doi:10.1016/j.geomorph.2018.05.007
Prizomwala, S. P., Bhatt, N., and Basavaiah, N. (2014). Provenance discrimination and Source-to-Sink studies from a dryland fluvial regime: an example from Kachchh, western India. Int. J. Sediment Res. 29 (1), 99–109. doi:10.1016/s1001-6279(14)60025-1
Qi, J., and Yang, Q. (2010). Cenozoic structural deformation and dynamic processes of the Bohai Bay basin province, China. Mar. Petroleum Geol. 27 (4), 757–771. doi:10.1016/j.marpetgeo.2009.08.012
Ren, J. Y., Tamaki, K., Li, S., and Junxia, Z. (2002). Late Mesozoic and Cenozoic rifting and its dynamic setting in Eastern China and adjacent areas. Tectonophysics 344 (3-4), 175–205. doi:10.1016/s0040-1951(01)00271-2
Romans, B. W., Castelltort, S., Covault, J. A., Fildani, A., and Walsh, J. (2016). Environmental signal propagation in sedimentary systems across timescales. Earth-Science Rev. 153 (9), 7–29. doi:10.1016/j.earscirev.2015.07.012
Saha, A., Roy, D. K., Khan, R., Ornee, T. I., Goswami, S., Idris, A. M., et al. (2023). Provenance, weathering, climate and tectonic setting of Padma River sediments, Bangladesh: a geochemical approach. Catena 233, 107485. doi:10.1016/j.catena.2023.107485
Shannon, C. E. (1948). A mathematical theory of communication. Bell Syst. Tech. J. 27 (3), 379–423. doi:10.1002/j.1538-7305.1948.tb01338.x
Shiklomanov, I. A. (2000). Appraisal and assessment of world water resources. Water Int. 25 (1), 11–32. doi:10.1080/02508060008686794
Snelder, T. H., and Biggs, B. (2002). Multiscale River environment classification for water resources management. J. Am. Water Resour. Assoc. 38 (5), 1225–1239. doi:10.1111/j.1752-1688.2002.tb04344.x
Sømme, T. O., Helland-Hansen, W., Martinsen, O. J., and Thurmond, J. B. (2009a). Relationships between morphological and sedimentological parameters in source-to-sink systems: a basis for predicting semi-quantitative characteristics in subsurface systems. Basin Res. 21 (4), 361–387. doi:10.1111/j.1365-2117.2009.00397.x
Sømme, T. O., Jackson, C. A., and Vaksdal, M. (2013). Source-to-sink analysis of ancient sedimentary systems using a subsurface case study from the Møre-Trøndelag area of southern Norway: Part 1 - depositional setting and fan evolution. Basin Res. 25 (5), 489–511. doi:10.1111/bre.12013
Sømme, T. O., Martinsen, O. J., and Thurmond, J. B. (2009b). Reconstructing morphological and depositional characteristics in subsurface sedimentary systems; an example from the Maastrichtian-Danian Ormen Lange system, More Basin, Norwegian Sea. AAPG Bull. 93 (10), 1347–1377. doi:10.1306/06010909038
Sømme, T. O., Piper, D. J. W., Deptuck, M. E., and Helland-Hansen, W. (2011). Linking onshore-offshore sediment dispersal in the golo source-to-sink system (corsica, France) during the late quaternary. J. Sediment. Res. 81 (2), 118–137. doi:10.2110/jsr.2011.11
Syvitski, J. P. M., and Milliman, J. D. (2007). Geology, geography, and humans battle for dominance over the delivery of fluvial sediment to the coastal ocean. J. Geol. 115 (1), 1–19. doi:10.1086/509246
Walsh, J. P., Wiberg, P. L., Aalto, R., Nittrouer, C. A., and Kuehl, S. A. (2016). Source-to-sink research: economy of the Earth's surface and its strata. Earth-Science Rev. 153, 1–6. doi:10.1016/j.earscirev.2015.11.010
Wandres, A. M., Bradshaw, J. D., Weaver, S., Maas, R., Ireland, T., and Eby, N. (2004). Provenance analysis using conglomerate clast lithologies: a case study from the Pahau terrane of New Zealand. Sediment. Geol. 167 (1-2), 57–89. doi:10.1016/j.sedgeo.2004.02.002
Wang, Y., Li, C., Hao, Y., Zheng, D., Zhang, H., Yu, J., et al. (2022). Multi-stage growth in the North margin of the qinling orogen, Central China, revealed by both low-temperature thermochronology and river profile inversion. Tectonics 41 (4). doi:10.1029/2021tc007029
Wang, Y., Liu, C., Zheng, D., Zhang, H., Yu, J., Pang, J., et al. (2021). Multistage exhumation in the catchment of the anninghe River in the SE Tibetan plateau: insights from both detrital thermochronology and topographic analysis. Geophys. Res. Lett. 48 (11). doi:10.1029/2021gl092587
Watson, M. P., Hayward, A. B., Parkinson, D., and Zhang, Z. (1987). Plate tectonic history, basin development and Petroleum source rock deposition onshore China. Mar. Petroleum Geol. 4 (3), 205–225. doi:10.1016/0264-8172(87)90045-6
Webb, M., Gough, A., Vannucchi, P., Lünsdorf, N. K., and McNeil, J. (2021). Sedimentary provenance of the Plio-Pleistocene Nicobar Fan: complex sourcing revealed through Raman spectroscopy heavy mineral analysis. Mar. Petroleum Geol. 125, 104874. doi:10.1016/j.marpetgeo.2020.104874
Weltje, G. J., and von Eynatten, H. (2004). Quantitative provenance analysis of sediments: review and outlook. Sediment. Geol. 171 (1-4), 1–11. doi:10.1016/j.sedgeo.2004.05.007
Weng, Q., Lian, H., and Qin, Q. (2022). Spatial disparities of the coupling coordinated development among the economy, environment and society across China's regions. Ecol. Indic. 143, 109364. doi:10.1016/j.ecolind.2022.109364
Xu, C. (2007). Lithologic trap prediction of paleogene under the exploration degree area of Bohai Sea. Beijing: China University of Geosciences, 14–23.
Yan, J., Feng, C., and Li, L. (2014). Sustainability assessment of machining process based on extension theory and entropy weight approach. Int. J. Adv. Manuf. Technol. 71 (5-8), 1419–1431. doi:10.1007/s00170-013-5532-6
Yang, Y., and Xu, T. (2004). Hydrocarbon habitat of the offshore Bohai basin, China. Mar. Petroleum Geol. 21 (6), 691–708. doi:10.1016/j.marpetgeo.2004.03.008
Zeng, Z., Zhu, H., Mei, L., Du, J., Zeng, H., Xu, X., et al. (2019). Multilevel source-to-sink (S2S) subdivision and application of an ancient uplift system in South China Sea: implications for further hydrocarbon exploration. J. Petroleum Sci. Eng. 181, 106220. doi:10.1016/j.petrol.2019.106220
Zhang, J., Covault, J., Pyrcz, M., Sharman, G., Carvajal, C., and Milliken, K. (2018). Quantifying sediment supply to continental margins: application to the paleogene wilcox group, gulf of Mexico. AAPG Bull. 102 (09), 1685–1702. doi:10.1306/01081817308
Zhao, L., and Zheng, T. Y. (2005). Seismic structure of the Bohai Bay Basin, northern China: implications for basin evolution. Earth Planet. Sci. Lett. 231 (1-2), 9–22. doi:10.1016/j.epsl.2004.12.028
Keywords: coupling degree model, source-to-sink system (S2S), exploration potential, Chengbei Low Uplift, offshore Bohai Bay basin
Citation: Ji X, Xu C, Li W, Wang Q and Hu H (2025) A quantitative coupling degree model for source-to-sink (S2S) system through entropy weight-coupling theory: a case study of the Chengbei Low Uplift area, offshore Bohai Bay Basin, Eastern China. Front. Earth Sci. 13:1511226. doi: 10.3389/feart.2025.1511226
Received: 14 October 2024; Accepted: 21 January 2025;
Published: 17 February 2025.
Edited by:
Bowen Song, China University of Geosciences Wuhan, ChinaReviewed by:
Jintong Liang, Chengdu University of Technology, ChinaZhen Liu, China University of Petroleum, Beijing, China
Hongchao Zhao, Tongji University, China
Copyright © 2025 Ji, Xu, Li, Wang and Hu. This is an open-access article distributed under the terms of the Creative Commons Attribution License (CC BY). The use, distribution or reproduction in other forums is permitted, provided the original author(s) and the copyright owner(s) are credited and that the original publication in this journal is cited, in accordance with accepted academic practice. No use, distribution or reproduction is permitted which does not comply with these terms.
*Correspondence: Xinyuan Ji, anh5XzE5OTFAMTYzLmNvbQ==