 Han Liu
 Hu Si1,2*
- 1State Key Laboratory of Coal Mine Disaster Dynamics and Control, Chongqing University, Chongqing, China
- 2School of Resources and Safety Engineering, Chongqing University, Chongqing, China
- 3CETC Academy of Chips Technology, Chongqing, China
- 4Jiujiang University, School Architecture Engineering and Planning, Jiujiang, China
Understanding the activation and slip characteristics of faults is essential for the safety and stability of underground engineering. The mechanical behavior of laboratory faults with gouge of specific strength remains unclear. Therefore, triaxial compression tests were performed on saw-cut sandstone specimens containing artificial gypsum gouge. Strength criteria analysis, crack pattern analysis, and fault surface roughness evaluation were conducted to investigate the effects of dip angle, confining pressure, and loading rate on the failure modes and stick-slip characteristics of the faults. The results indicate that as the fault dip increases, the fracture mode transitions from rock damage to shear failure along the saw-cut surface. Fractures within the gypsum fault gouge result in deviations between the measured and theoretical strength values. The magnitude of the normal stress controls the fault surface roughness and the variations in the stress drop during fault activation. An increase in the loading rate results in a transition from stick-slip behavior to stable slip. This study enhances the understanding of fault stability and provides valuable insights into monitoring strategies for underground engineering and earthquake prediction.
1 Introduction
Faults, as common geological structures in the Earth’s crust, can be observed in rocks ranging from microscopic to outcrop scale (Zhu et al., 2024), aligned in different orientations and at varying depths (Wu et al., 2023). The stability of faults is highly correlated with geologic hazards such as landslides (Li et al., 2024a), rockbursts (Bai et al., 2022), and mudslides (Zhang et al., 2024). Therefore, the study of fault-containing rocks is crucial for the safe development of underground projects (Zhu et al., 2022).
The Amonton-based friction law states that when the shear stress on the fault surface exceeds the critical shear strength, the fault reactivates and slips (Sibson, 1985). However, the differential stress required for fault activation is related to the friction on the fault surface (Ban et al., 2023). This stress is also influenced by the direction of the maximum principal stress (Giorgetti et al., 2019) and the magnitude of the effective stress (Delle Piane et al., 2016). As the fault approaches the critical stress, both normal and shear stresses decrease significantly (Wu et al., 2017). Microscopically, this is associated with a reduction in intergranular forces and particle contact fracture. (Zhang et al., 2023). Oscillation of normal stress (Yu et al., 2024) and the ratio of normal stress to shear stress (Li et al., 2024b) are associated with the destabilizing fault slip. Unloading of normal stress (Liu et al., 2024) triggered by engineering perturbations such as underground mining and tunneling (Ji et al., 2019) can lead to the sudden activation of faults, causing an extremely strong subsurface dynamic hazards (Niu et al., 2024). Additionally, water injection processes, such as geothermal mining (Ji et al., 2022) and hydraulic fracturing to increase seams (Yaghoubi et al., 2022) can activate faults and induce earthquakes (Wang et al., 2024), by increasing the effective stress on the fault surface (Wynants-Morel et al., 2021). Also, rupture instability is also associated with changes in the direction of principal stresses relative to the direction of rupture (Zhang and Sanderson, 2001).
The stick-slip mechanism observed in laboratory rocks is thought to be similar to the sliding behavior of in-situ faults (Brace and Byerlee, 1966). Many laboratory-based fault studies have been conducted to reveal the mechanisms of fault slip and its mechanics (Bolton et al., 2022). Since in-situ faults are not zero-thickness planes and contain a range of fault gouge (Choi et al., 2016), the method of filling fault gouge is commonly used to model their friction behavior (Nilsen, 2021). Specifically, commonly used in-situ fault gouges in the laboratory, such as those composed of low-strength clay minerals (e.g., clays and layered silicates), tend to exhibit velocity enhancement and stable sliding (Ruggieri et al., 2021). In contrast, the friction coefficients of faults composed of slightly stronger granular minerals (e.g., quartz) decrease with velocity, experiencing unstable stick-slip (Leeman et al., 2016). Additionally, a smaller grain size distribution of fault gouge contributes to fault destabilization as well as strength recovery (Cao et al., 2024). Different mineral compositions affect the frictional strength and rate-dependence of faults (Zhang et al., 2019). The presence of fluids within the gouge layer contributes to stabilizing slip behavior and fault compaction (Kang et al., 2024). Moreover, an increase in temperature promotes the transition of fault gouge from brittle to ductile (Mei et al., 2024). The frictional strength and sliding stability of faults are also controlled by the interaction of several of these factors (An et al., 2021). However, in the vicinity of the fault core, there exist a damage zone with some cohesion (Ben-Zion and Sammis, 2003). As a geological material commonly stronger than clay minerals (Wu et al., 2022), comparative experiments between gypsum and clay mineral gouge (Wu et al., 2022) have demonstrated that gypsum exhibit a stronger tendency to weaken at higher velocities (Ren, 2024). Furthermore, the fault slip behavior observed on gypsum fault gouge is consistent with numerical models and theories applied to natural and induced earthquakes (Buijze et al., 2021). Moreover, the triaxial shear experiment more closely to the simulates the in-situ stress of the original rock in the subsurface (Zhong et al., 2023) compared to the direct shear experiment, which applies an inconsistent normal loads to the fault (Ji et al., 2022). Therefore, based on the observations from the aforementioned studies, the following questions warrant further investigation: How does a fault gouge of specific strength affect the fracture pattern of rock specimens? How do factors such as fault dip angle, confining pressure in triaxial tests, and loading rate influence fault activation and slip?
This study primarily investigates the stress-strain characteristics of faults with varying dip angles, as well as the activation and slip behavior of faults under different confining pressures and loading rates. Incorporating the analysis of fault surface roughness, the study further explores the mechanisms by which gypsum faults influence the strength of sandstones, the transformation of stress drop characteristics during fault activation, and the changes in fault slip patterns. Finally, the study analyzes the correlation between the research results and underground engineering near the faults.
2 Materials and methods
2.1 Sample selection and treatment
The sandstone used in these experiments is a typical rock from the earthquake-prone Longmenshan Fault Zone of the Sichuan Basin, China (Wang et al., 2014; Long et al., 2022). To ensure the samples had comparable structural properties, cylindrical sandstone samples were cored from individual sandstone blocks along a direction perpendicular to the laminae. The ends of each cylindrical rock sample were carefully ground to a height of 100 mm and a diameter of 50 mm.
The complete sandstone samples were sawed from the center at angles of 0°, 15°, 30°, 35°, 40°, 45°, 50°, 55°, 60°, and 65° relative to the direction of
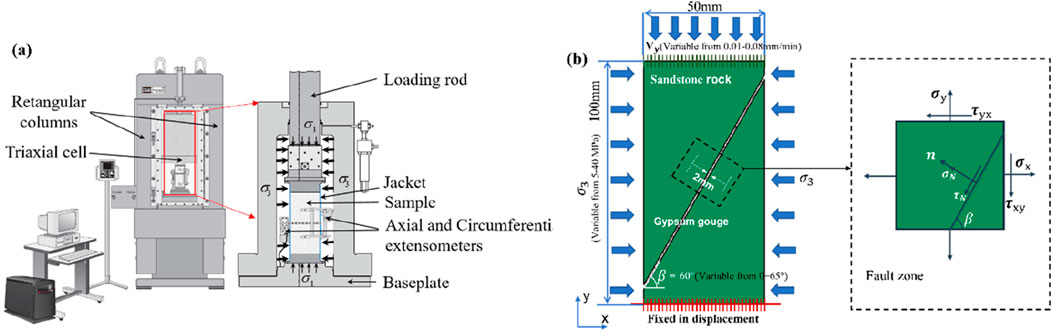
Figure 1. (A)The experimental testing system: MTS815 (B) Schematic diagram of the sawed sample.
2.2 Test equipment and procedures
Triaxial tests were performed at room temperature using a servo-controlled MTS815 tester without any pore pressure (Figure 1A). The confining pressure was applied through silicone oil in the triaxial cell. The sample was wrapped with a polyolefin sleeve to separate it from the silicone oil. Axial forces were measured using force transducers with a maximum load capacity of 2200 kN and an accuracy of ±0.5%. Circumferential strain
Uniaxial and triaxial compression tests were first performed on gypsum and sandstone standards, followed by triaxial compression tests on sawed samples. The experimental procedure is as follows: First, the confining pressure was applied at a rate of 2 MPa/min until it reached the set value of 10 MPa. The confining pressure was then kept constant, and the axial load was applied at a fixed displacement rate of 0.01 mm/min, corresponding to a strain rate of approximately
3 Results
In the following analysis and discussion, the maximum principal stress is denoted as
3.1 Fundamental mechanical characteristics of sandstone specimens and gypsum faults
The stress‒strain curves provide valuable insights into the evolution of the mechanical properties of the specimens under loading. Table 1 shows the basic physical properties of the sandstone and gypsum used in this laboratory test. Figure 2A presents the uniaxial compressive stress‒strain curves of intact sandstone and gypsum specimens. The fractures of both sandstone and gypsum exhibit typical brittle characteristics. The uniaxial compressive strength of sandstone is 67.22 MPa, approximately 3.3 times that of gypsum. The elastic modulus of gypsum is 1.7 GPa, which is much smaller than that of sandstone (10.52 GPa). The deformation of gypsum specimen during the initial stage of pore compaction is significantly larger than that of sandstone specimen due to its higher porosity. Figure 2B shows the differential stress-strain curves of 60° saw-cut samples with and without gypsum faults. Due to the consolidating effect of gypsum, specimens with gypsum faults exhibit significantly higher shear strength compared to those without gypsum. Moreover, the specimen with a gypsum fault undergoes stick-slip behavior upon activation, while the specimen without a gypsum fault undergoes stable sliding after activation.
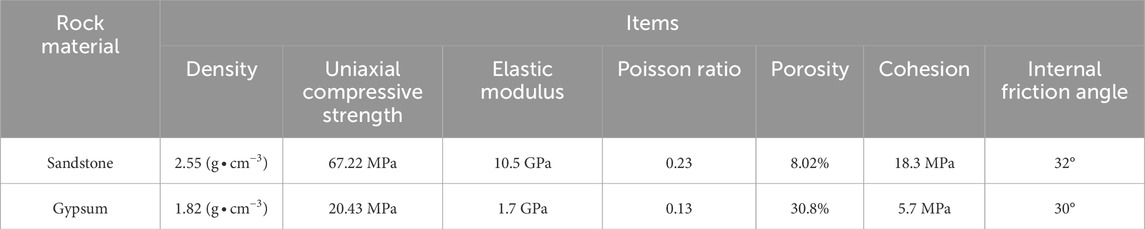
Table 1. Physical properties of sandstone and gypsum.
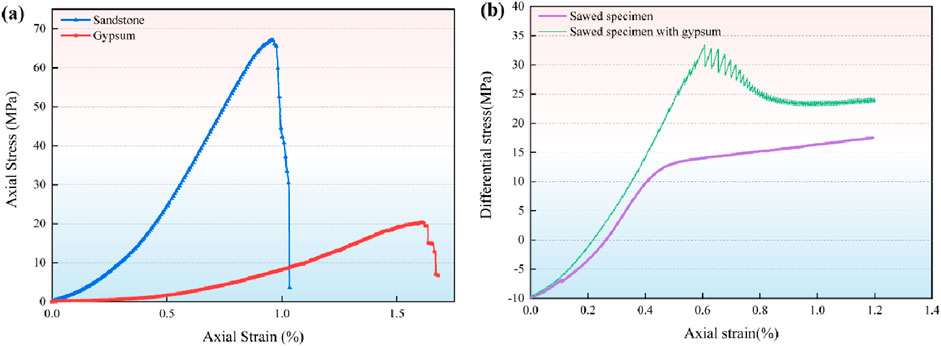
Figure 2. (A) Uniaxial compressive strength of sandstone and gypsum standard specimens (B) Differential stress-strain curves of saw-cut specimens with and without gypsum.
3.2 Mechanical characteristics of gypsum faults
3.2.1 Gypsum faults with varying dip angles
For better classification and understanding, the results are divided into two groups: the 0°–40° group (Figure 3A), where brittle fracture occurs, and the 45°–65° group (Figure 3B), where stick-slip dominates. Table 2 presents the strength and Young’s modulus values of intact rock specimen and saw-cut specimens at different
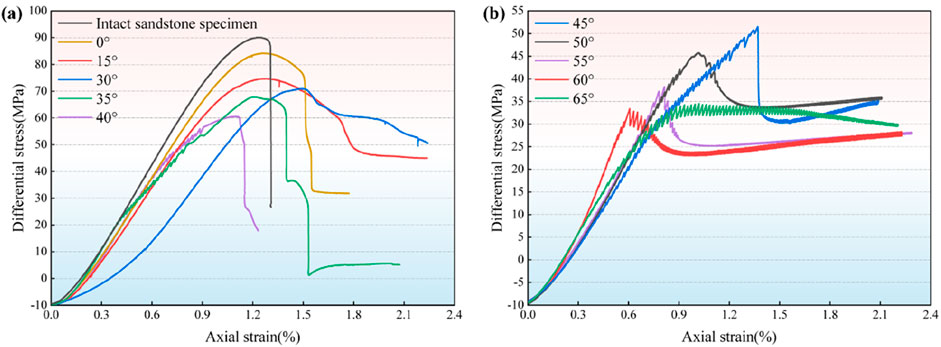
Figure 3. Differential stress-strain curves of sandstone specimens containing gypsum gouge at different dip angles, grouped by (A) 0°–40° (B) 45°–65°.

Table 2. Physical properties of specimens with faults at different dip angle.
From Figure 3A, it can be observed that saw-cut specimens undergo several stages in the differential stress-strain curve: closure of initial porosity, elastic loading, progressive yielding, and one or more stress drops until specimen failure. Gypsum faults significantly affect the mechanical strength of sandstone, with increasing
3.2.2 Gypsum faults under varying confining pressure
Based on the previous analysis, we know that the differential stress is smallest when fault undergoes stable stick-slip at
The measured and calculated values of specimen shear strength, overall stress drop at activation, and average stress during stick-slip are listed in Table 3, all of which increase with the rise in confining pressure (Figure 4B). It is noteworthy that, similar to the variation in the
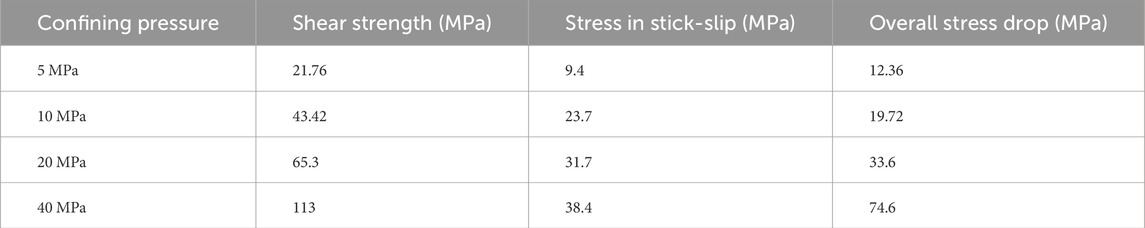
Table 3. Stress characteristics during stick-slip of samples under different confining pressure.
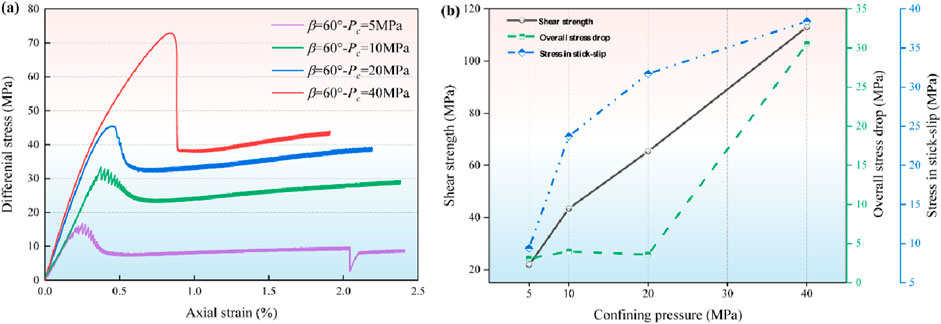
Figure 4. (A) Differential stress of 60° saw-cut specimens under different confinement pressures (B) shear strength, overall stress drop and stress in stick-slip.
3.2.3 Gypsum faults under various loading rates
Based on the previous analysis, gypsum faults undergo a fixed cycle of stick-slip after reaching the peak. To investigate whether different loading rates affect the fault slip behavior. The fault was loaded to the stick-slip stage at a loading rate of 2E-2mm/min at
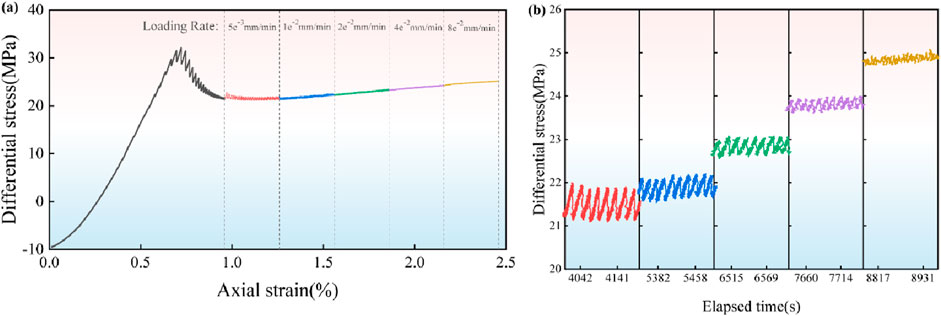
Figure 5. (A) Differential stress of specimens at various loading rates (B) Amplified plot of differential stress.
With the increase in loading rate, the stress drop during fault stick-slip gradually decreases from 0.9 MPa to 0.1MPa, and cycle time for single stick-slip decreases from 28s to 8s (Figure 5B). When the loading rate reaches 0.08 mm/min, no apparent stress drop occurs, indicating that the fault no longer exhibits stick-slip behavior and has entered a “stable-slip” state. Therefore, an increase in the loading rate transitions the fault slip from “stick-slip” to “stable-slip.” When the stiffness of the sandstone and gypsum fault system is lower than the fault slip weakening rate (Ji et al., 2019), the fracture will undergo dynamic slip. Thus, for faults with loading rates between 5E-3 and 4E-2mm/min, the lower slip weakening rate causes the fault to undergo periodic stick-slip. In contrast, at 8E-2mm/min, the slip rate of the fault is primarily influenced by the load point rate of the testing machine, resulting in stable slip.
3.3 Fracture patterns of saw-cut specimens
Figure 6 illustrates the fracture morphology and types of cracks after the failure of intact rock and saw-cut specimens. All specimens containing gypsum faults suffered severe damage; however, the fractures in sandstone varied significantly with different
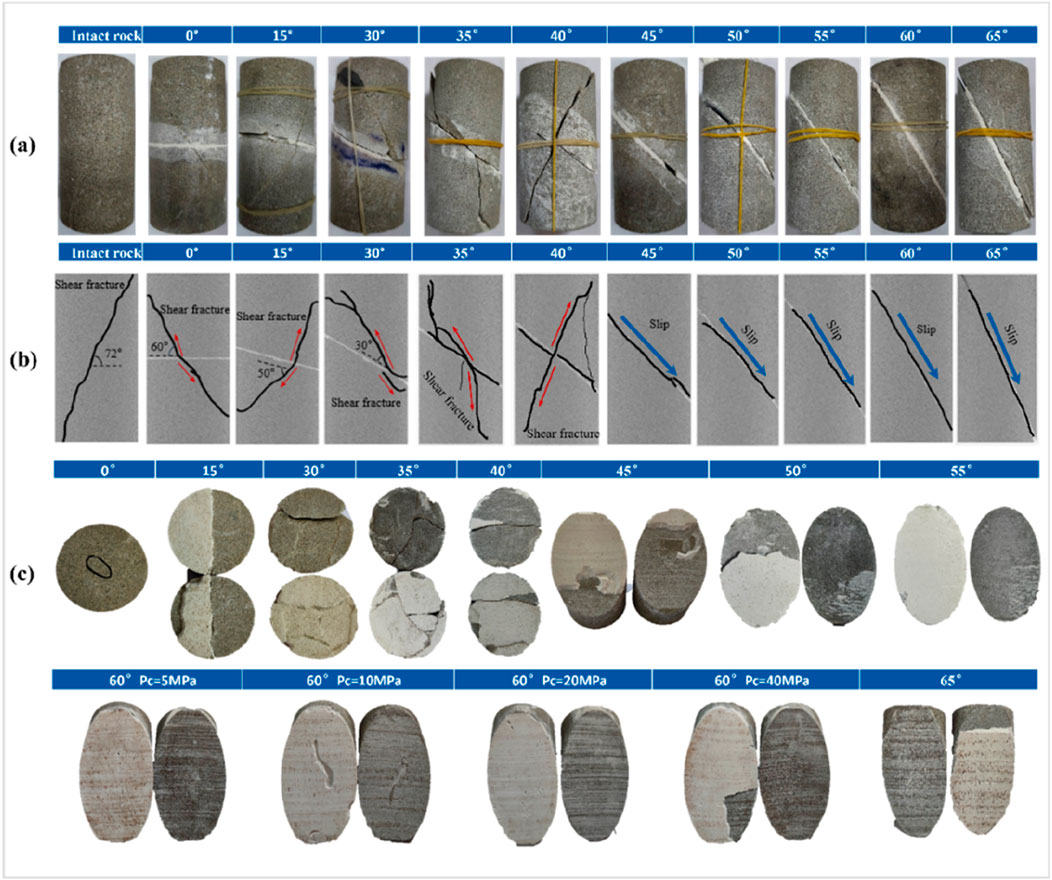
Figure 6. (A) Crack morphology on the surface of saw-cut specimens (B) Crack types in saw-cut specimens (C) Cracks morphology on gypsum fault and saw-cut surfaces.
3.4 Morphology of the fault surface
The statistical parameters are commonly used to evaluate the morphology of rock fractures or sawed surfaces can be directly derived from the data coordinates of the asperities on the fracture surface. The statistical parameters typically include the root mean square of the height of the profile
where
In order to calculate the statistical roughness parameter and JRC (Equation 5), 26 equally spaced fracture profiles were extracted from each fault surface along the direction parallel to the fault. The average roughness parameters and JRC for the 26 profiles are listed in Table 4.
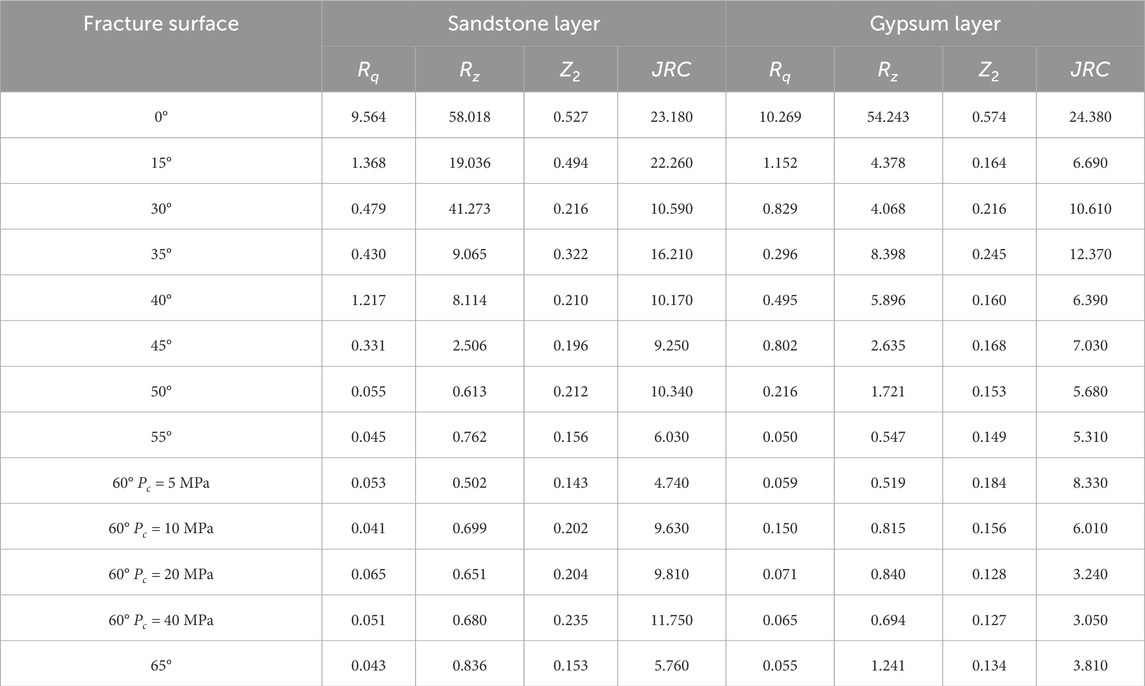
Table 4. The roughness parameters and JRC of different fault surfaces.
After experiments, both sandstone layer and gypsum layer were subjected to non-contact tomography scanner and reconstruction (Figure 7). In addition to the surface cracks mentioned earlier, it was also observed that the surface of the gypsum was significantly smoother than that of the sandstone, attributed to the differing grain sizes of the sandstone and gypsum particles. This was corroborated by the roughness calculations (Table 4). A clear slicken line was observed parallel to the slip direction on the surface of the sandstone layer, which occurred due to the fracture and displacement of asperities on the sandstone layers. Its visibility increased with higher
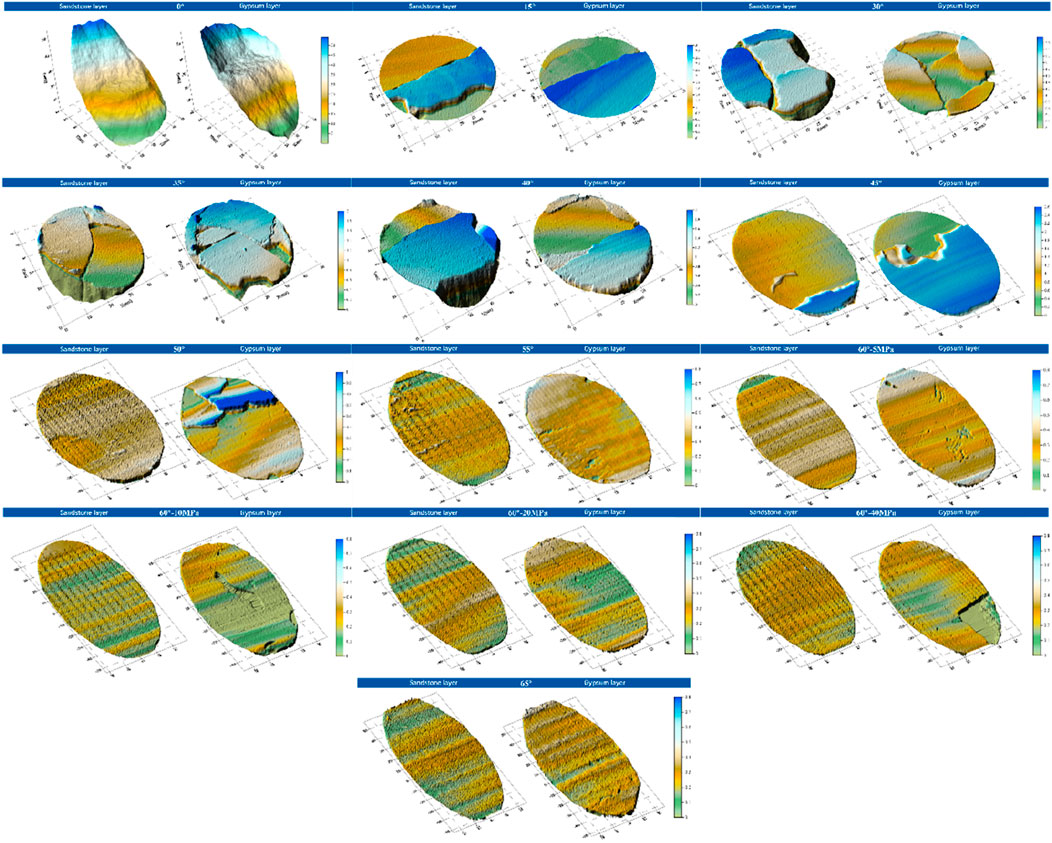
Figure 7. Contour scan of contact surfaces on both sides of the fault.
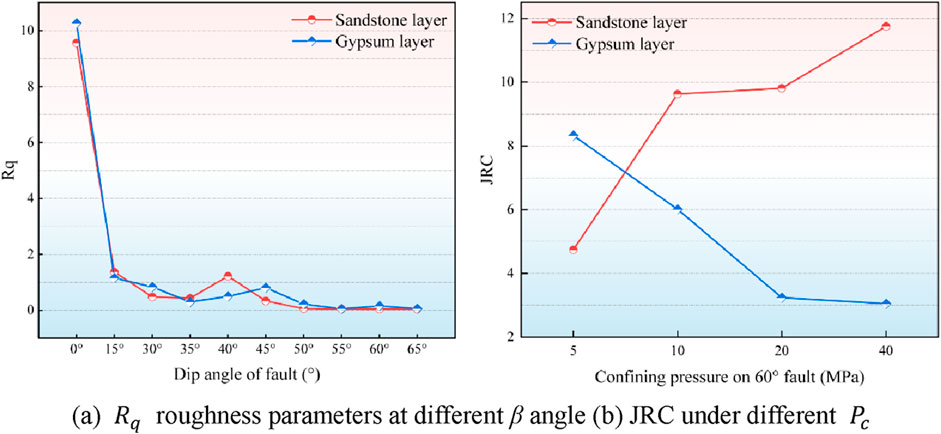
Figure 8. (A)
The differences in fault surface morphology are closely related to the fracture and stick-slip patterns of the fault. In the following sections, we will discuss in detail the impact of fault dip on shear strength of saw-cut specimens, as well as the mechanisms of confining pressure and loading rate on the stick-slip state of the fault. The correlation of experimental results with underground engineering near in-situ faults is also discussed.
4 Discussion
4.1 The impact of gypsum faults on the strength of sandstone
Based on the relationship between shear stress and normal stress components on the fault surface under different
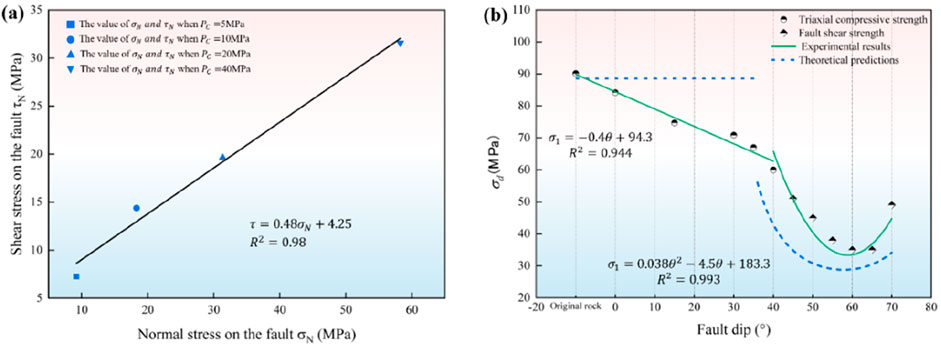
Figure 9. (A) Strength fitting curve of the gypsum fault (B) The theoretical and predicted values of the maximum differential stress for gypsum-containing specimens.
For a fault containing cohesive fault gouge (Fagereng et al., 2010), the maximum differential stress required for its activation is:
Where
Therefore, based on Equations 6, 7, we can calculate and predict the differential stress at failure for rocks containing cohesive faults (Figure 9B). Within
4.2 The transformation of stick-slip mode during activation
Based on the previous analysis,
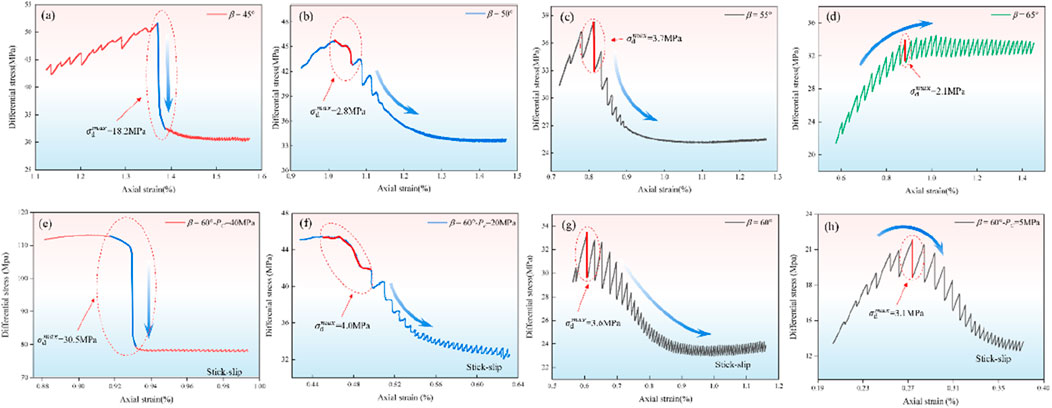
Figure 10. Variation in stick-slip types during fault activation under the influence of fault angle grouped by: (A) 45°, (B) 50°, (C) 55°, (D) 65°, (G) 60° Changes in stick-slip types under the influence of confining pressure grouped by:5 MPa (H), 10 MPa (G), 20 MPa (F), 40 MPa (E).
The characteristics of stress drop during fault activation are correlated with the stress field distribution on the fault plane. Under lower
4.3 Correlation between fault stick-slip and slip rate
The correlation between the rate of faults and stress forms the basis for studying fault instability. During the specimen loading process, the radial deformation of the specimen is mainly influenced by three factors: first, lateral expansion during loading, primarily controlled by the material’s inherent Poisson’s ratio; second, the main fracture produced by sandstone failure under the influence of low-angle faults, and the deformation caused by continuous opening of fractures; third, the relative sliding between pre-existing faults under the influence of high-angle fault sliding. For
where ∆s is the fault slip displacement, ∆l is the circumferential displacement during the slip stage, r is the radius of the cylindrical sample. The slip rate of the fault is defined as the first derivative of displacement with respect to time. Figures 11A–C present the variations in fault displacement and slip rate during fault sliding processes at different β angles,
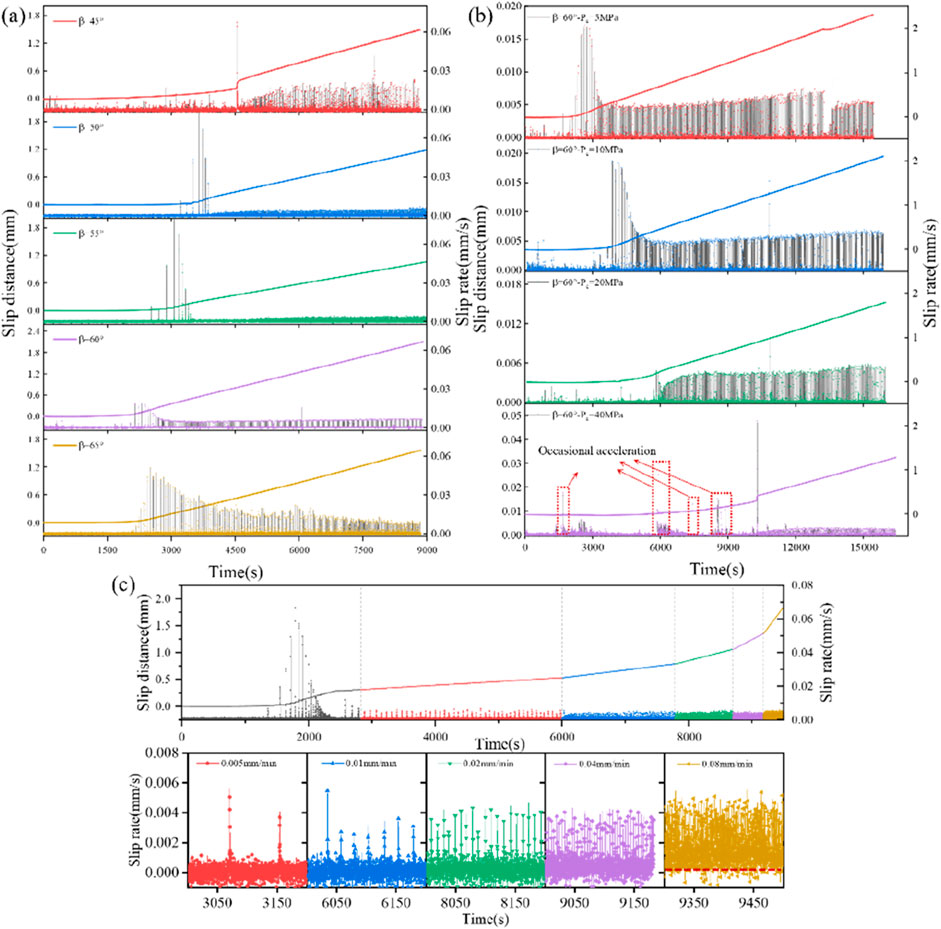
Figure 11. Slip rate and displacement of laboratory fault grouped by: various dip angles (A), various confining pressure (B), various loading rate (C).
Each fault stick-slip event is accompanied by stress drop and acceleration/deceleration of the fault, since there is a positive correlation between fault slip rate and stress drop (Guerin-Marthe et al., 2023). This results in a higher slip rate during fault activation for lower
4.4 Correlation with underground engineering
Although our study was conducted in a laboratory, work on rock damage processes from the laboratory-scale to the Earth-scale is very common (Ke et al., 2018; Xu et al., 2023). Our observations indicate that low-dip faults cause significant stress accumulation within the surrounding rock mass, resulting in increased damage to the rock mass and expanding the extent of the fracture zone around the fault core. This not only reduces the stability of the surrounding rock mass in projects (Su et al., 2017), but also increases the porosity and permeability of the rock mass (Hou et al., 2024), raising the risk of water and mud surges (Zhang et al., 2024) in mines, tunnels and other projects. High-dip faults have a stronger tendency to slip, and sudden fault activation may trigger localized seismic shaking (Cao et al., 2024). In addition, as resource extraction goes deeper (Wang et al., 2017), high confining pressure in deep can places faults under greater critical stress, which may lead to localized rupture and episodic acceleration. There is also greater rupture velocity when the fault is fully activated. Furthermore, due to the stress field in deep rock masses (Pan et al., 2023), stress redistribution caused by fault destabilization (Ju et al., 2022) lead to dynamic hazards such as rockbursts and coal and gas outbursts (Bai et al., 2022). The laboratory loading rate reflects the construction speed and excavation cycle of underground projects (Liu et al., 2024), and the choice of construction strategies influences the stress and slip states of the fault (Rasouli et al., 2011). Therefore, geological exploration and monitoring should be emphasized in the design and construction of underground engineering. During construction, excavation progress and roadway support design should be adapted to the specific geological conditions. Additionally, emergency measures should be designed and optimized. These measures are essential to ensure the stability of the fault and the safety of the corresponding underground engineering.
5 Conclusion
In this study, triaxial compression tests were conducted on sandstone containing gypsum faults. Test conditions with different fault dip angles, confining pressures and loading rates were examined, leading to the following conclusions:
(1) The dip angle of the fault significantly influences the failure strength and fracture mode of the saw-cut specimens. Specimens with dip angles of 0°–40° mainly fracture along the main crack through the gypsum fault, and the strength decreases linearly with increasing dip angle. Specimens with dip angles of 45°–65° fracture and slip along fractures in both the sandstone plane and the gypsum fault. Fractures within the gypsum fault, along with stress rotation, cause discrepancies between theoretical analysis and measured shear strength values.
(2) Normal stress magnitude and surface roughness on the fault plane influence the occurrence of four primary stick-slip modes during fault activation. The increase in normal stress causes the roughness of the sandstone layer to increase while that of the gypsum layer decreases, making slicken line on the sandstone layer more prominent.
(3) The maximum slip rate of a fault is related to the maximum stress drop at activation. The dip angle of faults and confining pressure influence the maximum slip rate. An increase in the loading rate affects the fault stick-slip cycle period, and the slip mode of the fault transitions from stick-slip to stable-slip as the loading rate increases.
(4) This study emphasizes the impact of fault dip, confining pressure, and loading rate on rock mass stability in underground engineering. Low-dip faults increase damage, porosity, and permeability, while high-dip faults may trigger seismic shaking and rupture more rapidly under higher confining pressure. Additionally, the loading rate affects the fault’s slip state, highlighting the importance of geological monitoring and strategic planning to ensure safety.
Data availability statement
The original contributions presented in the study are included in the article/supplementary material, further inquiries can be directed to the corresponding author.
Author contributions
HL: Conceptualization, Data curation, Formal Analysis, Writing–original draft, Writing–review and editing. HS: Conceptualization, Project administration, Resources, Supervision, Writing–review and editing. ZY: Supervision, Writing–review and editing. DX: Conceptualization, Investigation, Writing–original draft.
Funding
The author(s) declare that financial support was received for the research, authorship, and/or publication of this article. This study was supported by the National Natural Science Foundation of China (51874054); National Key R&D Program of China (2023YFC3009001).
Conflict of interest
The authors declare that the research was conducted in the absence of any commercial or financial relationships that could be construed as a potential conflict of interest.
Generative AI statement
The author(s) declare that no Generative AI was used in the creation of this manuscript.
Publisher’s note
All claims expressed in this article are solely those of the authors and do not necessarily represent those of their affiliated organizations, or those of the publisher, the editors and the reviewers. Any product that may be evaluated in this article, or claim that may be made by its manufacturer, is not guaranteed or endorsed by the publisher.
References
An, M. K., Zhang, F. S., Min, K. B., Elsworth, D., Marone, C., and He, C. R. (2021). The potential for low-grade metamorphism to facilitate fault instability in a geothermal reservoir. Geophys. Res. Lett. 48 (11). doi:10.1029/2021gl093552
Bai, J. Z., Dou, L. M., Li, J. Z., Zhou, K. Y., Cao, J. R., and Kan, J. L. (2022). Mechanism of coal burst triggered by mining-induced fault slip under high-stress conditions: a case study. Front. Earth Sci. 10. doi:10.3389/feart.2022.884974
Ban, L. R., Zhu, C., Hou, Y. H., Du, W. S., Qi, C. Z., and Lu, C. S. (2023). A method to predict the peak shear strength of rock joints based on machine learning. J. Mt. Sci. 20 (12), 3718–3731. doi:10.1007/s11629-023-8048-z
Ben-Zion, Y., and Sammis, C. G. (2003). Characterization of fault zones. Pure Appl. Geophys. 160 (3-4), 677–715. doi:10.1007/pl00012554
Bolton, D. C., Shreedharan, S., McLaskey, G. C., Riviere, J., Shokouhi, P., Trugman, D. T., et al. (2022). The high-frequency signature of slow and fast laboratory earthquakes. J. Geophys. Research-Solid Earth 127 (6), e2022JB024170. doi:10.1029/2022jb024170
Brace, W. F., and Byerlee, J. D. (1966). Stick-slip as a mechanism for earthquakes. Science 153 (3739), 990–992. doi:10.1126/science.153.3739.990
Brantut, N., Passelegue, F. X., Deldicque, D., Rouzaud, J.-N., and Schubnel, A. (2016). Dynamic weakening and amorphization in serpentinite during laboratory earthquakes. Geology 44 (8), 607–610. doi:10.1130/g37932.1
Buijze, L., Guo, Y., Niemeijer, A. R., Ma, S., and Spiers, C. J. (2021). Effects of heterogeneous gouge segments on the slip behavior of experimental faults at dm scale. Earth Planet. Sci. Lett. 554, 116652. doi:10.1016/j.epsl.2020.116652
Cao, S. T., Zhang, F. S., An, M. K., and Yasuhara, H. (2024). Effects of particle size and normal stress on the frictional stability and healing of simulated basalt gouges: implications for lunar seismicity. Rock Mech. Rock Eng. 57 (12), 10895–10910. doi:10.1007/s00603-024-04070-7
Choi, J. H., Edwards, P., Ko, K., and Kim, Y. S. (2016). Definition and classification of fault damage zones: a review and a new methodological approach. Earth-Science Rev. 152, 70–87. doi:10.1016/j.earscirev.2015.11.006
Cvitanovic, N. S., Nikolic, M., and Ibrahimbegovic, A. (2015). Influence of specimen shape deviations on uniaxial compressive strength of limestone and similar rocks. Int. J. Rock Mech. Min. Sci. 80, 357–372. doi:10.1016/j.ijrmms.2015.10.008
Delle Piane, C., Giwelli, A., Ben Clennell, M., Esteban, L., Kiewiet, M., Kiewiet, L., et al. (2016). Frictional and hydraulic behaviour of carbonate fault gouge during fault reactivation - an experimental study. Tectonophysics 690, 21–34. doi:10.1016/j.tecto.2016.07.011
Fagereng, Å., Remitti, F., and Sibson, R. H. J. N. G. (2010). Shear veins observed within anisotropic fabric at high angles to the maximum compressive stress. Nat. Geosci. 3 (7), 482–485. doi:10.1038/ngeo898
Giorgetti, C., Tesei, T., Scuderi, M. M., and Collettini, C. (2019). Experimental insights into fault reactivation in gouge-filled fault zones. J. Geophys. Research-Solid Earth 124 (4), 4189–4204. doi:10.1029/2018jb016813
Guerin-Marthe, S., Kwiatek, G., Wang, L., Bonnelye, A., Martinez-Garzon, P., and Dresen, G. (2023). Preparatory slip in laboratory faults: effects of roughness and load point velocity. J. Geophys. Research-Solid Earth 128 (4). doi:10.1029/2022jb025511
Hou, W. T., Ma, D., Liu, X. W., and Zhang, J. X. (2024). Experimental study on hydraulic and mechanical properties of fault rock under the thermal-hydraulic-mechanical coupling. Geothermics 119, 102975. doi:10.1016/j.geothermics.2024.102975
Jaeger, J. J. G. m. (1960). Shear failure of anistropic rocks. Geol. Mag. 97 (1), 65–72. doi:10.1017/s0016756800061100
Ji, Y., Wu, W., and Zhao, Z. (2019). Unloading-induced rock fracture activation and maximum seismic moment prediction. Eng. Geol. 262, 105352. doi:10.1016/j.enggeo.2019.105352
Ji, Y. L., Hofmann, H., Duan, K., and Zang, A. (2022). Laboratory experiments on fault behavior towards better understanding of injection-induced seismicity in geoenergy systems. Earth-Science Rev. 226, 103916. doi:10.1016/j.earscirev.2021.103916
Ju, Y., Wan, C. B., Fu, G. M., Ren, Z. Y., Mao, L. T., and Chiang, F. P. (2022). Effects of near-fault stress evolution and surface asperities on rough fault slip: an evaluation based on photoelastic shear tests and additively printed models. Eng. Geol. 305, 106715. doi:10.1016/j.enggeo.2022.106715
Kang, Y. S., Geng, Z., Liu, B., and Huang, Y. Q. (2024). Experimental investigation on fluid-induced slip behavior of fault filled with fault gouge. J. Rock Mech. Geotechnical Eng. 16 (9), 3661–3672. doi:10.1016/j.jrmge.2024.02.022
Ke, C. Y., McLaskey, G. C., and Kammer, D. S. (2018). Rupture termination in laboratory-generated earthquakes. Geophys. Res. Lett. 45 (23), 12784–12792. doi:10.1029/2018gl080492
Leeman, J. R., Saffer, D. M., Scuderi, M. M., and Marone, C. (2016). Laboratory observations of slow earthquakes and the spectrum of tectonic fault slip modes. Nat. Commun. 7, 11104. doi:10.1038/ncomms11104
Li, H. X., Yan, C. G., Shi, Y. L., Lan, H. X., Bao, H., Sun, W. F., et al. (2024a). Failure mechanism and stability evaluation of rockslides with oblique intersecting faults as well as mitigation measures for slope - top platform collapse. Landslides. doi:10.1007/s10346-024-02416-4
Li, Y. T., Fukuyama, E., and Yoshimitsu, N. (2024b). Mining-induced fault failure and coseismic slip based on numerical investigation. Bull. Eng. Geol. Environ. 83 (10), 386. doi:10.1007/s10064-024-03888-3
Liu, H., Si, H., Xu, D. Y., and Long, K. (2024). Laboratory investigation on slip behaviors of fault induced by cyclic confining pressure. Eng. Geol. 337, 107575. doi:10.1016/j.enggeo.2024.107575
Long, K., Zhang, Z. Y., Li, S. H., Li, K., and Luo, Y. (2022). The roles of crack development and water in stress rotation and fault weakening. Tectonophysics 823, 229190. doi:10.1016/j.tecto.2021.229190
Mei, C., Mercuri, M., and Rudnicki, J. W. (2024). Rock friction experiments and modeling under hydrothermal conditions. Earth-Science Rev. 254, 104824. doi:10.1016/j.earscirev.2024.104824
Meng, F. Z., Yue, Z. F., Li, M. Z., Han, J. H., Cai, Q. J., Wang, W., et al. (2023). Frictional sliding behaviour of rough fracture in granite under true triaxial loading with implications for fault reactivation. Rock Mech. Rock Eng. 57, 197–217. doi:10.1007/s00603-023-03561-3
Nilsen, B. (2021). Challenges and some recommendations related to estimation of in-situ swelling pressure of gouge materials. Rock Mech. Rock Eng. 54 (9), 5141–5147. doi:10.1007/s00603-021-02551-7
Niu, L. L., Zhu, W. C., Liu, X. G., Wang, J., Liu, K., and Chen, T. Y. (2024). Shear creep deformation of rock fracture distrubed by dynamic loading. Int. J. Rock Mech. Min. Sci. 183, 105943. doi:10.1016/j.ijrmms.2024.105943
Pan, W. H., Li, Y. P., Zhang, C., Shi, X. S., Cui, H., Wang, B., et al. (2023). Coal burst prevention technology and engineering practice in ordos deep mining area of China. Sustainability 15 (1), 159. doi:10.3390/su15010159
Rasouli, V., Pallikathekathil, Z. J., and Mawuli, E. (2011). The influence of perturbed stresses near faults on drilling strategy: a case study in Blacktip field, North Australia. J. Petroleum Sci. Eng. 76 (1-2), 37–50. doi:10.1016/j.petrol.2010.12.003
Ren, D. (2024). Friction stabilities of gypsum and kaolinite/calcite mixture fault gauges under high pressure. Front. Earth Sci. 11, 1346880. doi:10.3389/feart.2023.1346880
Ruggieri, R., Scuderi, M. M., Trippetta, F., Tinti, E., Brignoli, M., Mantica, S., et al. (2021). The role of shale content and pore-water saturation on frictional properties of simulated carbonate faults. Tectonophysics 807, 228811. doi:10.1016/j.tecto.2021.228811
Sibson, R. H. (1985). A note on fault reactivation. J. Struct. Geol. 7 (6), 751–754. doi:10.1016/0191-8141(85)90150-6
Su, H. J., Jing, H. W., Zhao, H. H., Yu, L. Y., and Wang, Y. C. (2017). Strength degradation and anchoring behavior of rock mass in the fault fracture zone. Environ. Earth Sci. 76 (4), 179. doi:10.1007/s12665-017-6501-4
Tse, R., and Cruden, D. M. (1979). Estimating Joint Roughness Coefficients. Int. J. Rock Mech. Min. Sci. 16 (5), 303–307. doi:10.1016/0148-9062(79)90241-9
Wang, H., Li, H. B., Si, J. L., Sun, Z. M., and Huang, Y. (2014). Internal structure of the Wenchuan earthquake fault zone, revealed by surface outcrop and WFSD-1 drilling core investigation. Tectonophysics 619, 101–114. doi:10.1016/j.tecto.2013.08.029
Wang, L., Kwiatek, G., Renard, F., Guérin-Marthe, S., Rybacki, E., Bohnhoff, M., et al. (2024). Fault roughness controls injection-induced seismicity. Proc. Natl. Acad. Sci. U. S. A. 121 (3), e2310039121. doi:10.1073/pnas.2310039121
Wang, L., Liu, S. M., Cheng, Y. P., Yin, G. Z., Zhang, D. M., and Guo, P. K. (2017). Reservoir reconstruction technologies for coalbed methane recovery in deep and multiple seams. Int. J. Min. Sci. Technol. 27 (2), 277–284. doi:10.1016/j.ijmst.2017.01.026
Wu, J., Liu, L., Deng, Y. F., Zhang, G. P., Zhou, A. N., and Xiao, H. L. (2022). Use of recycled gypsum in the cement-based stabilization of very soft clays and its micro-mechanism. J. Rock Mech. Geotechnical Eng. 14 (3), 909–921. doi:10.1016/j.jrmge.2021.10.002
Wu, W., Zhao, Z. H., and Duan, K. (2017). Unloading-induced instability of a simulated granular fault and implications for excavation-induced seismicity. Tunn. Undergr. Space Technol. 63, 154–161. doi:10.1016/j.tust.2017.01.002
Wu, X. C., Li, Z. G., Yang, X., Sun, C., Wang, W. T., Almeida, R., et al. (2023). Quantifying and modeling curved thrust fault-propagation folds at different scales. J. Struct. Geol. 172, 104888. doi:10.1016/j.jsg.2023.104888
Wynants-Morel, N., De Barros, L., and Cappa, F. (2021). Sensitivity of the seismic moment released during fluid injection to fault hydromechanical properties and background stress. Front. Earth Sci. 9. doi:10.3389/feart.2021.638723
Xu, S. Q., Fukuyama, E., Yamashita, F., Kawakata, H., Mizoguchi, K., and Takizawa, S. (2023). Fault strength and rupture process controlled by fault surface topography. Nat. Geosci. 16(1), 94–100. doi:10.1038/s41561-022-01093-z
Yaghoubi, A., Dusseault, M. B., and Leonenko, Y. (2022). Injection-induced fault slip assessment in montney formation in western Canada. Sci. Rep. 12 (1), 11551. doi:10.1038/s41598-022-15363-8
Yu, B. W., Chen, J. Y., Spiers, C. J., Ma, S. L., Zhang, M., Qi, W. B., et al. (2024). Frictional properties of simulated fault gouges subject to normal stress oscillation and implications for induced seismicity. J. Geophys. Research-Solid Earth 129 (9). doi:10.1029/2024jb029521
Zhang, C. Q., Xu, J., Jin, S. J., Cui, G. J., Guo, Y. H., and Li, L. Y. (2023). Sliding modes of fault activation under constant normal stiffness conditions. J. Rock Mech. Geotechnical Eng. 15 (5), 1213–1225. doi:10.1016/j.jrmge.2022.08.005
Zhang, F. S., An, M. K., Zhang, L. Y., Fang, Y., and Elsworth, D. (2019). The role of mineral composition on the frictional and stability properties of powdered reservoir rocks. J. Geophys. Research-Solid Earth 124 (2), 1480–1497. doi:10.1029/2018jb016174
Zhang, S. C., Song, S. L., Meng, W. H., Li, Y. Y., and Shen, B. T. (2024). Mechanism and experimental investigation of sudden water inrush hazards in surrounding rock due to shear fracture in deep mining operations. Petroleum Sci. Technol., 1–18. doi:10.1080/10916466.2024.2325600
Zhang, X., and Sanderson, D. J. (2001). Evaluation of instability in fractured rock masses using numerical analysis methods: effects of fracture geometry and loading direction. J. Geophys. Research-Solid Earth 106 (B11), 26671–26687. doi:10.1029/2001jb000311
Zhong, Z., Xu, C. Q., Wang, L., Hu, Y. J., and Zhang, F. S. (2023). Experimental investigation on frictional properties of stressed basalt fractures. J. Rock Mech. Geotechnical Eng. 15 (6), 1457–1475. doi:10.1016/j.jrmge.2022.12.020
Zhu, C., Karakus, M., He, M. C., Meng, Q. X., Shang, J. L., Wang, Y., et al. (2022). Volumetric deformation and damage evolution of Tibet interbedded skarn under multistage constant-amplitude-cyclic loading. Int. J. Rock Mech. Min. Sci. 152, 105066. doi:10.1016/j.ijrmms.2022.105066
Keywords: fault strength, fault activation, STICK-SLIP, fault gouge, triaxial loading
Citation: Liu H, Si H, Yang Z and Xu D (2025) The activation and slip of laboratory faults containing gypsum gouge under triaxial stress conditions. Front. Earth Sci. 13:1504605. doi: 10.3389/feart.2025.1504605
Received: 01 October 2024; Accepted: 27 January 2025;
Published: 17 February 2025.
Edited by:
Nibir Mandal, Jadavpur University, IndiaCopyright © 2025 Liu, Si, Yang and Xu. This is an open-access article distributed under the terms of the Creative Commons Attribution License (CC BY). The use, distribution or reproduction in other forums is permitted, provided the original author(s) and the copyright owner(s) are credited and that the original publication in this journal is cited, in accordance with accepted academic practice. No use, distribution or reproduction is permitted which does not comply with these terms.
*Correspondence: Hu Si, c2lodUBjcXUuZWR1LmNu