 Xiaochuan Huang
 Jincang Liu
 Ting Yang
 Yun Li
 Lipeng Zhou
95% of researchers rate our articles as excellent or good
Learn more about the work of our research integrity team to safeguard the quality of each article we publish.
Find out more
ORIGINAL RESEARCH article
Front. Earth Sci. , 24 March 2025
Sec. Solid Earth Geophysics
Volume 13 - 2025 | https://doi.org/10.3389/feart.2025.1504304
Current research on geological disasters has predominantly focused on large-scale phenomena in specific regions, yet targeted safety evaluations and hazard identification for artificial slopes along mountainous highways remain underexplored, particularly through the application of Small Baseline Subset Interferometric Synthetic Aperture Radar (SBAS-InSAR). To address this gap, we employed the SBAS-InSAR methodology to analyze 44 Sentinel-1 SAR images spanning a highway slope region in Foshan City, Guangdong Province, integrating the slope’s construction timeline to temporally dissect deformation patterns and assess geological risks. Our results revealed a maximum annual average settlement rate of −35.69 mm/yr and a peak cumulative settlement of −28.9 mm, with deformation trends strongly correlated to construction phases—primarily concentrated between April 2022 and March 2023. Despite localized temporal disparities linked to varying construction schedules, the absence of large-scale anomalous settlement indicated robust geological conditions, while gradual stabilization suggested reduced long-term disaster risks. Spatially, settlement was concentrated at the slope base, accompanied by minor crest uplift. These findings underscore the critical role of SBAS-InSAR in monitoring infrastructure stability and mitigating environmental hazards. The study not only provides a practical framework for ensuring slope safety and sustainable highway operations but also advances methodologies for similar engineering projects, contributing to safer construction practices and informed disaster prevention strategies in geologically sensitive areas.
Slope stability is crucial in mountainous areas, river adjacent areas, and slope zones. The phenomenon of slope instability poses a serious threat to the lives and property of local residents and may affect the stability of road traffic infrastructure (Ding et al., 2020). Therefore, accurate deformation monitoring of slopes is crucial for analyzing the mechanism of landslide deformation (Zhu et al., 2022). Traditional deformation monitoring methods, such as leveling and GNSS, provide high precision and temporal resolution. However, they are limited by high costs, labor-intensive operations, and the inability to monitor large areas effectively. Additionally, D-InSAR is constrained by spatial-temporal decorrelation and atmospheric noise, which can reduce its reliability for long-term and precise monitoring (Zaki et al., 2014).
Differential Interferometric Synthetic Aperture Radar (D-InSAR) technology can obtain deformation information with high precision and high spatial resolution by processing two or more Synthetic Aperture Radar (SAR) images (Massonnet et al., 1993; Massonnet et al., 1996; Zebker et al., 1994). However, its measurement accuracy is often limited due to the interference factors such as spatial-temporal decorrelation and atmospheric noise (Dong et al., 2007; Zebker and Villasenor, 1992). To overcome these challenges, Small Baseline Subset-Interferometric Synthetic Aperture Radar (SBAS-InSAR) technology emerged as a powerful time-series analysis technique (Hooper et al., 2004; Berardino et al., 2002; Hooper et al., 2007). This technology is capable of significantly reducing or eliminating these influences, enabling millimeter-level accuracy in surface deformation measurements. The SBAS-InSAR method was originally proposed by Berardino et al. (2002), which combines InSAR technology with the Small Baseline Subset algorithm. By analyzing the phase differences in the interferometric radar signals, it achieves high-precision monitoring of surface deformation.
For the monitoring of artificial slopes in mountainous regions, the SBAS-InSAR method has more advantages compared to traditional D-InSAR technology, as it is able to overcome the limitations of spatial applications (Carlà et al., 2018; Dick et al., 2015). The SBAS-InSAR technology has conducted fruitful explorations in various fields such as surface deformation monitoring (Tizzani et al., 2007; Chen et al., 2021), permafrost research (Zhao et al., 2016), landslide detection and mapping (Zhao et al., 2019; Yao et al., 2022), and coastal subsidence monitoring (Xu et al., 2016).
In the application of mountainous slopes, scholars have utilized SBAS-InSAR technology in conjunction with different models and methods, such as the Weight of Evidence (WoE) model, Logistic Regression (LR) model, and Support Vector Machine (SVM), to conduct in-depth research on landslide susceptibility (Xie et al., 2017). Pang et al. (2023) monitored the surface deformation of the Banqiao Reservoir using SBAS-InSAR technology and analyzed the spatiotemporal deformation characteristics of the dam, providing valuable references for local sustainable development and geological disaster prevention. Additionally, Du et al. (2021) monitored deformations in the alpine mining area of the Tianshan Mountains using SBAS-InSAR technology and compared the results with GNSS, demonstrating significant practical value in their research findings.
Despite the numerous studies focusing on large-scale geological disasters in specific regions, targeted research using SBAS-InSAR technology for safety evaluation and hazard identification of artificial slopes along regional mountain highways is still relatively scarce. Therefore, this paper adopts the time-series SBAS-InSAR technology to conduct an in-depth analysis of geological disaster risks and slope stability in a slope area along a major highway in Foshan City, Guangdong Province, and proposes corresponding countermeasures. This work not only has important practical significance by providing scientific evidence for engineers and decision-makers to reduce disaster risks and ensure the safety of construction and road use, but also actively contributes to promoting the safe construction and sustainable development of similar projects. Furthermore, This study provides insights into the application of SBAs technology for monitoring artificialslopes along mountain roads, contributing to the growing body of research on slope stability.
The slope was chosen for its proximity to a major highway and its role as a critical infrastructure element. its susceptibility to deformation due to ongoing construction activities makes it a valuable case study for applying SBAS-InSAR technology. The first phase of the ongoing highway construction project follows an overall north-south alignment, with a total route length of approximately 1.83 km. It adopts the standard of a Class I highway while also accommodating urban road functions, featuring a dual-6-lane main carriageway accompanied by a dual-4-lane auxiliary road layout. The red line width is 60 m, with a design speed of 80 km/h for the main carriageway and 50 km/h for the auxiliary road.
The slope area to the right of the first phase of the highway construction project serves as the primary research object of this paper. The highway is located in Gaoming District, Foshan City, Guangdong province. The slope area faces east-west, constructed based on the original mountain terrain with the peak located in the east and the foot in the west. Its location is illustrated in Figure 1A. This region exhibits a hilly and mountainous landform, covered densely with vegetation, as shown in the optical image in Figure 1B. To ensure data processing efficiency and result accuracy, the study area has been expanded to approximately 10 km by 11 km in size. The Digital Elevation Model (DEM) of the study area is presented in Figure 1C.
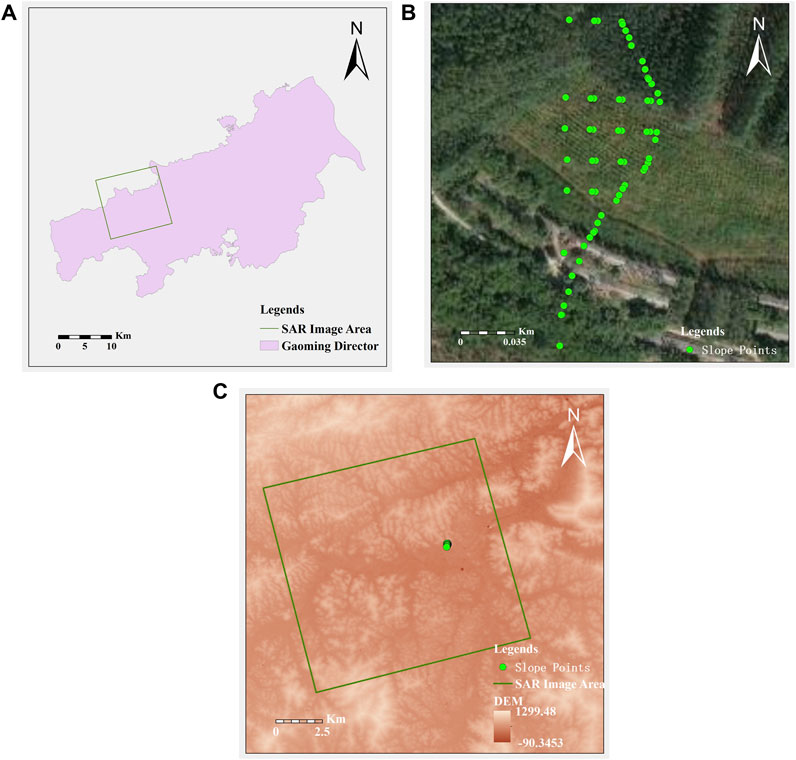
Figure 1. Basic Information of Study Area. (A) The slope location in Gaoming District. (B) Optical imagery of slope area. (C) Study area ALOS World 3D 30 m DEM.
The geology of the area is mainly formed during the Jurassic Late Period, the Yanshan Movement, with a lot of granite intrusion. Therefore, the rock composition of the area is mainly granite, which has high hardness and corrosion resistance. The soil types in the area are diverse, mainly including sandy soil and red soil. Sandy soil is mainly distributed in the cultivated area, while mountains are mainly composed of red soil. Red soil is a typical subtropical soil with strong acidity and good water retention.
The target area is located in the second structural unit of the Wuyi-Yunkai-Taiwan orogenic system, and has undergone various geological evolutionary cycles, forming a distinct geological background. The main structural features include folds and faults, characterized by a set of multiple faults forming a fault structure belt. The fault structure has the characteristic of multi-stage activity, with the main formation period being the Caradocian to Yanshanian. The neotectonic movement mainly manifests as differential uplift of the basement blocks. Therefore, the geological stability of the area may be affected by these geological activities, and has a certain degree of activity.
For this data processing, SAR imagery from the Sentinel-1A satellite of the European Space Agency (ESA) was selected. With a range resolution of 5 m and an azimuth resolution of 12 m, this radar satellite is suitable for the current study (Yang et al., 2015). Considering factors such as the imaging range and ground resolution, this research employs SAR imagery in Interferometric Wide Swath (IW) mode for InSAR inversion. To investigate surface deformation in the highway slope area and analyze its causes, while achieving satisfactory monitoring results, a total of 44 Sentinel-1A (S1A) radar satellite ascending orbit images acquired over the past 2 years were used for SBAS data processing. The time span covers from 9 January 2022, to 15 July 2023, with a temporal interval of 12 days. The SAR data from the Sentinel-1A satellite were all acquired in the dual-polarization mode of the Interferometric Wide Swath (IW) mode, with an image resolution of 5 m in range and 20 m in azimuth.
For this settlement monitoring, it is necessary to perform processes such as removing the flat-earth effect, estimating and removing topographic phases, and correcting orbital errors. The DEM used for these purposes is based on the 30-m resolution high-precision Digital Surface Model (DSM) produced by the Japanese Advanced Land Observing Satellite (ALOS). Both the planar and elevation accuracy of this DSM reach 5 m, ensuring the reliability of the subsequent InSAR analysis.
Orbit data plays a crucial role in InSAR data processing, significantly impacting everything from image registration to the generation of deformation maps. By using precise orbit determination (POD) ephemeris data to correct the orbit information, systematic errors arising from orbital errors can be effectively removed. For this processing, POD precise orbit ephemeris data were utilized to refine the orbit information.
The SBAS-InSAR (Small Baseline Subset InSAR) method involves processing the collected SAR image dataset by applying specific temporal and spatial baseline thresholds to obtain an appropriate number of small baseline data subsets. These subsets are then used to derive deformation rates through least squares estimation. Subsequently, deformation information is calculated using singular value decomposition (SVD), resulting in time-series deformation measurements (Li and Xue, 2013; Zhang et al., 2020). This approach enables the extraction of deformation patterns over time, providing valuable insights into the stability and potential hazards associated with the highway slope area. The SBAS-InSAR method addresses the issue of decorrelation caused by long baselines by selectively processing a series of interferometric image pairs with small baselines (spatial distances). This approach effectively improves the accuracy of deformation data and enhances the temporal and spatial resolution of deformation monitoring (Gao et al., 2020; Sun et al., 2016; Hu et al., 2010). By focusing on smaller baseline pairs, SBAS-InSAR is able to maintain coherence over longer time intervals, allowing for more reliable and detailed deformation measurements over the study area.
For this study, based on the selected 44 Sentinel-1 SAR images, a temporal baseline threshold of 120 days and a spatial baseline threshold of 5% were set. The corresponding temporal and spatial baseline connections are illustrated in Figure 2. Given that approximately 75% of the Foshan Avenue slope area is covered by vegetation, which can lead to low coherence, a coherence threshold of 0.15 was established to obtain better interferometric and phase unwrapping results. Interferometric points with coherence values below 0.15 were masked out to improve the overall quality of the deformation analysis.
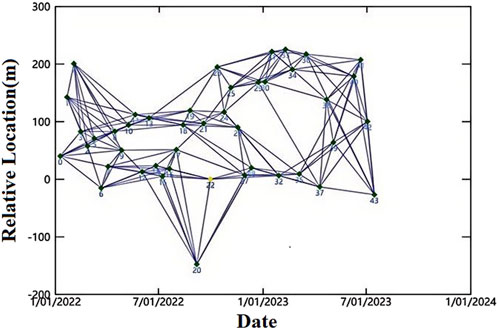
Figure 2. Temporal baseline connection diagram.
In this study, a multi-look ratio of 5:1 was employed. Multi-looking is a process that averages the resolution in both the range and azimuth directions of the image, which helps to suppress speckle noise in the Single Look Complex (SLC) images and results in SAR images with higher spatial resolution. Additionally, the Goldstein filtering method was used to enhance the clarity of the interferometric fringes and reduce noise caused by spatial or temporal decorrelation, thus improving the overall quality of the deformation maps.
After the removal of the flat-earth effect and filtering of the phases, phase unwrapping is performed to resolve the 2π ambiguity issue. For this study, the Delaunay Minimum Cost Flow (MCF) unwrapping method was utilized, which is effective in handling two isolated regions with high coherence, leading to better results. This method only unwraps pixels that exceed the “unwrapping coherence threshold,” ensuring that only reliable phase information is used in the subsequent deformation analysis.
In the iterative approach to multi-looking and decimation of data, the interferogram is unwrapped at a lower resolution and then resampled back to its original resolution. While this method can significantly increase processing time, it also tends to yield higher accuracy results. It's important to note that setting a higher decomposition level can improve overall performance (e.g., faster data processing), but it may introduce local discontinuities. Conversely, setting a very high decomposition level may lead to false signals. Therefore, in this study, a decomposition level of one was chosen to balance processing speed and result quality.
By employing the SBAS technique, an annual average ground deformation rate map for the study area from January 2022 to July 2023 was derived, as shown in Figure 3. This map provides valuable insights into the deformation patterns and potential hazards in the highway slope area over the specified time period.
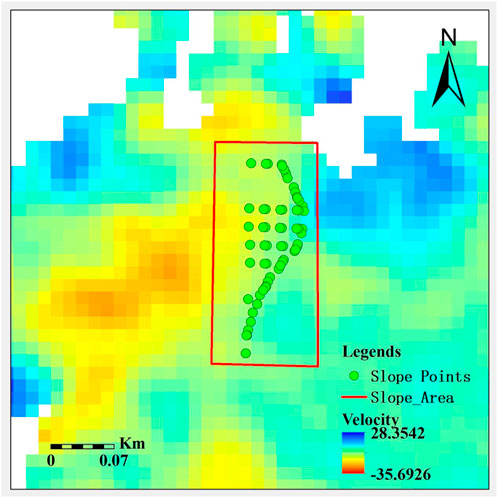
Figure 3. Annual mean deformation rate of SBAS in the study area.
As observed in Figure 3, most areas within the study region exhibit relative stability, with deformation rates ranging from −35.696 to 28.35 mm/yr. The SBAS vector output in SHP format contains comprehensive information calculated by the model, including coherence and historical deformation values for each point. According to the statistical analysis of the vector deformation rate data, as shown in Figure 4, 90.2% of the total have an average deformation rate of −20–20 mm/yr. Most areas remain within a small deformation range and exhibit a stable state.
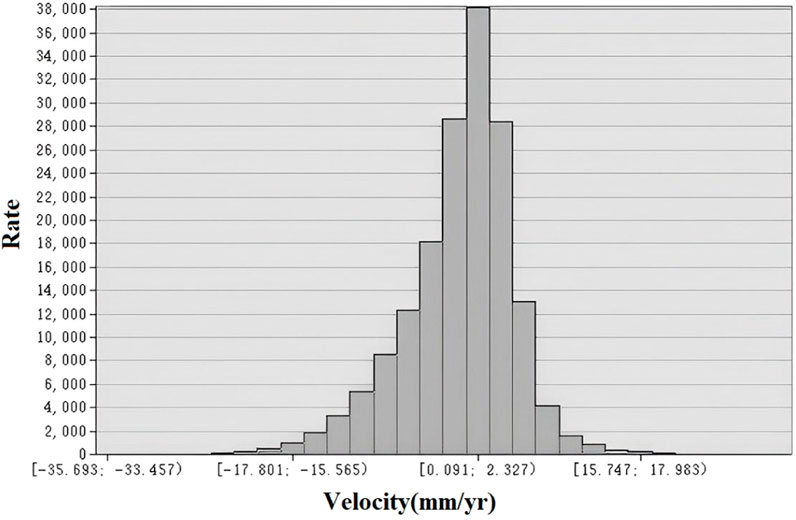
Figure 4. Vector average rate histogram.
In order to verify the accuracy of data processing results, we found Global Navigation Satellite System (GNSS) monitoring results for the target area from January 2023 for validation. At the same time, due to the impact of SAR image resolution, the SBAS-InSAR target point does not completely coincide with the GNSS point. So, for each GNSS point, we looked for the nearest InSAR point for comparison. The information of the ground verification points are as follows (Listed in Table 1). displacement represents the change in July 2023 compared to January 2023. The results show that there are differences between the InSAR target point and the GNSS point, but except for the two-point displacement difference of #6, which reaches 2.67 mm, the shape variable difference of the remaining points is less than 2 mm, which indicates that the accuracy of the InSAR processing results meets the analysis requirements.
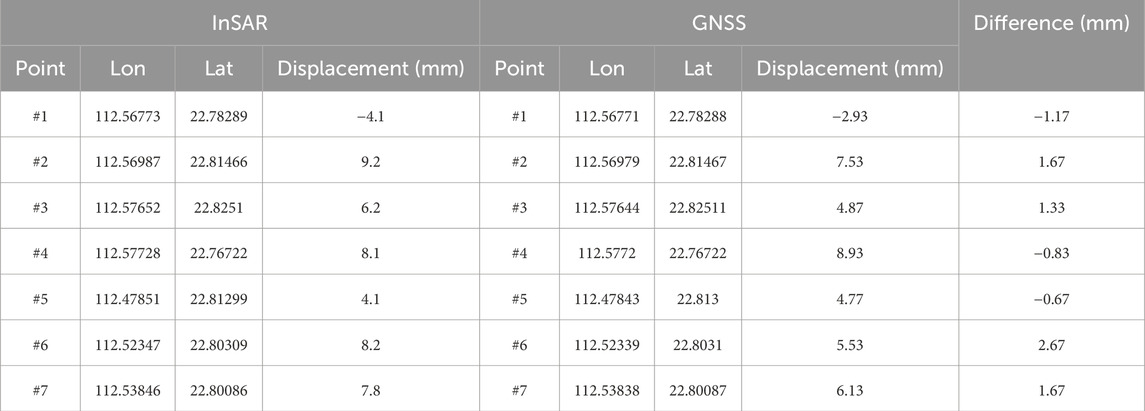
Table 1. Information of InSAR and GNSS points.
From the Figure 3, it is clear that there are no significant subsidence areas within the targeted slope region. Instead, At the summit of the slope, a minor deformation has been observed, with an annual variation between 1 mm of uplift and 1 mm of subsidence. Concurrently, along the middle edge of the slope, a mild subsidence phenomenon is detected, characterized by a rate of subsidence that fluctuates from −1.03 mm/yr to −2.79 mm/yr.At the bottom of the slope, a relatively larger deformation is evident, reaching a rate of −7.06 mm/yr. Based on the overall subsidence pattern of the target slope area, the slope has been divided into three parts for analysis: the bottom (A1), the middle (A2), and the top (A3), as illustrated in Figure 5. This segmentation will facilitate a more detailed examination of the deformation characteristics within each section of the slope.
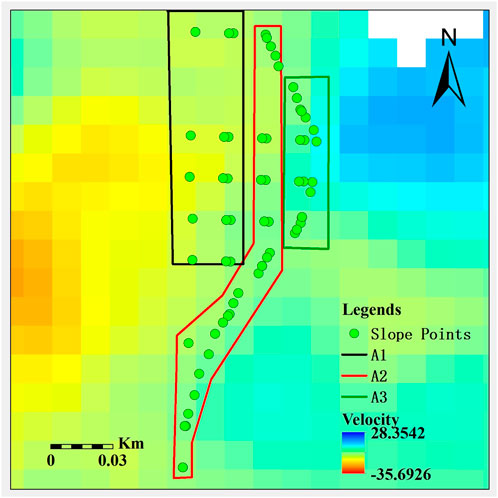
Figure 5. Position distribution of settlement regions A1-A3.
Figure 6 depicts the subsidence area A1 alongside a corresponding satellite image from May 2022. Area A1 represents a relatively uniform subsidence zone, with deformation rates ranging from −2.79 mm/yr to −7.05 mm/yr. This image provides a visual context for the observed subsidence pattern, aiding in the assessment of potential causes and implications of the observed deformation.
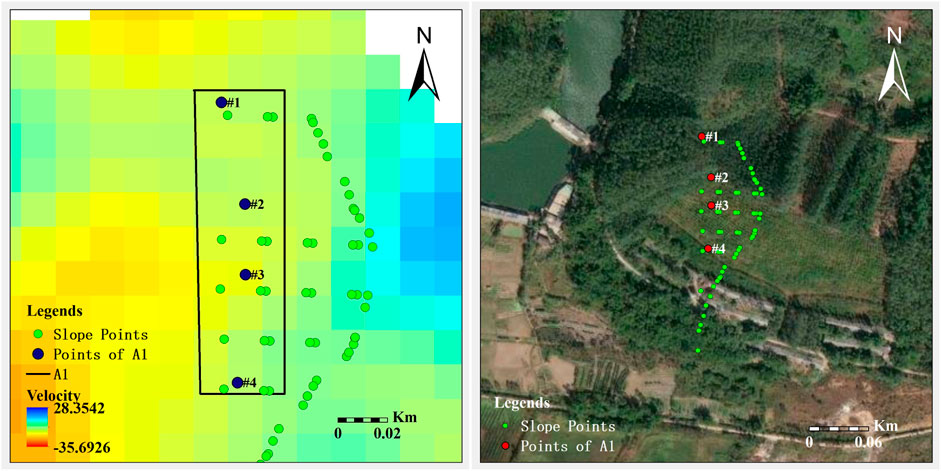
Figure 6. The bottom area of the slope.
Sampling points #1-#4 are selected in settlement region A1, and the coordinates of sampling points are shown in Table 2. Figure 7 is obtained through time series analysis, and it can be seen that the cumulative settlements during the monitoring period from 9 January 2022, to 15 July 2023, are as follows: −10.2 mm, +0.5 mm, −13.3 mm, and −5.2 mm, respectively. Notably, sampling point #4 experiences two significant subsidence events in May and September 2022, reaching a total subsidence of −22 mm before rapidly recovering. From January 2022 to January 2023, sampling point #4 shows an overall subsidence trend, followed by a slow uplift, resulting in a final settlement of −5 mm. Sampling point #1 experiences larger subsidence in May, July 2022, and January 2023, with a maximum of −19 mm, displaying an overall subsidence trend. Sampling point #3 remains stable until August 2022, then undergoes significant subsidence and uplift in September, October 2022, and January 2023, stabilizing at around −15 mm thereafter.

Table 2. Sample point details.
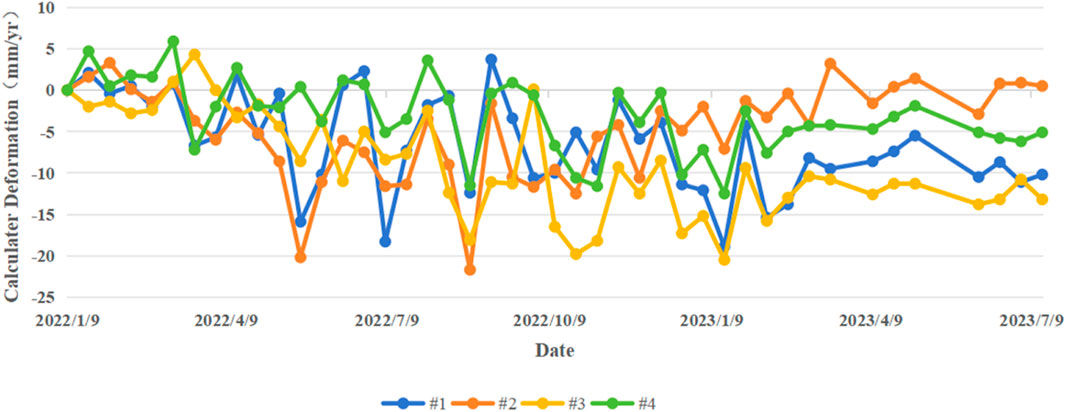
Figure 7. Time series deformation of sampling points #1∼#4.
The observed subsidence trends suggest that the region maintains a relatively stable state without experiencing rapid subsidence. Generally, significant deformations for all sampling points #1-#4 occur between May 2022 and March 2023, preceded by stable but slow subsidence and followed by stability after March 2023. Given these findings, the most likely cause of subsidence in the slope’s bottom region is attributed to slope construction activities. However, definitive conclusions require further analysis incorporating more extensive monitoring data over a longer period and considering the specific circumstances of the region.
Figure 8 presents the subsidence area A2 alongside a corresponding satellite image from May 2022. Area A2 exhibits a gradual subsidence pattern, with deformation rates ranging from −1.03 mm/yr to 4.79 mm/yr. Sampling points #5-#8 have been selected within this region, and their coordinates are listed in Table 3. The time series analysis results, as shown in Figure 9, reveal the cumulative settlements for these sampling points during the monitoring period from 9 January 2022, to 15 July 2023. Specifically, the cumulative settlements for sampling points #5-#8 are −4.5 mm, −0.5 mm, −2.3 mm, and −6 mm, respectively.
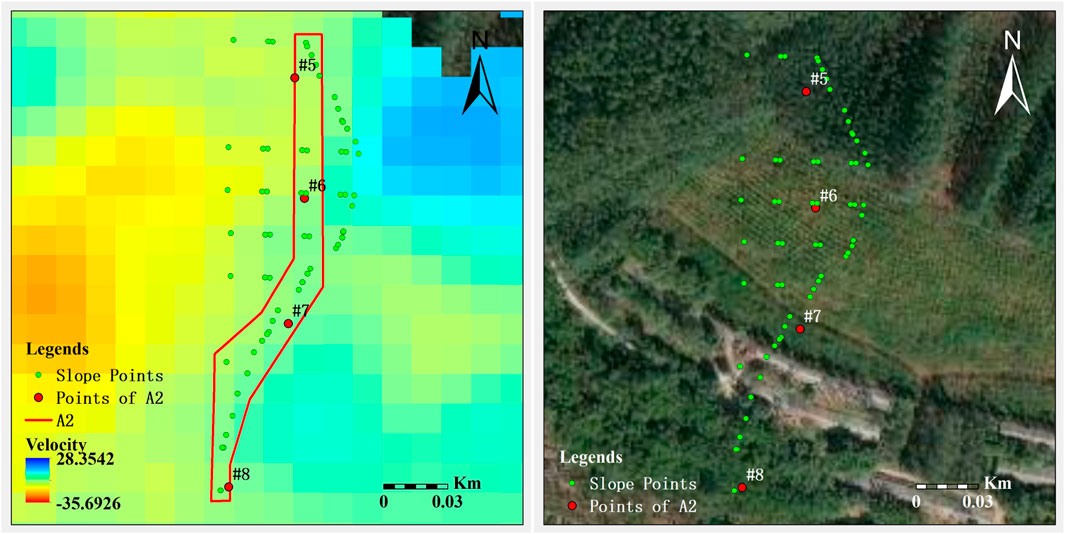
Figure 8. The middle area of the slope.
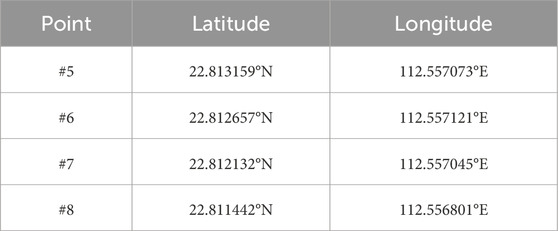
Table 3. Sample point details.
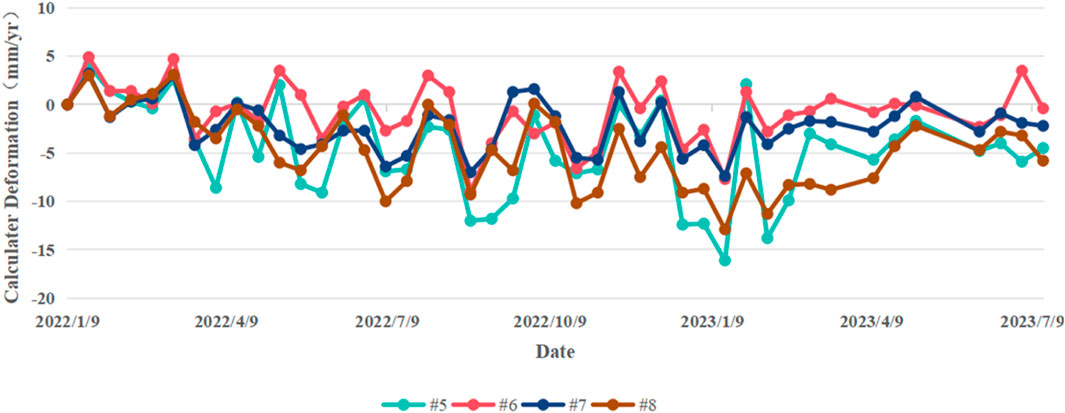
Figure 9. Time series deformation of sampling points #5∼#8.
These findings indicate that the subsidence in area A2 is relatively mild compared to area A1, with most sampling points experiencing minimal to moderate subsidence over the monitoring period. The stability of the subsidence rates and the lack of significant fluctuations suggest that the area is undergoing a gradual and controlled subsidence process, potentially due to natural geological processes or gradual adjustments related to slope stability measures. Further analysis and monitoring would be necessary to confirm the exact causes and potential implications of this subsidence.
Sampling point #6 experienced two notable subsidence events in August 2022 and January 2023, reaching a total subsidence of −9 mm, followed by a swift recovery and subsequent stabilization within a stable range. Sampling point #7 demonstrates a slight subsidence trend throughout the monitoring period, with no significant subsidence or uplift events. The maximum subsidence recorded for #7 is −6 mm, which eventually plateaus. Sampling points #5 and #8 exhibit similar subsidence patterns, although #5 consistently experiences greater subsidence than #8, with a maximum subsidence of −16 mm. Multiple instances of significant subsidence occurred between April 2022 and February 2023 for both points, ultimately stabilizing thereafter.
Based on the subsidence trends, it can be inferred that the region ultimately maintains a relatively stable state. Overall, sampling points #5-#8 underwent significant deformation between April 2022 and March 2023, preceded by a period of stable, slow subsidence before April 2022 and followed by stability after March 2023. The time series of these anomalous deformations coincides with the construction period in the slope region, leading to the conclusion that the observed deformation trends are likely attributed to construction activities.
Figure 10 depicts the subsidence area A3 alongside its corresponding satellite image from May 2022. Area A3 is considered a relatively stable region, exhibiting subsidence rates within the range of −2.79 mm/yr to +4.24 mm/yr. This indicates that the area experiences minimal vertical movement, which can be attributed to its geological stability or the absence of significant external factors causing subsidence or uplift. The narrow range of subsidence rates suggests that any deformation occurring in this area is gradual and likely due to natural processes such as soil consolidation or minor geological adjustments. The satellite image provides a visual context for the stability of the region, highlighting the absence of major changes or disruptions that could lead to significant subsidence.

Figure 10. The top area of the slope.
Figure 11, resulting from the time series analysis of sampling points #9-#11 (Listed in Table 4) in subsidence area A3, reveals the cumulative settlements during the monitoring period from 9 January 2022, to 15 July 2023. Despite being located in a relatively stable region (A3) with subsidence rates ranging from −2.79 mm/yr to +4.24 mm/yr, these sampling points exhibit distinct deformation patterns. Sampling point #9 shows a cumulative settlement of +6.5 mm, while #10 and #11 experience −1.5 mm and −8 mm, respectively.
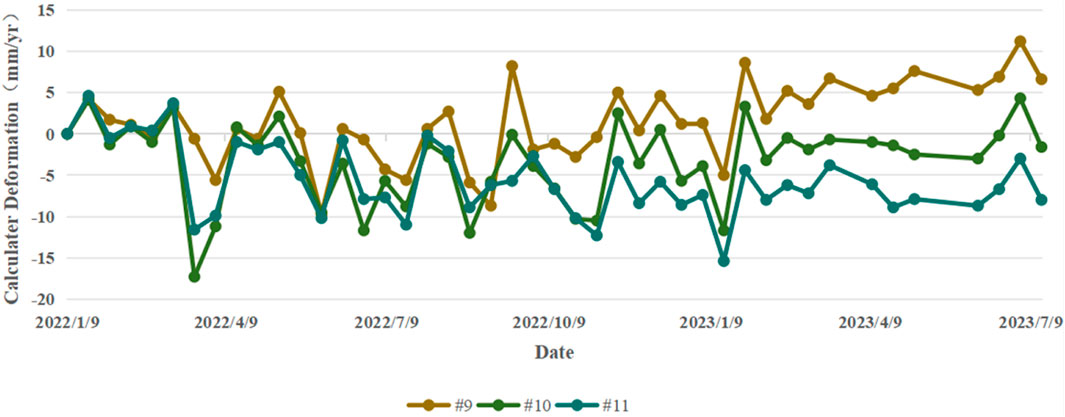
Figure 11. Time series deformation of sampling points #9∼#11.
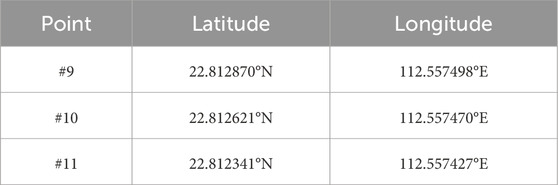
Table 4. Sample point details.
All three sampling points follow a similar trend of significant deformation occurring in April, July, September, November 2022, and January 2023. Notably, sampling point #10 experiences the most substantial subsidence, reaching a maximum of −17.5 mm, while #11 also undergoes significant subsidence of −15 mm. In contrast, sampling point #9 experiences repeated subsidence followed by uplift, resulting in an overall uplift trend from September 2022 to July 2023. Sampling points #10 and #11 stabilize by February 2023.
The observed deformation patterns, particularly the short-term rapid subsidence followed by stabilization or uplift, are likely attributed to construction activities at the top of the slope. During the construction of artificial slopes on mountainous terrain, the ground is often compacted, leading to rapid subsidence. Subsequently, backfilling and other construction measures can cause the ground to rebound or stabilize. This interpretation is supported by the coincidence of the deformation anomalies with the construction timeline in the slope region. Therefore, it can be inferred that the observed subsidence and uplift trends in sampling points #9-#11 are directly related to the construction activities in the area.
Figure 12 is a deformation map of the area with a large deformation range in the north-east and south-west directions of the target slope, which are named B1 and B2. The maximum settlement rate of area B1 reached −13.84 mm/yr, which was relatively high in the slope area. The lifting rate of the B2 area reaches +11.27 mm/yr, which is also important for the safety and stability of the slope area.
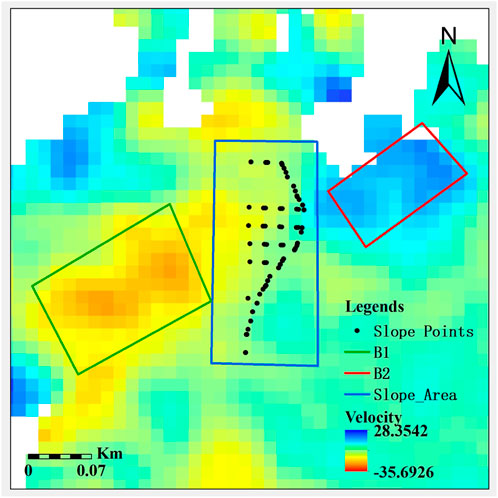
Figure 12. Deformation of the area near the slope.
Figure 13 shows the satellite images of subsidence area B1 and its corresponding locations in May 2022, and area B1 is a large subsidence area with a settlement rate of −4.79 mm/yr to −13.84 mm/yr.
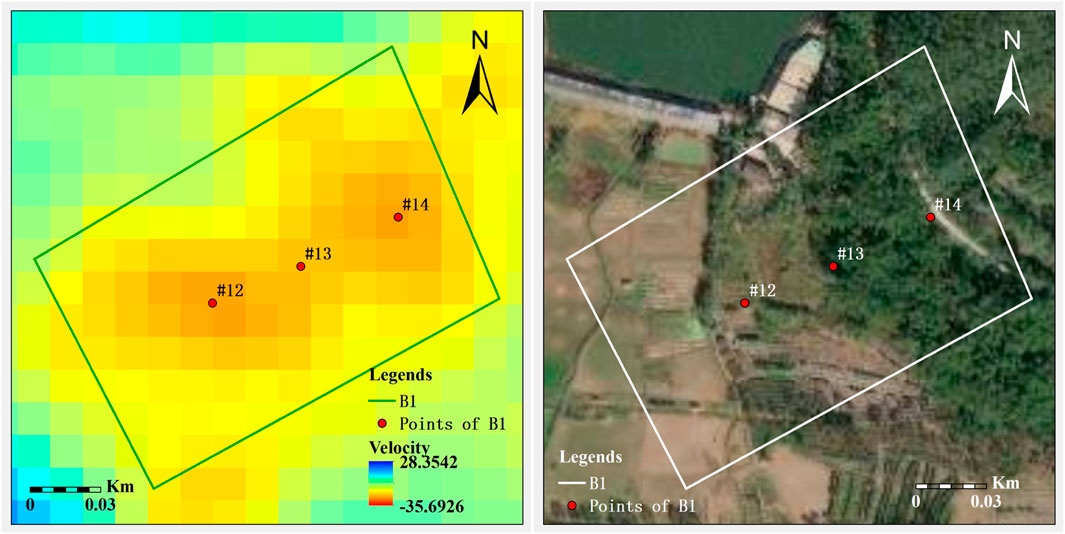
Figure 13. South-west B1 area of the slope.
Sampling points #12-#14 were selected in the settlement area B1, with their coordinates listed in Table 5. Through time series analysis, Figure 14 was obtained, revealing that during the monitoring period from 9 January 2022, to 15 July 2023, the cumulative settlements at sampling points #12-#14 were −14.5 mm, −8.9 mm, and −10.4 mm, respectively. From January 2022 to January 2023, sampling points #12-#14 all exhibited a downward trend with roughly consistent rates of decline. Sampling point #14 experienced the maximum cumulative settlement of −21 mm, although the settlement degrees at sampling points #12 and #14 were slightly more pronounced than that at #13. After January 2023, the settlement rates at all sampling points decreased, and the cumulative settlements rose slightly, fluctuating around −15 mm. Combining satellite imagery, it can be observed that area B1 is located at the foot of a hillside. Considering the slope construction activities, it is preliminarily speculated that the settlement phenomenon is attributed to the leveling of the hillside base.
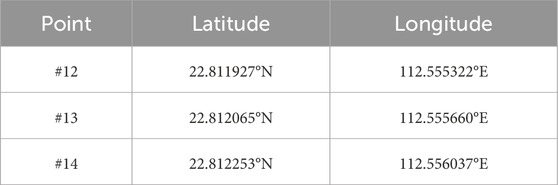
Table 5. Sample point details.
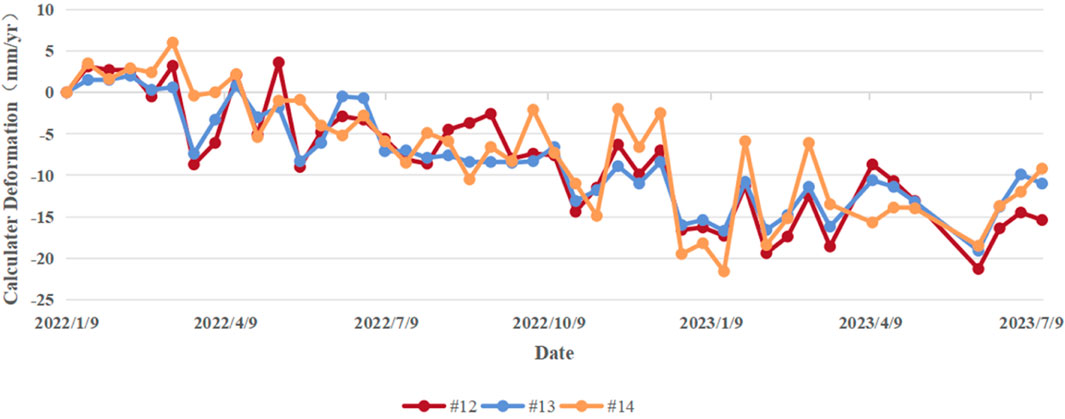
Figure 14. Time series deformation of sampling points #12∼#14.
Figure 15 depicts the settlement area B2 alongside its corresponding satellite imagery from May 2022. Area B2 is characterized by significant uplift, with a maximum uplift rate reaching +11.27 mm/yr. The range of uplift rates within this area falls between +4.24 mm/yr and +11.27 mm/yr.
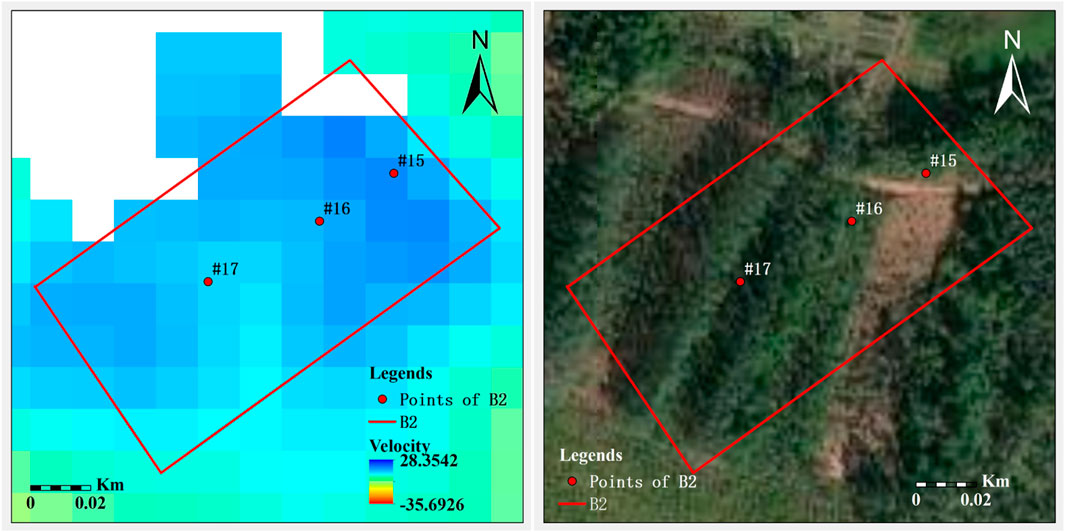
Figure 15. Map of the B2 area north-east of the slope.
In the settlement area B2, sampling points #15-#17 were selected, with their coordinates listed in Table 6. Through time series analysis, Figure 16 was obtained, revealing that during the monitoring period from 9 January 2022, to 15 July 2023, the cumulative settlements at sampling points #15-#17 were +7.5 mm, +7.2 mm, and +9.4 mm, respectively, indicating uplift at all three sampling points. Satellite imagery shows that area B2 is located on the top of a hill, where the terrain is relatively flat.
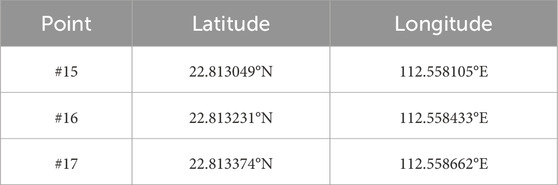
Table 6. Sample point details.
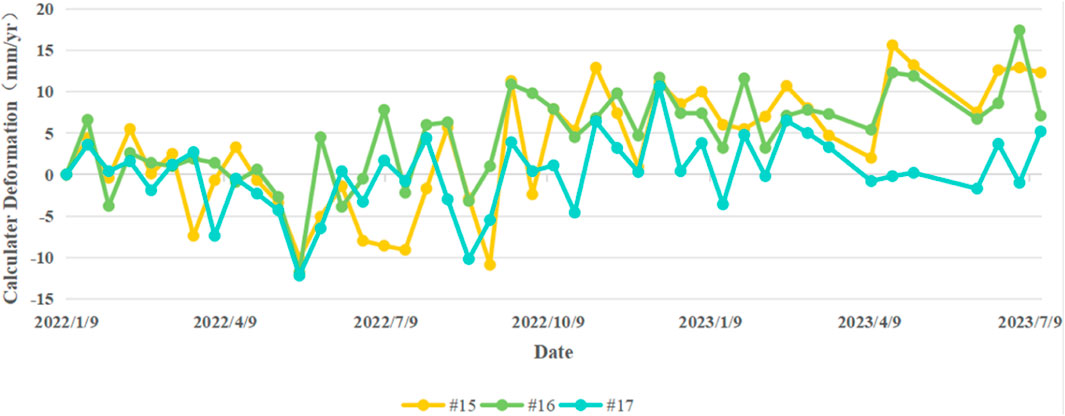
Figure 16. Time series deformation of sampling points #15∼#17.
As observed from the time series analysis graph, sampling points #15-#17 exhibited a downward trend from January to August 2022, with a maximum cumulative settlement reaching −10 mm. However, in mid-August, an abrupt uplift occurred, followed by a rapid settlement and then another rapid uplift. This pattern is considered to be caused by the compaction of fill soil during nearby construction activities. After these two abrupt uplifts, the cumulative settlements at the three sampling points fluctuated evenly, which is likely due to the initial compaction of the road surface followed by the addition and subsequent compaction of loose soil. Ultimately, all three sampling points in area B2 experienced uplift, suggesting a low probability of abnormal subsidence occurring in B2.
The results of slope settlement velocity and settlement vector have been overlaid on the optical imagery, as shown in Figure 17. From Figure 17, a more intuitive visualization of the slope area located at the corner of a hillside is provided. By correlating the slope settlement rates with their actual geographical positions, the overall deformation characteristics of the slope can be discerned. Notably, the deformation is more pronounced at the base, followed by the marginal regions, while the top region exhibits minimal settlement or even slight uplift. Similarly, the eastern-northeastern and western-southwestern directions of the slope, as previously analyzed, are situated in the flat area atop the hill and at the foot of the hill, respectively. Considering the nearby human construction activities, the reasons for these deformations can be roughly deduced.Upon examination of the overlaid optical imagery in Figure 17 it is observed that the settlement regions on the slope are predominantly distributed in the middle to lower sections, with a notable tendency for deformation to occur further downwards. Integrating this observation with the construction drawings of the slope area, it can be inferred that the slope at the corner is being reshaped into the desired configuration, necessitating excavation, filling, and leveling operations at the lower section. Conversely, the top of the slope requires a moderate uplift. This inference aligns with the observed deformation outcomes, validating the consistency between the construction results and the deformation patterns.
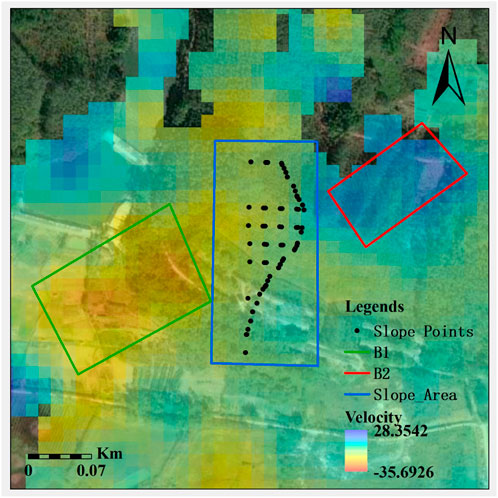
Figure 17. Sedimentation rate overlay optical image.
The study’s findings reveal a significant correlation between the deformation patterns observed in the slope area and the engineering disturbance regions, primarily attributed to construction activities.This relationship is evident in several aspects.
The primary settlement period identified from the deformation trajectory, spanning from April 2022 to March 2023,coincides with the active construction phase of the highway slope project.During this period, extensive construction activities such as excavation, filling, and compaction were carried out,which likely induced the observed ground deformation.The temporal alignment of these events suggests that the construction works were the dominant factor influencing the deformation during this interval. After March 2023,the deformation trends in most areas stabilized, indicating a reduction in the impact of construction activities on the slope’s stability.
Spatially,the deformation is predominantly localized at the slope’s base, with a slight uplift observed at its crest.This pattern is consistent with the typical effects of construction activities on slope stability.At the slope’s base,the construction processes such as excavation and the removal of soil and rock can lead to a reduction in the lateral support of the slope, resulting in subsidence.Conversely,the slight uplift at the crest may be due to the compaction of fill material or the redistribution of soil during construction, which can cause an increase in ground pressure and subsequent uplift.The areas with large deformation ranges in the north-east and south-west directions of the target slope (B1 and B2) also show a clear relationship with the engineering disturbance regions.The maximum settlement rate in area B1 and the lifting rate in area B2 are likely related to the specific construction activities in these areas, such as the leveling of the hillside base and the compaction of fill soil during nearby construction activities.
The magnitude of deformation also appears to be related to the intensity of construction activities.Areas with more intensive construction works, such as the bottom area of the slope (A1),exhibit relatively larger deformation rates.The cumulative settlements at sampling points in area A1 during the monitoring period are more significant compared to those in the middle (A2) and top (A3) areas of the slope.This suggests that the degree of ground disturbance caused by construction activities has a direct impact on the extent of deformation.The more extensive the construction interference,the more pronounced the deformation tends to be.
While the study focuses on the impact of construction activities on slope deformation,it is also important to consider the role of natural geological processes.The area’s geological background, characterized by folds and faults,and the presence of granite with high hardness and corrosion resistance, provides a relatively stable foundation. However, the observed deformation patterns, which are primarily concentrated during the construction period and spatially correlated with the engineering disturbance regions, indicate that human-induced activities are the dominant factor in this case.The absence of large-scale natural settlement further supports this conclusion.
In this study, radar satellite data and SBAS-InSAR technology were used to invert the surface deformation of the construction area of the first phase of a certain avenue in Foshan and the nearby artificial slope. The annual average deformation rate and cumulative deformation data from January 2022 to July 2023 in the area covered by radar images were obtained. The data show that the maximum annual average subsidence rate reached −35.69 mm/yr, and the maximum cumulative subsidence was −28.9 mm, with no other large deformations. From the perspective of the entire deformation process, the deformation trend is consistent with the construction of the slope, and the deformation should be mainly caused by construction and human activities. The settlement is concentrated from April 2022 to March 2023. In some areas, the deformation time is different due to different construction times, but there is no large-scale natural settlement. The geological conditions here are good, and the settlement trend finally tends to be gentle. It is speculated that there will be no geological disasters in the long term. From the perspective of the slope area, settlement mainly occurs at the bottom of the slope, and there is a slight uplift in the top area. Whether it is the slope area or the nearby area, the final settlement trend tends to be gentle, and there should be no large deformation causing harm in the future.
In summary, the use of SBAS technology to invert the surface deformation velocity field of mountain artificial slopes can quickly locate the distribution of regional deformation and efficiently obtain the time series of regional deformation. It can provide surface deformation information with high timeliness, accuracy, and reliability, which is of great significance for ensuring the construction safety of the target avenue slope, road use safety, and environmental protection.
The future work will focus on the continuous monitoring of the slope deformation using SBAS-InSAR technology, combined with other geotechnical methods such as field investigations and numerical simulations, to further understand the deformation mechanisms and assess the long-term stability of the slope. Additionally, the research will explore the application of machine learning algorithms in analyzing the InSAR data, aiming to improve the accuracy and efficiency of deformation detection and prediction. The outcomes of this study are expected to contribute to the development of more effective strategies for slope management and disaster prevention in similar geological conditions, ensuring the safety of infrastructure and the surrounding environment.
The raw data supporting the conclusions of this article will be made available by the authors, without undue reservation.
XH: Formal Analysis, Validation, Writing–original draft, Writing–review and editing. JL: Conceptualization, Data curation, Formal Analysis, Writing–original draft. TY: Formal Analysis, Investigation, Methodology, Project administration, Validation, Writing–original draft, Conceptualization, Data curation. YL: Validation, Formal Analysis, Funding acquisition, Investigation, Methodology, Project administration, Software, Writing–original draft. LZ: Resources, Supervision, Validation, Visualization, Writing–review and editing.
The author(s) declare that financial support was received for the research, authorship, and/or publication of this article. This research was funded by 2023 Central financial geological disaster prevention and control special fund project.
The author would like to thank the reviewers for their valuable comments on the manuscript, which helped improve the quality of the paper.
The authors declare that the research was conducted in the absence of any commercial or financial relationships that could be construed as a potential conflict of interest.
The author(s) declare that no Generative AI was used in the creation of this manuscript.
All claims expressed in this article are solely those of the authors and do not necessarily represent those of their affiliated organizations, or those of the publisher, the editors and the reviewers. Any product that may be evaluated in this article, or claim that may be made by its manufacturer, is not guaranteed or endorsed by the publisher.
Berardino, P., Fornaro, G., Lanari, R., and Sansosti, E. (2002). A new algorithm for surface deformation monitoring based on small baseline differential SAR interferograms. IEEE Trans. geoscience remote Sens. 40 (11), 2375–2383. doi:10.1109/tgrs.2002.803792
Carlà, T., Farina, P., Intrieri, E., Ketizmen, H., and Casagli, N. (2018). Integration of ground-based radar and satellite InSAR data for the analysis of an unexpected slope failure in an open-pit mine. Eng. Geol. 235, 39–52. doi:10.1016/j.enggeo.2018.01.021
Chen, Y., Yu, S., Tao, Q., Liu, G., Wang, L., and Wang, F. (2021). Accuracy verification and correction of D-InSAR and SBAS-InSAR in monitoring mining surface subsidence. Remote Sens. 13 (21), 4365. doi:10.3390/rs13214365
Dick, G. J., Eberhardt, E., Cabrejo-LiéVANO, A. G., Stead, D., and Rose, N. D. (2015). Development of an early-warning time-of-failure analysis methodology for open-pit mine slopes utilizing ground-based slope stability radar monitoring data. Can. Geotechnical J. 52 (4), 515–529. doi:10.1139/cgj-2014-0028
Ding, Y., Wang, P., Liu, X., Zhang, X., Hong, L., and Cao, Z. (2020). Risk assessment of highway structures in natural disaster for the property insurance. Nat. Hazards 104, 2663–2685. doi:10.1007/s11069-020-04291-3
Dong, Y., Ge, L., Chang, H., and Zhang, Z. (2007). Study on ground subsidence monitoring based on differential radar interferometry in mining area. J. Wuhan Univ. Inf. Sci. Ed. (10), 888–891. doi:10.3969/j.issn.1671-8860.2007.10.011
Du, Q., Li, G., Zhou, Y., Chai, M., Chen, D., Qi, S., et al. (2021). Deformation monitoring in an alpine mining area in the Tianshan Mountains based on SBAS-InSAR technology. Adv. Mater. Sci. Eng. 2021, 1–15. doi:10.1155/2021/9988017
Gao, H. Y., Zhao, Z., and Zhang, P. (2020). Geological disaster monitoring in guizhou Province based on time-series InSAR. Sci. Surv. Mapp. 45 (07), 91–99. doi:10.16251/j.cnki.1009-2307.2020.07.014
Hooper, A., Segall, P., and Zebker, H. (2007). Persistent scatterer interferometric synthetic aperture radar for crustal deformation analysis, with application to Volcán Alcedo, Galápagos. J. Geophys. Res. Solid Earth 112 (B7). doi:10.1029/2006jb004763
Hooper, A., Zebker, H., Segall, P., and Kampes, B. (2004). A new method for measuring deformation on volcanoes and other natural terrains using InSAR persistent scatterers. Geophys. Res. Lett. 31 (23). doi:10.1029/2004gl021737
Hu, L. Y., Zhang, J. F., and Shang, X. Q. (2010). Principle of SBAS-InSAR technology and its application in monitoring crustal deformation. Bull. Inst. Crustal Dyn. (00), 82–89.
Li, G., and Xue, J. (2013). Research on mining subsidence monitoring based on short baseline set technology. Geomatics and Spatial Inf. Technol. 36 (03), 191–193+196. doi:10.3969/j.issn.1672-5867.2013.03.064
Massonnet, D., Rossi, M., Carmona, C., Adragna, F., Peltzer, G., Feigl, K., et al. (1993). The displacement field of the Landers earthquake mapped by radar interferometry. nature 364 (6433), 138–142. doi:10.1038/364138a0
Massonnet, D., Thatcher, W., and Vadon, H. (1996). Detection of postseismic fault-zone collapse following the Landers earthquake. Nature 382 (6592), 612–616. doi:10.1038/382612a0
Pang, Z., Jin, Q., Fan, P., Jiang, W., Lv, J., Zhang, P., et al. (2023). Deformation monitoring and analysis of Reservoir dams based on SBAS-InSAR technology-banqiao Reservoir. Remote Sens. 15 (12), 3062. doi:10.3390/rs15123062
Sun, X., Lu, X., Wen, X., Zhen, Y., and Wang, L. (2016). Land subsidence monitoring in chengdu plain based on SBAS-InSAR. Remote Sens. Land and Resour. 28 (03), 123–129. doi:10.6046/gtzyyg.2016.03.20
Tizzani, P., Berardino, P., Casu, F., Euillades, P., Manzo, M., Ricciardi, G., et al. (2007). Surface deformation of long valley caldera and mono basin, California, investigated with the SBAS-InSAR approach. Remote Sens. Environ. 108 (3), 277–289. doi:10.1016/j.rse.2006.11.015
Xie, Z., Chen, G., Meng, X., Zhang, Y., Qiao, L., and Tan, L. (2017). A comparative study of landslide susceptibility mapping using weight of evidence, logistic regression and support vector machine and evaluated by SBAS-InSAR monitoring: zhouqu to Wudu segment in Bailing River Basin, China. Environ. Earth Sci. 76, 313–319. doi:10.1007/s12665-017-6640-7
Xu, B., Feng, G., Li, Z., Wang, Q., Wang, C., and Xie, R. (2016). Coastal subsidence monitoring associated with land reclamation using the point target based SBAS-InSAR method: a case study of Shenzhen, China. Remote Sens. 8 (8), 652. doi:10.3390/rs8080652
Yang, K., Yang, J., and Jiang, B. (2015). Overview of sentinel-1 satellite. Urban Geotechnical Investigation and Surv. (02), 24–27. doi:10.3969/j.issn.1672-8262.2015.02.006
Yao, J., Yao, X., and Liu, X. (2022). Landslide detection and mapping based on SBAS-InSAR and PS-InSAR: a case study in Gongjue County, Tibet, China. Remote Sens. 14 (19), 4728. doi:10.3390/rs14194728
Zaki, A., Chai, H. K., Razak, H. A., and Shiotani, T. (2014). Monitoring and evaluating the stability of soil slopes: a review on various available methods and feasibility of acoustic emission technique. Comptes Rendus Geosci. 346 (9-10), 223–232. doi:10.1016/j.crte.2014.01.003
Zebker, H. A., Rosen, P. A., Goldstein, R. M., Gabriel, A., and Werner, C. L. (1994). On the derivation of coseismic displacement fields using differential radar interferometry: the Landers earthquake. J. Geophys. Res. Solid Earth 99 (B10), 19617–19634. doi:10.1029/94jb01179
Zebker, H. A., and Villasenor, J. (1992). Decorrelation in interferometric radar echoes. IEEE Trans. geoscience remote Sens. 30 (5), 950–959. doi:10.1109/36.175330
Zhang, J., Cui, L., Liu, Z., Wang, X., Lin, L., and Xu, F. (2020). Large-area surface deformation monitoring using sentinel-1 SAR data and SBAS technique. Bull. Surv. Mapp. (07), 125–129. doi:10.13474/j.cnki.11-2246.2020.0228
Zhao, F., Meng, X., Zhang, Y., Chen, G., Su, X., and Yue, D. (2019). Landslide susceptibility mapping of karakorum highway combined with the application of SBAS-InSAR technology. Sensors 19 (12), 2685. doi:10.3390/s19122685
Zhao, R., Li, Z.-W., Feng, G.-C., Wang, Q. j., and Hu, J. (2016). Monitoring surface deformation over permafrost with an improved SBAS-InSAR algorithm: with emphasis on climatic factors modeling. Remote Sens. Environ. 184, 276–287. doi:10.1016/j.rse.2016.07.019
Keywords: artificial slopes, the risk of geological disasters, slope stability, SBAS-InSAR, Foshan
Citation: Huang X, Liu J, Yang T, Li Y and Zhou L (2025) Artificial slope deformation monitoring and analyzing based on SBAS technology. Front. Earth Sci. 13:1504304. doi: 10.3389/feart.2025.1504304
Received: 30 September 2024; Accepted: 24 February 2025;
Published: 24 March 2025.
Edited by:
Tianming Huang, Chinese Academy of Sciences (CAS), ChinaReviewed by:
Purnanand Savoikar, Goa College of Engineering, IndiaCopyright © 2025 Huang, Liu, Yang, Li and Zhou. This is an open-access article distributed under the terms of the Creative Commons Attribution License (CC BY). The use, distribution or reproduction in other forums is permitted, provided the original author(s) and the copyright owner(s) are credited and that the original publication in this journal is cited, in accordance with accepted academic practice. No use, distribution or reproduction is permitted which does not comply with these terms.
*Correspondence: Ting Yang, NTgzMjgyNzk4QHFxLmNvbQ==
Disclaimer: All claims expressed in this article are solely those of the authors and do not necessarily represent those of their affiliated organizations, or those of the publisher, the editors and the reviewers. Any product that may be evaluated in this article or claim that may be made by its manufacturer is not guaranteed or endorsed by the publisher.
Research integrity at Frontiers
Learn more about the work of our research integrity team to safeguard the quality of each article we publish.