 Xinghua Qi
 Shimao Wang
 Yuxuan Wei
 Zhuwen Wang1*
- 1College of Geo-Exploration Science and Technology, Jilin University, Changchun, China
- 2School of Mining Engineering and Geology, Xinjiang Institute of Engineering, Urumqi, China
Shallow three-electrode laterolog is widely used in the field of coal field logging because of its strong economy. Coal seams in Xinjiang region have the characteristics of large thickness variation, high dip angle, easy diameter enlargement and fracture development, but the law of these characteristics in the three-electrode laterolog curve is not clear. In this paper, through the finite element simulation software COMSOL Multiphysics, 2D and 3D models are constructed based on shallow three-electrode laterolog, and the characteristics of using shallow three-electrode laterolog in coal field logging are studied. The results show that the electrode system coefficient of shallow three-electrode laterolog instrument should be 0.94 times of the theoretical electrode system coefficient. The discrimination ability of shallow three-electrode laterolog to coal seams is about 0.3 m. There is a power function relationship between the determination coefficient of coal seam boundary and the ratio of coal seam-surrounding rock resistivity ratio. An increase in the dip angle of the coal seam leads to an increase in the apparent thickness of the coal seam following a quadratic function relationship, while an increase in the wellbore radius results in a quadratic function decrease in the apparent resistivity of the coal seam. An increase in both the width and length of the fractures leads to a decrease in apparent resistivity following a power function relationship. The research results provide a more accurate reference standard for the analysis and evaluation of coal seams using shallow three-electrode laterolog.
1 Introduction
Laterolog was developed in the 1950s in order to reduce the diversion effect of drilling fluid and the influence of low-resistance surrounding rock during logging, so as to obtain more accurate apparent resistivity curves (Doll, 1951). The laterolog enhances the longitudinal resolution of the main electrode through the transverse shielding and longitudinal extension of the current, thereby improving the accuracy of the stratification and thickness determination of the reservoir. The technique is widely used in saltwater drilling fluid Wells, high-resistance thin layer zones, and carbonate zones.
Three-electrode laterolog is a kind of laterolog, which is widely used in coal exploration because of its advantages of economic benefits, simple structure, convenient use and low maintenance cost. Tang (1985), Huang (2010), and Xu (1988) applied the three-electrode laterolog to the actual quantitative interpretation of coal quality, stratification and thickness determination and mud intrusion analysis, and achieved remarkable results. In addition, Chen et al. (2013) designed a new three-electrode laterolog instrument STM32 for the acquisition of different probe signals. However, three-electrode laterolog failed to achieve the expected results in some coal fields in Xinjiang.
Coal seams in Xinjiang have the geological characteristics of large dip angle and large thickness variation. In addition, there are obvious differences in fracture propagation and fracture morphology between the coal seam and other areas (Lan, 2024; Lu et al., 2021). At the same time, the coal seams in Xinjiang also show the characteristics of large thickness variation, widespread distribution of fractured reservoirs and obvious drilling enlargement. Due to these factors, the corresponding relationship between the three-electrode laterolog response characteristics and the coal seam spatial characteristics and electrical characteristics is not clear, so it is urgent to carry out relevant research.
The corresponding laws and characteristics of laterolog instruments can be studied by forward modeling. Many researchers use forward modeling to study the control factors and build correction charts or conduct studies of complex reservoirs. In the research field of dual laterolog, Zhang et al. (2002), Fan and Lu (2005), and Deng et al. (2009) used the forward model to study the response characteristics of double dual laterolog of layer thickness, surrounding rock and well, and established the corresponding map; Zhang et al. (2014), Ge et al. (2019), Wu et al. (2022), and Hu et al. (2019) studied the logging response characteristics of fractured reservoirs in different fracture spatial locations, geometric shapes and fluid conductivity based on the forward model, and established the relationship between fracture parameters and dual laterolog response; Liu et al. (2012a), Liu et al. (2012b), Deng et al. (2012), and Pan et al. (2022) constructed dual laterolog forward models for unconventional reservoirs such as carbonate reservoirs, sand-mudstone interbeds, fracture-cavity reservoirs, and dissolved vuggy fractured reservoirs to study the controlling factors of their logging responses; Mohammed et al. (2021), Shalaby and Islam (2017), and Wiersberg et al. (2020), and others, utilized logging data that includes Dual Laterolog (DLL), QLGA data, and seismic data to determine the characteristics of oil and gas reservoir profiles, assess gas flow and the development of fractures, thereby guiding the interpretation and development of oil and gas reservoirs; Saboorian-Jooybari et al. (2016), Xue et al. (2022), and Wang et al. (2023) used measured data and a dual laterolog forward model for fracture identification and evaluation. In the research field of array laterolog, Feng et al. (2018) and Ni et al. (2018) studied the apparent resistivity characteristics of well inclination, layer thickness, surrounding rock and eccentricity distance based on the forward model of directional and horizontal Wells, and established the corresponding layer thick-surrounding rock correction charts and surrounding rock correction charts; Liang et al. (2021) established wellbore correction charts and surrounding rock correction charts through forward modeling to compare measured data and analyze the performance of logging instruments; Wu et al. (2008) and Pan et al. (2013) studied the controlling factors of logging curves based on Robin boundary conditions and different measurement modes, and Hu et al. (2019) realized fast inversion of logging data by adding Windows; Sushant et al. (2017) established a 3D model with vertical fractures to explain the unusual curve separation issues in array lateral logging in shale gas reservoirs; Ni et al. (2017) and Si et al. (2020) studied the log response characteristics of complex reservoirs using the mud intrusion anisotropy model and the fractured reservoir model of horizontal Wells. At the same time, Huo and Li (1990) and Szijártó et al. (2017) utilized the finite element method to establish a shallow three-electrode laterolog model, investigating the impact of various geometric and electrical parameters on the lateral curves. However, the conditions were complex, not systematic, and no specific functional patterns were derived (Huo and Li, 1990; Szijártó et al., 2017).
Therefore, this paper uses the finite element software COMSOL Multiphysics to establish the shallow three-electrode laterolog model of coal seam, and systematically studies the influence of coal seam thickness, coal seam-surrounding rock resistivity ratio, coal seam dip angle, coal seam wellbore enlargement and coal seam fracture on the apparent resistivity curve. The purpose of this paper is to provide a useful reference for coal seam identification and evaluation of shallow three-electrode laterolog in coal field.
2 Technical road
This study is based on the principles of shallow three-electrode laterolog and finite element theory, utilizing COMSOL Multiphysics software to establish a constant voltage shallow three-electrode laterolog model, in order to investigate the response characteristics of shallow three-electrode laterolog in coal seams. Under the premise of identical parameters, the study compares the differences in apparent resistivity curves between 2D and 3D models, ensuring the consistency of forward modeling results. Analyzing the ratio of apparent resistivity to true resistivity obtained from empirical formulas in an ideal state, the study corrects the electrode system coefficients to enhance the accuracy of the results. Subsequently, by altering parameters such as coal seam thickness, coal seam-surrounding rock resistivity ratio, coal seam wellbore enlargement and coal seam fracture in the 2D model, and coal seam dip angle in the 3D model, the study analyzes the characteristics of the apparent resistivity curves and summarizes the response patterns.
3 Principle of three-electrode laterolog
Shallow three-electrode laterolog (LL3), namely, three-electrode laterolog, can be divided into shallow three-electrode laterolog and deep three-electrode laterolog according to the different lateral exploration depth (in order to avoid occupying the paper’s space, this paper only takes shallow three-electrode laterolog as an example to study its response characteristics). The electrode system of shallow three-electrode laterolog consists of five cylindrical metal electrodes, in which the main electrode (A0) is located in the middle, and a shield electrode (A1, A2) and a loop electrode (B1, B2) are symmetrically arranged on both sides. The electrode spacing between the main electrode and the shield electrode (L1) and the shield electrode and the loop electrode (L2) are respectively. As shown in Figure 2.
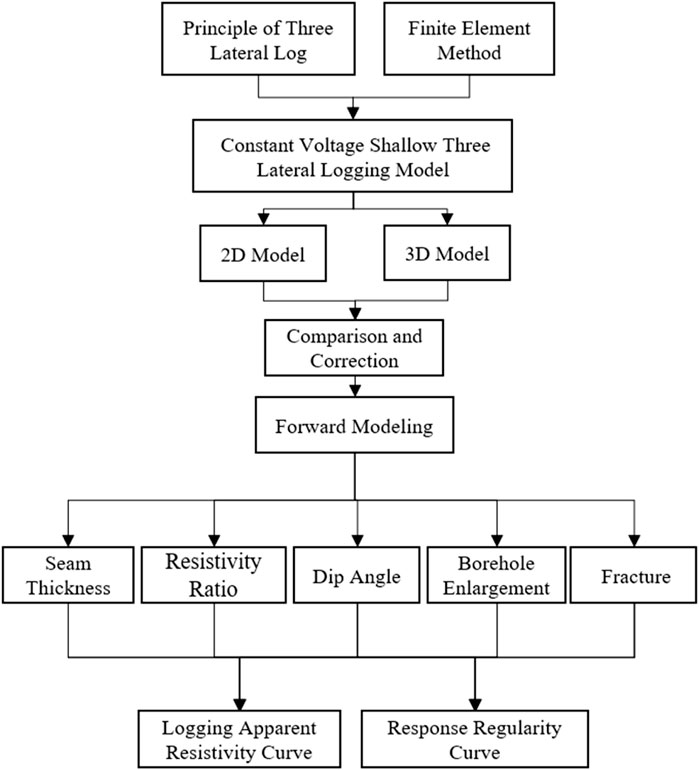
Figure 1. Technology roadmap.
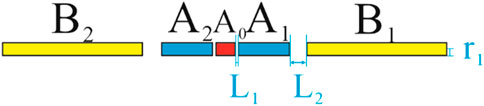
Figure 2. Shallow three-electrode laterolog parameters.
In the logging process, the main electrode and the shielding electrode are passed with the same polarity of current I0 and Is, and I0 is kept constant. The method of automatic control of Is is adopted to make the potential on the main electrode (A0) and the two shielding electrodes (A1 and A2) tend to be equal, and the potential gradient along the electrode or the shaft is zero (∂U⁄∂z = 0). Thus, it is ensured that the current flowing from the main electrode does not flow along the well axis. The main current I0 is roughly squeezed into a disc-shaped laminar flow. The thickness of this disk layer, or main current layer, is approximately equal to the length of the main electrode plus half the distance between the main electrode and each shield electrode, and it remains essentially constant for a certain radial distance. This characteristic of the main current layer makes the shallow three-electrode laterolog curve have high longitudinal stratification ability.
The apparent resistivity Ra can be expressed as follows:
Where: Ra is the apparent resistivity in Ω·m; U is the surface potential of the electrode in V; I0 represents the main current intensity in A.
According to the empirical formula, the coefficient K of electrode system in shallow three-electrode laterolog can be approximated as follows:
Where, K is the coefficient of shallow three-electrode laterolog electrode system; A0 is the length of the main electrode; A1 represents the length of the shielding electrode 1, and it is equal in length to the shielding electrode 2 (i.e., A2), L1 is the distance between the upper and lower shielding electrodes and the main electrode, and r0 is the radius of the electrode. Their units are all meters (m).
4 Three-electrode laterolog finite element modeling
4.1 Basic theory of electric field simulation
Numerical simulation is a basic and economic research means. In this paper, COMSOL Multiphysics numerical simulation software is used to construct a shallow three-electrode laterolog model to explore the corresponding characteristics of coal seam shallow three-electrode laterolog under different conditions.
When constructing the model, the current module in COMSOL Multiphysics software is used, and the physical field related law is mainly reflected in the Gaussian electric field law. Its expression is:
The linear relationship between the current density Jc and the electric field E is as follows:
In electrical conductors, the current density is proportional to the electric field strength, and the proportionality factor is the conductivity σ.
Where: U is voltage, unit is V; E is the electric field strength in V/m; D is the electric displacement vector, also known as the electric flux density, in C/m2. ρv is the charge density in C/m3; Jc is the conductive current density vector in A/m2; σ is the conductive capacity of the material in S/m.
4.2 Model and parameter setting
Considering that the calculation time of 2D model is short, and only 3D model can effectively study the characteristics of inclined strata, this paper constructs 2D model and 3D model at the same time. The 2D model is used to study the response characteristics of coal seam thickness, coal seam-surrounding rock resistivity ratio, coal seam wellbore enlargement and coal seam fracture, and the 3D model is used to study the response characteristics of coal seam dip angle. To save computing resources and time cost, the model is shown in Figure 3.
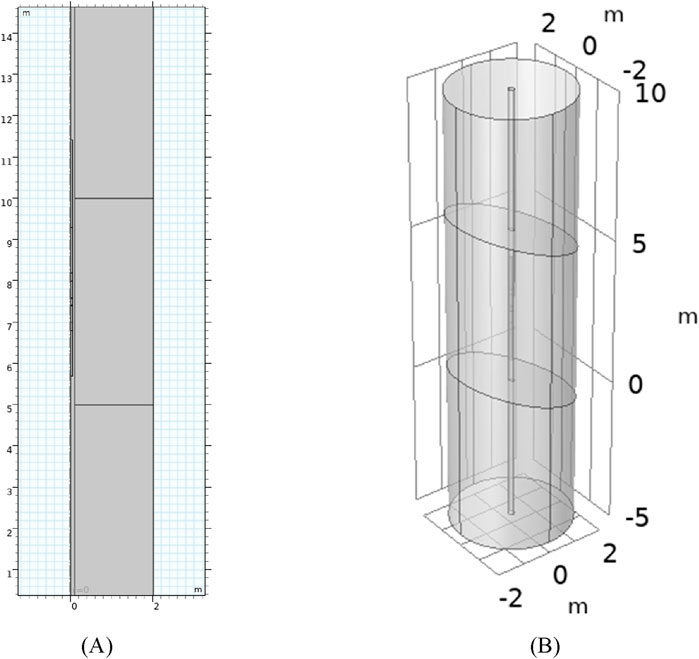
Figure 3. 2D model and 3D model diagram.
In Figure 3, both the 2D and 3D models are composed of simulated strata and electrode systems. The 2D model is 2 m wide and 15 m high, and the 3D model has a radius of 2 m and 15 m high. Second, the lithology of the 2D and 3D models are the same, the middle is coal seam, the upper surrounding rock is sandstone, and the lower surrounding rock is limestone. The electrodes were attached to the left wellbore of the 2D model and the middle wellbore of the 3D model. Parametric scanning was performed from 2.5 m to 12.5 m for the 2D model and from −2.5 m to 7.5 m for the 3D model, and the apparent resistivity of a point was measured at an interval of 0.125 m.
The measurement method of the model is constant voltage shallow three-electrode laterolog, and the lithology of the formation is sandstone-coal-limestone interbed. The specific model parameters are shown in Table 1.
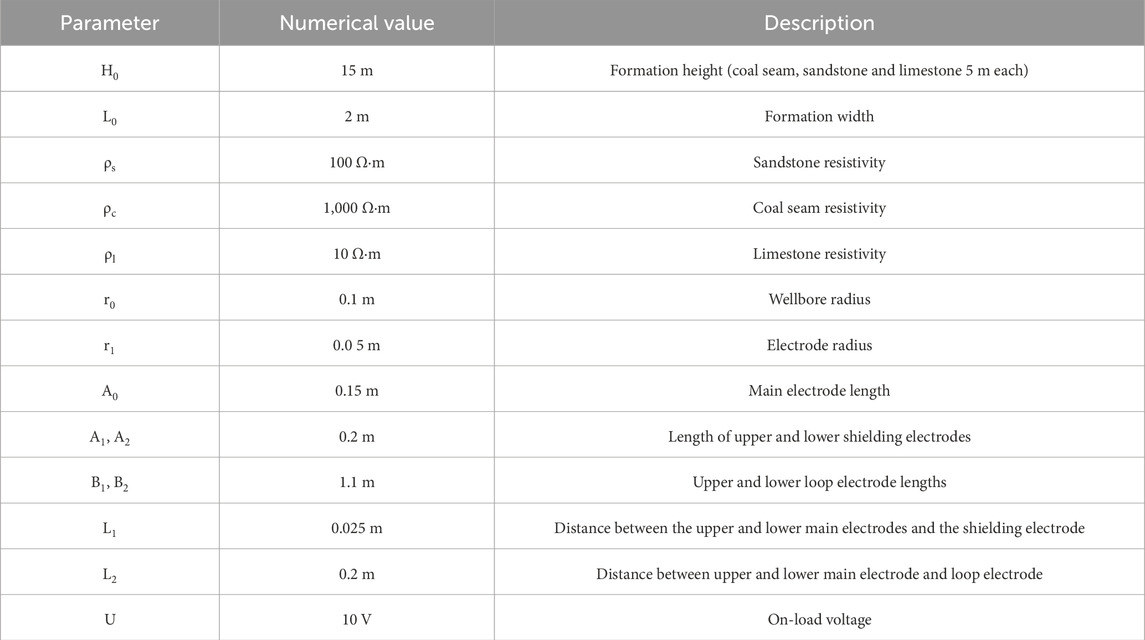
Table 1. Parameters of the model.
5 Model comparison and correction
5.1 Model comparison of 2D and 3D models
In theory, the difference between 2D and 3D models is solely due to the dimensions, which affect the computation time and the precision of the results. Under the same conditions, both models should yield roughly the same outcomes. Based on this, this section conducts a consistency test of the models to demonstrate the consistency between the 2D and 3D models, as shown in Figure 4.

Figure 4. Comparison of apparent resistivity curves of 2D and 3D model Stratum.
From Figure 4, it can be observed that between 2.5 m and 12.5 m of the parametric scan, the apparent resistivity curve distinctly reflects the electrical property differences of different geological bodies and the changes at their boundaries. The coal seam, located between 5 m and 10 m, exhibits an apparent resistivity that is higher in the middle and lower on both sides; moreover, the boundary areas where the upper surrounding rock (limestone) and the lower surrounding rock (sandstone) approach the coal seam also show symmetrical resistivity fluctuation characteristics. Due to the homogeneous model constructed in this paper, there is a significant resistivity difference at the coal-rock boundary, and the resistivity does not transition gradually, hence minor fluctuations, known as boundary effects, appear at the boundary. Notably, due to the different levels of mesh discretization in the 2D and 3D models, the apparent resistivity curves exhibit variations in fluctuation and smoothness outside the boundaries (2.5–4 m, 6–9 m, 11–12.5 m). This has a minor impact on the study of the response characteristics of shallow three-electrode laterolog and can be neglected.
Based on this, the computational results from the 2D and 3D models do not differ significantly, thus allowing for the separate execution of both models to perform the corresponding calculations.
5.2 Electrode system coefficient correction
In order to calculate the apparent resistivity more accurately, the coefficient of the electrode system is corrected. Because Equation 2 is a simplified calculation of the electrode system coefficient, the obtained electrode system coefficient is the theoretical electrode system coefficient, which will lead to a certain error between the measured apparent resistivity and the true resistivity. Since the voltage and current are not changed in the model, the difference of apparent resistivity is caused by the difference of electrode system coefficients.
When the external environment is completely consistent (i.e., the resistivity of wellbore water, sandstone, coal seam, and limestone are all 1,000 Ω·m), the apparent resistivity should be infinitely close to the true resistivity, and the corresponding error can be analyzed by comparing the theoretical resistivity with the actual resistivity, as shown in Figure 5.
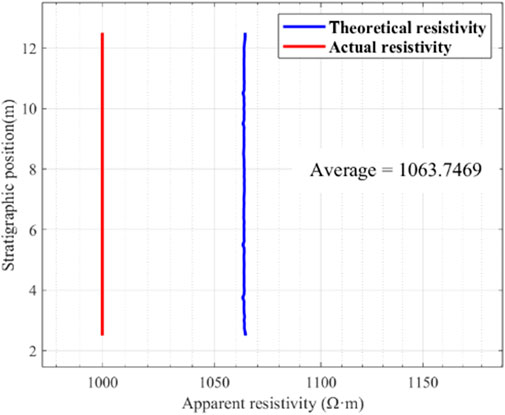
Figure 5. Comparison of theoretical and actual resistivity.
Figure 5 shows that the theoretical electrode system coefficient calculated according to Formula 2 is 1.0637,469 times that of the actual electrode system coefficient. This means that in the actual logging process, the measured apparent resistivity should be multiplied by the inverse of 1.0637,469, that is, about 0.94, so that the measured apparent resistivity is closer to the true resistivity.
6 Simulation results
6.1 Coal seam thickness
The change of coal seam thickness can be reflected in the apparent resistivity curve, so it is necessary to explore its longitudinal resolution ability by changing the thickness of the seam. Under the initial condition of the 2D model, the thickness of the coal seam was gradually reduced, and the thickness of the coal seam was set to 5 m, 3 m, 1 m, 0.5 m and 0.3 m, respectively, to obtain the apparent resistivity curves under different seam thicknesses, as shown in Figure 6.
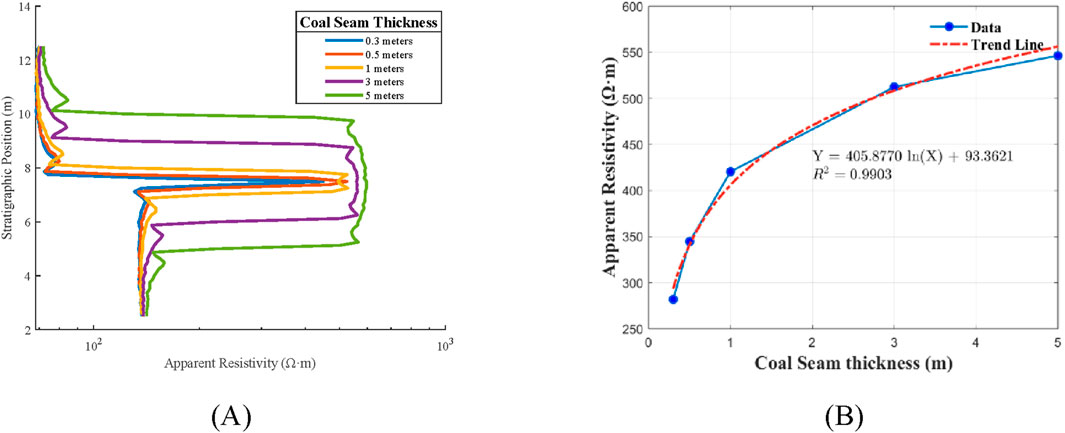
Figure 6. Apparent resistivity curves of stratum with different coal seam thicknesses and the response pattern of average apparent resistivity of coal seams.
From Figure 6, it can be observed that there is a logarithmic function relationship between seam thickness and apparent resistivity:
6.2 Coal seam-surrounding rock resistivity ratio
In the initial condition of the 2D model, the resistivity of the upper and lower surrounding rock is set to be the same, and there is a certain multiple relationship between the resistivity value and the resistivity of the coal seam (the resistivity of the coal seam remains unchanged). By setting the coal-rock resistivity ratio from 10/9 to 10, the partial apparent resistivity curve is shown in Figure 7A. Subsequently, the corresponding coal seam boundary determination coefficient is calculated according to Equation 6, and the correction plate is drawn, as shown in Figure 7B.
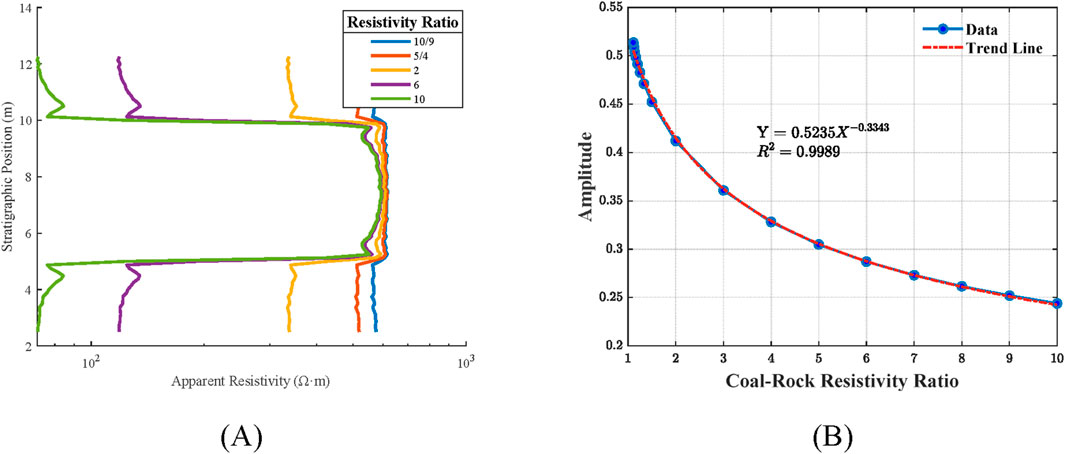
Figure 7. Apparent resistivity curves of stratum with different coal seam thicknesses and the response pattern of boundary amplitude.
The formula for determining coefficient of coal seam boundary can be expressed as follows:
Where, A is the determination coefficient of coal seam boundary, which is dimensionless; ρb is the apparent resistivity value at the coal seam boundary in Ω·m, and ρmax is the maximum apparent resistivity value at the apparent resistivity mutation in Ω·m. ρmin is the minimum apparent resistivity value in Ω·m at the abrupt change in apparent resistivity.
Figure 7B shows that there is a power function relationship between the coal-rock resistivity ratio and the determination coefficient of coal seam boundary:
6.3 Coal seam dip angle
The 2D model can only simulate the logging environment in the axisymmetric case. When the dip angle of the ground lseam changes, it can be clearly seen from the geometry of the model, and it can no longer be numerically simulated by the 2D model, so it must be numerically simulated by the 3D model.
In the initial condition of the 3D model, the dip angle of the coal seam is set as 0°, 15°, 30°, 45° and 60° respectively (keep the bottom of the coal seam unchanged, with the increase of the dip angle, the coal seam extends upward; When the dip angle is 60°, in order to ensure a complete apparent resistivity curve, the length of the model is increased to 20 m), and the apparent resistivity curves under different dip angles are obtained, as shown in Figure 8A. According to the formula in Figure 8B, the apparent thickness of the coal seam on the apparent resistivity curve is determined, as shown in Figure 8B.
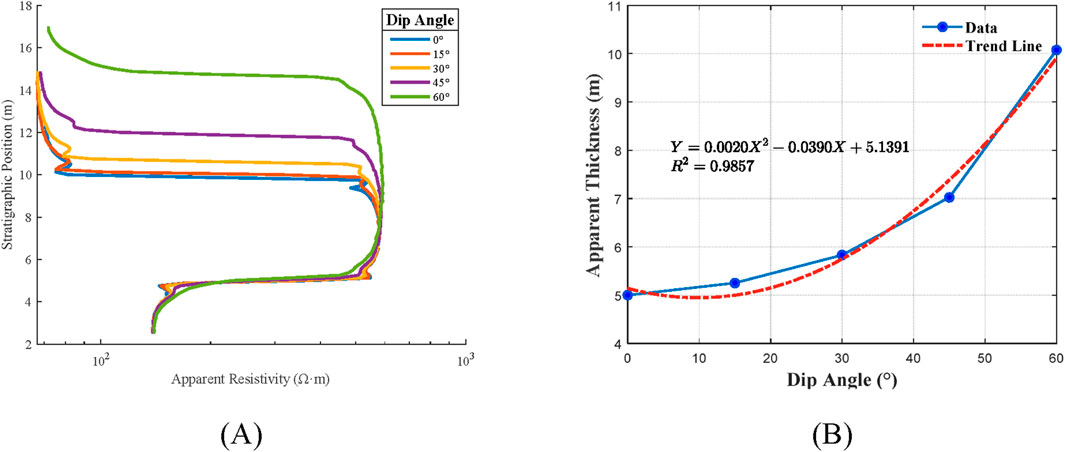
Figure 8. Apparent resistivity curves of stratum with different coal seam dip angles and the response pattern of apparent thickness of coal seams.
The results (Figure 8B) of determining the apparent thickness of the coal seam based on the formula in Figure 7B are generally consistent with the results obtained using trigonometric functions geometrically to calculate the apparent thickness. This indicates that the shallow three-electrode laterolog apparent resistivity curve is also effective in determining the apparent thickness of inclined coal seams. At the same time, it can be seen from Figure 8B that there is a quadratic functional relationship between the dip angle of coal seam and the apparent thickness of coal seam:
6.4 Wellbore enlargement in coal seam
Under the initial condition of the 2D model, the enlargement degree of the coal seam wellbore is gradually expanded (Initial wellbore radius is 0.1 m), and the enlargement radius of the coal seam wellbore is set to 0 cm, 1 cm, 2 cm, 3 cm, 4 cm and 5 cm respectively. As a result, the apparent resistivity curves of different coal seam wellbore enlargement radius are obtained, as shown in Figure 9A, and the corresponding average resistivity of coal seam is calculated, and the results are shown in Figure 9B.
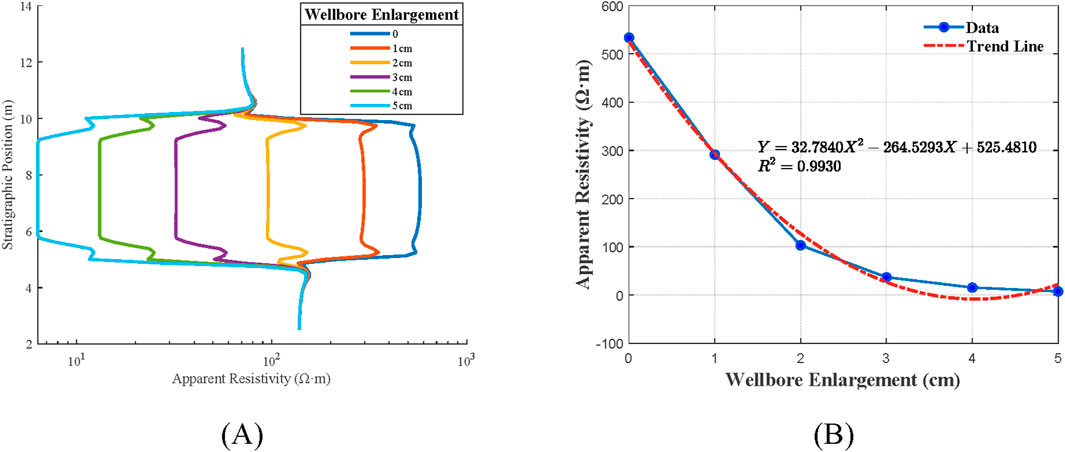
Figure 9. Apparent resistivity curves of stratum with different coal seam wellbore enlargements and the response pattern of average apparent resistivity of coal seams.
As can be seen from Figure 9, there is a quadratic functional relationship between coal seam wellbore enlargement and coal seam apparent resistivity:
6.5 Fracture
Under the initial condition of the 2D model, three additional coal seam fractures were added, and the positions on the z-axis were 6.452–6.453 m, 6.953–6.954 m and 7.454–7.455 m, respectively. The fracture spacing was 0.5 m, the fracture width was 1 mm, and the fracture length was 2 m.
6.5.1 Fracture count
Under the condition of adding fractures in the 2D model, the number of fractures is set to 0, 1, 2, and 3, respectively, (when there is 1 fracture, the position is at 6.953–6.954 m; when there are 2 fractures, the positions are at 6.452–6.453 m and 7.454–7.455 m respectively; when there are 3 fractures, the positions are at 6.452–6.453 m, 6.953–6.954 m, and 7.454–7.455 m respectively) to obtain the apparent resistivity curves under different number of fractures, as shown in Figure 10. The results indicate that the addition of fractures leads to the minimum value of resistivity at the fracture, and the boundary effect generated by fractures leads to the increase of the apparent resistivity of the nearby coal seam.
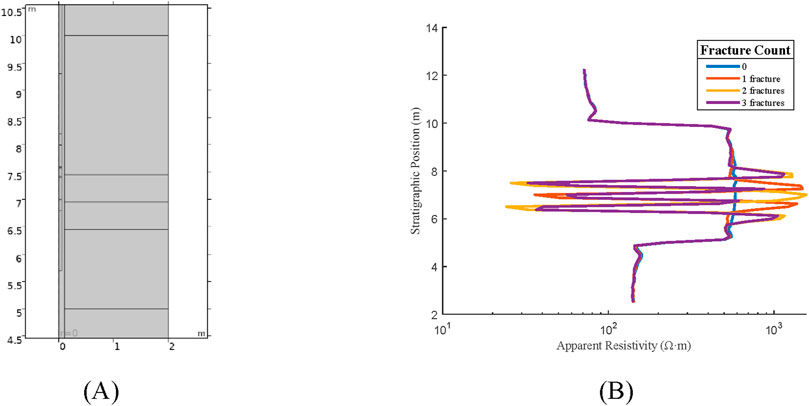
Figure 10. Fracture locations and apparent resistivity curves of stratum with different fracture count.
6.5.2 Fracture width
Under the condition of adding fractures in the 2D model, the fracture widths were set as 0.1 mm, 0.25 mm, 0.5 mm, 0.75 mm, 1 mm and 2mm, respectively, to obtain the apparent resistivity curves under different fracture widths, as shown in Figure 11. This suggests that there is a power function relationship between the fracture width and the apparent resistivity of coal seam:
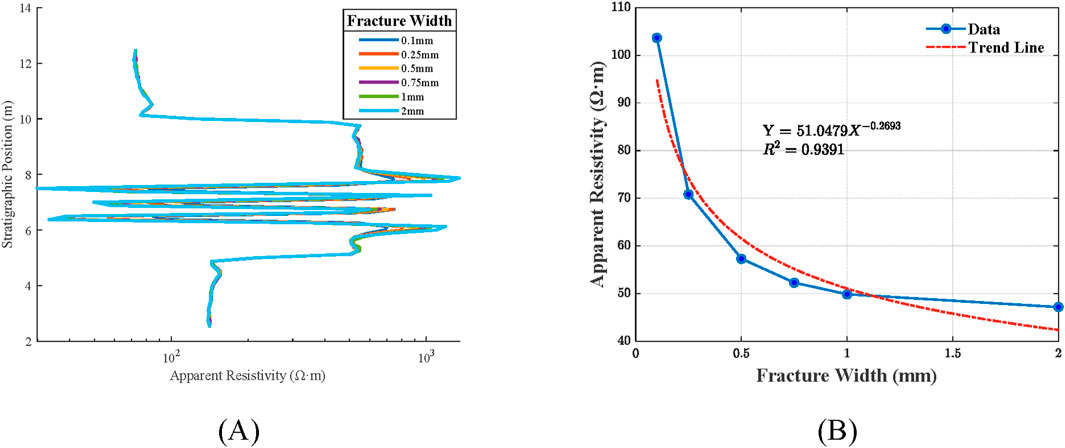
Figure 11. Apparent resistivity curves of stratum with different coal seam fracture widths and the response pattern of average apparent resistivity of fluids within fractures.
6.5.3 Fracture length
Under the condition of adding fractures in the 2D model, the lengths of the fractures are set to 0.1 m, 0.3 m, 0.5 m, 1 m, and 2 m, respectively, to obtain the apparent resistivity curves under different fracture lengths, as shown in Figure 12. The findings reveal that the increase in fracture length leads to a decrease in the apparent resistivity of the fluid within the fracture, and there exists a power function relationship between the two, given by
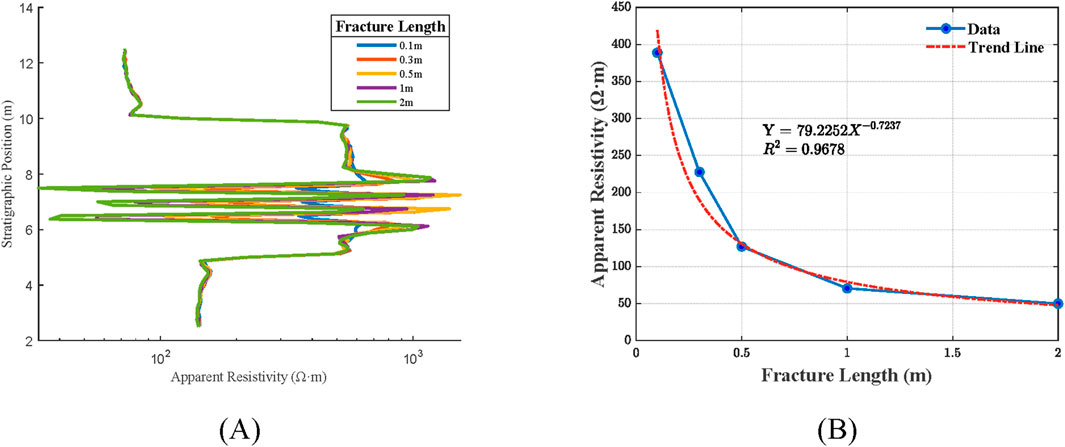
Figure 12. Apparent resistivity curves of stratum with different coal seam fracture lengths and the response pattern of average apparent resistivity of fluids within fractures.
7 Discussion
This paper, based on 2D and 3D models, investigates the influence of geometric and electrical parameters such as coal seam thickness, coal-rock resistivity ratio, the dip angle of the coal seam, wellbore enlargement in the coal seam, fractures count, fracture width and fracture length, by adjusting these parameters within the models. By analyzing the response characteristics of shallow three-electrode laterolog, the study summarizes the related patterns, with results presented in Table 2.
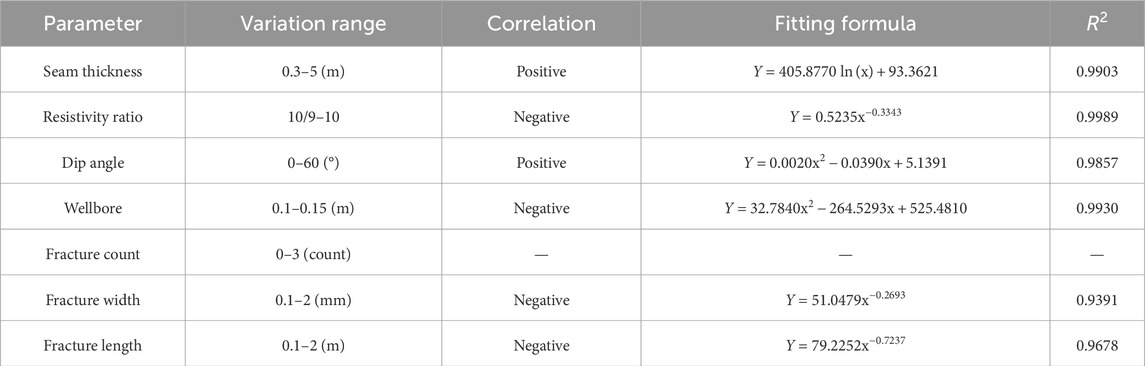
Table 2. Response characteristics of shallow three-electrode laterolog under different parameters.
The coal seam thickness is positively correlated with resistivity, and when the coal seam is at 0.3 m, the apparent resistivity is significantly lower than the true resistivity, indicating that the stratification capability has reached its limit. This phenomenon is consistent with the research of Szijártó et al. (2017). The coal-rock resistivity ratio is negatively correlated with the amplitude at the coal-rock boundary, with a high correlation coefficient of 0.9989, which is the highest among all parameters. This study further refines the research of Huo and Li (1990) in this area, resulting in specific functional patterns. An increase in the dip angle of the coal seam leads to an increase in the apparent thickness of the coal seam, which is also reflected in the apparent resistivity curve. This result is generally consistent with the research of Huo and Li (1990). The wellbore enlargement in the coal seam is negatively correlated with the apparent resistivity of the coal seam, and changes rapidly within 1 cm of wellbore enlargement. This study further supplements the research of Szijártó et al. (2017) on the variation of well diameter over the entire well section. The addition of fractures causes the coal seam to increase abnormally due to boundary effects, and both the increase in fracture width and length lead to a power function decrease in the electrical conductivity of the fluid within the fractures.
Building on the coal seam thickness depicted in Figure 6B of Section 6.1, two corresponding seam thickness correction curves can be derived through further processing. This paper, considering the length and necessity of the article, did not proceed with further research. Additionally, in Section 6.5 regarding fractures, it would be possible to investigate the response characteristics of fluid resistivity changes within the fractures. However, this is essentially similar to Section 6.2 on the coal-rock resistivity ratio, and the paper did not conduct further research on this aspect either. Future work will be committed to studying heterogeneous formation models and further validating the models with actual measured data to assist in the evaluation of complex reservoirs.
8 Conclusion
In this paper, COMSOL Multiphysics is used to construct the model of coal seam apparent resistivity measurement by shallow three-electrode laterolog, and the effects of coal seam thickness, coal seam-surrounding rock resistivity ratio, coal seam dip angle, coal seam wellbore enlargement and coal seam fracture on apparent resistivity curve are studied. This paper draws the following conclusions:
(1) The coal seam thickness has a positively correlated logarithmic function relationship with the apparent resistivity of the coal seam, while the coal-rock resistivity ratio has a negatively correlated power function relationship with the coal-rock boundary determination coefficient. Forward modeling simulations indicate that the stratification and thickness determination capability of shallow three-electrode laterolog for coal seams is approximately 0.3m; when the seam thickness is less than this value, it is necessary to correct the coal seam thickness to accurately obtain the coal seam resistivity; the correlation coefficient between the coal-rock resistivity ratio and the coal-rock boundary determination coefficient is as high as 0.9989, and the correction chart in this paper can effectively determine the coal-rock boundary.
(2) The relationship between coal seam dip angle and apparent thickness of the coal seam, as well as the relationship between borehole enlargement in the coal seam and apparent resistivity of the coal seam, are both quadratic function relationships. The coal seam dip angle is positively correlated with the apparent thickness of the coal seam, and with the knowledge of the formation dip angle, the true thickness of the strata can be obtained through the results of shallow three-lateral logging. The enlargement of the wellbore in the coal seam is negatively correlated with the apparent resistivity of the coal seam. Wellbore enlargement hinders the lateral extension of the electric current, which can easily lead to distortion of the coal seam resistivity, and wellbore correction is necessary in certain situations.
(3) The addition of fractures leads to an abnormal increase in the coal seam due to boundary effects. Moreover, both the fracture width and length exhibit a negative correlation with the resistivity of the fluid within the fractures, following a power function relationship. Therefore, shallow three-electrode laterolog can be utilized to explore the development state of fractures. Future work will be dedicated to the development of heterogeneous formation models, and combining actual measured data to further validate the models, assisting in the evaluation of complex reservoirs.
Data availability statement
The original contributions presented in the study are included in the article/supplementary material, further inquiries can be directed to the corresponding author.
Author contributions
XQ: Conceptualization, Methodology, Writing–review and editing. SW: Formal Analysis, Writing–review and editing, Writing–original draft. YW: Data curation, Software, Writing–review and editing. ZW: Supervision, Funding acquisition, Writing–review and editing.
Funding
The author(s) declare that financial support was received for the research, authorship, and/or publication of this article. Zhuwen Wang: National Natural Science Foundation of China: 41790453 and 41874135; Xinghua Qi: Xinjiang backbone talent training program: 2024; Shimao Wang: College Students’ Innovative Entrepreneurial Training Plan Program: 202310994008.
Conflict of interest
The authors declare that the research was conducted in the absence of any commercial or financial relationships that could be construed as a potential conflict of interest.
Publisher’s note
All claims expressed in this article are solely those of the authors and do not necessarily represent those of their affiliated organizations, or those of the publisher, the editors and the reviewers. Any product that may be evaluated in this article, or claim that may be made by its manufacturer, is not guaranteed or endorsed by the publisher.
References
Chen, X., Zeng, W., Yuan, P., and Wang, Y. (2013). Design of a new three-lateral logging collector based on STM32. Electron. Prod. (No.6), 30–31. doi:10.16589/j.cnki.cn11-3571/tn.2013.06.009
Deng, S., Li, Z., and Li, Z. (2009). Response of dual laterolog and fast correction for layer thickness and shoulder bed in horizontal wells. Petroleum Explor. And Dev. 36 (No.6), 725–729. doi:10.1016/s1876-3804(10)60005-5
Deng, S., Mo, X., Lu, C., Zhang, Y., and Liu, L. (2012). Numerical simulation of the dual laterolog response to fractures and caves in fractured-cavernous formation. Petroleum Explor. And Dev. 39 (No.6), 751–757. doi:10.1016/s1876-3804(12)60100-1
Doll, H. G. (1951). The laterolog: a new resistivity logging method with electrodes using an automatic focusing system. J. Petroleum Technol. 3 (11), 305–316. doi:10.2118/951305-g
Fan, X., and Lu, L. (2005). Investigation on influence factors of laterolog curve form. Glob. Geol. 24 (No.4), 396–401.
Feng, J., Liu, D., Nin, X., Xu, G., Ao, X., and Xu, S. (2018). Impact analysis and rapid correction of layer thickness-shoulder bed for the response of array lateral logging in directional wells. Fault-Block Oil and Gas Field 25 (No.5), 593–597.
Ge, X., Fan, Y., Li, J., Tan, B., Wang, L., Wu, Z., et al. (2019). Expermental studies and investigations on the dual lateral log response of near borehole fractures. Chin. J. Geophys. 62 (No.1), 354–360. doi:10.6038/cjg2018L0128
Hu, S., Chen, L., and Wang, J. (2019). Fast inversion of array laterolog measurements in an axisymmetric medium. Appl. Geophys. 16 (No.4), 539–548. doi:10.1007/s11770-019-0767-0
Huang, M. (2010). Effect of mud intrusion on three lateral apparent resistivity logging and gamma logging: a case study of Nuheting uranium deposit. J. henan polytechinc Univ. Nat. Sci. 29 (No.A1), 72–74. doi:10.16186/j.cnki.1673-9787.2010.s1.008
Huo, Q., and Li, D. (1990). 3D finite element forward simulation of array laterolog curves in dipping formations. Coal Geol. China (2), 60–69.
Lan, Z. (2024). Discussion on coalbed methane mining mode of large dip coal seam in Xinjiang. China Petroleum Chem. Stand. Qual. 44 (No.17), 93–95.
Liang, Y., Tian, F., and Li, F. (2021). Design of borehole and surrounding rock correction program for array lateral logging based on COMSOL. Instrum. Tech. (No.5), 27–30. doi:10.19432/j.cnki.issn1006-2394.2021.05.008
Liu, D., Xia, P., Wan, W., Yan, L., and Zhao, J. (2012a). Response characteristics of dual laterolog in fractured carbonate reservoirs in horizontal Wells. Lithol. oil-gas Reserv. 24 (No.3), 1–4.
Liu, D., Yan, L., Xia, P., Wan, W., and Dong, D. (2012b). Response of dual lateral logging on interbeded sand-shale in horizontal well. J. Southwest Petroleum University:Science and Technol. Ed. 34 (No.3), 78–82. doi:10.3863/j.issn.1674-5086.2012.03.011
Lu, H., Wang, Y., Zhang, J., Zhong, J., Jiang, W., Wang, J., et al. (2021). Research on multi fracture and effective supporting fracturing technology in large dip coal seam of Xinjiang. China Energy Environ. Prot. 43 (No.3), 70–74. doi:10.19389/j.cnki.1003-0506.2021.03.014
Mohammed, S., Ahmed, F., Khalid, M., Fouad, S., Alsrory, A. S. A. E., and Mohammed, M. (2021). Structural and stratigraphic study of the Sharyoof oil field, Block 53, in Say’un-Masilah basin using seismic reflection and well logging methods, Yemen. Arabian J. Geosciences, Vol.14(14): 10. doi:10.1007/s12517-021-07672-5
Ni, X., Xu, G., Bie, K., Ao, X., Xu, S., and Liu, D. (2017). Influencing factors of array laterolog forword response for fractured reservoir based on horizontal well. Fault-Block Oil and Gas Field, Vol.24(No.6), 788–792. doi:10.6056/dkyqt201706012
Ni, X., Xu, G., Bie, K., Feng, J., Xu, S., and Liu, D. (2018). Array laterolog response and rapid correction of the surrounding rock/layer thickness influence for highly deviated/horizontal wells. Petroleum Geol. Oilfield Dev. Daqing 37 (No.2), 144–151. doi:10.19597/j.Issn.1000-3754.201705058
Pan, K., Wang, W., Tang, J., and Tan, Y. (2013). Mathematical model and fast finite element modeling of high resolution array lateral logging. Chin. J.Gephys.in Chin. 56 (No.9), 3197–3211. doi:10.6038/cjg20130932
Pan, W., Wu, F., and Meng, F. (2022). Numerical simulation of dual lateral logging resistivity of carbonate solution-vuggy reservoir. Sci. Technol. Eng. 22 (No.23), 10022–10033.
Saboorian-Jooybari, H., Dejam, M., Chen, Z., and Pourafshary, P. (2016). Comprehensive evaluation of fracture parameters by dual laterolog data. J. Appl. Geophys. 131, 214–221. doi:10.1016/j.jappgeo.2016.06.005
Shalaby, M. R., and Islam, M. A. (2017). Fracture detection using conventional well logging in carbonate Matulla Formation, Geisum oil field, southern Gulf of Suez, Egypt. J. Petroleum Explor. Prod. Technol. 7 (4), 977–989. doi:10.1007/s13202-017-0343-1
Si, Z., Deng, S., Lin, F., Yuan, X., Li, H., and Tian, C. (2020). Numerical simulation of laterolog response of mud intrusion anisotropic formation array. Geophys. Prospect. petroleum 55 (No.1), 187–196. doi:10.13810/j.cnki.issn.1000-7210.2020.01.022
Sushant, M., Fei, L., Alexandre, B., Arcady, R., and Ra, M. (2017). Modeling tools for drilling, reservoir navigation, and formation evaluation. J. Syst. Cybern. Inf. 3, 81–87.
Szijártó, M., Balázs, L., Drahos, D., and Galsa, A. (2017). Numerical sensitivity test of three-electrode laterolog borehole tool. Acta Geophys. 65 (4), 701–712. doi:10.1007/s11600-017-0063-4
Tang, G. (1985). Application effect of three-lateral logging instrument in coal geological exploration. Well logging Technol. 9 (No.4), 75–77. doi:10.16489/j.issn.1004-1338.1985.04.013
Wang, N., Wang, N., Wang, N., Li, K., Sun, J., Wang, D., et al. (2023). Research on dual lateral log simulation of shale bedding fractures under different influencing conditions. Front. Energy Res. 11, 1249985. doi:10.3389/fenrg.2023.1249985
Wiersberg, T., Pierdominici, S., Lorenz, H., Almqvist, B., and Klonowska, I. (2020). Identification of gas inflow zones in the COSC-1 borehole (Jämtland, central Sweden) by drilling mud gas monitoring, downhole geophysical logging and drill core analysis. Appl. Geochem. 114, 104513. doi:10.1016/j.apgeochem.2019.104513
Wu, J., Chen, M., Xu, W., Cun, D., Yang, D., and Ynag, H. (2022). Numerical model of dual laterolog intrusion response in tight fractured reservoir. Unconv. Oil and Gas 9 (No.4), 32–36. doi:10.19901/j.fcgyq.2022.04.05
Wu, J., Xie, W., Xie, X., Zhang, J., and Xu, X. (2008). Forward response analysis of array lateral logging tool. J. Xi Shiyou Univ. Nat. Sci. Ed. 23 (No.1), 73–76+80+113-114.
Xu, Y. (1988). Application of three-lateral logging method in stratified fixed thickness interpretation. Coal Geol. Explor. (3), 65–67.
Xue, Y., Wang, L., Zhao, X., and Tian, H. (2022). The fractured model study of low-permeability reservoir in xinli oil field. Front. Earth Sci. 10, 841456. doi:10.3389/feart.2022.841456
Zhang, Y., Wei, B., and Yang, H. (2002). Numerical analysis of response of dual laterolog instruments. Procress Geophys. 17 (No.4), 671–676.
Keywords: shallow three-electrode laterolog, numerical simulation, fractured coal seam, stratification and thickness determination, boundary of coal seam, wellbore enlargement
Citation: Qi X, Wang S, Wei Y and Wang Z (2025) Numerical simulation study on coal seam response characteristics of shallow three-electrode laterolog. Front. Earth Sci. 13:1499748. doi: 10.3389/feart.2025.1499748
Received: 21 September 2024; Accepted: 02 January 2025;
Published: 12 February 2025.
Edited by:
Weichao Yan, Ocean University of China, ChinaReviewed by:
Huachuan Wang, University of Strathclyde, United KingdomJiaqi Xu, Harbin Institute of Technology, China
Copyright © 2025 Qi, Wang, Wei and Wang. This is an open-access article distributed under the terms of the Creative Commons Attribution License (CC BY). The use, distribution or reproduction in other forums is permitted, provided the original author(s) and the copyright owner(s) are credited and that the original publication in this journal is cited, in accordance with accepted academic practice. No use, distribution or reproduction is permitted which does not comply with these terms.
*Correspondence: Zhuwen Wang, d2FuZ3p3QGpsdS5lZHUuY24=