 Li Li
Li Li Jie Yu1,2
 Xin Nie
94% of researchers rate our articles as excellent or good
Learn more about the work of our research integrity team to safeguard the quality of each article we publish.
Find out more
METHODS article
Front. Earth Sci., 25 February 2025
Sec. Solid Earth Geophysics
Volume 13 - 2025 | https://doi.org/10.3389/feart.2025.1488079
Net pay detection is a crucial stage in reservoir characterization, serving various purposes such as reserve estimation, reservoir modeling, simulation, and production planning. Net pay was quantified through the use of petrophysical cut-offs. However, these cut-offs varied according to core and dynamic data, introducing uncertainty into the evolution process. This challenge was particularly pronounced in tight sandstone reservoirs, characterized by low porosity. In the Linxing gas field of the Ordos Basin, the tight sandstone reservoirs of the Shiqianfeng, upper Shihezi, lower Shihezi, Shanxi, and Taiyuan formations exhibited ultra-low porosity and permeability, thereby complicating the determination of net pay cut-offs. This study utilized extensive data from the Linxing gas field, including core data from 50 wells, gas testing data from 217 wells, and comprehensive well logging and gas logging data. An analysis of the study area’s gas-bearing characteristics was presented, accompanied by a straightforward net pay cut-off evaluation workflow. The shale volume was evaluated to identify the net sand, while porosity and permeability evaluations were conducted to identify the net reservoir. Hydrocarbon saturation analysis was employed to establish net pay. Eight methods were employed to determine the net pay cut-offs. These include the particle size analysis for the shale volume cut-off, statistical accumulation frequency, minimum pore throat radius, mercury injection capillary pressure, gas production per meter index, and cross-plot analysis methods—based on fracturing gas test data—for porosity and permeability cut-offs. The bound water saturation and the relative permeability analysis methods were employed to determine hydrocarbon saturation cut-offs. Subsequently, formations were divided into two vertical sections; the upper section (including the fifth layer of the Shiqianfeng and upper Shihezi formations) is the target section in this study, with net pay cut-offs determined as follows: 20% shale volume, 6% porosity, 0.15 mD permeability, and 40% gas saturation. The net pay cut-offs determined in the upper section were validated against actual production data. This study provides a reliable basis for reserve calculation in the Linxing gas field, offering technical support for future development and production.
Net pay is a crucial parameter for the reservoir estimation of hydrocarbon resources, which plays a basic role in the evaluation of the petroleum industry (Worthington, 2010; Masoudi et al., 2014; Ju et al., 2017; Yang et al., 2019; Qassamipour et al., 2021). A net pay refers to a reservoir that can obtain industrial oil flow under current technological conditions (Duan et al., 2003). In practical applications, the net pay can fluctuate due to advancements in production and oil recovery technologies. Consequently, the cut-offs for net pay based on physical properties vary over time (Guo, 2004; Dai et al., 2005; Cui et al., 2007). Early research on net pay cut-offs has been significant, with Worthington publishing several papers discussing its importance and applications, along with proposed methods for its determination (Worthington and Cosentino, 2003; Worthington, 2005; Worthington, 2010; Worthington and Majid, 2013). These methods primarily involve assessing net sand, net reservoir, and net pay through rock physical parameters such as shale volume, porosity/permeability, and hydrocarbon saturation. Studies have concentrated on determining the cut-offs for porosity and permeability, leading to numerous proposed methodologies for determining net pay. For instance, Yang et al. (1990) proposed statistical accumulation frequency, gas production per meter index (Yang, 1990; Jiao et al., 2009; Liu et al., 2012, Li et al., 2013; Duan et al., 2014; Liu et al., 2018; Cheng et al., 2024), and testing data methods (Ye et al., 2020) to determine net pay. The statistical accumulation frequency method is commonly used in the United States and the offshore oil fields of China (Chen et al., 2016; Wang et al., 2019). Qiu and Chen (1996) proposed the minimum pore throat radius method to determine net pay (Qiu and Chen, 1996; Peng et al., 2009; Cao et al., 2013; Fu et al., 2014; Cai et al., 2015; Ge et al., 2016), while Wang (1999) proposed the relative permeability method for net pay determination (Wang, 1999; Zhou et al., 1999; Wang et al., 2010). Subsequently, many researchers have applied different methods across various regions to determine net pay. Unlike conventional gas reservoirs, tight sandstone gas reservoirs exhibit complex pore structures alongside low porosity and permeability, which complicates the determination of net pay cut-offs. Numerous methods have been developed for this purpose. When a considerable amount of single-layer test data for the cut-offs of net pay is not obtained, it is difficult to accurately determine the cut-offs. Many parameters extracted from mercury injection curves have been used to describe the character of reservoir pore structures; the mercury injection capillary pressure is also utilized to determine the net pay cut-offs (Liao and Wu, 1997; Hu and Pang, 2015; Cui et al., 2016). The particle size analysis method can determine the shale volume cut-off according to the relationship of porosity and shale volume (Worthington, 2010). The bound water saturation analysis method is used to determine the saturation cut-off (Liu et al., 2014; Lu et al., 2016; Gao, 2019).
These methods are employed individually or in combination to establish net pay cut-offs in various blocks. However, the different data and reservoir characteristics across each block necessitated varied methodologies. For example, in the southeastern part of the Ordos Basin, Hu and Pang (2015) utilized statistical methods, testing, and mercury injection capillary pressure analysis on the 8th member of the Shihezi Formation, thereby yielding results of 5% porosity, 0.08 mD permeability, and 45% gas saturation. Similarly, Lu (2020) studied the upper and lower Shihezi formations using the testing method, and it was observed that the cut-offs were 22% and 21% shale volume, 7% and 6.5% porosity, 0.2 mD permeability, and 60% gas saturation (Lu, 2020). Notably, there are few studies on the net pay cut-offs in the Linxing gas field within the Ordos Basin, with most studies employing singular methodologies. Given the relatively high exploration level in the Linxing gas field, numerous blocks and layers face the critical task of reserve evaluation and further development. Thus, the determination of net pay cut-offs in this block will provide essential insights for future studies on multiple blocks.
Furthermore, discussions surrounding the cut-offs of shale volume and gas saturation remain scarce, and there is no systematic study on the workflow of net pay cut-off determination across productive layers in the Linxing gas field. Additionally, with the influx of new data and technological advancements, net pay cut-offs continue to evolve. Therefore, detailed research is necessary to avoid the loss of effective reservoirs in this area. This study employed a combination of eight methods, namely, statistical accumulation frequency, minimum pore throat radius, mercury injection capillary pressure, particle size analysis, bound water saturation analysis, relative permeability analysis, dynamic data testing based on gas production per meter index, and cross-plot analysis methods. These methods comprehensively determined the net pay cut-offs, thereby achieving rational and enhanced results.
The Linxing gas field is situated in the transitional zone between the Yishan Slope and the Jinxi fold belt in the Ordos Basin. It is located west of the Lishi Fault Zone, with similar structural conditions as the Yishan Slope (Figure 1A). The regional tectonic background is characterized by a wide and gentle regional westward-dipping monocline, with a slope of 6 m/km–10 m/km and an inclination angle of <1°. Compared to the neighboring Sulige and Daniudi gas fields, the geological characteristics of the Linxing gas field were notably complex. This complexity was primarily manifested in the presence of multiple significant gas-bearing layers, including the upper Paleozoic Permian Shiqianfeng, upper Shihezi, lower Shihezi, Shanxi, Taiyuan, and carboniferous Benxi Formations (Figure 1B). The reservoir lithology exhibited considerable diversity, with higher contents of detritus and feldspar in the sandstone types. Six primary types of sandstone have been identified, namely, detrital feldspar, feldspar, detrital quartz, feldspar detritus, detritus, and quartz sandstones. The detrital composition was primarily derived from igneous and metamorphic rocks, with igneous detritus comprising acidic volcanic rock detritus, while the metamorphic detritus is primarily quartzite detritus. Various pore types are present within the reservoir of the Linxing gas field. Observation and analysis were conducted by casting thin sections, cathodoluminescence, and scanning electron microscopy, revealing that late-stage diagenesis was pronounced, resulting in the near-total disappearance of primary pores. Complete primary pores were rarely observed; instead, dissolution intergranular pores and intragranular dissolution pores were more prevalent, followed by primary residual intergranular pores and cement dissolution pores, along with a small number of microcracks (Chen et al., 2018; Liu et al., 2018).
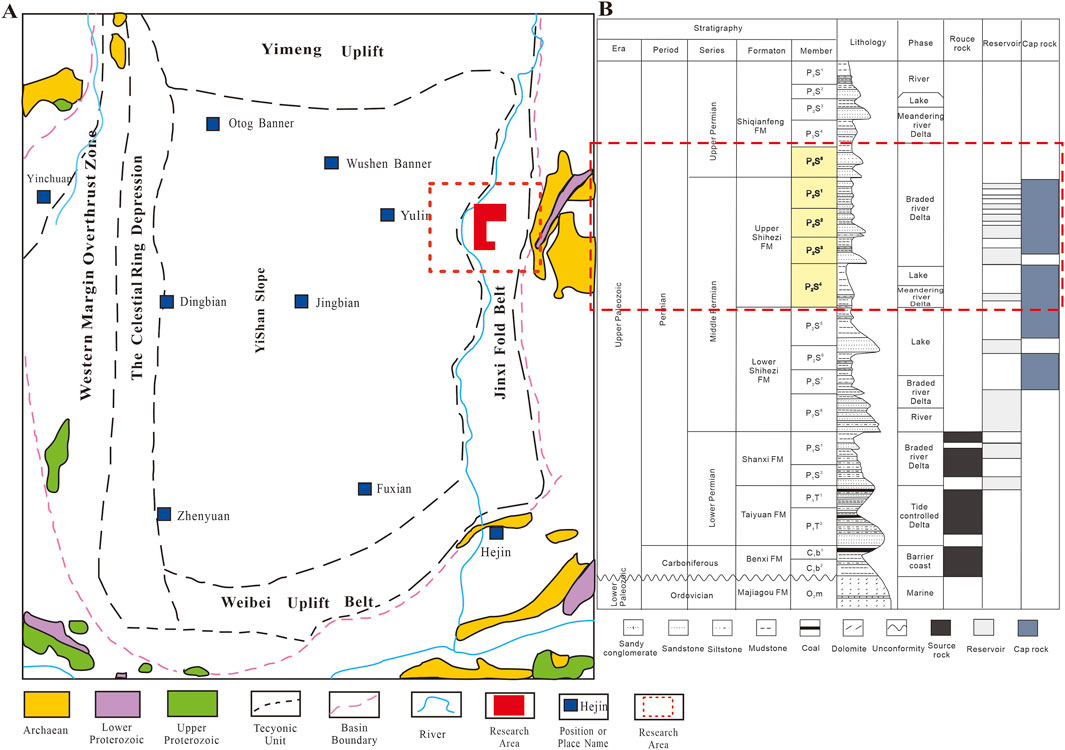
Figure 1. (A) Tectonic and geographic location of the study area [adapted from Ma et al. (2016)]. (B) Stratigraphic chart of the study area [adapted from Chen et al. (2018)].
The overall porosity and permeability of the target reservoir in this area were low, with porosity distribution ranging from 0.3% to 23.5%, averaging 8.2%, and porosity accounting for nearly 60% from 4.0% to 10.0%. The permeability was distributed between 0.01 mD and 66 mD, with a proportion of over 70% below 1 mD. Overall, it corresponded to an ultra-low porosity and permeability-tight sandstone reservoir. The upper Paleozoic sedimentary environment of the target layers in this study area has experienced the development and evolution of the marine tide-flat, barrier, and lagoon sediments in the Taiyuan Formation, the marine and continental transitional delta sediments in the Shanxi Formation, and then the river delta developed continental clastic sediments in the inland lake basin in the lower Shihezi, upper Shihezi, and Shiqianfeng formations. Sedimentary microfacies exhibit a significant impact on reservoir properties, with advantageous microfacies such as braided channels, estuarine bars, tidal channels, and sand flats exhibiting exceptional physical properties. Fine sandstone lithology has been identified as an effective reservoir. Figure 2 illustrates the relationship between porosity and permeability across different lithologies. In this figure, it was observed that coarser lithologies correlated with higher porosity and permeability (Qin et al., 2021; Lv et al., 2024; Jiao et al., 2024).
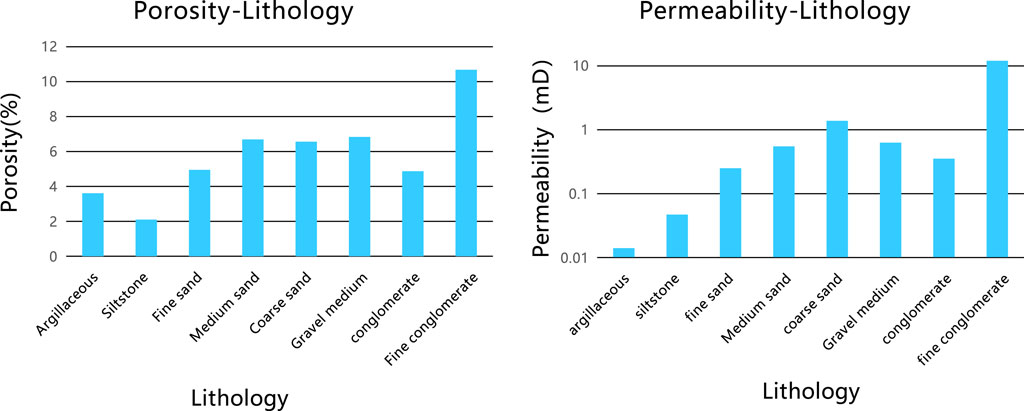
Figure 2. Relationship between porosity, permeability, and lithology.
There is adequate amount of data to support the results in this area. The testing and production layers in the study area encompassed 222 distinct layers, with over 50 wells providing more than 1,000 core sample data points (Table 1). There are also more than 200 wells with logging data such as gamma ray (GR), spontaneous potential (SP), caliper (CAL), deep resistivity (LLD), shallow resistivity (LLS), density (DEN), neutron porosity (CNCF), and sonic (DT); these logs were incorporated to enable a more comprehensive assessment of a reservoir by shedding light on its petrophysical properties (Asharaf et al., 2024a; Asharaf et al., 2024b). This extensive dataset lays a solid foundation for accurately determining the cut-offs of effective reservoir properties in the area.
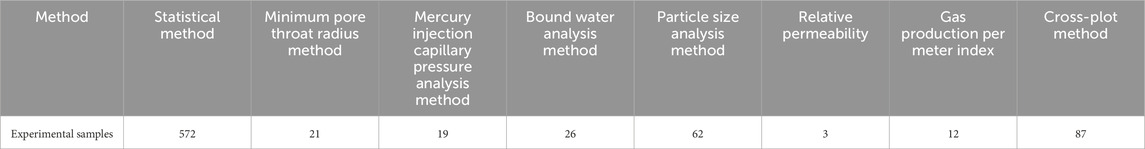
Table 1. Statistics of the experimental samples for each method.
The process of determining net pay cut-offs followed a defined workflow. Initially, the shale volume was determined to identify the net sand. Subsequently, porosity and permeability were determined to define the net reservoir, and hydrocarbon saturation was evaluated to determine the net pay (Figure 3). The cut-offs for each parameter were determined using different methods.
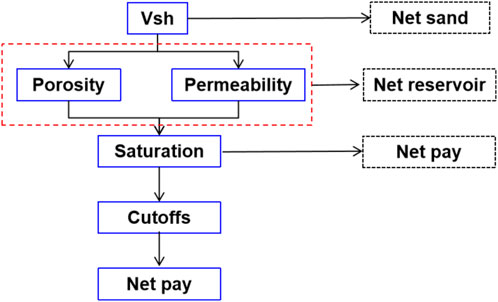
Figure 3. Workflow for determining net pay cut-offs.
The statistical method used was an accumulative frequency analysis based on core analysis for porosity and permeability. It applied a limit of approximately 5% of the total accumulated loss of energy storage and production capacity in low porosity and permeability sections. An American core analysis company has applied this method. Core analysis data for porosity and permeability were employed to create a frequency histogram showing porosity and permeability distribution. Furthermore, when the sample density was uniform, the percentage of accumulated porosity for samples below the cut-off was compared with the accumulated porosity of all samples, thereby reflecting the energy storage loss of the reservoir. Similarly, the accumulated permeability loss of samples below the permeability cut-offs, compared with the accumulated permeability, reflected the loss of reservoir productivity. The percentage of accumulated loss for both porosity and permeability also offered insights into the reduction in reservoir thickness (Equations 1 and 2). Given the specific data characteristics, the Linxing gas field sets a 5% limit for accumulated thickness loss, which ensures that both results are accurate and reliable.
where
The macroscopic porosity and permeability characteristics of rocks reflect their microscopic pore structure and pore size. The pores and channels within rocks serve as the channels for oil and gas storage and flow. Whether oil and gas can be extracted from rocks under a specific pressure difference depends on the thickness of these channels, specifically the channel radius (Jiao et al., 2009). The minimum pore throat radius for oil and gas represents the smallest pore channel capable of storing oil and gas, thereby facilitating their flow. This method begins with an experiment on the microscopic pore characteristics of rocks and utilizes mercury injection data to establish the relationship between pore throat radius and porosity. Given the minimum pore throat radius of the reservoir, the corresponding porosity was established as a cut-off point, from which the cut-off permeability was obtained according to the porosity–permeability relationship. Yang and Zou’s team researched data from the Sichuan Basin and the Sulige block of the Ordos Basin and found that the lower limit of the diameter of tight sandstone gas storage space is approximately 50 nm (radius of 0.025 µm) (Yang et al., 2015). The research area in this article is adjacent to the Sulige block of the Ordos Basin. According to the research, the minimum pore throat radius for tight sandstone gas reservoirs of the Linxing area is 0.025 µm.
Mercury injection testing has long been crucial for studying reservoir pore structures. The mercury injection capillary pressure curve provides insight into the size and distribution of pore throats within rock samples. Furthermore, through the analysis of capillary pressure curve morphology, numerous qualitative and quantitative characteristic parameters were obtained, including the saturation median pressure. This parameter reflects the properties of the reservoir. Furthermore, a relationship between capillary pressure and porosity was established utilizing mercury injection capillary pressure analysis data. Generally, the point of maximum change in capillary pressure, or the maximum inflection point on the curve, indicates the cut-off for effective reservoir porosity (Cui et al., 2016).
Water saturation is a crucial logging parameter in calculating conventional oil and gas reserves, thereby playing a crucial role in assessing reservoir effectiveness. Therefore, determining the cut-off of water saturation is essential for defining effective thickness. Furthermore, upon utilizing high-pressure semi-permeable partition capillary pressure data, a relationship was established between the bound water saturation of gas reservoirs and porosity from the core analysis. Given the cut-off porosity value, the cut-off of water saturation was assessed. This study established the relationship between bound water saturation in the gas reservoir and core analysis in the study area.
The shale volume is a key parameter for reservoir logging evaluation, which is the basis for accurately determining physical property parameters. Therefore, petrophysicists often use the cut-off of shale volume as an indicator for determining net pay. Currently, core particle size analysis can accurately calculate the shale volume. This method employs particle size analysis data to establish the relationship between the study area’s shale volume (including clay and fine sand) and porosity derived from core analysis.
For a given water saturation level, gas and water have a corresponding relative permeability. Notably, when the relative permeability of water dominates, the reservoir rock primarily produces water under mining conditions. Therefore, the lower inflection point on the gas relative permeability curve serves as a benchmark for determining the cut-off of reservoir rock. This inflection point presents a sudden change in the relative permeability of gas. The water saturation corresponding to this point indicates whether the reservoir rock has oil production potential. The lower inflection point of the gas relative permeability curve is often near the intersection of the gas and water relative permeability curves. Thus, the water saturation corresponding to the intersection point of their relative permeability was established as the cut-off for effective reservoirs (Wang, 1999).
The gas production per meter index method, also known as the testing method, is based on actual gas production data, core porosity, and permeability analysis data. The cut-off values for effective reservoirs were determined by plotting a graph that relates porosity, permeability, and the gas production per meter index. Studies have shown that the porosity or permeability value corresponding to a gas production per meter index of 0 m3/d·m represents the cut-off value for porosity or permeability in an effective reservoir.
The cross-plot analysis method combines gas testing and production data with parameters derived from logging to create a cross-plot of porosity, permeability, and saturation for both dry layer (non-effective) and production layers (effective). The effective values for porosity and permeability are often determined based on the boundary between the dry and production layers (Worthington, 2005). Upon utilizing testing production data and logging interpretation results from the Linxing gas field, cross-plots were developed for each layer’s porosity against shale volume and water saturation against porosity.
Core analysis methods employed in this study include accumulated frequency statistics, minimum pore throat radius analysis, mercury injection capillary pressure, particle size analysis, bound water analysis, and relative permeability analysis. Testing analysis methods were employed to investigate the cut-off values of petrophysical parameters, such as the gas production per meter index method and cross-plot analysis.
Given the accumulated frequency statistics, when the porosity of the upper section reached 5.0%, the accumulated energy storage decreased by 1.58%, and the thickness was reduced by 4.02%. Therefore, the cut-off value for porosity was established at 5.0% (Figure 4A). Additionally, when permeability was 0.08 mD, cumulative production capacity decreased by 0.02%, with a thickness loss of 2.93%. Therefore, the cut-off value for permeability was established at 0.08 mD (Figure 4B).

Figure 4. (A) Accumulated frequency of porosity along with the loss of reservoir storage. (B) Accumulated frequency of permeability along with production capacity from core analysis.
Upon utilizing mercury injection analysis data, the relationship between the median pore throat radius of sandstone in the study area and the porosity determined from rock core analysis was established for each layer. The cut-off of porosity corresponding to the median pore throat radius of 0.025 µm in the upper section was established at 5.0% (Figure 5A). Additionally, the cut-off permeability corresponded to the porosity–permeability relationship analyzed in the rock core, which was established at 0.03 mD (Figure 5B).
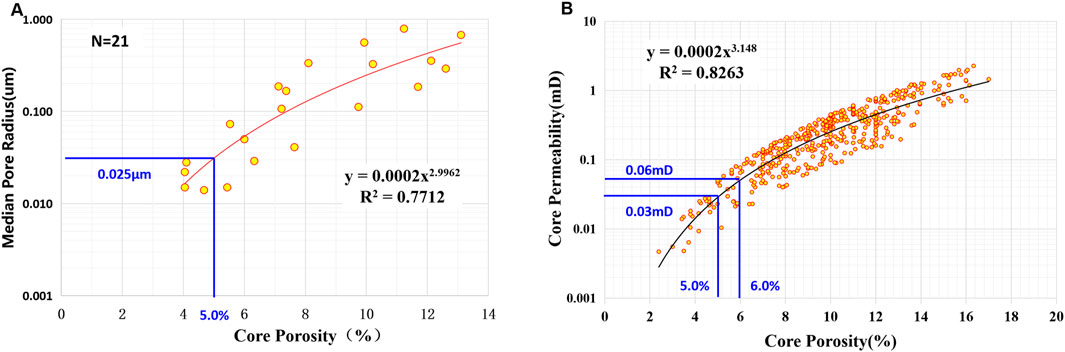
Figure 5. (A) Relationship between the median pore throat radius from mercury injection analysis and porosity from core analysis; (B) relationship between core analysis permeability and porosity.
According to the mercury injection testing method, a cross-plot was created to illustrate the relationship between the median capillary pressure (Pc50) and core analysis porosity for each layer. In the upper section, the porosity at the maximum turning point of capillary pressure was 6.0%, which served as the cut-off (Figure 6A). Additionally, according to the core analysis of the porosity–permeability relationship, the corresponding cut-off for permeability was 0.06 mD (Figure 5B).
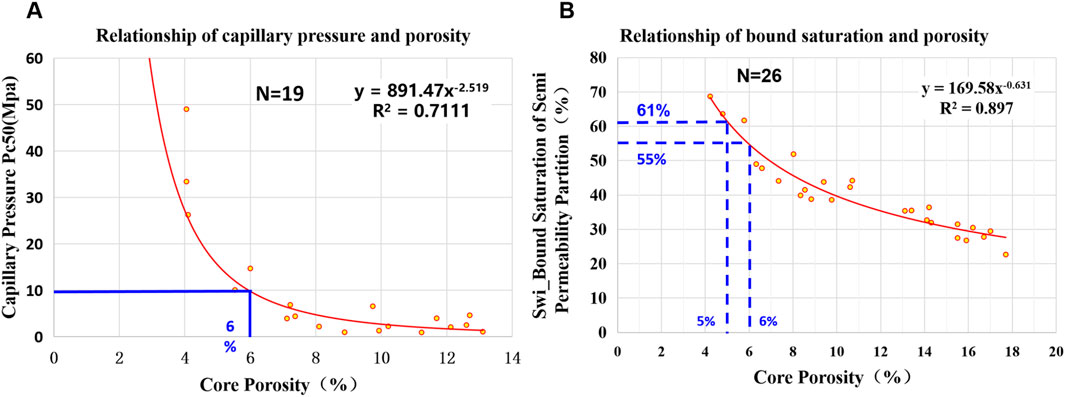
Figure 6. (A) Relationship between the capillary pressure from mercury injection analysis and porosity from core analysis in the upper section of the Linxing gas field. (B) Relationship between the bound saturation of the high-pressure semi-permeable barrier and porosity from core analysis in the upper section of the Linxing gas field.
Given the bound water analysis method, the relationship between gas reservoir-bound water saturation and core analysis porosity was established. According to statistical methods, the porosity of sandstone in the upper section was established at 5.0%, corresponding to a water saturation of 61%. Additionally, the mercury injection capillary pressure method indicated that the porosity of the sandstone in the upper section was 6.0%, which correlated with a water saturation of 55% (Figure 6B).
The cut-off for the shale volume was calculated based on the known porosity. As shown in Figure 7, using the accumulated frequency statistical method and the minimum pore throat radius method, the cut-off for porosity in the upper section was established at 5.0%, which corresponded to a shale volume of 23%. Subsequently, using the mercury injection capillary pressure method, the cut-off porosity for sandstone in the upper section was established at 6.0%, thereby corresponding to a shale volume of 20%.
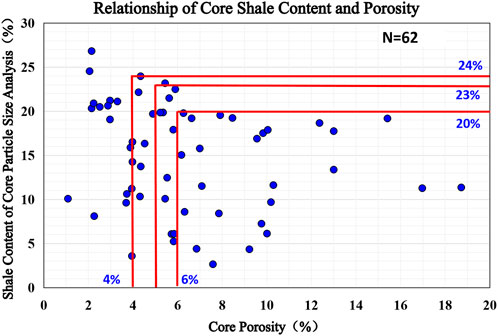
Figure 7. Relationship between shale volume (including clay and fine silt) and porosity from core analysis.
Given the gas–water permeability curves of the Linxing gas field, the water saturation corresponding to the intersection of the upper section’s gas–water permeability curves was between 52% and 56%. Therefore, the cut-off of water saturation for the upper section reservoirs was established at 56% (Figure 8).
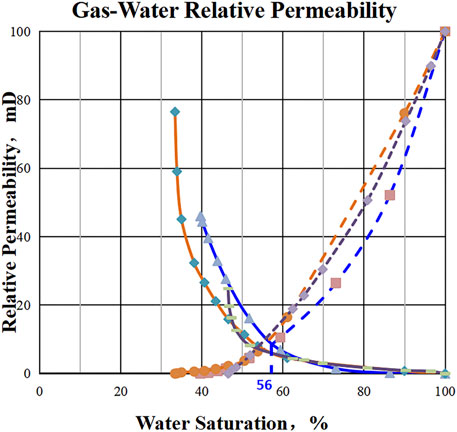
Figure 8. Gas–water relative permeability curves of the upper section in the Linxing gas field (different colors represent different points, the solid line represents gas relative permeability, and the dashed line represents water relative permeability).
Given the testing production data from the Linxing gas field and core analyses of porosity and permeability, a relationship graph was established between the gas production per meter index and core analyses of porosity and permeability (Figure 9). In the upper section, when the reservoir porosity was ≥6.0% (Figure 9A) and permeability was ≥0.15 mD (Figure 9B), the gas production index per meter was tested to be ≥0 m3/d·m. Therefore, the cut-off of porosity was determined to be ≥6.0%, and the cut-off of permeability was determined to be 0.15 mD.
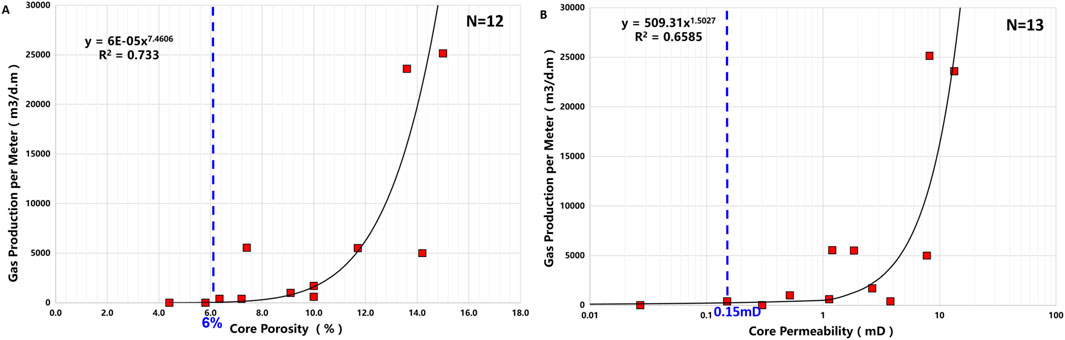
Figure 9. (A) Relationship between the testing gas production per meter index and porosity of core analysis in the Linxing gas field. (B) Relationship between the testing gas production per meter index and permeability of core analysis in the Linxing gas field.
According to the cross-plot analysis method, using production data and logging interpretation results from Linxing gas field testing, porosity–shale volume and water saturation–porosity cross-plots were established for the upper section (Figure 10). In the upper section, the shale volume cut-off of the tested gas and gas-bearing layers was 20%. The porosity cut-off of the tested gas layer, gas-bearing water layer, and dry layer was 6.0%. The water saturation cut-off of the tested gas and gas-bearing water layers was 60%. Therefore, the shale volume was determined to be ≤20%, the cut-off of the effective reservoir was defined as porosity ≥6.0%, and water saturation was determined to be ≤60%.
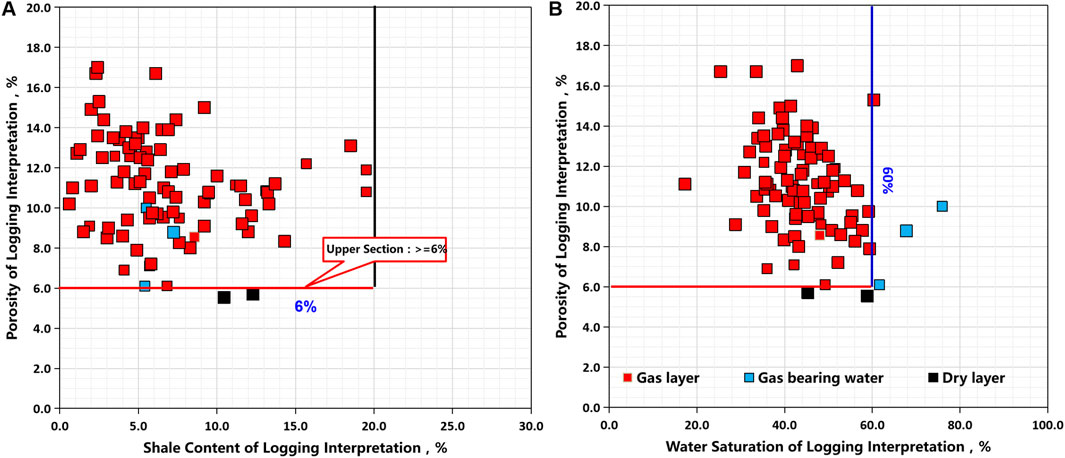
Figure 10. (A) Cross-plot of porosity and shale volume in the logging interpretation of the test layer in the Linxing gas field. (B) Cross-plot of porosity and water saturation in the logging interpretation of the test layer in the Linxing gas field.
Given the data and regional reservoir characteristics, various core analysis methods were employed to study the cut-offs of petrophysical parameters. These methods include accumulated frequency statistics, the minimum pore throat radius method, mercury injection capillary pressure, particle size analysis, bound water analysis, and relative permeability analysis. The testing analysis methods used to determine the cut-offs include the gas production per meter index method and cross-plot analysis. The results from these various methods were integrated to establish a scientifically robust cut-off (Table 2).
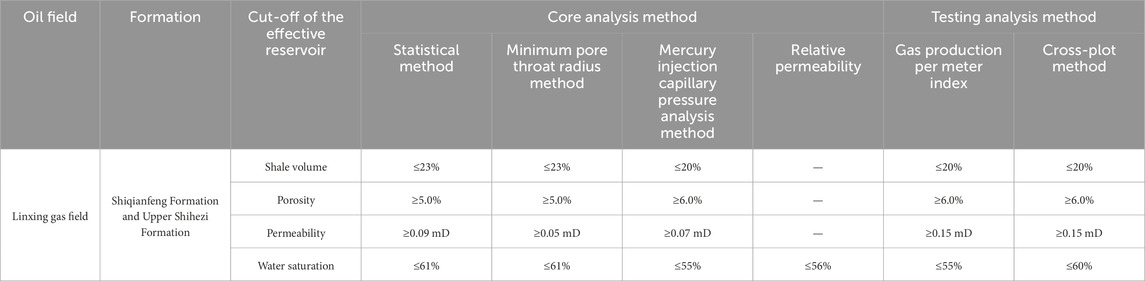
Table 2. Statistics of net pay cut-offs from various methods in the Linxing gas field.
As a result, multiple methods were utilized to determine the cut-offs of effective reservoirs across different layers. Generally, cut-offs determined using the testing method were relatively conservative, while those derived from core analysis tended to be more optimistic. Despite the cut-offs being primarily according to test data, the cut-off determined using the core method strongly supported these results.
The cut-offs obtained from this study have been verified using test data (Figure 11). In the LX-A well, specifically in the 1514.8–1519.2 m section, the thickness reached 4.4 m, with an average core permeability of 0.068 mD and an average calculated permeability of 0.086 mD. The average core porosity was 5.96%, while the average calculated porosity was 5.70%, thereby meeting the cut-off standard for the Linxing gas field gas reservoir. After fracturing and gas testing, a production rate of 12,100 cubic meters/day was achieved, further validating the cut-offs’ accuracy for porosity and permeability in the Linxing gas field. At the 2000 m–2010 m section of the LX-B well, the thickness reached 10 m, the average calculated permeability was 0.09 mD, and the average calculated porosity was 5.30%, thereby meeting the cut-off standard of the Linxing gas field gas reservoir (Figure 12). The fracturing and gas testing resulted in a production rate of 8,300 cubic meters/day, thereby verifying the accuracy of the cut-offs for porosity and permeability.
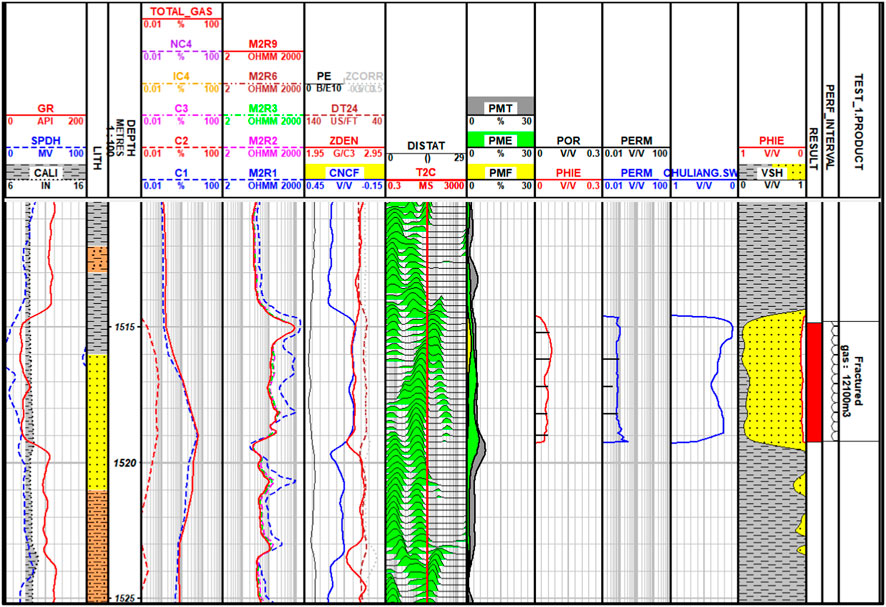
Figure 11. Logging interpretation results for well LX-A.
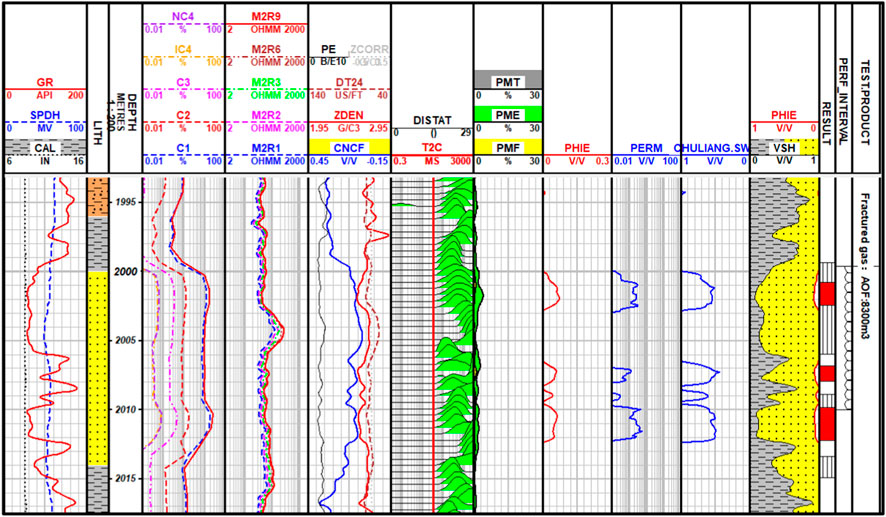
Figure 12. Logging interpretation results for well LX-B.
Notably, test data were dynamic, indicating that an effective reservoir’s cut-off evolved as new data were acquired. Previous studies have shown cut-offs of 7% porosity for the upper Shihezi Formation and 0.2 mD permeability, which are significantly higher than the cut-offs obtained in this study. Furthermore, using this set of data for logging interpretation, the upper layer was identified as a dry layer. However, actual production has been recorded in the well. Therefore, reserve estimates, according to the previous cut-offs, were notably lower. Consequently, the cut-off for this block has been re-evaluated, which resulted in a substantial increase in the estimated reserves, thereby offering accurate support for future development and production efforts in this area.
Given the abovementioned methods, the upper section net pay cut-offs of the Linxing area were as follows: shale volume was 20%, porosity was 6%, permeability was 0.15 mD, and hydrocarbon saturation was 40%. These values varied based on core and production data. The Ordos Basin is one of the most productive and petroliferous creation basins with the highest annual output in China (Anees et al., 2022a; Anees et al., 2022b). Compared with other fields of the Ordos Basin, the net pay cut-offs in the Linxing area represent average values (Table 2). The Sulige gas field, located adjacent to the Linxing gas field, exhibited lower cut-offs than those of Linxing: porosity was 3.0% and permeability was 0.04 mD (Yang et al., 2014). The net pay cut-offs of the Longdong area of the northern Ordos Basin were as follows: porosity was 4.1% and permeability was 0.36 mD (Ye et al., 2020). The cut-offs for the Xifeng oil field of the southern Ordos Basin were 7.0% porosity and 0.1 mD permeability (Hou et al., 2003). Moreover, the cut-offs for other oil fields were as follows: the porosity and permeability of the Yanchang Formation were 5.7% and 0.0276 mD, respectively (Fu et al., 2014); the porosity and permeability of the Huaqing area were 8.0% and 0.08 mD, respectively (Liu et al., 2010); the porosity and permeability of the Laoshan area were 8.0% and 0.22 mD, respectively (Gao et al., 2012); the porosity and permeability of the Maling area were 6.4% and 0.0491 mD, respectively (Wang et al., 2020); the porosity of the Hangjinqi area was 5%–10% (Ashraf et al., 2022; Anees et al., 2022c); and the porosity and permeability of the Shenmu gas field were 5.8% and 0.15 mD, respectively (Fu et al., 2018). The cut-offs for the Linxing gas field potentially decreased with enhanced engineering technology.
Some scholars have suggested that tight sand exhibits 5%–10% porosity values (Asharaf et al., 2024a; Asharaf et al., 2024b). Compared with nearby fields, the porosity and permeability of the Sichuan Basin were 3.9% and 0.1 mD (Wei et al., 2005) and 5.85% and 0.037 mD, respectively (Li et al., 2014); the porosity and permeability of the Songliao Basin were 5.0% and 0.03 mD, respectively (Xie, 2017); the porosity and permeability of the Junggar Basin were 16% and 2.5 mD, respectively (Lu et al., 2022); and the porosity and permeability of the Bohai Bay Basin were 12% and 1.5 mD, respectively (Geng et al., 1999) (Table 3). China’s tight sandstone oil and gas is widely distributed in Ordos, Sichuan, Songliao, Bohai Bay, and Junggar basins, with the Ordos and Sichuan basins being the most abundant. Due to the poor fluidity of oil, the cut-offs of oil reservoirs are higher than those of gas reservoirs, such as Songliao, Junggar, Bohai Bay oil fields, and Huaqing, Laoshan, Maling, and Xifeng oil fields in the Ordos Basin. Therefore, their cut-off values are significantly higher than those of gas fields. The cut-offs of gas reservoirs in Ordos and Sichuan are relatively lower, and the difference between them is slight. The main reason for the difference is the geological and sedimentary environmental differences. For example, the Sichuan Basin is mainly composed of subaqueous distributary channels and river mouth bar sedimentary microfacies. In contrast, the Ordos Basin is mainly composed of river delta facies and semi-deep lake or deep lake facies sedimentation. In the lake facies sedimentary environment, the pore throats are tiny, the structure is complex, and the cut-offs are low.
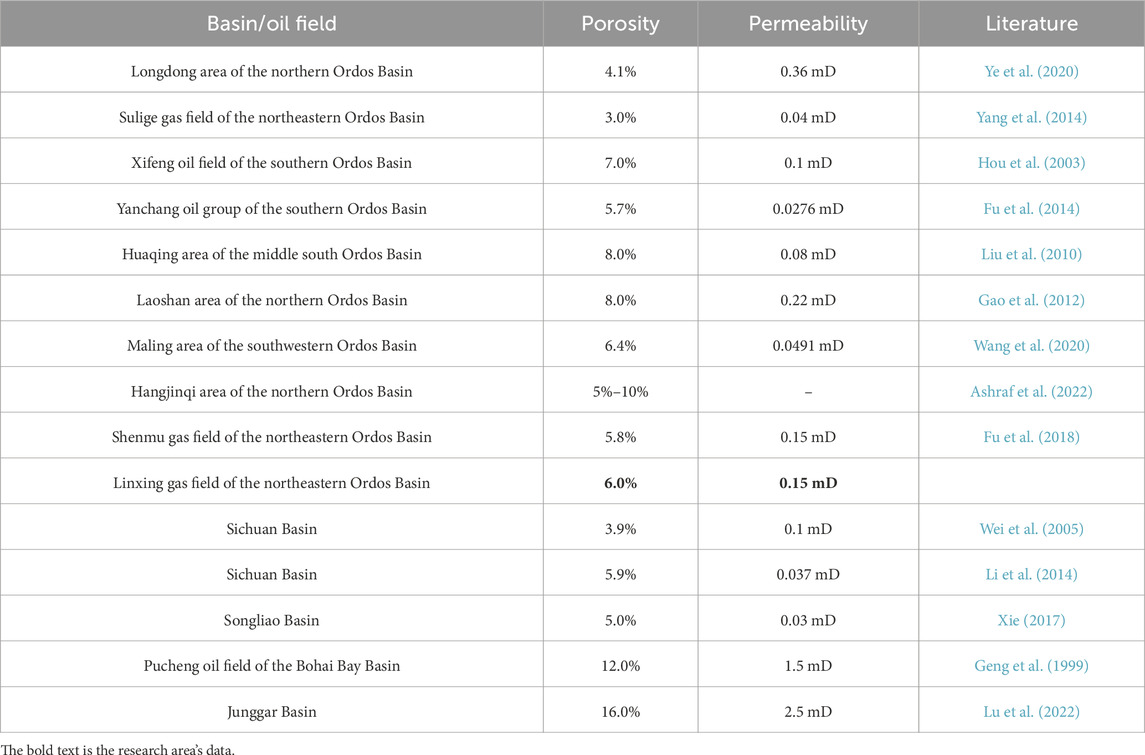
Table 3. Cut-offs in different areas of the Ordos Basin and the nearby basins.
The cumulative frequency statistical method relies heavily on comprehensive core data for support. However, it has a notable disadvantage: the selection of loss boundaries depends on experience, leading to potential discrepancies among evaluators. The minimum pore throat radius method and the mercury injection capillary pressure method establish a relationship with porosity but require extensive experimental data for enhanced accuracy. The minimum pore throat radius method necessitates determining the minimum pore throat radius, which relies on empirical data from the research area. In contrast, the mercury injection capillary pressure method requires identifying the maximum turning point, often resulting in significant manual interference. The particle size analysis method establishes a relationship between shale volume and porosity, thereby determining the cut-off for shale volume according to known porosity cut-offs. Generally, the gas–water permeability method considers water saturation at the intersection point of the gas and water relative permeability curves as the upper cut-off for reservoir water saturation. However, this approach may overlook some oil and water layers, thereby reducing net pay. The intersection and the gas recovery index per meter methods utilize actual production data to identify cut-offs, offering significant guidance for actual production. However, the disadvantage is that their determined physical properties often exceed actual values, and both methods require substantial well-production data, which limits their application in early-stage exploration research.
This study developed a workflow for determining net pay cut-offs, with the following key findings:
1. There are various methods for evaluating net pay cut-offs, each with distinct advantages and limitations. The method selection was based on the specific data available for the research area. A combination of multiple methods proved a more objective assessment of net pay cut-offs, with net pay cut-offs determined as follows: 20% shale volume, 6% porosity, 0.15 mD permeability, and 40% gas saturation.
2. This study utilized extensive core, logging, and testing data to apply eight methods for re-evaluating net pay cut-offs in the research area. Furthermore, considering various factors, the cut-offs of shale volume, porosity, permeability, and gas saturation were determined. These results were validated using test data, which were lower than the existing porosity and permeability cut-offs. The lower cut-offs significantly enhanced the calculated reserves, laying the foundation for efficient development and production in subsequent stages.
3. In comparison with previous research, it was observed that the cut-offs for each block and layer varied due to the strong heterogeneity of tight sandstone gas reservoirs. Furthermore, these cut-offs evolved. Therefore, studying effective reservoirs is an ongoing process, necessitating continual updates to improve the accuracy of calculated effective thickness, thereby enhancing the precision of later development and production efforts.
The original contributions presented in the study are included in the article/Supplementary Material; further inquiries can be directed to the corresponding author.
LL: writing–original draft and writing–review and editing. JY: writing–original draft, methodology, and supervision. TH: data curation, investigation, and writing–original draft. LT: data curation, investigation, methodology, and writing–review and editing. DW: methodology, supervision, and writing–review and editing. ML: data curation, investigation, and writing–review and editing. XN: data curation, methodology, supervision, and writing–review and editing.
The author(s) declare that financial support was received for the research, authorship, and/or publication of this article. This study was financially supported by the National Natural Science Foundation of China (no. U23B20158).
The authors declare that the research was conducted in the absence of any commercial or financial relationships that could be construed as a potential conflict of interest.
The reviewer XW declared a shared affiliation with the author XN to the handling editor at the time of review.
All claims expressed in this article are solely those of the authors and do not necessarily represent those of their affiliated organizations, or those of the publisher, the editors and the reviewers. Any product that may be evaluated in this article, or claim that may be made by its manufacturer, is not guaranteed or endorsed by the publisher.
Anees, A., Zhang, H., Ashraf, U., Wang, R., Liu, K., Abbas, A., et al. (2022b). Sedimentary facies controls for reservoir quality prediction of lower Shihezi member-1 of the Hangjinqi area, Ordos Basin. Minerals 12, 126. doi:10.3390/min12020126
Anees, A., Zhang, H., Ashraf, U., Wang, R., Liu, K., Mangi, H. N., et al. (2022a). Identification of favorable zones of gas accumulation via fault distribution and sedimentary facies: insights from Hangjinqi Area, northern Ordos Basin. Front. Earth Sci. 9, 822670. doi:10.3389/feart.2021.822670
Anees, A., Zhang, H., Ashraf, U., Wang, R., Thanh, H. V., Radwan, A. E., et al. (2022c). Sand-ratio distribution in an unconventional tight sandstone reservoir of Hangjinqi area, Ordos Basin: acoustic impedance inversion-based reservoir quality prediction. Front. Earth Sci. 10, 1018105. doi:10.3389/feart.2022.1018105
Ashraf, U., Anees, A., Shi, W., Wang, R., Ali, M., Jiang, R., et al. (2022). Estimation of porosity and facies distribution through seismic inversion in an unconventional tight sandstone reservoir of Hangjinqi area, Ordos basin. Front. Earth Sci. 10, 1014052. doi:10.3389/feart.2022.1014052
Ashraf, U., Shi, W., Zhang, H., Anees, A., Jiang, R., Ali, M., et al. (2024a). Reservoir rock typing assessment in a coal-tight sand based heterogeneous geological formation through advanced AI methods. Sci. Rep. 14, 5659. doi:10.1038/s41598-024-55250-y
Ashraf, U., Zhang, H., Thanh, H., Anees, A., Ali, M., Duan, Z., et al. (2024b). A robust strategy of geophysical logging for predicting payable lithofacies to forecast sweet spots using digital intelligence paradigms in a Heterogeneous Gas Field. Nat. Resour. Res. 33, 1741–1762. doi:10.1007/s11053-024-10350-4
Cai, Z., Zhao, C., and Du, Y. (2015). Study on the effective thickness of Yan 10 reservoir in M area of Ordos Basin Maling oil field. Liaoning Chem. Ind. 44 (4), 451–455. doi:10.1051/e3sconf/202339401017
Cao, Q., Zhao, J., Liu, X., Hu, A., Fan, L., and Wang, H. (2013). Determination of physical property limits for the gas accumulation in tight sandstone reservoirs in eastern Ordos Basin. ACTA Pet. Sin. 34 (6), 1040–1048. doi:10.7623/syxb201306002
Chen, X., Pang, X., and Shao, X. (2018). Accumulation conditions of tight sandstone gas in the lower Shihezi Formation in linxing A area, Ordos Basin. Geol. Sci. Technol. Inf. 37 (1), 169–175.
Chen, Z., Ren, Z., Wang, S., Liu, P., Xue, W., Deng, Y., et al. (2016). Lowest limit for the gas-bearing capacity of reservoirs in the eastern Sulige gas field, Ordos Basin. Petroleum Geol. and Exp. 38 (4), 521–527.
Cheng, Y., Fu, L., Hou, W., Carcione, J. M., Deng, W., and Wang, Z. (2024). Thermo-poroelastic AVO modeling of Olkaria geothermal reservoirs. Geoenergy Sci. Eng. 241, 213166. doi:10.1016/j.geoen.2024.213166
Cui, Y. (2007). Determination methods of the petrophysical lower limit value for the effective reservoir. World Well Logging Technol. 22 (3), 32–35.
Cui, Y., Wang, G., Sun, Y., Wang, D., and Li, R. (2016). Methods of cutoff determination and applicability analysis in low porosity and low permeability reservoir. J. Southwest Petroleum Univ. Sci. and Technol. Ed. 38 (6), 35–48. doi:10.11885/j.issn.1674-5086.2015.02.04.05
Dai, Z., Ritzi, R. W., and Dominic, D. F. (2005). Improving permeability semivariograms with transition probability models of hierarchical sedimentary architecture derived from outcrop analog studies. Water Resour. Res. 41, W07032. doi:10.1029/2004wr003515
Duan, X., Wang, H., and Hu, Y. (2003). Methods of determining the lower limits of different parameters of reservoir in Anpeng Oilfield, Henan. J. Chengdu Univ. Technol. Sci. and Technol. Ed. 30 (2), 169–173.
Duan, Y., Pan, B., Zhuang, H., Zhang, H., Yang, X., Han, X., et al. (2014). Research on lower limits of physical property of tight sand reservoirs in Sulige gas field. Glob. Geol. 33 (4), 861–866. doi:10.3969/j.issn.1004-5589.2014.04.013
Fu, J., Luo, J., Zhang, N., Deng, X., Lv, J., Wu, K., et al. (2014). Determine lower limits of physical properties of effective reservoirs in Chang 7 oil formation in Ordos Basin. China Pet. Explor. 19 (6), 82–88. doi:10.3969/j.issn.1672-7703.2014.06.0010
Fu, K., Kang, Z., and Hao, W. (2018). Research on lower limit of effective thickness of compact sandstone reservoir in Shenmu Gas Field. Coal Technol. 37 (07), 122–124. doi:10.13301/j.cnki.ct.2018.07.043
Gao, D., Tong, M., and Su, G. (2012). Four-property relation and determination of net pay cut-off thickness of Chang-6 reservoir of Laoshan area. Petroleum Geol. Eng. 26 (3), 43–45.
Gao, S. (2019). Study on the physical property cutoffs and classification of tight sandstone reservoirs in the north depression of Tadong Oilfield. World Well Logging Technol. 46 (103), 152–154.
Ge, H., Wu, Q., and Gao, C. (2016). Methods for determining the lower limit if physical properties of low porosity and low permeability reservoir in A region. J. Yangtze Univ. Nat. Sci. Ed. 13 (26), 24–28. doi:10.16772/j.cnki.1673-1409.2016.26.005
Geng, L., Cao, Y., and Yi, Z. (1999). A study on petrophysical property cutoffs of sandstone reservoirs in Pucheng oil field. Petroleum Explor. Dev. 26 (1), 81–83.
Guo, R. (2004). Supplement to determining method of cut-off value of net pay. Petroleum Explor. Dev. 5 (31), 140–144.
Hou, Y., Guo, Q., and Li, G. (2003). The study of net pay cutoff about Xi Feng Oilfield. China Pet. Explor. 8 (2), 51–54.
Hu, L., and Pang, C. (2015). Determination of the cutoff of effective reservoir for the upper paleozoic He 8 member in the southeast of the Ordos Basin. Ground Water 37 (3), 183–184.
Jiao, C., Xia, D., Wang, J., Liu, L., Sheng, W., and Cheng, P. (2009). Methods for determining the petrophysical property cutoffs of extra low porosity and permeability sandstone reservoirs-an example from Xishanyao Formation reservoirs in Yongjin oil field. Oil and Gas Geol. 30 (3), 381–383.
Jiao, S., Li, W., Li, Z., Gai, J., Zou, L., and Su, Y. (2024). Hybrid physics-machine learning models for predicting rate of penetration in the Halahatang oil field, Tarim Basin. Sci. Rep. 14, 5957. doi:10.1038/s41598-024-56640-y
Ju, S., Liu, B., and Li, W. (2017). Research on the determination method of the porosity and permeability cutoffs for tight sandstone reservoir. Oil and gas Explor. Dev. 35 (3), 62–67. doi:10.3969/j.issn.1006-5539.2017.03.011
Li, J., Luo, B., Zhang, X., Hou, W., and Yue, X. (2013). Methods to determine the lower limits and controlling factors of the effective reservoir of tight sand gas reservoirs. J. Southwest Petroleum Univ. Sci. and Technol. Ed. 35 (2), 54–62. doi:10.3863/j.issn.1674-5086.2013.02.008
Li, Y., Sima, L., and Yan, J. (2014). Determination of petrophysical property cutoffs of tight sandstone gas reservoirs: a case study of T3x2 gas reservoirs in P area of central Sichuan Basin. Nat. Gas. Ind. 34 (4), 52–56. doi:10.3787/j.issn.1000-0976.2014.04.007
Liao, M., and Wu, X. (1997). A new pore-structure parameter RApex and its application in reservoir studies. J. southwest Petroleum Inst. 19 (2), 5–9.
Liu, C., Wang, Q., and Wang, Y. (2018). Research on controlling factors of reservoir development in upper paleozoic He 8 member in linxing midlle block, Ordos Basin. China Offshore oil gas 30 (1), 50–61. doi:10.11935/j.issn.1673-1506.2018.01.006
Liu, M., Feng, Z., Cai, Y., Su, P., and Zhu, Z. (2014). Present situation and developmental trend of the research on methodology for determination of physical properties cut-off of an effective reservoir. Acta Geol. Si Chuan 34 (1), 9–13. doi:10.3969/j.issn.1006-0995.2014.01.003
Liu, X., Li, W., and Han, W. (2010). Research on the and net pay cut-off thickness of Chang-6 reservoir in Huaqing Region. Northwest. Geol. 43 (1), 124–129.
Liu, Z., Huang, Y., and Pan, G. (2012). Determination of critical properties of lower porosity and permeability sandstone reservoir and its significance in petroleum geology. ACTA Geol. Sin. 86 (11), 1815–1825.
Liu, Z., Shi, Y., Zhou, J., Wang, C., Zhang, Y., and Zhang, P. (2018). Review and applicability analysis of determining methods for the lower limit of physical properties of effective reservoirs. Prog. Geophys. 33 (3), 1102–1109. doi:10.6038/pg2018BB0318
Lu, K., Li, Z., Li, X., Wu, K., Xu, Z., and Zheng, B. (2022). Research on four-property relationship and lower limit standard of effective thickness of reservoir of J1s2 formation in Mahu 1 well block. J. Chongqing Univ. Sci. Technol. Nat. Sci. Ed. 24 (3). doi:10.19406/j.cnki.cqkjxyxbzkb.2022.03.003
Lu, X. (2020). Analysis on the cutoffs of physical properties of tight sandstone reservoir in Shihezi Formation in Linxing gas field. Sci. Manag. 6, 329–330.
Lu, Z., Han, X., Zhang, X., Sun, T., Wang, J., Li, Y., et al. (2016). Research status and outlook for methods of determining petrophysical property cutoffs. J. China Univ. Petroleum 40 (5), 32–42. doi:10.3969/j.issn.1673-5005.2016.05.004
Lv, Q., Liu, S., Mao, W., Yu, Y., and Long, X. (2024). A numerical simulation-based ANN method to determine the shear strength parameters of rock minerals in nanoscale. Comput. Geotechnics 169, 106175. doi:10.1016/j.compgeo.2024.106175
Ma, D., Xu, Y., Lv, Y., Ji, H., Tuo, C., Hao, L., et al. (2016). Relationship between provenance and formation of lower Shihezi Formation in linxing area, Ordos Basin, China. Nat. Gas. Geosci. 27 (7), 1215–1224. doi:10.11764/j.issn.1672-1926.2016.07.1215
Masoudi, P., Arbab, B., and Mohammadrezaei, H. (2014). Net pay determination by artificial neural network: case study on Iranian offshore oil fields. J. Petroleum Sci. Eng. 123, 72–77. doi:10.1016/j.petrol.2014.07.007
Peng, B., Lv, G., and Wanyan, Q. (2009). Determining lower limit of physical property in low-porosity and low-permeability sandstone reservoirs: an example from the 3rd layer in P1S2 of Zizhou Gasfield. Nat. Gas. Technol. 3 (1), 34–36. doi:10.1007/s11707-020-0851-z
Qassamipour, M., Khodapanah, E., and Alireza, (2021). A comprehensive method for determining net pay in exploration/development wells. J. Petroleum Sci. Eng. 196, 107849. doi:10.1016/j.petrol.2020.107849
Qin, R., Li, M., Yu, J., Tang, L., Huang, T., and Li, L. (2021). Fine logging evaluation of Linxing area tight Sandstone gas reservoir parameter. Well Logging Technol. 45 (5), 526–533. doi:10.16489/j.issn.1004-1338.2021.05.015
Wang, H., Xiao, H., Miao, C., Ma, H., and Li, S. (2020). Petroleum geology and oilfield development in daqing. 39 (2): 147–156. doi:10.19597/j.issn.1000-3754.201904060
Wang, J., Liu, X., and Cui, Z. (2010). The methods for determination of cutoff values of reservoir porosity and permeability. Xinjiang Pet. Geol. 31 (2), 203–207.
Wang, Z., Guo, R., and Wang, C. (2019). Four-property relationship and effective thickness lower limit of Chang2 Section in Ansai oilfield. Henan Sci. 37 (12), 2018–2024.
Wei, X., Xie, J., Tang, D., Chen, H., and Xie, B. (2005). Methods of determining the matrix petrophysical cutoffs of low porosity and low permeability sandstone reservoir-taking the J2s1 oil reservoir in LA field in central Sichuan as an example. Nat. Gas. Ind. 5 (31), 28–31. doi:10.1007/s11707-020-0851-z
Worthington, P. F. (2005). The application of cut-offs in integrated reservoir studies. SPE Reserv. Eval. Eng. 95428, 1–8. doi:10.2118/95428-PA
Worthington, P. F. (2010). Net Pay-What is it? What does it do? How do we quantify it? How do we use it? SPE Reserv. Eval. Eng. 13, 812–822. doi:10.2118/123561-pa
Worthington, P. F., and Cosentino, L. (2003). The role of cut-offs in integrated reservoir studies. SPE Reserv. Eval. Eng. 84387, 1–16. doi:10.2118/84387-MS
Worthington, P. F., and Majid, A. A. (2013). The Use of net-pay concepts in the exploitation of shale-gas deposits. J. Pet. Sci. Eng., 1–9. doi:10.2118/167044-MS
Xie, B. (2017). Analysis of the net pay and controlling factors of physical properties of tight sandstone reservoirs in the Fuyu oil layer in the northern Songliao Basin. West-China Explor. Eng. 5, 78–81.
Yang, T., Cao, Y., Wang, Y., Liu, K., He, C., and Zhang, S. (2019). Determining permeability cut-off values for net pay study of a low-permeability clastic reservoir: a case study of the Dongying Sag, eastern China. J. Petroleum Sci. Eng. 178, 262–271. doi:10.1016/j.petrol.2019.03.030
Yang, T. (1990). Calculation method for oil and natural gas reserves. Beijing: Petroleum Industry Press.
Yang, X., Shi, Y., Zhang, H., and Zhong, X. (2014). Re-recognize lower-bound of Sulige Gas field tight gas. Well Logging Technol. 38 (3), 325–329. doi:10.3969/j.issn.1004-1338.2014.03.014
Yang, Z., Zou, C., Wu, S., Tao, S., Hou, L., Zhu, R., et al. (2015). Characteristics of nano-sized pore-throat in unconventional tight reservoir rocks and its scientific value. J. Shenzhen Univ. Sci. Eng. 32 (3), 257–265. doi:10.3724/sp.j.1249.2015.03257
Ye, C., Liu, H., Li, C., Gao, W., Li, Q., and Pan, N. (2020). Four-property characteristics of tight sandstone reservoirs and determining their minimum effective thickness: an example from Shan 1 Member, Longdong area, Ordos Basin. Nat. Gas Technol. Econ. 14 (2), 6–11. doi:10.3969/j.issn.2095-1132.2020.02.002
Keywords: Linxing gas field, tight sandstone, net pay cut-offs, reserve evaluation, Ordos Basin
Citation: Li L, Yu J, Huang T, Tang L, Wei D, Li M and Nie X (2025) Integrated net pay cut-off evaluation workflow for tight sandstone reservoirs: a case study of the Linxing gas field, Ordos Basin. Front. Earth Sci. 13:1488079. doi: 10.3389/feart.2025.1488079
Received: 29 August 2024; Accepted: 23 January 2025;
Published: 25 February 2025.
Edited by:
Giovanni Martinelli, National Institute of Geophysics and Volcanology, Section of Palermo, ItalyReviewed by:
Xixin Wang, Yangtze University, ChinaCopyright © 2025 Li, Yu, Huang, Tang, Wei, Li and Nie. This is an open-access article distributed under the terms of the Creative Commons Attribution License (CC BY). The use, distribution or reproduction in other forums is permitted, provided the original author(s) and the copyright owner(s) are credited and that the original publication in this journal is cited, in accordance with accepted academic practice. No use, distribution or reproduction is permitted which does not comply with these terms.
*Correspondence: Li Li, bGlsaTcwQGNub29jLmNvbS5jbg==
Disclaimer: All claims expressed in this article are solely those of the authors and do not necessarily represent those of their affiliated organizations, or those of the publisher, the editors and the reviewers. Any product that may be evaluated in this article or claim that may be made by its manufacturer is not guaranteed or endorsed by the publisher.
Research integrity at Frontiers
Learn more about the work of our research integrity team to safeguard the quality of each article we publish.