 Eliana Muccignato
 Maria Francesca Ferrario
94% of researchers rate our articles as excellent or good
Learn more about the work of our research integrity team to safeguard the quality of each article we publish.
Find out more
ORIGINAL RESEARCH article
Front. Earth Sci. , 08 April 2025
Sec. Geohazards and Georisks
Volume 13 - 2025 | https://doi.org/10.3389/feart.2025.1468787
Earthquake-induced landslides are one of the most impacting effects triggered by seismic events and represent a relevant risk factor. Inventories of earthquake-induced landslides are available for many case histories and may contain thousands of elements. The spatial pattern of landslides is typically analyzed in terms of density and areal coverage (LND: Landslide Number Density; LAP: Landslide Area Percentage). In addition to landslides, other earthquake environmental effects, such as surface faulting, liquefaction, or tsunami, may be triggered. A comprehensive evaluation of earthquake environmental damage can be achieved using the Environmental Seismic Intensity (ESI-07) scale; however, landslide inventories have not yet been fully exploited in terms of ESI-07 assessment. Here, we apply a grid-based methodology to compute LND, LAP and ESI-07 values for 40 landslide inventories related to 33 earthquakes worldwide. We derive the first empirical equations relating ESI-07 to LND or LAP, demonstrating that the LAP metric is more robust. We also find that the inventory itself (i.e., how landslide polygons are delineated) introduces much higher uncertainty into the process compared to the selection of a specific area-volume conversion equation. A comparison with independent ESI-07 data shows that the proposed procedure is reliable. We claim that our approach can be applied in other contexts and could represent the basis for enhanced collaboration between the scientific communities working on landslides and seismic intensity assessment.
Earthquake ground shaking is one of the main factors responsible for landslide triggering. Earthquake-induced landslides (EQILs) are among the most destructive geological risks following seismic events, posing a significant threat to human lives, settlements and infrastructures (Keefer, 1984; Rodriguez et al., 1999). Landslides account for approximately 70% of all earthquake-related deaths not directly caused by ground shaking (Marano et al., 2010).
Reliable landslide inventories are crucial for hazard characterization and susceptibility modeling (Harp et al., 2011; Xu, 2015; Bornaetxea et al., 2023). The availability of well-constrained EQILs inventories is rapidly increasing, providing fundamental data for research and land planning at both global and regional scales (e.g., Schmitt et al., 2017; Iadanza et al., 2021; Zhao et al., 2023). Inventories may include thousands of landslides, which can be further analyzed for purposes such as susceptibility assessment, spatial characterization, and the evaluation of sediments mobilization (Fan et al., 2019). The access to a high number of EQILs inventories is granted by dedicated platforms, among which the one managed by the United States Geological Survey (USGS; Schmitt et al., 2017; Tanyas et al., 2017) plays a pivotal role.
Landslides represent one of the several types of Earthquake Environmental Effects (EEEs); indeed, besides landslides, coseismic effects include surface faulting, liquefaction, ground cracks, tsunamis and hydrogeological anomalies. Therefore, a comprehensive evaluation of earthquake damage should consider these different types of effects, which may be not easily comparable. To address this complexity, the Environmental Seismic Intensity (ESI-07) scale was developed. The ESI-07 scale is based solely on EEEs (Michetti et al., 2007; Serva et al., 2016; Ferrario et al., 2022), assigning XII intensity values to observed effect according to their dimensions (e.g., the extent of surface faulting, volume of mobilized sediments, length of ground crack and diameter of liquefaction sand boils). Usually, ESI values higher than X are assigned based on primary effects (surface faulting and tectonic uplift\subsidence) or to the total dimension of the area affected by secondary effects. EQILs inventories are often analyzed in terms of density or areal coverage (LND–Landslide Number Density and LAP–Landslide Area Percentage, respectively), to depict the spatial distribution over affected territories. In our opinion, EQILs inventories have not yet been fully exploited in terms of intensity assessment. A methodology aimed at relating the LND and LAP metrics to ESI-07 intensity was proposed by Ferrario (2022), where the affected area is divided into 1-km2 cells and LND, LAP and ESI-07 values are assigned to each grid element. Here we leverage the USGS catalogue and we test the method on 40 EQILs inventories. The obtained results allowed us to i) provide the first empirical equations relating ESI-07 intensity to either LND or LAP; ii) assess the influence of earthquake magnitude and faulting style; and iii) evaluate the epistemic uncertainty associated with input data (i.e., landslide inventory) and volume calculations. The results demonstrate the robustness of the proposed method, validating its reliability across various climatic conditions and tectonic settings. To further confirm these findings, we compared our results with independent ESI-07 data, i.e., published epicentral intensities and isoseismals.
The concept of numerically relating ESI-07 intensity and LND or LAP is an uncharted territory in literature. Our work represents a proof of concept for the reliability of the ESI-07 as a tool for EQILs inventory analysis. We argue that this work provides the basis for enhancing the collaboration between the scientific communities studying landslides and seismic intensity assessment.
As input data, we primarily used the global EQILs catalogue managed by the US Geological Survey (USGS), which serves as a centralized repository that adopts a standardized format (Schmitt et al., 2017; Tanyas et al., 2017). We considered polygonal inventories and excluded datasets with fewer than 50 mapped landslides, as we observed that these often show limited spatial coverage and variability, thus compromising the robustness of method. By applying this threshold, we obtained a total of 36 polygonal inventories from the USGS catalogue. Additionally, we incorporated 4 inventories mapped by ourselves (Ferrario, 2022; Ferrario et al., 2024), bringing the total to 40 inventories, which refers to 33 earthquakes. For 6 of these earthquakes, multiple inventories were available; we utilized these case histories to evaluate the different sources of uncertainties in our workflow.
Table 1 presents the main characteristics of the inventories, listed chronologically from oldest to most recent. We considered the polygons regardless of the type of movement; this information could be available for some case studies, but the ESI-07 categorization is based on landslide volume only. Figure 1 illustrates the geographical distribution. Most of the inventories are from tropical regions, either in Asia or Latin America, although the dataset also contains a few inventories outside the tropics. This distribution is significant, as landslides in tropical regions remove dense vegetation, making remote detection more efficient. In contrast, in continental, arid, or anthropized areas, sparser vegetation and smaller landslides make satellite-based mapping more challenging. The number of earthquakes and associated landslides, categorized according to magnitude class or earthquake rupture kinematics, is presented in Figure 1. Moment magnitude range between Mw 5.3 and 9.1, with the majority of the events falling within the Mw 6.0 – 8.0 range. Regarding earthquake rupture kinematics, 50% of the selected inventories correspond to thrust earthquakes, while 42% are associated with strike-slip earthquakes.
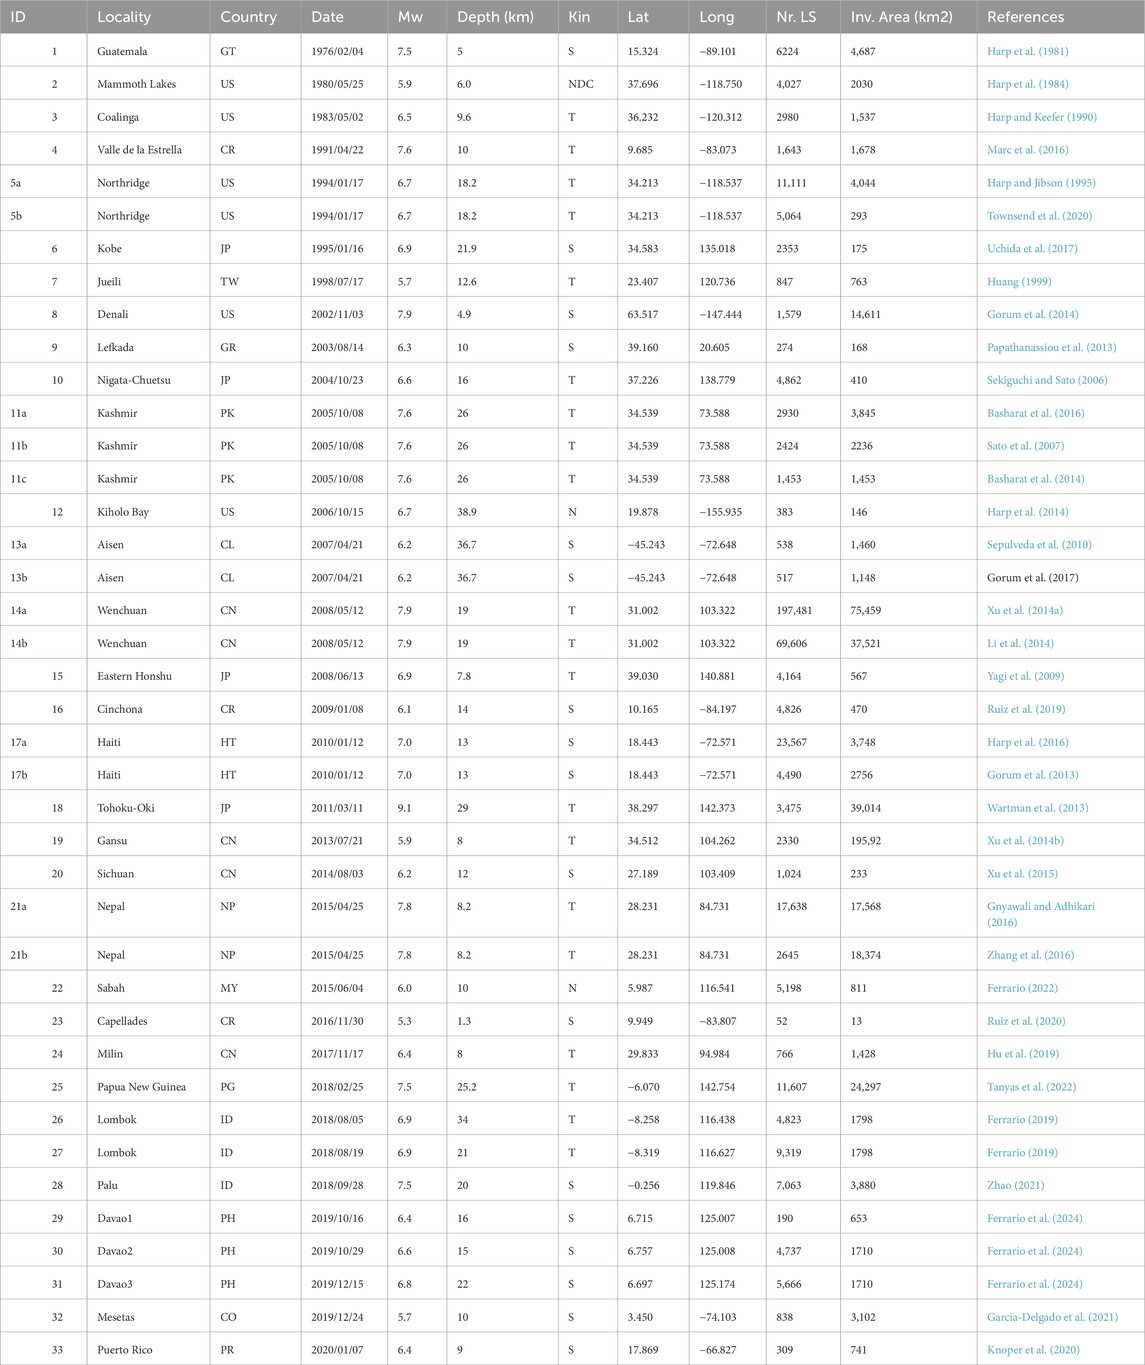
Table 1. Summary information on the inventories used in the current research, ordered according to the time of occurrence. Location, country (ISO2 code list), moment magnitude, depth and kinematics are provided together with the number of landslides and dimension of the investigated area. Data are from the USGS EQIL catalogue (or from the related papers for the Davao and Sabah inventories); investigated area is provided by the authors or extracted as minimum bounding geometry, see text for details. ID marked as “a, b” refers to events for which more than one inventory is available.
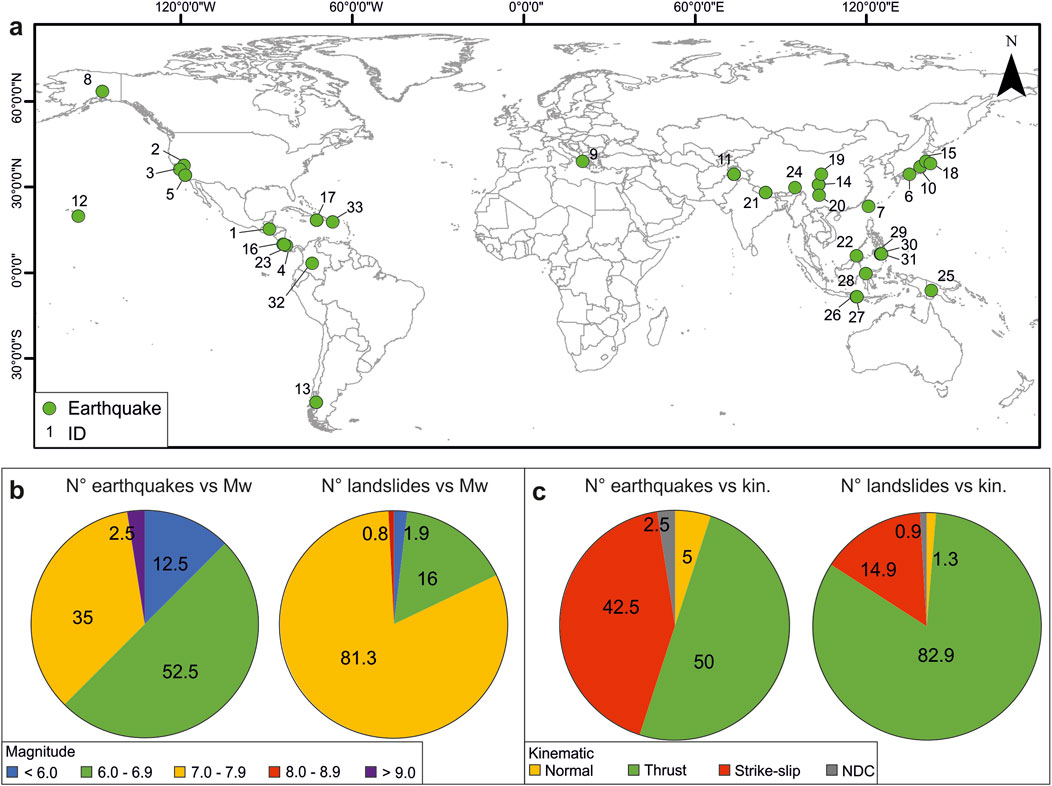
Figure 1. (a) map showing the locations of the investigated case studies; (b) distribution of the number of earthquakes and number of landslides according to moment magnitude; numbers represent the percentage; (c) distribution of the number of earthquakes and number of landslides according to earthquake kinematic; NDC: non-double couple.
Summing up the number of landslides for each inventory, a total of 430,996 is reached. Of these, 197,481 belongs to the Wenchuan inventory compiled by Xu et al. (2014a), and 69,606 landslides are from the inventory of Li et al. (2014), together accounting for 62% of the total. The selected inventories vary significantly in size, spanning several orders of magnitude in terms of landslide number. The smallest inventory includes 52 landslides from the Cappellades, Costa Rica earthquake (Ruiz et al., 2020), while the largest comprises a nearly 200,000 landslides from the Wenchuan, China earthquake (Xu et al., 2014a).
Figure 2 illustrates the methodological workflow adopted in this study. It comprises five sequential steps (A-E), starting with data collection (step A), described in the previous section. Steps B-E are described in the following subsections: each step produces an output that can serve as input for further analyses.
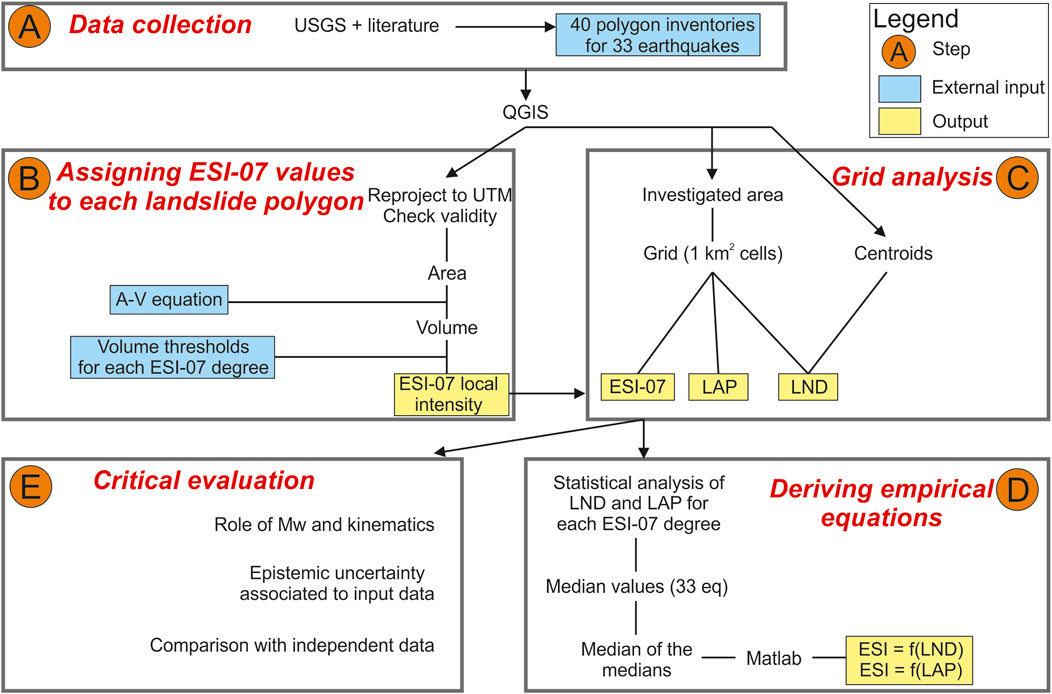
Figure 2. Methodological workflow adopted in this study. The flow chart consists of five subsequent steps (A–E); input data (blue windows) and outputs (yellow windows) are highlighted.
The landslide inventories in shapefile format were analyzed individually using QGIS software version 3.26.3. First, we reprojected the data into Universal Transverse Mercator (UTM) coordinates, adopting the correct UTM zone for each earthquake. We checked for invalid geometries using the “Check Validity” tool and we manually corrected any invalid polygons. Invalid geometries account for a negligible amount of the input data (0.8% of the polygons) and were consistently related to self-intersection errors. Then, we computed the area of each polygon (in m2) using the QGIS Field Calculator.
At this stage, two key external inputs are required to assign an ESI-07 value: i) an area-volume relationship and ii) volume thresholds for each ESI-07 degree. The local intensity associated with each landslide is determined based on its volume (Michetti et al., 2007). Several area-volume (A-V) relationships are available in the literature (e.g., Guzzetti et al., 2009; Larsen et al., 2010; Xu et al., 2016; Jaboyedoff et al., 2020; Yunus et al., 2023), which generally adopt the functional form of Equation 1:
Where Vi is volume in m3, Ai is the area of individual landslides in m2, and α and γ are fitting coefficients.
These equations are derived from datasets linked to different triggering processes and encompass a wide range of environmental and climatic conditions (Table 2). For this study, we adopted the coefficients proposed by Larsen et al. (2010) as a baseline (i.e., α = 0.146 and γ = 1.332), but we also explored the epistemic uncertainty arising from different coefficient choices (see Step 5 in the following).
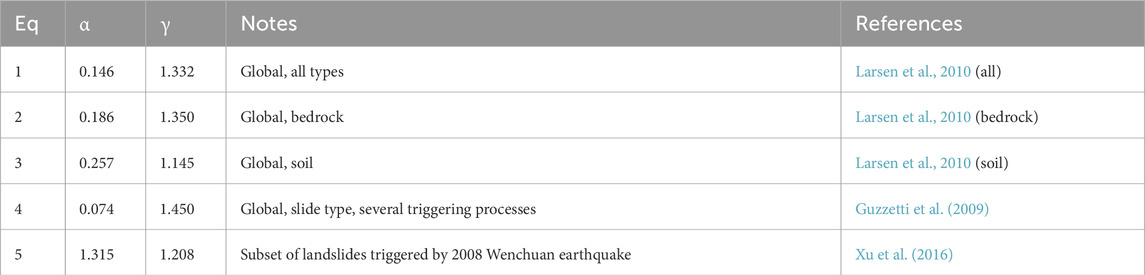
Table 2. Area–volume conversion equations tested in this study. The relationship by Larsen et al. (2010), all types is taken as a reference, while the other equations are investigated to evaluate the epistemic uncertainty.
The ESI-07 guidelines (Michetti et al., 2007) define the volumes corresponding to intensity degrees from VI to XII, spanning from less than 103 m3 to more than 106 m3. To manage the values in QGIS, we set unequivocal numerical thresholds (last column of Table 3). The lowest intensity class considered in our study is ESI-07 VI, i.e., volumes smaller than 103 m3, meaning that the method is best suitable for the analysis of medium to large landslides. Our thresholds cover one order of magnitude for intensities VII to IX, while it must be noted that for intensity degrees X to XII the volume threshold is fixed (>106 m3), reflecting the critical saturation point of landslides in the ESI-07 framework. As a result, it is not possible to assign intensities higher than X based solely on individual landslides.
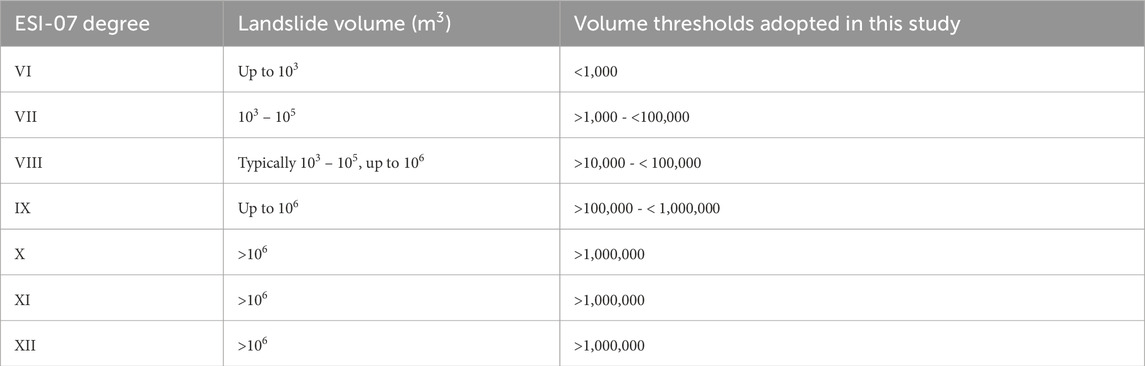
Table 3. Volume thresholds for ESI-07 intensity degrees VI to XII, as defined in Michetti et al. (2007), centre column) and adopted in this study (right column).
The mutual relationships between ESI-07, LND and LAP values are investigated using a grid-based approach, similar to the method proposed by Ferrario (2022) and adopted by Sridharan et al. (2023). We built the grid as a shapefile composed of 1 km2 square cells using the “Create Grid” tool in QGIS. The grid shapefile is generated with the same UTM coordinates as the landslide inventory. The grid extent is determined from the area originally investigated by the authors who realized the inventory, whenever this information is available. In contrast, if we lacked data on the mapped area, the minimum bounding geometry encompassing the mapped landslides was defined and used as the grid extent. This approach aligns with a similar methodology recently adopted by Marc et al. (2018) and Emberson et al. (2022). We then proceeded to calculate LND, LAP and ESI-07 values for each 1 km2 of the grid cell. We extracted the centroids of the polygons and counted the number in each grid cell, obtaining LND. For LAP evaluation, we calculated the proportion of each grid cell covered by landslide polygons, expressed as a percentage.
We calculated intensity values by selecting the largest landslide for each 1 km2 grid cell and keeping the corresponding ESI-07 value, following a procedure similar to those described by Ota et al. (2009), Silva et al. (2013) and Ferrario (2022); thus, the ESI-07 value is determined by the single largest landslide within each grid cell. The output of Step C is a shapefile of 1 km2 grid cells, each with three associated numerical fields: LND, LAP and ESI-07.
We exported the output of Step C into a spreadsheet and performed a statistical analysis of the data. For each ESI-07 degree, we calculated the mean and median LND and LAP values across all 40 landslide inventories. The next step involved deriving scaling relationships between ESI-07 intensity and either LND or LAP values. Notably, multiple inventories are available for 6 earthquakes (Northridge 1994; Kashmir 2005; Aisen 2007; Wenchuan 2008; Haiti 2010; Nepal 2015); to avoid double counting, we retained only the most complete inventory in terms of number of mapped landslides and extent of the investigated area. In this way, we moved from the 40 landslide inventories to 33 case studies. We computed the “median of the medians”, by first investigating one single earthquake and determining the median LND and LAP for each ESI-07 intensity degree. Then, we calculated the median across all the earthquakes, ultimately obtaining one single LND and LAP value for each ESI-07 intensity degree. We imported the data in Matlab and derived empirical regressions using the Curve Fitter App. The functional form of the relationships was chosen based on the best-fit parameters, including R2, adjusted-R2, and root mean squared error (RMSE).
As a final step, we critically explored the obtained results focusing on three key aspects:
- Role of magnitude and kinematics. We investigate the eventual dependence of the proposed relations by creating subsets of case studies, categorized according to magnitude or type of earthquake (normal, reverse, strike-slip).
- Epistemic uncertainty associated with input data. We addressed this issue by analyzing earthquakes with multiple available inventories. This allowed us to assess how variations in original data (i.e., landslide polygons) and methodological choices (i.e., adopted A-V relation) influenced the results.
- Comparison with independent data. Here, we examined case histories that were analyzed in terms of ESI-07 intensity; we compared our results with independent estimates of ESI-07 epicentral intensities (available for 15 earthquakes) and ESI-07 isoseismals (4 selected earthquakes).
The core of our analysis is Step C of the workflow (Figure 2), which involves the calculation of LAP, LND and ESI-07 values for each 1-km2 grid cell.
Figure 3 presents the obtained grid maps for the 2009 Cinchona (Costa Rica, ID 16 in Table 1) earthquake. In this case, the investigated area encompasses 502 cells, and the maps display the spatial distribution of ESI-07, LAP and LND values. The highest values are concentrated in the center of the area and the distribution is fairly similar, with lower values observed toward the periphery of the investigated area. The plots in Figures 3D, E depict the relative frequency of LAP and LND values, categorized according to ESI-07 classes. For lower intensities (ESI-07 VI and VII) LAP and LND exhibit low to medium values; ESI-07 VIII covers a broader range of LAP and LND values. Intensities IX and ≥ X show a different pattern: LAP is constrained to high values only (LAP >4%), whereas LND encompasses nearly all the classes (i.e., about 20% of the cells with LND = 2 are categorized as ESI-07 ≥ X). A comparable spatial distribution of LAP, LND and ESI-07 intensities was observed in all the inventories analyzed, confirming the general trend observed in the inventory of Cinchona earthquake. In the Supplementary Material, we provide the plots for other case histories.
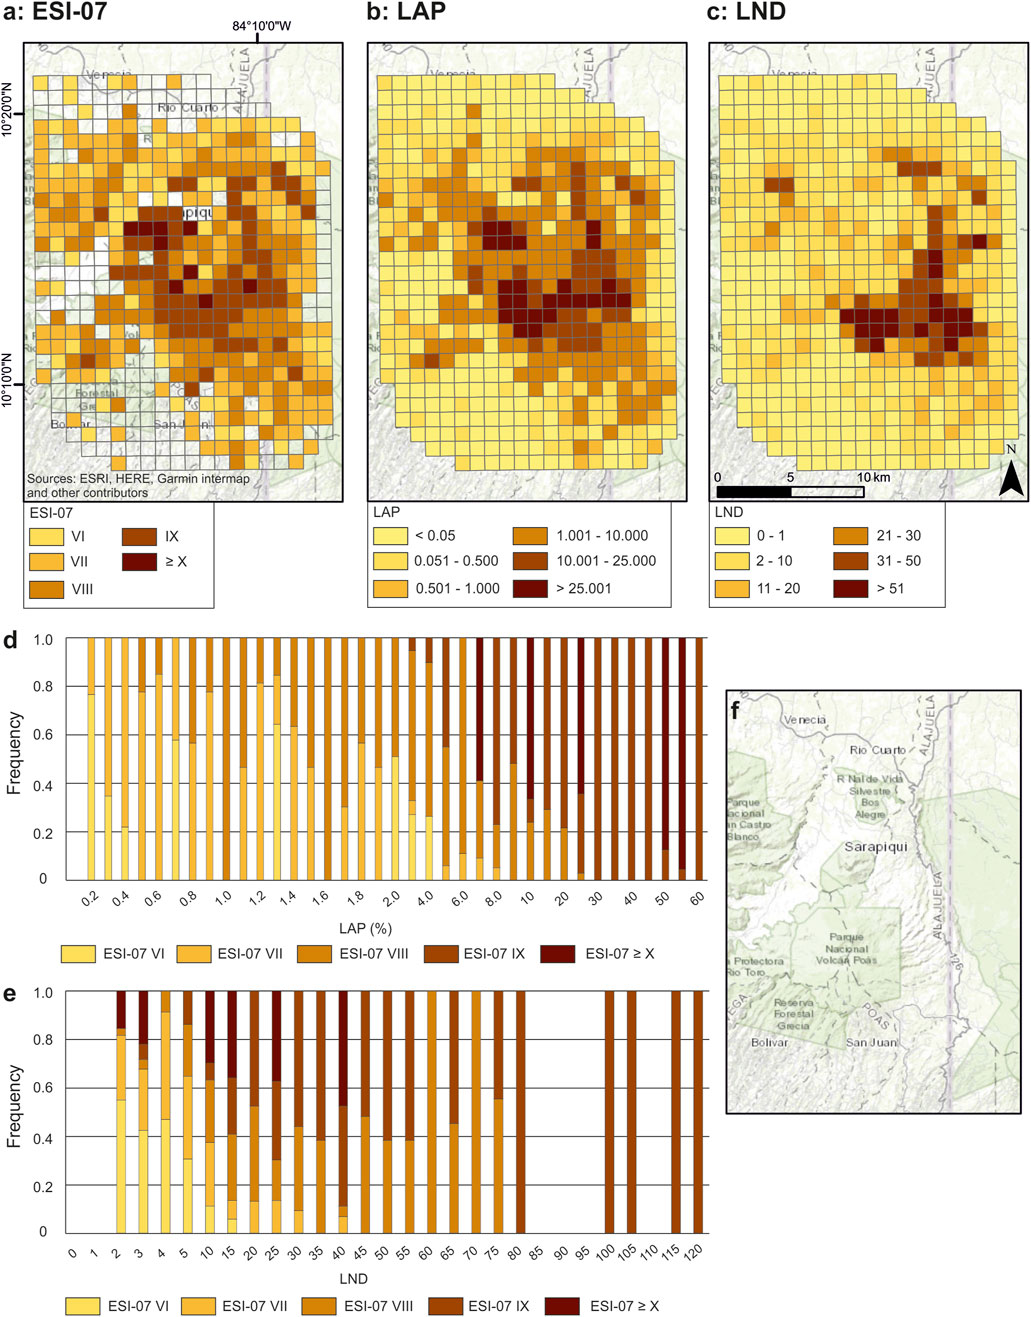
Figure 3. Example of the results obtained for the Cinchona (Costa Rica, ID 16) earthquake. Grid maps of ESI-07 (a), LAP (b) and LND (c) values are shown. Column plots represent the relative frequency of LAP (d) and LND (e) values, categorized according to ESI-07 intensity. Panel (f) presents the clean basemap, to visually inspect the local topography.
To evaluate the consistency and repeatability of our procedure, we analyze each inventory individually. Our working hypothesis was that ESI-07 values should be positively correlated with either LAP or LND values. We consider this hypothesis to be reasonable, however it has never been tested systematically. We computed the median LAP or LND value for each ESI-07 degree. Table 4 presents the data for the 40 inventories, while the plots of Figure 4 include 33 case histories. When multiple inventories were available for a single earthquake, we retained only the most complete dataset (i.e., with the highest landslide count and largest investigated area), to avoid double counting.
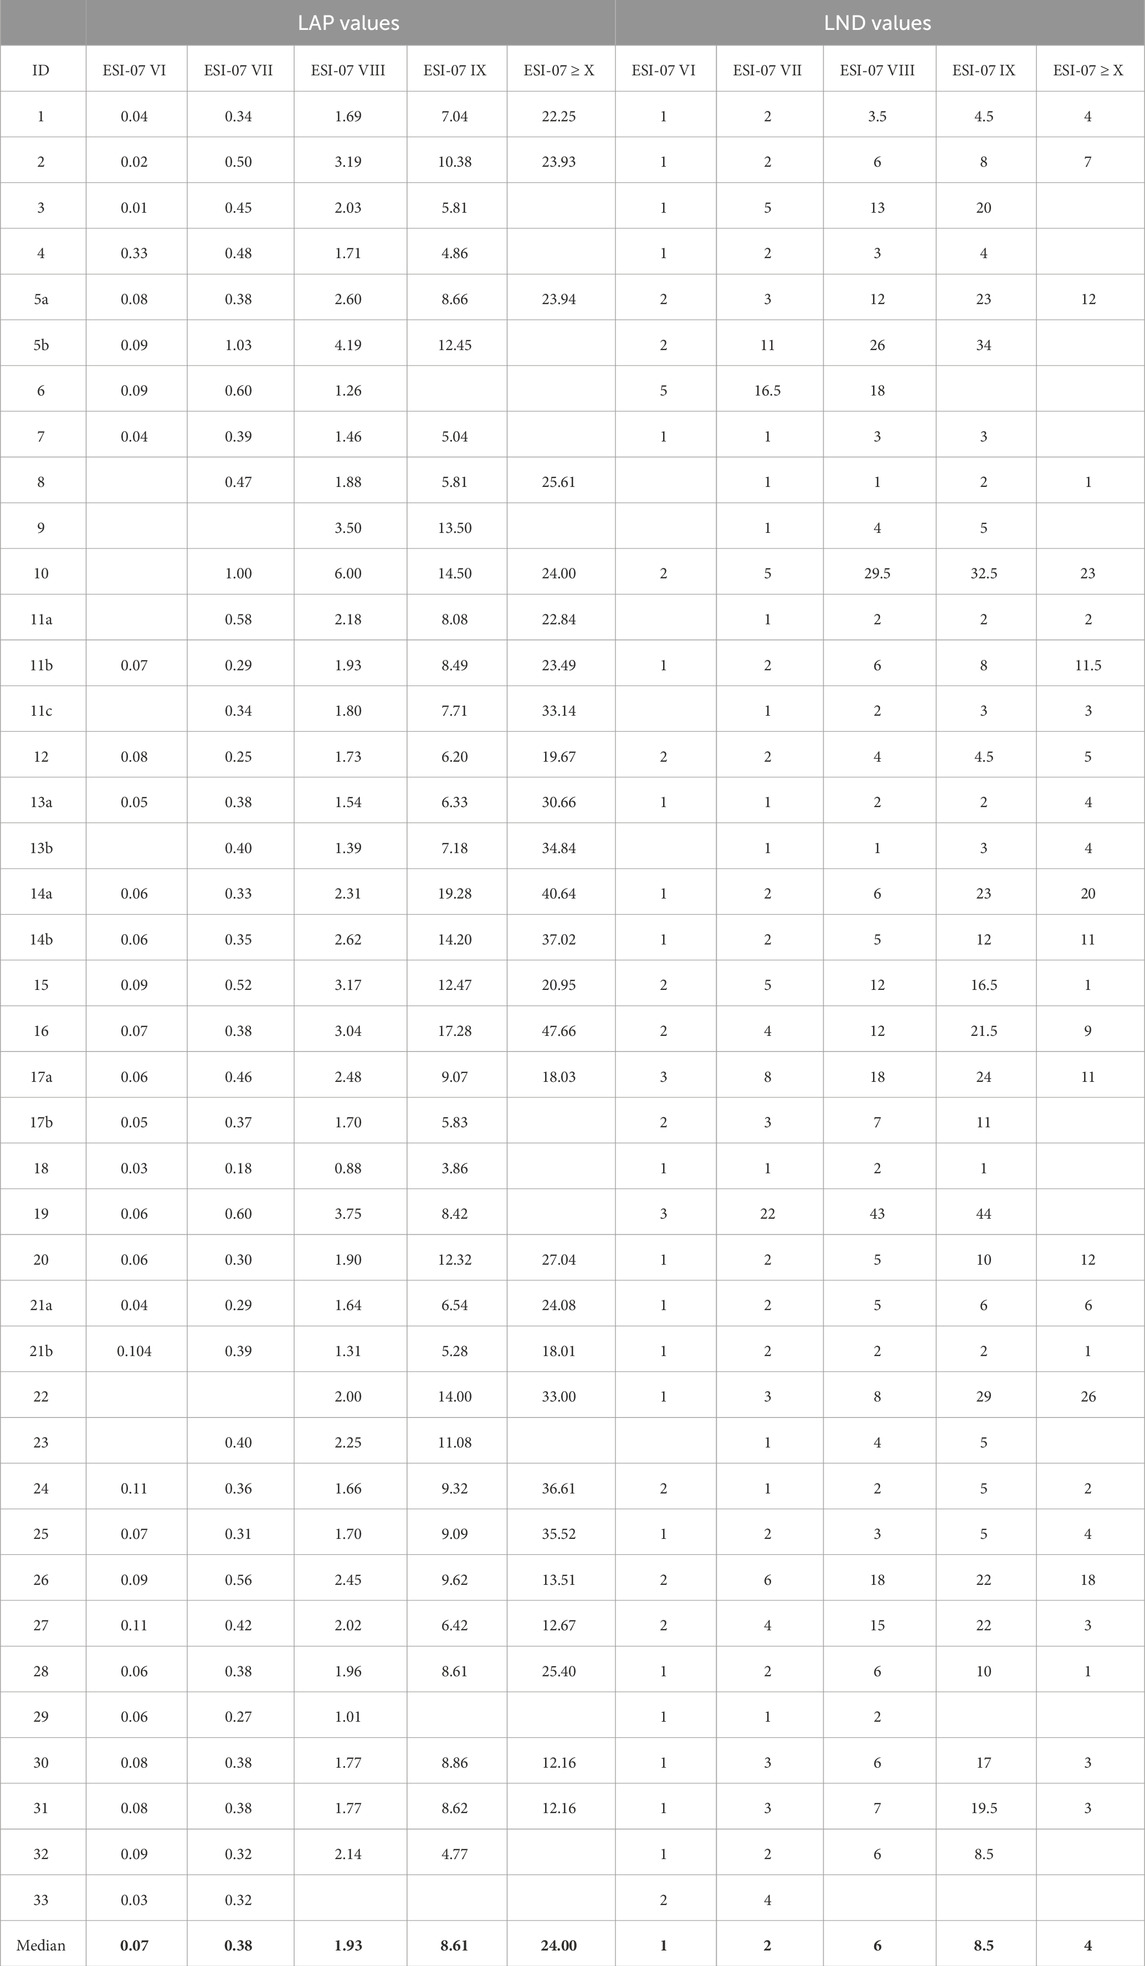
Table 4. Summary of the LAP and LND values for each ESI-07 intensity degree.
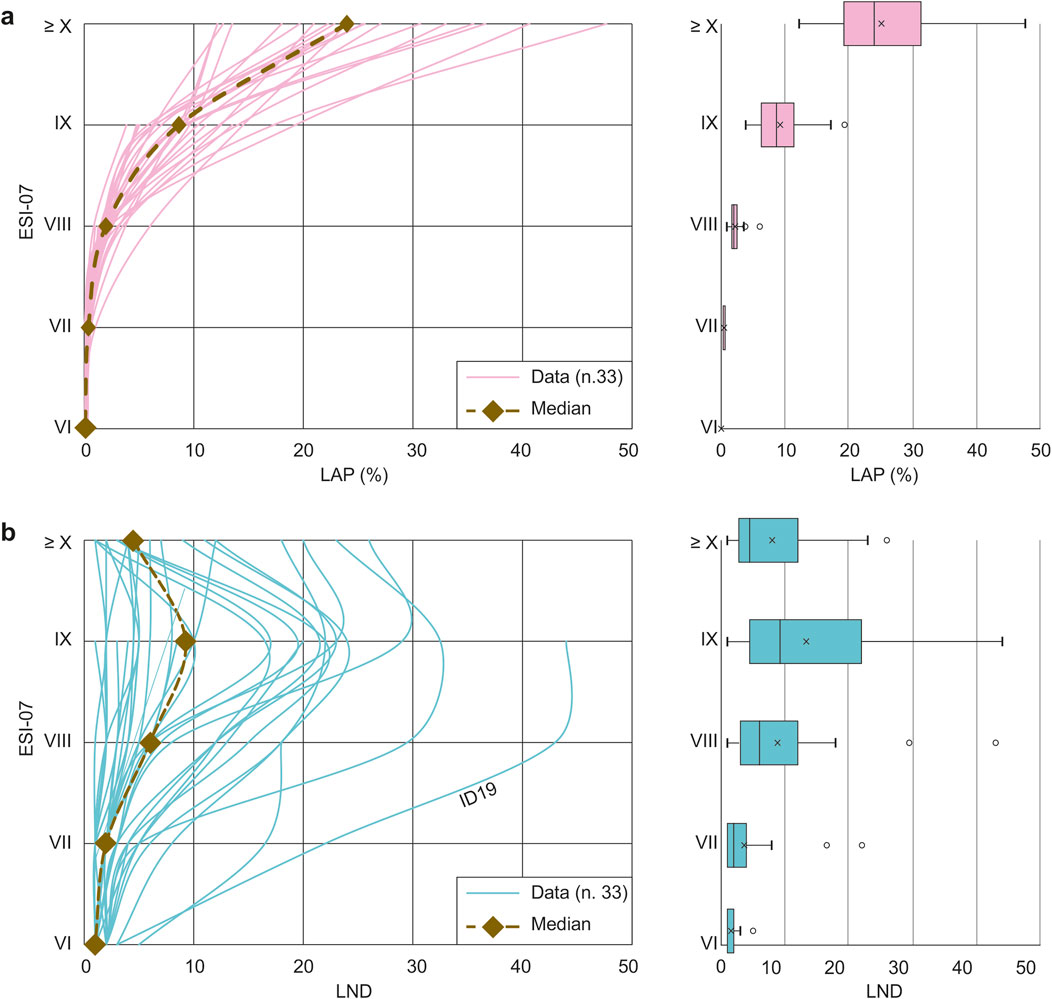
Figure 4. Statistics of LAP (a) and LND (b) values with respect to ESI-07 intensity. All the individual case studies are represented as thin lines, while the dotted line represents the median value for each ESI-07 degree. To the right, boxplots are presented, reporting average (crosses), median (line), 1 standard deviation (boxes), 2 standard deviations (whiskers) and outliers (small circles).
All the analyzed inventories provide consistent trends: as LAP or LND increase, so does the ESI-07 intensity. LAP values (Figure 4A) show a steady increase over the entire range of intensities, moving from 0.06% at ESI-07 VI to LAP 24% at ESI-07 ≥ X. Additionally, a low dispersion is observed for ESI-07 VI to VIII, while a higher dispersion is observed for ESI-07 IX and ≥ X.
Regarding LND (Figure 4B), a positive correlation is observed for ESI-07 VI to IX, with the highest density at ESI-07 IX (median LND 8 landslides/km2), after which it decreases to 4 for ESI-07 ≥ X. The dispersion is greatest at intensity IX, with remarkable differences among individual inventories, especially for the Gansu earthquake (ID 19 in Table 1). The lower LND values for intensity ≥ X likely reflect a “physical” limitation: the largest landslides (volume > 106 m3) correspond to an area of approximately 130,000 m2 according to our baseline A-V relation. This constraint limits the number of such large landslides that can fit within each cell of the 1 km2 grid, thus fundamentally limiting the resulting LND values.
By analyzing the case histories, we obtained consistent results over a wide range of magnitudes and territorial settings. We then proceed to Step D of the workflow, deriving empirical regressions linking ESI-07 values to either LAP or LND.
We considered the median of the 33 earthquakes and tested various functional forms. Following the observation that LND values increase in the ESI-07 range VI to IX, while ESI-07 ≥ X has a lower LND value, we decided to fit the data over the range of intensities VI to IX. For LAP values, data are fitted over the entire range of intensities, i.e., ESI-07 VI to ≥ X. Both power-law and logarithmic forms consistently gave the best fitting results; for LAP values, power-law model performed slightly better than the logarithmic law. We selected the power-law functional form for both LAP and LND, because we want to prioritize the LAP dataset, which we deem as better suitable to be used to obtain ESI-07 values; the equations have the general formula:
Where x stands for LAP or LND, a and b are fitting coefficients.
Figure 5 and Table 5 summarize the obtained curves and fitting coefficients. We consider LAP as a better descriptor: indeed, LND depends more strongly on the quality of input data and is a more local metric, being more influenced by the topography, geo-mechanical characteristics and mapping style of the user who generated the inventory. One common issue in landslide inventories is the amalgamation of multiple landslides into a single polygon (Marc and Hovius, 2015); which can significantly affect the computation of LND, but does not affect LAP values. Nevertheless, in the case of point inventories, LND is the only suitable option. Therefore, we consider it appropriate to provide empirical equations for LND as well.
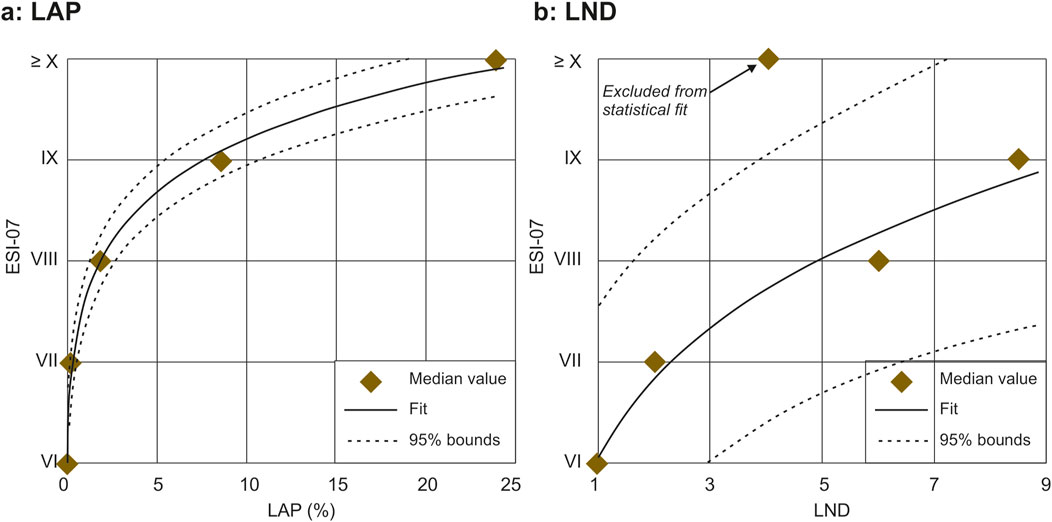
Figure 5. Median LAP (a) or LND (b) values (brown diamonds) for each ESI-07 intensity class. The black lines are the empirical regressions derived in this study.
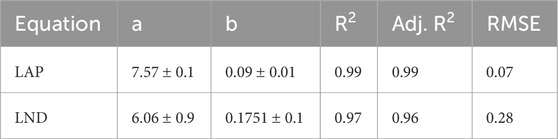
Table 5. fitting coefficients and goodness-of-fit parameters for the equations derived in this study and referring to Equation 2. RMSE: root mean squared error.
We now explore different sources of inherent variability and epistemic uncertainty, and we compare our results to independent ESI-07 estimates, to corroborate our outcomes.
The number and dimension of triggered landslides are influenced by several factors, related to terrain (e.g., elevation, slope), as well as climatic, geological and seismological parameters. A plethora of studies have analyzed susceptibility factors, even focusing on LAP or LND metrics (e.g., Chang et al., 2021; Dai et al., 2023; Shao et al., 2023). Here we limit our analysis to seismological and tectonic factors., specifically moment magnitude and earthquake kinematics, to evaluate the possibility of deriving empirical regressions dependent on these two factors. We grouped the landslide inventories according to either magnitude or kinematics, looking for eventual differences in the obtained results. One reasonable hypothesis that we may test is whether a higher magnitude, which corresponds to a greater energy release, leads to higher LAP and LND values. Similarly, different earthquake kinematics may vary in their effectiveness in triggering landslides. Fault geometry, the type of fault movement and the presence or absence of surface faulting indeed all influence the distribution and dimension of the area affected by coseismic landslides (Gorum et al., 2014; Xu, 2014).
The boxplots of Figure 6 present the distribution of LAP and LND values according to moment magnitude, divided into 3 classes. As already observed, LAP values exhibit a much narrower distribution than LND. No clear dependence on magnitude is found for LAP values, as the 3 magnitude classes considered here have very similar median LAP values and overall distribution. LND showed lower values for stronger earthquakes (Mw class 7.0–7.9) with respect to weaker earthquakes. The result is not unexpected when considering the general scenario: stronger earthquakes tend to mobilize substantial masses of material, resulting in fewer but more extensive landslides, a key factor that reduces the overall LND value.
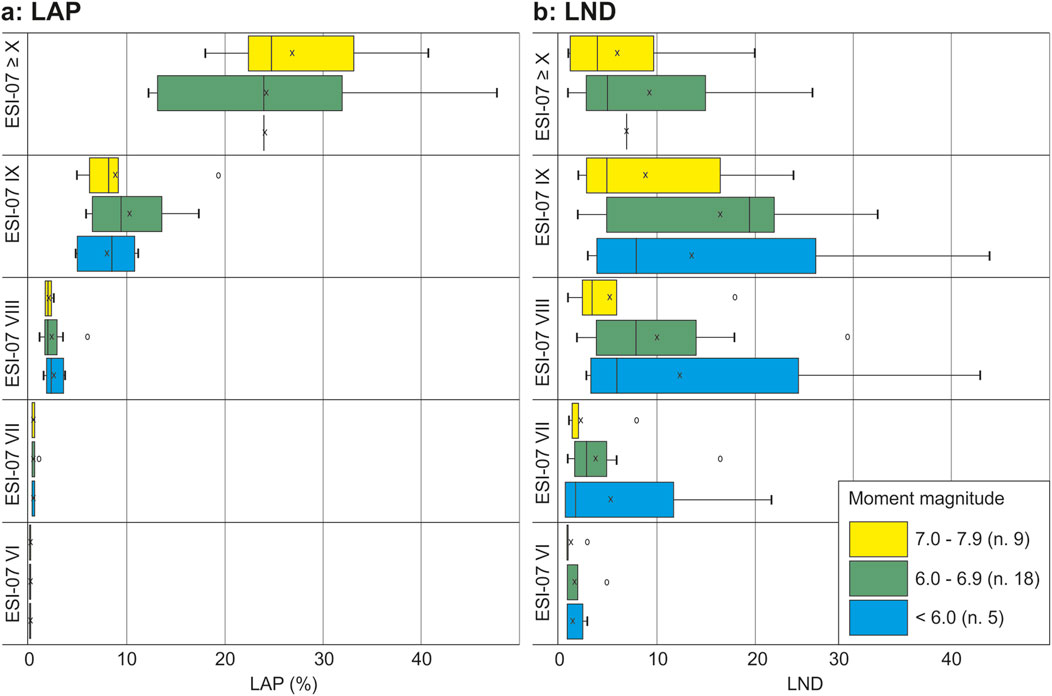
Figure 6. Distribution of LAP (a) and LND (b) values within each ESI-07 intensity degree; data have been categorized according to moment magnitude. The boxplot reports average (crosses), median (line), 1 standard deviation (boxes), 2 standard deviations (whiskers) and outliers (small circles).
Figure 7 presents the distribution according to earthquake kinematics. A robust evaluation can be conducted for thrust and strike-slip earthquakes (15 case histories each), while normal earthquakes are not adequately represented (2 cases only). LAP again provide more informative results than LND. Thrust events tend to have slightly lower LAP values, especially for intensity classes IX and ≥ X.
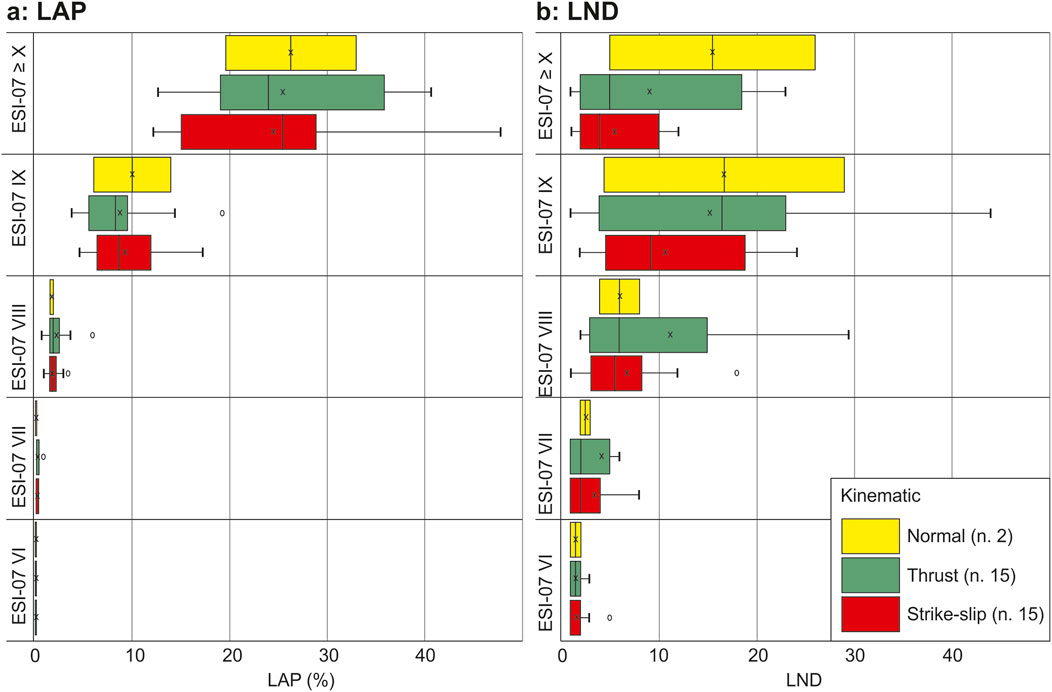
Figure 7. Distribution of LAP (a) and LND (b) values within each ESI-07 intensity degree; data have been categorized according to earthquake kinematics; the boxplot reports average (crosses), median (line), 1 standard deviation (boxes), 2 standard deviations (whiskers) and outliers (small circles).
Overall, it is evident that magnitude and kinematics exert a limited influence on LAP and LND values. We notice a clear step in LAP values, especially from ESI-07 intensity VII to intensity ≥ X, indicating that intensity classes are characterized by increasing LAP values. This confirms that LAP provides the most robust relationship.
The ESI-07 intensity value assigned to each landslide fundamentally depends on two key factors: the area of the polygon and the choice of an area-volume scaling relation. Both elements represent sources of epistemic uncertainty, as they are dependent on the mapping procedure and the methodological choices made by the users. We investigate these aspects taking advantage of the six earthquakes where multiple landslide inventories are available.
The inventories may have been realized by different research groups (e.g., Harp and Jibson (1995); Townsend et al. (2020) for the 1994 Northridge earthquake) or represent successive refinements of an initial inventory (e.g., Basharat et al., 2014; 2016 for the 2005 Kashmir earthquake). In some cases, the number of mapped landslides and the dimensions of the investigated area are similar (e.g., Sepulveda et al. (2010) and Gorum et al. (2017) for the 2007 Aisen earthquake), while in other cases they are sensibly different (e.g., Gorum et al. (2013); Harp et al. (2016) for the 2010 Haiti earthquake). The inventories are produced with different methods (manual vs. semi-automatic mapping) and using pre- and post-event images with variable resolution.
We applied five different A-V relations (Table 2), selected based on their derivation from global databases (Larsen et al., 2010; Guzzetti et al., 2009), their focus on earthquake-triggered landslides or their relevance to study areas examined in this work (Xu et al., 2016). For each A-V relation, we calculate the frequency of landslide polygons belonging to each ESI-07 intensity degree. Data are presented in Figure 8: red lines refer to the most complete inventory (labeled with “a” in Table 1), while green and blue lines refer to inventories labeled as “b” or “c”, respectively.
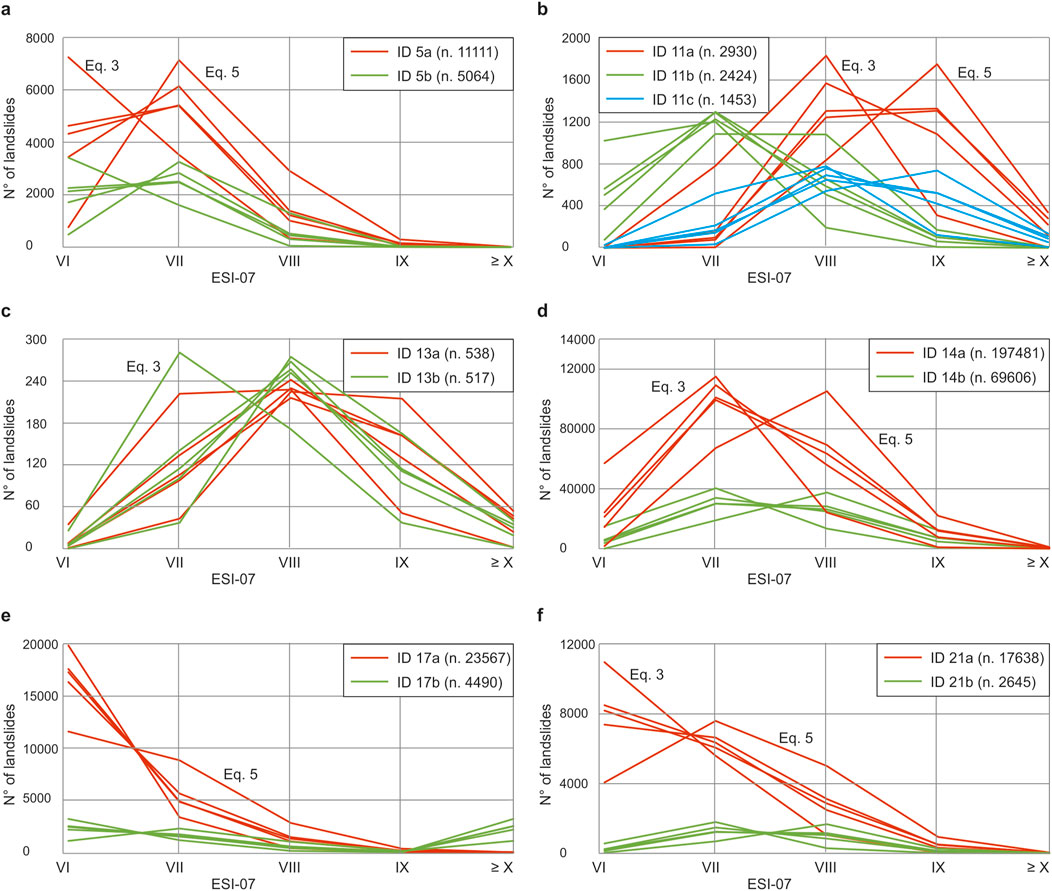
Figure 8. Number of landslides fitting within each ESI-07 intensity class by adopting different A-V equations (3- α = 0.257; γ = 1.145 - Larsen et al. (2010) soil type; 5 - α = 1.315; γ = 1.208 - Xu et al. (2016)). (a) Northridge ID 5. (b) Kashmir ID 11. (c) AisenID 13. (d) Wenchuan ID 14. (e) Haiti ID 17. (f) Nepal ID 21.
Several considerations arise from Figure 8: the most striking observation is that input data (i.e., landslide inventories) are the first-order element in driving the ESI-07 assessment, while the selected A-V relation plays a secondary role. Indeed, in almost all the plots (with the exception of the Aisen and partly of the Kashmir events) the lines are clustered by color, representing the different inventories. The critical role exerted by different inventories on derived products was investigated by Bornaetxea et al. (2023) in a susceptibility study in Spain, where they demonstrated that altering the input landslide inventory leads to significantly different results.
The A-V relation by Xu et al. (2016) and Larsen et al. (2010), soil deviate from the other equations, especially for ESI-07 intensity VI. For the Northridge, Haiti and Nepal events a sensible difference in the number of small landslides (ESI-07 intensity VI) is observed between the inventories, pointing to a different degree of completeness.
Our results support the arguments made by Ferrario (2022) and Sridharan et al. (2023), who claim that the choice of a given A-V relation has limited implications on the final output. We underscore the importance of thoroughly delineating coseismic landslides and selecting the most appropriate A-V scaling relation, which is consistent with the local terrain and geologic conditions. We also recall that ESI-07 classes are broad in terms of volume (see Table 3), which helps smooth out overall variability. If the inventories are instead used for purposes other than intensity assessment, for instance to calculate the amount of mobilized sediments or denudation rates, a well-constrained A-V relation is a crucial input.
Landslides are not the only type of earthquake environmental effect and thus an evaluation based solely on this effect may be misleading. Recognizing this, our study aims to find a link to bridge the gap between two distinct yet complementary technical-scientific communities: a community focused on the construction of landslide inventories and the analysis of predisposing/triggering factors for slope movements, and another community dedicated to the individuation of EEEs and their intensity assessment using the ESI-07 scale. Both approaches ultimately aim to improve the general understanding of seismic hazard and to generate crucial information and instruments for mitigation purposes. By integrating these methodologies, a more comprehensive characterization of earthquake impacts could be achieved, accounting for the diverse environmental, geological and geomorphological settings where different EEEs occur. To evaluate the reliability and applicability of the ESI-07 methodology developed in this study, we compared our result with independent data, searching for those events that were already analyzed in terms of ESI-07 scale. A recent review of the earthquakes analyzed with the ESI-07 scale (Ferrario et al., 2022) included a dataset of more than 150 events with an available ESI-07 epicentral intensity (I0) estimate. A total of 15 earthquakes from this review overlap with our dataset, as shown in Table 6. The data were extracted from Ferrario et al. (2022), supplemented with the most recent studies of Sridharan et al. (2023); ID 25 in Table 1), Naik et al. (2023); ID 28 in Table 1, in this case isoseismals are from an unpublished thesis, see statements and declarations section) and Ferrario et al., 2024 (ID 29–31).
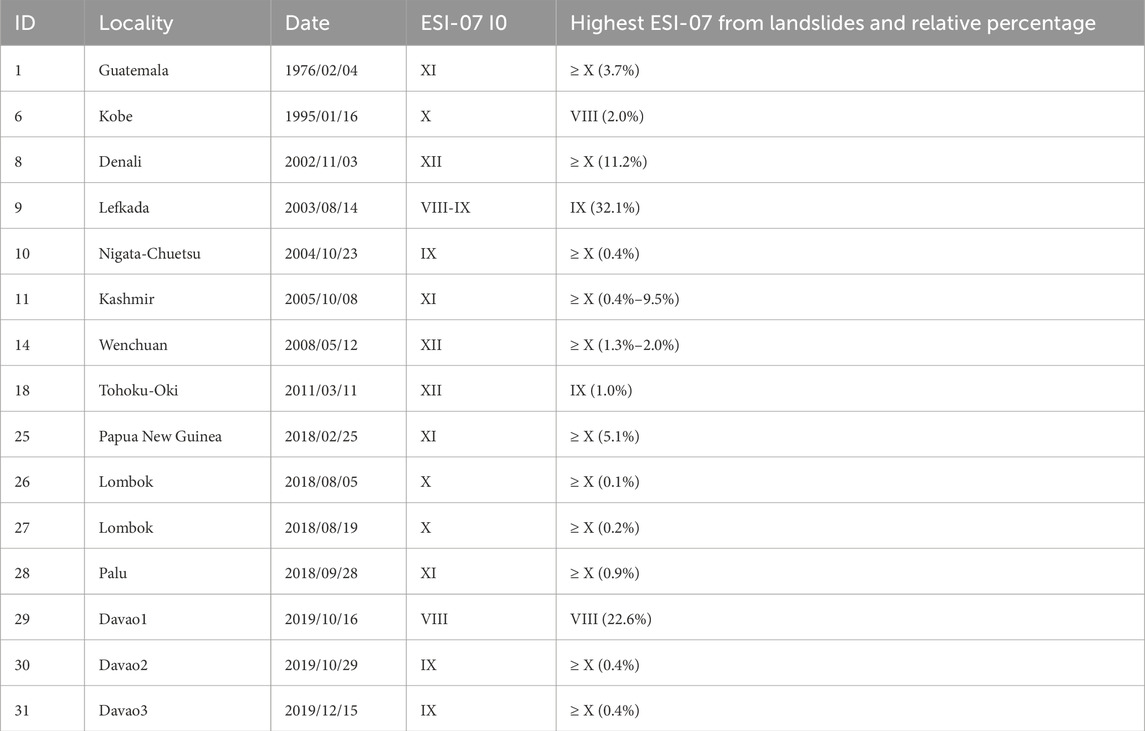
Table 6. list of events independently analyzed using the ESI-07 intensity scale, with available estimate of ESI-07 epicentral intensity (I0).
In the last column of Table 6 we report the highest ESI-07 value assigned in our study (i.e., deriving from the analysis of slope movements only) together with the percentage of cells with such value. We notice that the ESI-07 I0 is generally higher than the estimate derived from slope movements; this fact is not surprising, since i) intensities XI and XII cannot be assigned from slope movements and ii) widespread environmental effects other than slope movements may have been triggered. Additionally, we analyzed slope movements on emerged lands, while some of the earthquakes had their epicenter offshore (e.g., ID 18 Tohoku-Oki, which triggered a devastating tsunami). In a few cases (ID 10, 30 and 31) landslides returned to an ESI-07 value slightly greater than I0; nevertheless, the percentage of cells with such anomalous outcome is less than 0.5%. We remark that ESI-07 I0 is estimated based on the amount of permanent ground deformation (surface faulting and tectonic uplift/subsidence) or on the dimensions of the area affected by secondary effects (Michetti et al., 2007); thus, the analysis of slope movements alone provides no clue for ESI-07 I0 estimation.
We selected 4 earthquakes where reliable ESI-07 isoseismals are available and attempted to make a careful comparison of the macroseismic field proposed in the literature with the grid results obtained in our study. The selected events include Guatemala (ID 1), Denali (ID 8), Wenchuan (ID 14) and Palu (ID 28); therefore, we exclude events with only one or two ESI-07 isoseismals (e.g., Davao, ID 29–31) or an incomplete macroseismic field due to large offshore areas (e.g., Tohoku, ID 18).
We superimposed the ESI-07 isoseismals to the grids obtained in our study and we calculated the difference between the two for each grid element. It is worth mentioning that all the 4 investigated earthquakes generated extensive surface faulting, which resulted in ESI-07 isoseismals elongated in the direction of the seismogenic source (Figure 9). The histograms show the difference between ESI-07 from isoseismals and ESI-07 derived in this study from slope movements; positive values indicate that the estimate from isoseismals is higher. The histogram patterns for the four investigated earthquakes appear to be similar, with a frequency peak at 1 degree of difference, except for the Denali event, where the distribution is slightly shifted toward higher values. This analysis must be intended as a first approximation, since the territory covered by the isoseismals and the area investigated with landslides may differ: for instance, the Guatemala inventory covers only a small portion of the isoseismals (Figure 9B). Moreover, the grid analysis results in a “salt and pepper” pattern, with high variations between cells close to each other, while isoseismals by definition tend to smooth out such high-frequency variations and provide a more homogeneous description of earthquake effects. Finally, we recall that the maximum ESI-07 value obtainable from landslides is ≥ X; thus, all the cells with ESI-07 isoseismal XI and XII have a minimum “difference” value of 1 and 2, respectively. A total of 1815 cells lie within isoseismal XI, and 924 cells within isoseismal XII, constituting 21% of the analyzed grid elements; we believe that the overall distribution of the values is not heavily affected by the inability to fully compare the ESI-07 values from isoseismal lines and the analysis of slope movements.
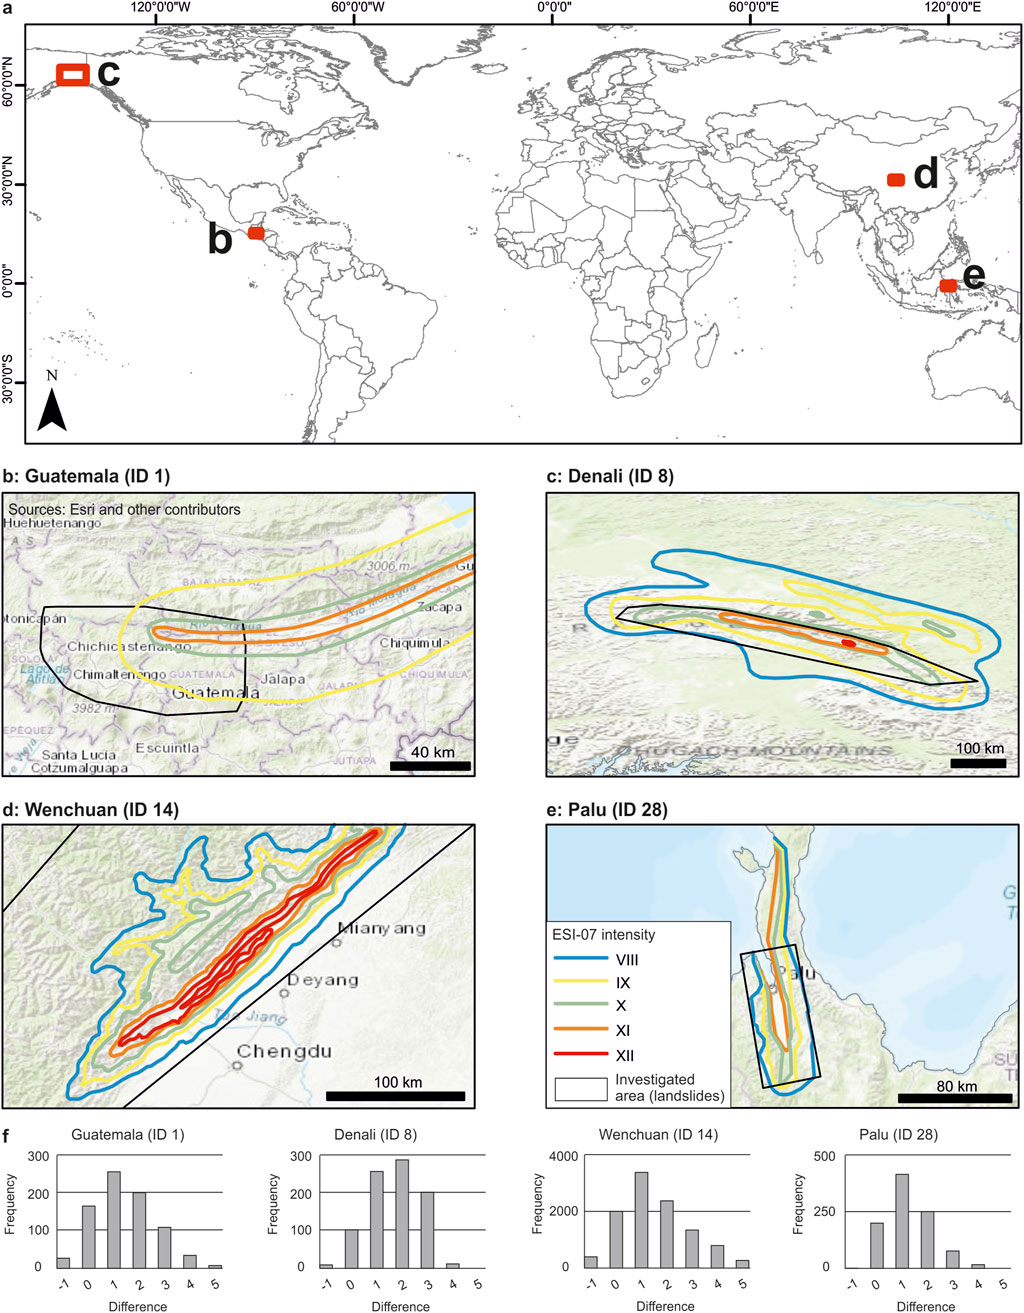
Figure 9. Distribution of the case histories where ESI-07 isoseismals have been compared to the grid analysis realized here (a). ESI-07 isoseismal maps for the Guatemala ((b); isoseismals after Caccavale et al., 2019), Denali ((c); Comerci et al., 2015), Wenchuan ((d); Lekkas, 2010) and Palu ((e); Sioli E., unpublished thesis). Frequency plots of the difference between ESI-07 from isoseismals and from the grid analysis on landslides (f).
Despite the above-mentioned limitations, here we document the suitability of this comparison and claim that additional insight could be gained from the analysis of a wider number of case histories, including earthquakes that did not generate surface faulting. Indeed, some studies have already pointed out a correlation between landslide concentration and distance from the seismic rupture (Chen et al., 2022; Zhao et al., 2023).
Our results support the notion proposed by Ota et al. (2009) and Silva et al. (2013), who first attempted to an ESI-07 evaluation via a box-counting approach. Other attempts were realized on the 2008 Wenchuan (China) earthquake and on a Mw 6.6 earthquake occurred in Luding County (China). Xu et al. (2013) provided a correlation among LND or LAP and intensity degrees on the Chinese macroseismic scale, while Yang et al. (2023) determined a so-called macro-epicenter based on the maximum value of landslide area density and defined numerical thresholds for a qualitative zoning of coseismic landslide intensity.
In this paper, we apply a methodological approach first proposed by Ferrario (2022), which aims to retrieve useful information from earthquake-induced landslide inventories from the perspective of intensity assessment using the ESI-07 scale. We tested this approach on a dataset of 33 earthquakes in various settings and we demonstrated that the procedure produced consistent results. We developed the first empirical equations to relate the ESI-07 intensity to LAP and LND; the equation based on LAP is valid for the intensity range ESI-07 VI to ≥ X, while the equation based on LND is valid up to ESI-07 intensity IX. Generally, magnitude and kinematics exert a limited influence on LAP and LND values. We show that the quality of input data (i.e., landslide inventory) has a much greater impact on the results than the selection of a given area-volume conversion. We consider LAP as a better metric than LND, so our advice is to derive ESI-07 data from LAP values whenever possible; the use of the scaling relation based on LND should be considered more cautiously. The intensity assessment of slope movements in terms of ESI-07 depends on the volume of individual movements, and not on their type; we consider our method better performing in settings characterized by slides rather than falls.
Landslides are only one type of earthquake environmental effects. We consider our research as a proof of concept for streamlining the systematic analysis of a landslide inventory toward intensity assessment using the ESI-07 scale. Landslide inventories usually provide a depiction of earthquake damage on the territory having a resolution much higher than what is generally achieved in studies focusing on the ESI-07 scale. Therefore, we believe that the workflow tested here could improve the hazard assessment conducted using the ESI-07 scale. In contrast, the ESI-07 scale provides the clear advantage of allowing comparison of different types of effects both in time and space.
We consider our approach as an avenue for further studies, and we encourage the geoscientific community to explore the feasibility of this option.
The datasets presented in this study can be found in online repositories. The names of the repository/repositories and accession number(s) can be found below: https://www.sciencebase.gov/catalog/item/583f4114e4b04fc80e3c4a1a.
EM: Conceptualization, Data curation, Formal Analysis, Funding acquisition, Investigation, Methodology, Project administration, Resources, Software, Supervision, Validation, Visualization, Writing – original draft, Writing – review and editing. MF: Conceptualization, Data curation, Formal Analysis, Funding acquisition, Investigation, Methodology, Project administration, Resources, Software, Supervision, Validation, Visualization, Writing – original draft, Writing – review and editing.
The author(s) declare that no financial support was received for the research and/or publication of this article.
We wish to thank the Editor in Chief, Yunhui Zhang, and two reviewers for their thoughtful comments, which helped in improving the quality of the manuscript. EM’s PhD is funded by the European Union–NextGenerationEU–Mission 4 “Education and Research” – Component 2 “From Research to Business” – Investment 3.1 “Fund for the realization of an integrated system of research and innovation infrastructures” – Project IR0000037 – GeoSciences IR. We wish to thank all the scientific community who had applied the ESI-07 scale to earthquakes worldwide. The ESI-07 isoseismals for the Palu earthquake were produced by Elena Sioli during her Bachelor thesis at Insubria University.
The authors declare that the research was conducted in the absence of any commercial or financial relationships that could be construed as a potential conflict of interest.
All claims expressed in this article are solely those of the authors and do not necessarily represent those of their affiliated organizations, or those of the publisher, the editors and the reviewers. Any product that may be evaluated in this article, or claim that may be made by its manufacturer, is not guaranteed or endorsed by the publisher.
The Supplementary Material for this article can be found online at: https://www.frontiersin.org/articles/10.3389/feart.2025.1468787/full#supplementary-material
Basharat, M., Ali, A., Jadoon, I. A. K., and Rohn, J. (2016). Using PCA in evaluating event-controlling attributes of landsliding in the 2005 Kashmir earthquake region, NW Himalayas, Pakistan. Nat. Hazards 81, 1999–2017. doi:10.1007/s11069-016-2172-9
Basharat, M., Rohn, J., Baig, M. S., and Khan, M. R. (2014). Spatial distribution analysis of mass movements triggered by the 2005 Kashmir earthquake in the Northeast Himalayas of Pakistan. J. Geomorphol. 206, 203–214. doi:10.1016/j.geomorph.2013.09.025
Bornaetxea, T., Remondo, J., Bonachea, J., and Valenzuela, P. (2023). Exploring available landslide inventories for susceptibility analysis in Gipuzkoa province (Spain). Nat. Hazards 118, 2513–2542. doi:10.1007/s11069-023-06103-w
Caccavale, M., Sacchi, M., Spiga, E., and Porfido, S. (2019). The 1976 Guatemala earthquake: ESI scale and probabilistic/deterministic seismic hazard analysis approaches. Geosciences 9, 403. doi:10.3390/geosciences9090403
Chang, M., Zhou, Y., Zhou, C., and Hales, T. C. (2021). Coseismic landslides induced by the 2018 M w 6.6 Iburi, Japan, Earthquake: spatial distribution, key factors weight, and susceptibility regionalization. Landslides 18, 755–772. doi:10.1007/s10346-020-01522-3
Chen, C. W., Sato, M., Yamada, R., Iida, T., Matsuda, M., and Chen, H. (2022). Modeling of earthquake-induced landslide distributions based on the active fault parameters. Eng. Geol. 303, 106640. doi:10.1016/j.enggeo.2022.106640
Comerci, V., Michetti, A. M., Serva, L., and Vittori, E. (2015). The november 2, 2002, Denali (Alaska) earthquake, mem. Descr, Carta Geol. D’It., XCVII, 125–132.
Dai, L., Fan, X., Wang, X., Fang, C., Zou, C., Tang, X., et al. (2023). Coseismic landslides triggered by the 2022 Luding Ms6.8 earthquake, China. Landslides 20 (6), 1277–1292. doi:10.1007/s10346-023-02061-3
Emberson, R., Kirschbaum, D. B., Amatya, P., Tanyas, H., and Marc, O. (2022). Insights from the topographic characteristics of a large global catalog of rainfall-induced landslide event inventories. Nat. Hazards Earth Syst. Sci. 22 (3), 1129–1149. doi:10.5194/nhess-22-1129-2022
Fan, X., Scaringi, G., Korup, O., West, A. J., van Westen, C. J., Tanyas, H., et al. (2019). Earthquake-induced chains of geologic hazards: patterns, mechanisms, and impacts. Rev. Geophys. 57 (2), 421–503. doi:10.1029/2018RG000626
Ferrario, M. F. (2019). Landslides triggered by multiple earthquakes: insights from the 2018 Lombok (Indonesia) events. Nat. Hazards 98, 575–592. doi:10.1007/s11069-019-03718-w
Ferrario, M. F. (2022). Landslides triggered by the 2015 M w 6.0 Sabah (Malaysia) earthquake: inventory and ESI-07 intensity assignment. Nat. Hazards Earth Syst. Sci. 22 (10), 3527–3542. doi:10.5194/nhess-22-3527-2022
Ferrario, M. F., Livio, F., and Michetti, A. M. (2022). Fifteen years of Environmental Seismic Intensity (ESI-07) scale: dataset compilation and insights from empirical regressions. Quat. Int. 625, 107–119. doi:10.1016/j.quaint.2022.04.011
Ferrario, M. F., Perez, J. S., Dizon, M., Livio, F., Rimando, J., and Michetti, A. M. (2024). Environmental effects following a seismic sequence: the 2019 Cotabato—Davao del Sur (Philippines) earthquakes. Nat. Hazards 120, 6125–6147. doi:10.1007/s11069-024-06467-7
García-Delgado, H., Chaparro, J., Gamboa, C., and Ruiz, G. (2021). “Landslides triggered by the december 24, 2019 mesetas (meta, Colombia) earthquake,” in Proceedings of the 13th international symposium on landslides. Editors M. A. Cabrera, and L. F. Prada-Sarmiento (Cartagena: ISSMGE).
Gnyawali, K. R., and Adhikari, B. R. (2016). Spatial relations of earthquake induced landslides triggered by 2015 Gorkha earthquake Mw 7.8. Eur. Geosci. Union General Assem. Conf. Abstr. 18, 18429. doi:10.1007/978-3-319-53485-5_10
Gorum, T., Korup, O., van Westen, C. J., van der Meijde, M., Xu, C., and van der Meer, F. D. (2014). Why so few? Landslides triggered by the 2002 Denali earthquake, Alaska. Quat. Sci. Rev. 95, 80–94. doi:10.1016/j.quascirev.2014.04.032
Gorum, T., van Westen, C. J., Korup, O., van der Meijde, M., Fan, X., and van der Meer, F. D. (2013). Complex rupture mechanism and topography control symmetry of mass-wasting pattern, 2010 Haiti earthquake. J. Geomorphol. 184, 127–138. doi:10.1016/j.geomorph.2012.11.027
Guzzetti, F., Ardizzone, F., Cardinali, M., Rossi, M., and Valigi, D. (2009). Landslide volumes and landslide mobilization rates in Umbria, central Italy. Earth Planet. Sc. Lett. 279, 222–229. doi:10.1016/j.epsl.2009.01.005
Harp, E. L., Hartzell, S. H., Jibson, R. W., Ramirez-Guzman, L., and Schmitt, R. G. (2014). Relation of landslides triggered by the Kiholo Bay earthquake to modeled ground motion. Seismol. Soc. Am. Bull. 104, 2529–2540. doi:10.1785/0120140047
Harp, E. L., and Jibson, R. W. (1995). Inventory of landslides triggered by the 1994 Northridge, California earthquake. U.S. Geol. Surv. Open-File Rep., 95–213. doi:10.3133/ofr95213
Harp, E. L., Jibson, R. W., and Schmitt, R. G. (2016). “Map of landslides triggered by the January 12, 2010, Haiti earthquake,”. U.S. Geological Survey Scientific Investigations. doi:10.3133/sim3353
Harp, E. L., and Keefer, D. K. (1990). “Landslides triggered by the earthquake,” in The coalinga, California, earthquake of may 2, 1983. Editors M. J. Rymer, and W. L. Ellsworth (U.S. Geological Survey Professional Paper), 1487: 335–347. 1 pl., scale 1:48,000.
Harp, E. L., Keefer, D. K., Sato, H. P., and Yagi, H. (2011). Landslide inventories: the essential part of seismic landslide hazard analyses. Eng. Geol. 122 (1-2), 9–21. doi:10.1016/j.enggeo.2010.06.013
Harp, E. L., Tanaka, K., Sarmiento, J., and Keefer, D. K. (1984). Landslides from the may 25– 27, 1980, mammoth lakes, California, earthquake sequence. U.S. Geol. Surv. Misc. Investig. doi:10.3133/i1612
Harp, E. L., Wilson, R. C., and Wieczorek, G. F. (1981). Landslides from the february 4, 1976, Guatemala earthquake. U.S. Geol. Surv. Prof. Pap. doi:10.3133/pp1204A
Hu, K., Zhang, X., You, Y., Hu, X., Liu, W., and Li, Y. (2019). Landslides and dammed lakes triggered by the 2017 Ms6.9 Milin earthquake in the Tsangpo gorge. Landslides 16, 993–1001. doi:10.1007/s10346-019-01168-w
Huang, T. F. (1999). “Landslides triggered by jueili earthquake,” in An open repository of earthquake-triggered ground failure inventories, R. Schmitt, H. Tanyas, M. A. Jessee, J. Zhu, K. Biegel, K. E. Allstadtet al. (U.S. Geological Survey data release collection). doi:10.5066/F7H70DB4
Iadanza, C., Trigila, A., Starace, P., Dragoni, A., Biondo, T., and Roccisano, M. (2021). IdroGEO: a collaborative web mapping application based on REST API services and open data on landslides and floods in Italy. ISPRS Int. J. Geo-Information. 10 (2), 89. doi:10.3390/ijgi10020089
Jaboyedoff, M., Carrea, D., Derron, M. H., Oppikofer, T., Penna, I. M., and Rudaz, B. (2020). A review of methods used to estimate initial landslide failure surface depths and volumes. Eng. Geol. 267, 105478. doi:10.1016/j.enggeo.2020.105478
Keefer, D. K. (1984). Landslides caused by earthquakes. Geol. Soc. Am. Bull. 95, 406. doi:10.1130/0016-7606(1984)95<406:lcbe>2.0.co;2
Knoper, L., Allstadt, K. E., Clark, M. K., Thompson, E. M., and Schmitt, R. G. (2020). Inventory of landslides triggered by the 2020 Puerto Rico earthquake sequence. U.S. Geol. Surv. data release. doi:10.5066/P9U0IXLP
Larsen, I. J., Montgomery, D. R., and Korup, O. (2010). Landslide erosion controlled by hillslope material. Nat. Geosci. 3, 247–251. doi:10.1038/ngeo776
Lekkas, L. E. (2010). The 12 may 2008 Mw 7.9 wenchuan, China, earthquake: macroseismic intensity assessment using the EMS-98 and ESI 2007 scales and their correlation with the geological structure. Bull. Seismol. Soc. Am. 100 (5B), 2791–2804. doi:10.1785/0120090244
Li, G., West, A. J., Densmore, A. L., Jin, Z., Parker, R. N., and Hilton, R. G. (2014). Seismic mountain building: landslides associated with the 2008 Wenchuan earthquake in the context of a generalized model for earthquake volume balance. Geochem. Geophys. Geosystems 15, 833–844. doi:10.1002/2013GC005067
Marano, K. D., Wald, D. J., and Allen, T. I. (2010). Global earthquake casualties due to secondary effects: a quantitative analysis for improving rapid loss analyses. Nat. hazards 52, 319–328. doi:10.1007/s11069-009-9372-5
Marc, O., and Hovius, N. (2015). Amalgamation in landslide maps: effects and automatic detection. Nat. Hazards Earth Syst. Sci. 15, 723–733. doi:10.5194/nhess-15-723-2015
Marc, O., Hovius, N., Meunier, P., Gorum, T., and Uchida, T. (2016). A seismologically consistent expression for the total area and volume of earthquake-triggered landsliding. J. Geophys. Research-Earth Surf. 121-4, 640–663. doi:10.1002/2015JF003732
Marc, O., Stumpf, A., Malet, J. P., Gosset, M., Uchida, T., and Chiang, S. H. (2018). Initial insights from a global database of rainfall induced landslide inventories: the weak influence of slope and strong influence of total storm rainfall. Earth Surf. Dynam. 6, 903–922. doi:10.5194/esurf-6-903-2018
Michetti, A. M., Esposito, E., Guerrieri, L., Porfido, S., Serva, L., Tatevossian, R., et al. (2007). Environmental seismic intensity scale-ESI 2007. Mem. Descr. della carta Geol. D’italia. 74, 41.
Naik, S. P., Mohanty, A., Sotiris, V., Mittal, H., Porfido, S., Michetti, A. M., et al. (2023). 28th September 2018 Mw 7.5 Sulawesi Supershear Earthquake, Indonesia: ground effects and macroseismic intensity estimation using ESI-2007 scale. Eng. Geol. 317, 107054. doi:10.1016/j.enggeo.2023.107054
Ota, Y., Azuma, T., and Lin, Y. N. (2009). Application of INQUA environmental seismic intensity scale to recent earthquakes in Japan and taiwan. Geol. Soc. Lond. Spec. Publ. 316, 55–71. doi:10.1144/SP316.4
Papathanassiou, G., Valkaniotis, S., Ganas, A., and Pavlides, S. (2013). GIS-based statistical analysis of the spatial distribution of earthquake-induced landslides in the island of Lefkada, Ionian Islands, Greece. Landslides 10 (10-6), 771–783. doi:10.1007/s10346-012-0357-1
Rodrıguez, C. E., Bommer, J. J., and Chandler, R. J. (1999). Earthquake-induced landslides: 1980–1997. Soil Dyn. Earthq. Eng. 18 (5), 325–346. doi:10.1016/S0267-7261(99)00012-3
Ruiz, P., Carr, J. C., Alvarad, E., Soto, G. J., Mana, S., Feigenson, M. D., et al. (2019). “Coseismic landslide susceptibility analysis using LiDAR data PGA attenuation and GIS: the case of poás volcano, Costa Rica, Central America,” in Poás Volcano. Active volcanoes of the world. Editors F. Tassi, O. Vaselli, and R. Mora Amador, 79–118. doi:10.1007/978-3-319-02156-0_4
Ruiz, P., Rodríguez, N., Valverde, J., Marden, A., Vecchiarelli, L., Seal, D. M., et al. (2020). Landslide inventory from the M 5.3 capellades, Costa Rica earthquake. U.S. Geological Survey data release. doi:10.5066/P92R269I
Sato, H. P., Hasegawa, H., Fujiwara, S., Tobita, M., Koarai, M., Une, H., et al. (2007). Interpretation of landslide distribution triggered by the 2005 Northern Pakistan earthquake using SPOT 5 imagery. Landslides 4, 113–122. doi:10.1007/s10346-006-0069-5
Schmitt, R. G., Tanyas, H., Nowicki Jessee, M. A., Zhu, J., Biegel, K. M., Allstadt, K. E., et al. (2017). An open repository of earthquake-triggered ground-failure inventories. U.S. Geol. Surv. data release Collect. doi:10.5066/F7H70DB4
Sekiguchi, T., and Sato, H. P. (2006). Feature and distribution of landslides induced by the mid niigata prefecture earthquake in 2004, Japan. J. Jpn. Landslide Soc. 43, 142–154. doi:10.3313/jls.43.142
Sepulveda, S., Serey, A., Lara, M., Pavez, A., and Rebolledo, S. (2010). Landslides induced by the april 2007 aysén fjord earthquake, Chilean patagonia. Landslides 7 (4), 483–492. doi:10.1007/s10346-010-0203-2
Serva, L., Vittori, E., Comerci, V., Esposito, E., Guerrieri, L., Michetti, A. M., et al. (2016). Earthquake hazard and the environmental seismic intensity (ESI) scale. Pure Appl. Geophys. 173, 1479–1515. doi:10.1007/s00024-015-1177-8
Shao, X., Ma, S., and Xu, C. (2023). Distribution and characteristics of shallow landslides triggered by the 2018 Mw 7.5 Palu earthquake, Indonesia. Landslides 20 (1), 157–175. doi:10.1007/s10346-022-01972-x
Silva, P. G., Pérez-López, R., Rodríguez-Pascua, M. A., Giner, J. L., Huerta, P., Bardají, T., et al. (2013). Earthquake environmental effects (EEEs) triggered by the 2011 Lorca earthquake (Mw 5.2, Betic Cordillera, SE Spain): application of the ESI-07 macroseismic scale. Aachen, Germany: 4th INQUA PATA meeting.
Sridharan, A., Ferrario, M. F., and Gopalan, S. (2023). Earthquake-triggered landslides and environmental seismic intensity: insights from the 2018 Papua New Guinea earthquake (Mw 7.5). All Earth 35 (1), 195–209. doi:10.1080/27669645.2023.2233140
Tanyaş, H., Hill, K., Mahoney, L., Fadel, I., and Lombardo, L. (2022). The world’s second-largest, recorded landslide event: lessons learnt from the landslides triggered during and after the 2018 Mw 7.5 Papua New Guinea earthquake. Eng. Geol. 297: 106504. doi:10.1016/j.enggeo.2021.106504
Tanyaş, H., van Westen, C. J., Allstadt, K. E., Anna Nowicki Jessee, M., Görüm, T., Jibson, R., et al. (2017). Presentation and analysis of a worldwide database of earthquake-induced landslide inventories. J. Geophys. Res. Earth Surf. 122 (10), 1991–2015. doi:10.1002/2017JF004236
Townsend, K. F., Gallen, S. F., and Clark, M. K. (2020). Quantifying near-surface rock strength on a regional scale from hillslope stability models. J. Geophys. Res. Earth Surf. 125, e2020JF005665. doi:10.1029/2020JF005665
Uchida, T., Kataoka, S., Iwao, T., Matsuo, O., Terada, H., Nakano, Y., et al. (2017). Landslides triggered by the january 16, 1995, M 6.9 kobe, Japan earthquake. doi:10.5066/F7TH8K60
Wartman, J., Dunham, L., Tiwari, B., and Pradel, D. (2013). Landslides in eastern Honshu induced by the 2011 Tohoku earthquake. Seismol. Soc. Am. Bull. 103, 1503–1521. doi:10.1785/0120120128
Xu, C. (2014). Do buried-rupture earthquakes trigger less landslides than surface-rupture earthquakes for reverse faults? Geomorphology 216, 53–57. doi:10.1016/j.geomorph.2014.03.029
Xu, C. (2015). Preparation of earthquake-triggered landslide inventory maps using remote sensing and GIS technologies: principles and case studies. Geosci. Front. 6 (6), 825–836. doi:10.1016/j.gsf.2014.03.004
Xu, C., Xu, X., Shen, L., Yao, Q., Tan, X., Kang, W., et al. (2016). Optimized volume models of earthquake-triggered landslides. Sci. Rep. 6 (1), 29797. doi:10.1038/srep29797
Xu, C., Xu, X., and Shyu, J. B. H. (2015). Database and spatial distribution of landslides triggered by the Lushan, China Mw 6.6 earthquake of 20 April 2013. Geomorphology 248, 77–92. doi:10.1016/j.geomorph.2015.07.002
Xu, C., Xu, X., Shyu, J. B. H., Zheng, W., and Min, W. (2014b). Landslides triggered by the 22 July 2013 Minxian Zhangxian, China, Mw 5.9 earthquake: inventory compiling and spatial distribution analysis. J. Asian Earth Sci. 92, 125–142. doi:10.1016/j.jseaes.2014.06.014
Xu, C., Xu, X., Yao, X., and Dai, F. (2014a). Three (nearly) complete inventories of landslides triggered by the May 12, 2008 Wenchuan Mw 7.9 earthquake of China and their spatial distribution statistical analysis. Landslides 11 (11-3), 441–461. doi:10.1007/s10346-013-0404-6
Xu, C., Xu, X., Zhou, B., and Yu, G. (2013). Revisions of the M 8.0 Wenchuan earthquake seismic intensity map based on coseismic landslide abundance. Nat. Hazards. 69, 1459–1476. doi:10.1007/s11069-013-0757-0
Yagi, H., Sato, G., Higaki, D., Yamamoto, M., and Yamasaki, T. (2009). Distribution and characteristics of landslides induced by the iwate–miyagi nairiku earthquake in 2008 in Tohoku district, northeast Japan. Landslides 6, 335–344. doi:10.1007/s10346-009-0182-3
Yang, Z., Pang, B., Dong, W., and Li, D. (2023). Spatial pattern and intensity mapping of coseismic landslides triggered by the 2022 luding earthquake in China. Remote Sens. 15 (5), 1323. doi:10.3390/rs15051323
Yunus, A. P., Xinyu, C., Catani, F., Subramaniam, S. S., Fan, X., Jie, D., et al. (2023). Earthquake-induced soil landslides: volume estimates and uncertainties with the existing scaling exponents. Sci. Rep. 13 (1), 8151. doi:10.1038/s41598-023-35088-6
Zhang, J., Liu, R., Deng, W., Khanal, N. R., Gurung, D. R., Murthy, M. S. R., et al. (2016). Characteristics of landslide in koshi river basin, central himalaya. J. Mt. Sci. 13 (10), 1711–1722. doi:10.1007/s11629-016-4017-0
Zhao, B. (2021). Landslides triggered by the 2018 Mw 7.5 Palu supershear earthquake in Indonesia. Eng. Geol. 294, 106406. doi:10.1016/j.enggeo.2021.106406
Keywords: earthquake environmental effects, ESI-07 scale, landslides, inventory, seismic hazard
Citation: Muccignato E and Ferrario MF (2025) Exploiting earthquake-induced landslide inventories for macroseismic assessment using the environmental seismic intensity (ESI-07) scale. Front. Earth Sci. 13:1468787. doi: 10.3389/feart.2025.1468787
Received: 22 July 2024; Accepted: 26 March 2025;
Published: 08 April 2025.
Edited by:
Yunhui Zhang, Southwest Jiaotong University, ChinaReviewed by:
Alberto Armigliato, Alma Mater Studiorum - Università di Bologna, Dipartimento di Fisica e Astronomia “Augusto Righi”, ItalyCopyright © 2025 Muccignato and Ferrario. This is an open-access article distributed under the terms of the Creative Commons Attribution License (CC BY). The use, distribution or reproduction in other forums is permitted, provided the original author(s) and the copyright owner(s) are credited and that the original publication in this journal is cited, in accordance with accepted academic practice. No use, distribution or reproduction is permitted which does not comply with these terms.
*Correspondence: Eliana Muccignato, ZW11Y2NpZ25hdG9AdW5pbnN1YnJpYS5pdA==
†ORCID: Eliana Muccignato, orcid.org/0000-0003-2442-8477; Maria Francesca Ferrario, orcid.org/0000-0002-6755-2331
Disclaimer: All claims expressed in this article are solely those of the authors and do not necessarily represent those of their affiliated organizations, or those of the publisher, the editors and the reviewers. Any product that may be evaluated in this article or claim that may be made by its manufacturer is not guaranteed or endorsed by the publisher.
Research integrity at Frontiers
Learn more about the work of our research integrity team to safeguard the quality of each article we publish.