
94% of researchers rate our articles as excellent or good
Learn more about the work of our research integrity team to safeguard the quality of each article we publish.
Find out more
ORIGINAL RESEARCH article
Front. Earth Sci., 25 March 2025
Sec. Geohazards and Georisks
Volume 13 - 2025 | https://doi.org/10.3389/feart.2025.1461180
 Xudong Wang1†Suo Zhang1†
 Ruanhang Pan2*†Yongqiang Zhao3*Zhen Jia2Hainar Tursinhali2Xining Ren1Alida Kuerban4
With the gradual depletion of easily exploitable coal resources in the shallow crust, deep mining under complex geological conditions will become the new normal. Deep mining causes complex stress disturbances to the overlying strata. In order to study the deformation and fracture evolution characteristics of overburden under deep mining conditions, this paper studies the first mining face of a mine in Ordos, Asia, and combines a variety of research methods such as similarity simulation, fractal geometry and percolation theory to carry out research. First, the distribution morphology and development process of overburden mining cracks were studied through similarity simulation experiments, and the law of changes in the horizontal and vertical fracture density with the distance from the working face was obtained; secondly, the scale effect of the cracks was studied using fractal geometry theory, revealing the distribution law of cracks at different scales; finally, the development characteristics of the largest group of crack percolation were discussed, and the functional relationship between the percolation probability and the fractal dimension was given. The research results show that: the transverse and longitudinal fracture ratio of the overburden increases first, then decreases, and finally increases again as the working face advances. The mining cracks are generally distributed in an “M” shape with high ends and low middle; the change of fractal dimension is affected by factors such as the distribution, density, arrangement, connectivity and generation mechanism of the fracture network. The fractal dimension has two abrupt decrease points as the working face advances. According to the abrupt decrease points, the evolution of the fractal dimension can be divided into three stages; the percolation probability increases as the working face advances, and three growth rates appear in this process. According to the growth rate, the evolution of the percolation probability can be divided into three stages; the comparison of the changes in fractal dimension and percolation probability shows that the change nodes of the three stages are the same, and the fitting shows that the fractal dimension and the percolation probability have a good correlation. The research results can provide certain theoretical support for the zoning analysis and evaluation of mining damage in overburden strata under deep mining conditions.
The distribution of overlying rock fracture field has a certain controlling effect on groundwater seepage and hydrogeological changes, and it is also an important basis for us to assess the stability of underground engineering. How to quantitatively characterize the evolution of overlying rock fracture field and analyze and assess the damage area has become an important topic in rock mechanics research.
In the 1970s, Mandelbrot created fractal geometry, which was utilized to characterize irregular and disordered natural phenomena (Mandelbrot, 1982). Overburden fracture fields are usually irregular and disordered, and these characteristics are closely related to the concepts of fractal theory. Fractal fields exhibit similar structures at different scales, and fractal theory can well quantitatively describe this evolutionary process, and also help to predict the trend of change in the fracture network. At the sample level, Mingzhong Gao obtained the dynamic damage of coal samples by high-speed photography with digital scattering, and used fractal methods to quantitatively characterize the specimen fissures (Gao et al., 2020). Ke Zhang studied the fracture characteristics and fractal behavior of porous multi-fractured rocks by numerical simulation and fractal dimension calculation (Zhang et al., 2018). Yidong Wang explored the rupture mechanism of rock particles and the effect of fractal dimension based on particle crushing test and fractal modeling (Wang et al., 2015). Ziwen Li used the relationship between adsorption force and fractal dimension to explore the influence of coal body properties on gas adsorption force (Li DP. et al., 2015). In macro level, Lintao Mao used the fractal dimension of three-dimensional fissures to evaluate the degree of fissure evolution and damage in coal samples (Mao et al., 2014). Wang Cong analyzed the changes in fractal dimension by factors such as fixed carbon, dry basis volatile matter, and ash content (Wang et al., 2013). Pinkun Guo analyzed the pore structure characteristics of coal by fractal dimension comparison method (Guo et al., 2013). Ruidong Peng studied the characteristics of rock pore network through fractal theory together with digital image processing technology, revealing the fractal characteristics of rock pore network (Peng et al., 2011). Ting Zhang found that the larger the fractal dimension of reservoir pore structure, the worse the storage performance (Zhang et al., 2010). Xianmin Zhang established a mathematical model of fractal coalbed methane reservoir (Zhang et al., 2008). Xinfang Ma used fractal theory to calculate the fractional dimension of the pore structure of the reservoir rock and proved that the segmental regression method can better reflect the actual situation of the pore structure (Ma et al., 2004). Dong Jiang evaluated the mercury compression test data by calculating the fractal dimension of the pore space of the rock formation (Jiang et al., 1999). Existing studies have predominantly focused on the characterization of microscopic fractures (pores, microcracks) using fractal geometry, while research on the fractal evolution mechanisms of fracture networks in overlying rock layers under deep mining conditions remains insufficient (Ren and Wang, 2020; Guo et al., 2018; Sakhno et al., 2023). Although fractal theory can quantitatively describe the multiscale disorder of fracture networks, it requires integration with percolation theory to reveal their permeability characteristics and connectivity mechanisms. By contrasting deterministic failure processes (e.g., key stratum rupture) with stochastic crack propagation (e.g., bed-separation fractures), this study clarifies the applicability boundaries of fractal theory (Zhou and Xiong, 1996). Furthermore, based on the deep mining conditions of the Ordos Basin, it establishes a pioneering fractal-percolation coupled model for mining-induced fracture networks, addressing critical gaps in current research.
Percolation theory is an important means to study strongly disordered random geometry, which is an important branch of probability theory, and was first proposed by Broadbent et al. in 1957 for the study of fluid percolation in random media (Broadbent and Hammersley, 1957). The more famous ones are Dongjie Xue combined the probabilistic model and the theory of percolation to explore the solution uniqueness of the mining stress distribution (Xue et al., 2022). Genshui Wu investigated the deformation damage law and percolation behavior of gas-containing coal rock under stress disturbance based on percolation theory (Wu et al., 2018), Percolation theory mainly deals with the critical transition effect caused by the change of interconnectivity in disordered systems. This interconnectivity can be regarded as an implicit universal law found in disordered systems to a certain extent (Kirkpatrick, 1973; Stauffer, 1979; Wilkinson and Willemsen, 1999). To derived the calculation method of the radius of percolation damage zone. Jinyan Feng established the fractal geometry of fissure and the percolation probability calculation formula with the influence factor of mining depth (Feng et al., 2017). Dongping Li described the evolution characteristics of the fracture network using the percolation and fractal theories, and established the percolation-fractal numerical model (Li ZW. et al., 2015). Wei Li used CT with three-dimensional overdiffusion theory to study the differences in pore connectivity and permeability of different structural coal bodies (Li et al., 2014). Dongjie Xue established an overburden overdraft model to analyze the overdraft characteristics of mining fissures (Xue et al., 2013).
At present, domestic and foreign scholars have studied the fractal evolution characteristics and percolation change characteristics of overburden fracture network from different angles, indicating its scientific nature in fracture network research. In order to gain a deeper understanding of the evolution law of overburden fractures under deep mining conditions, this paper conducts a study on the fracture evolution and permeability distribution of deep mining in the Ordos Basin. Combining similar simulation experiments, fractal geometry theory and percolation theory research, the evolution law of overburden fractures is studied, and an attempt is made to establish a fractal percolation model of overburden fracture network under deep mining, which may provide new ideas for solving problems related to overburden deformation evolution under deep mining conditions.
In the process of coal mining, cracks are often distributed in the overlying rock strata in the mining area and the coal rock mass in the stress concentration area, which has an important impact on coal mine safety and production. Analysis based on fractal dimension can reveal the fractal characteristics of cracks, and then infer their spatiotemporal evolution state. This paper uses similar simulation experiments to obtain fracture network images with different advancement distances. Since the fracture network image dimension is two-dimensional, and the fracture network image is composed of pixels after image binarization (cracks are black pixels, and other places are white pixels), and the box counting dimension method is simple and easy, and does not require complex mathematical tools and calculation processes. Therefore, for this series of pictures, this paper uses the box counting dimension method to process and calculate the fractal characteristics of the image. The calculation formula for the fractal dimension of the overburden fracture is shown in Equation 1:
where D is the box counting dimension of overburden fracture network, reflecting the fracture evolution of the overburden fracture network during the mining process, which is characterized by disorder and irregularity; N denotes the proportion of fracture pixels in each square grid; and r is the length of the grid edge.
Physical similarity simulation experiments can use percolation theory to characterize the fracture network in the overburden strata, and calculate the number, size and morphological parameters of percolation clusters, etc., to evaluate the impact of the fracture network on water inflow and permeability. Percolation refers to the percolation phenomenon that occurs when one substance passes through another substance. Percolation theory is a mathematical tool and method to study this phenomenon. Since the processed fracture network image is composed of multiple pixels, grid percolation is to randomly add some obstructing objects (such as fixed boundaries of fluid) to a regular network, and then study the diffusion and penetration behavior of fluid in the network. In the physical similar material simulation experiment, the judgment method is whether the fractures in the overburden strata occupy individual spaces. If the individual space is occupied by the fracture, the probability is recorded as p, and the probability that the individual space is not occupied is recorded as 1-p, and the probability of each individual space being occupied by the fracture is independent of each other. This research method corresponds to the image characteristics obtained by the similar simulation experiment in this paper, and is also similar to the box-counting dimension method. When considering the fracture network of the overburden strata, the fracture network and the particle grid can be regarded as full. During coal mining, the lateral cracks and the middle cracks are connected to each other to form many interconnected crack clusters of different sizes. The crack cluster that occupies the most individual space is called the largest cluster. When the number of cracks contained in the largest cluster continues to increase and connects two symmetrical interfaces in the plane, a percolation cluster will be generated, and the percolation probability calculation formula is shown in Equation 2:
where P (i) is the percolation probability; M (N) is the number of occupied individual spaces in the largest group; and Nd is the total number of individual spaces in the network. When it is a two-dimensional square network, N is the number of individual spaces contained in each row (column), when d = 2.
Based on geological borehole data surrounding a mine in the Ordos Basin, the Ordos Basin primarily contains Jurassic coal-bearing strata. The working face has a strike length of 5,291 m and a dip length of 300 m, targeting the No. 2-2 coal seam in the Middle-Lower Jurassic Yan’an Formation. Due to significant heterogeneity in stratum thickness within the study area (as supported by borehole data from Table 1), the working face exhibits an average mining depth of 882 m, with an average coal seam thickness of 7 m.
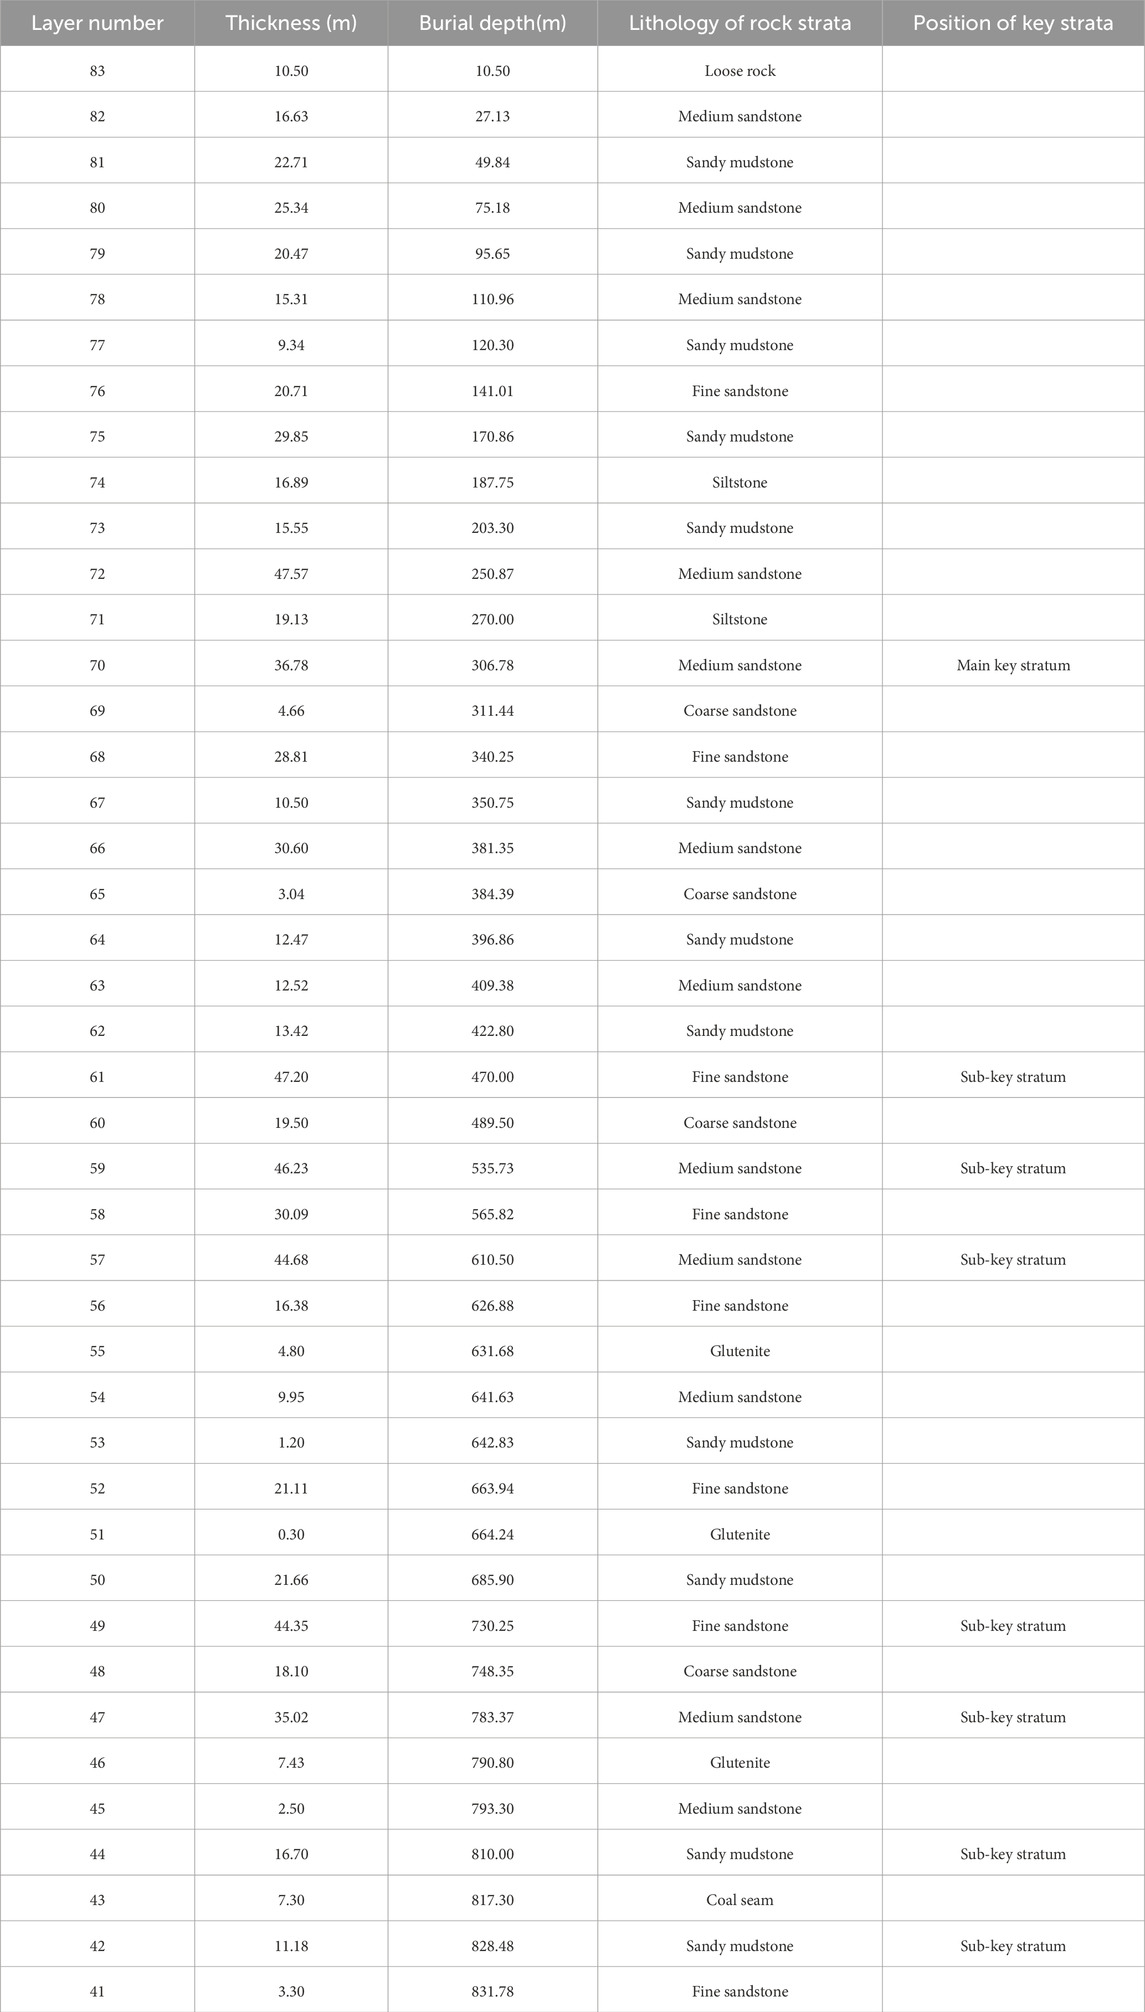
Table 1. Positional characteristics of key strata in overlying rock layers of typical working faces.
According to the actual situation of the mine, the similarity principle was adopted to conduct similarity model tests along the mining direction. The similarity simulation platform independently developed by the National Key Laboratory of Water Resources Protection and Utilization in Coal Mining - Multi-coal seam mining coal mine simulation test platform was used. The platform consists of modules such as reaction frame, vertical loading system, horizontal loading system, coal seam excavation simulation device and monitoring system. The external three-dimensional dimensions of the main frame model are 2400 mm × 2,100 mm × 600 mm (width × height × thickness), and the three-dimensional net dimensions of the internal space are 2100 mm × 1800 mm × 300 mm (width × height × thickness) as shown in Figure 1. The model is laid at a height of 1.6 m, with a total of 21 layers. According to the similarity ratio of 1:200, it simulates the coal and rock layer from the bottom plate of the 6-1 coal seam to about 320 m above. The actual height of the model is 320 m, the buried depth of the working face is 882 m, and the unlaid rock layer above the model is loaded in the form of load. After calculation, the load above the model is about 44.8 kPa.
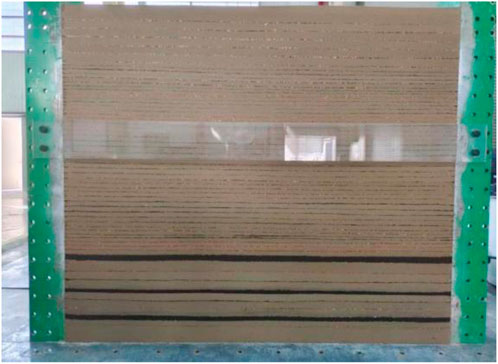
Figure 1. Multi-seam mining coal mine simulation test platform
On this basis, through physical similarity model test, the instability process of overburden in the mining process and the evolution of overburden fracture field are studied. The excavation height of this model is 7.3 cm, and each excavation is 10 cm, which represents the actual mining speed of 20 m/d.
Figure 2 shows the fracture distribution diagram of excavation-induced disturbance in the similar model, where n represents the number of fracture traces in the fracture network. The immediate roof of the coal mine corresponds to Sub-key Stratum 1, and the lithology in this area is sandy mudstone. As illustrated in Figure 2A, when the working face advanced 40 cm from the open-off cut, the immediate roof experienced collapse. During this process, the overlying strata exhibited significant bending deformation, followed by fracture development under substantial tensile bending stress, ultimately forming a 11.4 cm-high caving zone. This phenomenon is associated with the initial collapse of the main roof and simultaneously serves as the first indication of pressure manifestation (first weighting) in the working face.
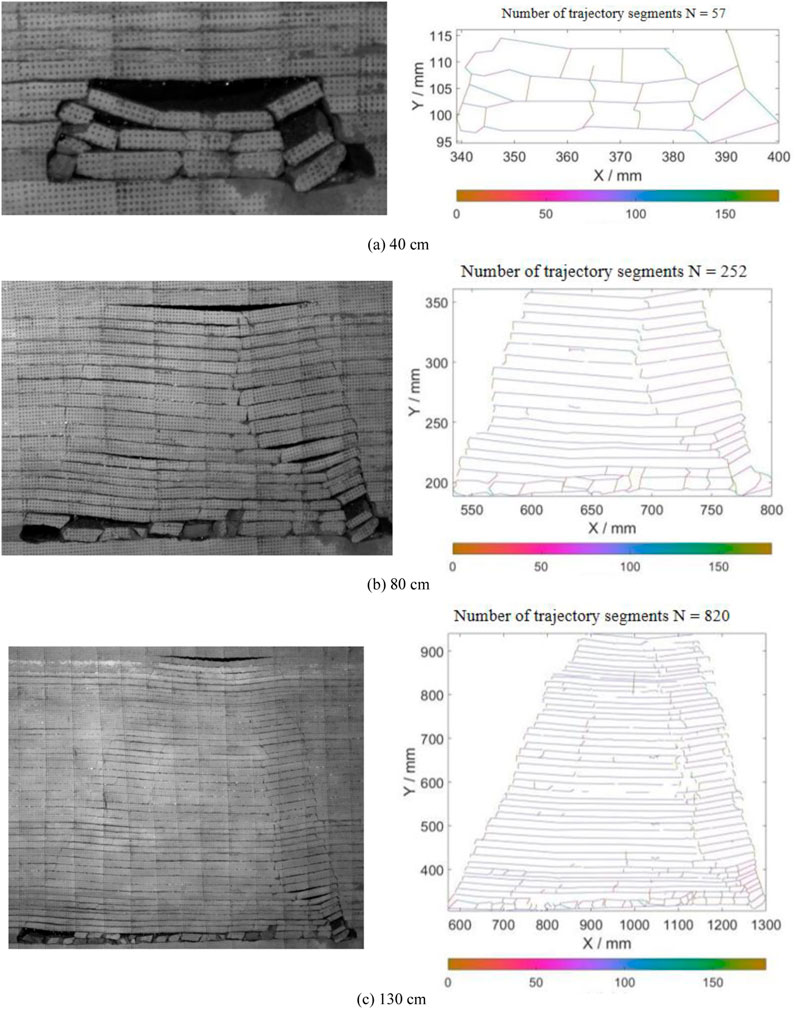
Figure 2. Distribution of disturbed fissures in similar model excavations. (a) 40 cm. (b) 80 cm. (c) 130 cm
As the mining process progresses, the collapse area expands along the strike. When the working face advances to 50 cm, the roof collapses periodically for the first time, and the corresponding collapse height is 15.9 cm. As the mining work continues, the collapse area extends along the strike again. When the advance reaches 60 cm and 70 cm, the roof collapses for the third and fourth time, and the corresponding collapse heights are 19.7 cm and 24.9 cm, respectively.
When the working face advances to 80 cm, the subcritical layer 2 breaks. Due to the breakage of the key layer, the overlying soft rock layer loses support and bends and deforms until it finally breaks. The collapse height reaches 35.4 cm, and the working face encounters the fifth cycle of pressure. Subsequently, when the advance distance reaches 90 cm, the subcritical layer 3 breaks, and the overlying rock layer breaks, resulting in a collapse height of 50.0 cm, and the working face encounters the sixth cycle of pressure.
When the advance distance is 100 cm, the collapse area continues to grow along the strike length, but the collapse height remains basically unchanged. When the working face advances to 110 cm, 120 cm, and 130 cm, the horizontal and vertical cracks in the overburden fracture zone continue to develop and evolve toward the front of the working face, interpenetrating to form cross cracks. However, the collapse height remains relatively stable, and the collapse area further expands forward.
Since the image is composed of a matrix, the RGB value of each point in the matrix is different, and the colors presented are different, and finally the whole image is presented in color. However, the overburden fracture network image cannot accurately identify the fracture position by the naked eye. In order to facilitate subsequent analysis, the color image needs to be divided into a binary image of either black or white through a binarization method. If the gray value is greater than the threshold, it is assigned to 255, otherwise it is 0. Then an adaptive threshold is added, and the OTSU threshold segmentation method is used to determine the threshold of each part of the image to complete the image binarization processing. Through the analysis of the binary images of the crack distribution in the overburden, the distribution characteristics of the fracture density at different advancement distances in the overburden destruction process were obtained: the distribution law of the mining cracks in the horizontal direction is an “M” type, that is, the fracture density is larger near the opening, forming a distribution pattern with high ends and low in the middle.
In the physical similarity simulation test, the collected overburden crack images are often RGB color images. Therefore, they must be converted into grayscale images first, and then the image contrast is enhanced and the image noise is eliminated using homomorphic filtering technology. Finally, the threshold segmentation method is used to obtain the binary image of the overburden crack. The fracture network images at different advancement distances after binarization are analyzed to analyze the occupancy rate of the crack image pixels in the damaged area. Since the binary image of the overburden crack is composed of many black and white pixels, the fracture density is defined as the ratio of the pixels occupied by the cracks in the image to the total pixels of the entire image. The calculation formula can be expressed as:
Where W is the fracture density; Pa is the number of crack pixels in the image; and Pb is the total number of pixels in the image. From Formula 3, the fracture trace density distribution diagram at each advancement distance is shown in Figure 3.
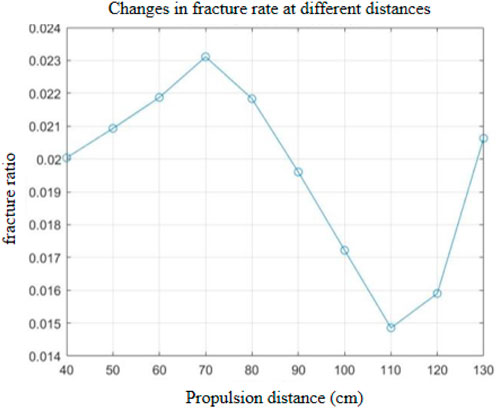
Figure 3. Changes in fracture rate of overburden fracture network under different advancing distances.
As shown in Figure 4, the fracture ratio shows different trends at different stages. In the initial stage (40–70), the fracture ratio gradually increased from 0.0200359 to 0.0231126. This is due to the change in ground stress and mining disturbance caused by coal mining activities, which led to the opening of the original fractures and increased the fracture density.
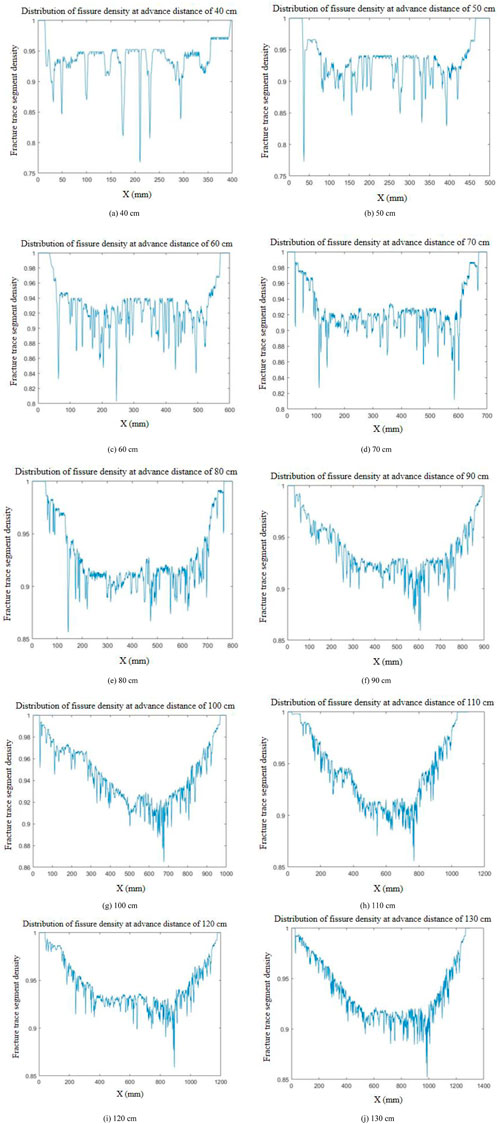
Figure 4. Coal seam mining fracture network density distribution map. (a) 40 cm. (b) 50 cm. (c) 60 cm. (d) 70 cm. (e) 80 cm. (f) 90 cm. (g) 100 cm. (h) 110 cm. (i) 120 cm. (j) 130 cm.
In the middle stage (80–110), the fracture ratio showed a significant downward trend, from 0.0231126 to 0.0148538. This is due to the mechanical load imposed by mining activities and the redistribution of ground stress, which caused some of the original fractures to be squeezed and closed, thereby reducing the fracture ratio.
In the later stage (120–130), the fracture ratio showed a rebound trend, from 0.0148538 to 0.0206321. This is due to the continuous impact of mining activities and stratum deformation, which led to the re-generation of new fractures in the stratum, increasing the fracture ratio.
In order to further study the fracture density variation characteristics of the overlying rock fracture network, the fracture density variation at different distances from the cut eye was analyzed. For the crack images after binary processing, the occupancy rate of the crack image pixels on the vertical axis was analyzed. The fracture trace density was defined as the ratio of the pixel points occupied by the cracks on the vertical axis to the total pixel points of the image on this vertical axis. The calculation formula is shown in Equation 4:
According to the given fracture trace density distribution diagram, it can be concluded that with the increase of advancement distance, the fracture network formed by mining disturbance in the overburden gradually develops, the fractures are crisscrossed, and its complexity increases accordingly. In similar simulation experiments, when the advancement distance is 40 cm and 50 cm, the fracture network of the overburden is in the initial development stage, and the fracture trace density distribution diagram remains stable, indicating that the fracture network is relatively regular at this time, and no complex fracture network morphology appears. When the advancement distance is 60 cm, 70 cm, and 80 cm, the fracture density distribution line shows large fluctuations, with high and low staggered, indicating that the fracture network continues to develop in these two stages, the morphology and distribution of the fractures become more complex, and the phenomenon of fractures connecting and crossing each other begins to appear frequently. When the advancement distance is 90 cm and 100 cm, the middle broken line of the fracture trace density distribution diagram shows a significant decline. Combined with the destruction morphology and final displacement of the overburden at different advancement distances in Figure 3, it can be obtained that the fracture network has a self-repair phenomenon at this time, and the degree of self-repair is greater than the degree of fracture development, resulting in the value of the middle broken line of the fracture trace density distribution diagram falling. When the advancement distance is 110 cm, 120 cm and 130 cm, the concave degree of the middle section of the fracture trace density distribution diagram is slightly reduced, that is, the density value of the middle fracture trace gradually increases, indicating that in these two stages, the occupancy rate of fracture pixels on the vertical axis increases, the fractures continue to develop and the degree of development is greater than the degree of self-repair, resulting in a gradual increase in the value.
Because the rock strata are subjected to high stress from deep underground and above, the rocks are compressed and damaged and deformed, and the number of fractures in the overlying rock strata is large and dense, which is easy to connect to each other to a certain extent and form a fracture system, thus affecting the evolution law of the fractures.
The binary images of the fracture network at different advancement distances were analyzed, and the box-counting dimension method was used to quantitatively describe the fractal evolution characteristics of the overburden fracture network. The code was written according to the box-counting dimension calculation formula to calculate the logarithmic relationship between the box size and the number of boxes. Then, the function was used to fit the points in the logarithmic graph and the slope was calculated to obtain the fractal dimension. Finally, the calculation of the fractal dimension of the fracture network at different advancement distances was realized through Matlab software, and the change law of the fractal dimension of the fracture network at different advancement distances was finally obtained, as shown in Figure 5.

Figure 5. Relationship between fractal dimension and propulsion distance in fracture networks for coal seam mining.
Through the correspondence between the fractal dimension of the fracture network in coal seam mining and the advancement distance, the entire dimension-raising process can be divided into three stages for analysis.
In the early stage of mining, the advancement length of the working face is 0–30.0 cm, the coal pillars on both sides support the overlying rock layer, and the direct roof bends and sinks without cracks, so the fractal dimension is 0. In the first dimension-raising stage, the advancement distance of the working face is 30.0–60.0 cm. With the first fall of the direct roof, the first fall of the old roof and periodic collapse, original delamination cracks with larger widths are formed, the number of cracks increases, and the fractal dimension value rises sharply. According to the experimental phenomenon and the comparison of the fracture network diagram of the overlying rock layer, it is concluded that the first pressure appeared when the advancement reached 40 cm. When the advancement reached 60 cm, the fractal dimension showed the first dimension reduction phenomenon. In the second dimensionality-increasing stage, the working face advances from 60.0 to 90.0 cm. In this stage, the area of the collapse zone increases, and as the step distance of the periodic pressure increases, the length of the delamination cracks in the fracture zone and the curved sinking zone increases, and the rate of increase in the crack space occupancy changes rhythmically, so the fractal dimension value increases linearly with the progress of excavation, and the fractal dimension increase trend continues to increase. When advancing to 90 cm, the fractal dimension value drops a second time. Compared with the evolution diagram of the overburden rock cracks in the same stage, it can be seen that the main reason is the collapse of the roof, the overburden rock loses support and compacts the local fracture network, and the direct top of the working face in the advancement direction also collapses due to the influence of mining, causing the stress of the overburden rock fracture network to be redistributed. In the third dimensionality-increasing stage, the working face advances from 90.0 to 130.0 cm, and the horizontal and vertical cracks further penetrate and expand, but the increase in this stage is smaller than that in the second stage, and the growth rate of the fractal dimension of the cracks is significantly reduced. The morphology of the cracks gradually stabilizes. In the process of crack morphology evolution, the morphology of the cracks changes greatly in the initial stage, and the energy is concentrated in a few cracks. The number of fracture traces and trace segments increases rapidly, and the fractal dimension also increases accordingly. However, when the cracks branch and merge, their morphology becomes more macroscopic, the crack distribution is relatively uniform, the growth rate of the number of fracture traces and trace segments slows down, and the growth rate of the fractal dimension of the cracks also decreases.
As the degree of advancement of the working face increases, the fracture network of the overburden strata continues to change, and its area continues to increase. The fracture network develops toward the upper overburden and the overburden in the advancement direction, and new transverse and longitudinal fractures appear, which intersect and merge with the old transverse and longitudinal fractures, and the stress is redistributed to form a new fracture network structure. The fluctuation of the fractal dimension value of the overburden fracture network reflects this process well. The decrease in the rate of increase of the fracture fractal dimension can reflect the characteristic that the fracture morphology gradually tends to be stable, which is closely related to the settlement and compaction of the rock strata above the mining fractures.
The percolation probability of the overburden fracture network was studied by using the seat percolation method. According to the advancement of each working face, 10 binary fracture network images were selected for calculation. According to the seat percolation probability calculation formula, the code was written, and Matlab software was used to search for each fracture cluster (percolation cluster) in the binary fracture network to determine the location of the largest cluster; the percolation clusters and independent fractures except the largest cluster were shielded, and the fracture network diagram containing only the largest cluster was converted into a [0,1] matrix. The individual units occupied by the fractures are represented by 1, and the unoccupied individual units are represented by 0. Finally, the percolation probability P (i) is obtained by counting the number of individual units occupied by the largest cluster M (N) and its ratio to the total number of individual units in the fracture network. The percolation probability corresponding to the overburden fracture network diagram at different advancement distances of the working face is shown in Table 2.
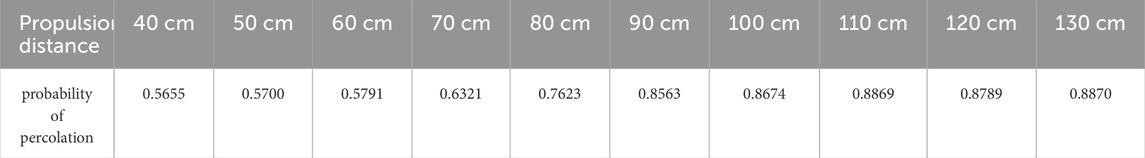
Table 2. Probability of over seepage for different advancing distances of overburden fissure network map of the working face.
In the early stage of mining impact, the working face advances from 0 to 40 cm, and there are few cracks formed, and no connected fracture network is formed, so the percolation probability is 0. In the first stage, the working face advances from 40.0 to 60.0 cm. When the working face advances to 40 cm, the direct top layer collapses for the first time, forming the first connected area. With the appearance of the first and first periodic collapse of the old roof, the main and secondary cracks begin to grow, the distribution range becomes larger, the fracture network expands upward, and the percolation group also increases. At this time, the percolation probability appears and increases approximately linearly. At 50 cm, the roof collapses again. At this time, there are fewer cracks and the compaction is not prominent. The large-scale appearance of transverse and longitudinal cracks and delamination cracks increases the area of the percolation group and the percolation probability. The overlying stratum collapses for the third time when the advancement distance is 60 cm. In the second stage, the working face advances from 70.0 to 90.0 cm. The fourth and fifth periodic collapses occurred when the advance was 80 cm and 90 cm. During this stage, the horizontal detachment and vertical fracture gaps expanded significantly, and the percolation probability increased significantly. In the third stage, the working face advanced 100 cm–130 cm. When the advancement distance was 110 cm and 120 cm, the sixth and seventh periodic collapses occurred in the roof, with collapse heights of 177 cm and 192 cm respectively. Due to the large-scale collapse of the overburden rock, the vertical cracks expanded rapidly, forming a series of connected crack groups, and the percolation probability increased. At this time, the fracture network developed steadily, and the growth rate was lower than that in the second stage. In general, as the advancement work progresses, the percolation probability has been increasing, and the increase rate varies with the division of stages. When the percolation probability reaches a certain constant value and approaches the critical value, the overburden rock will transform from an impermeable medium to a permeable medium.
Through the analysis of the advancement process of similar simulation tests, it is found that the percolation probability and fractal dimension are closely related to the advancement process, and are both related to factors such as overburden collapse, crack development and closure. As can be seen from Figures 5, 6, with the increase of the advancement distance of the working face, the overall trend of the two is increasing, and there are three different increase processes. It can be inferred that there is also a certain relationship between the fractal dimension and the permeability. The research results show that with the development of the excavation work, the increase of the fractal dimension, the percolation probability is generally on the rise. Since the change process of the fractal dimension and the percolation probability is carried out by the increase of the advancement distance, the fitting relationship can be roughly divided into three periods according to the numerical fitting of the advancement distance increase, as shown in Figure 7.
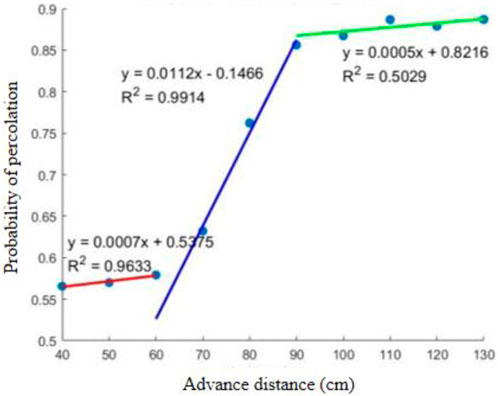
Figure 6. Fitting the probability of percolation in the fracture network to the advance distance.
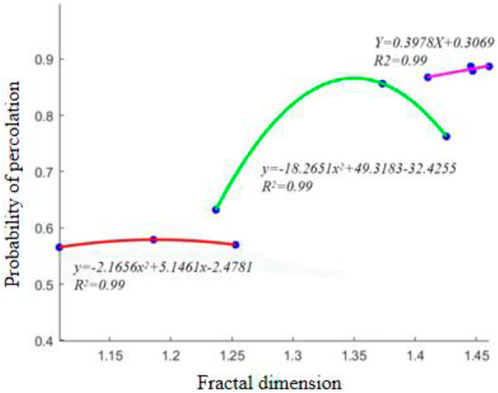
Figure 7. Coal seam mining fissure network percolation probability versus fractal dimension fitting relationship.
As the advancement distance increases, the fractal dimension and percolation probability change similarly. After the two are fitted, the x-axis of the fitting curve is the fractal dimension value corresponding to the order of advancement distance, and the y-axis is the percolation probability value corresponding to the order of advancement distance. The fitting stages are:
Stage 1 (nonlinear stage): The working face advances for a length of 40.0–60.0 m, the percolation probability increases steadily, satisfies the power function relationship, and the correlation coefficient is 0.99. The fitting formula is:
Stage 2 (nonlinear stage): The working face advances 70.0–90.0 m, and the percolation probability increases rapidly, satisfying the power function relationship with a correlation coefficient of 0.99. The fitting formula is:
Stage 3 (linear stage): The working face advances for a length of 100.0–130.0 m. The percolation probability increases more slowly than in stage 2, satisfying a linear relationship with a correlation coefficient of 0.99. The fitting formula is:
It can be seen from Equations 5–7 that the percolation probability and fractal dimension of the overburden fracture network show different correlations with the advancement distance, and the correlation is relatively high.
Based on the above analysis, the study of percolation probability and fractal dimension can effectively characterize the development characteristics of overburden fractures during mining. The correlation between the two further reveals the damage characteristics and distribution laws of the overburden strata caused by mining activities by establishing a fitting relationship, which provides an important theoretical basis for the subsequent mining damage zoning analysis and evaluation. Especially under deep complex geological conditions, the comprehensive analysis method of percolation probability model and fractal dimension not only helps to deeply understand the fracture development mechanism of the strata, but also provides scientific guidance for the deformation evolution analysis and evaluation of the overburden strata under deep mining conditions.
1) It reveals that the distribution law of mining fissures in the horizontal direction is “M” type, i.e., the fissure rate is larger near the eye of the opening cut, forming the form of high at both ends and low in the middle.
2) It is pointed out that both of them can be divided into three sections, and the demarcation point is the point of dimensional reduction of fractal dimension. The size of fractal dimension is controlled by the morphology, density, size distribution, correlation and generating mechanism of the fissures, and the size of the probability of over-permeation is affected by the connectivity of the transversal and longitudinal fissures, the distribution of the widths, the densities, and the arrangement of the fissures, and other factors.
3) The demarcation point is the dimension reduction point, and it has a good correlation. It can be seen that the permeability characteristics of the fracture network are closely related to the morphology and distribution of the fractures. The establishment of the fitting relationship can provide theoretical support for the analysis and evaluation of the deformation evolution of the overlying rock strata under deep mining conditions.
The original contributions presented in the study are included in the article/Supplementary Material, further inquiries can be directed to the corresponding authors.
XW: Conceptualization, Data curation, Formal Analysis, Funding acquisition, Investigation, Methodology, Project administration, Resources, Software, Supervision, Validation, Visualization, Writing–original draft, Writing–review and editing. SZ: Conceptualization, Data curation, Formal Analysis, Funding acquisition, Investigation, Methodology, Project administration, Resources, Software, Supervision, Validation, Visualization, Writing–original draft, Writing–review and editing. RP: Conceptualization, Data curation, Formal Analysis, Funding acquisition, Investigation, Methodology, Project administration, Resources, Software, Supervision, Validation, Visualization, Writing–original draft, Writing–review and editing. YZ: Conceptualization, Data curation, Formal Analysis, Funding acquisition, Investigation, Methodology, Project administration, Resources, Supervision, Validation, Writing–review and editing. ZJ: Data curation, Formal Analysis, Methodology, Project administration, Supervision, Validation, Writing–review and editing. HT: Data curation, Formal Analysis, Methodology, Project administration, Supervision, Validation, Writing–review and editing. XR: Conceptualization, Funding acquisition, Investigation, Resources, Software, Visualization, Writing–review and editing. AK: Data curation, Writing–review and editing.
The author(s) declare that financial support was received for the research, authorship, and/or publication of this article. National Natural Science Foundation of China (52004012).
Authors XW, SZ, and XR were employed by Shenhua Group Xinjie Energy Co., Ltd.
The remaining authors declare that the research was conducted in the absence of any commercial or financial relationships that could be construed as a potential conflict of interest.
All claims expressed in this article are solely those of the authors and do not necessarily represent those of their affiliated organizations, or those of the publisher, the editors and the reviewers. Any product that may be evaluated in this article, or claim that may be made by its manufacturer, is not guaranteed or endorsed by the publisher.
The Supplementary Material for this article can be found online at: https://www.frontiersin.org/articles/10.3389/feart.2025.1461180/full#supplementary-material
Broadbent, S. K., and Hammersley, J. M. (1957). Percolation processes. Math. Proc. Camb. Philosophical Soeiety 53 (3), 629–641. doi:10.1017/s0305004100032680
Feng, J. Y., Liu, X. H., and Yu, Z. Q. (2017). Numerical simulation study on the mining-induced fracture evolution of steep coal seam. J. Coal 42 (08), 1971–1978. doi:10.13225/j.cnki.jccs.2016.1859
Gao, M. Z., Zhang, J. G., Li, S. W., Wang, M., Wang, Y. W., and Cui, P. F. (2020). Calculating changes in fractal dimension of surface cracks to quantify how the dynamic loading rate affects rock failure in deep mining. J. Central South Univ. 27 (10), 3013–3024. doi:10.1007/s11771-020-4525-5
Guo, P. K., Cheng, Y. P., Lu, S. Q., and Zhang, R. (2013). Based on the fractal dimension of primary coal and tectonically deformed coal pore structure characteristics analysis. China coal. 39 (06), 73–77. doi:10.19880/j.cnki.ccm.2013.06.021
Guo, W., Zhao, G., Lou, G., and Wang, S. (2018). Height of fractured zone inside overlying strata under high-intensity mining in China. Int. J. Min. Sci. Technol. 29 (1), 45–49. doi:10.1016/j.ijmst.2018.11.012
Jiang, D., Wang, J. H., and Zheng, S. S. (1999). Fractal dimenstion of pore structure of porous medium-test, caculation and signeficence. Sci. Technol. Bull. (06), 453–456. doi:10.13774/j.cnki.kjtb.1999.06.010
Kirkpatrick, S. (1973). Percolation and conduction. Rev. Mod. Phys. 45 (4), 574–588. doi:10.1103/revmodphys.45.574
Li, D. P., Zhou, H. Wi, Xue, D. J., Yi, H. Y., and Gao, H. L. (2015b). Relationship between percolation and fractal properties of mining-induced fracture network in coal and rock masses. Geotechnics 36 (04), 1135–1140. doi:10.16285/j.rsm.2015.04.030
Li, W., Wu, H. F., Liu, H. F., Kang, Z. Q., Song, X. X., and Feng, Z. Z. (2014). Advanced characterization of three-dimensional pores in coals with different coal-body structure by micro-CT. J. Coal 39 (06), 1127–1132. doi:10.13225/j.cnki.jccs.2013.0920
Li, Z. W., Hao, Z. Y., Pang, Y., and Gao, Y. B. (2015a). Fractal dimensions of coal and their influence on methane adsorption. J. Coal 40 (04), 863–869. doi:10.13225/j.cnki.jccs.2014.3022
Ma, X. F., Zhang, S. C., and Lang, Z. X. (2004). Calculation of fractal dimension of pore structure by using subsection reqression method. J. Petroleum Univ. Nat. Sci. Ed. (06), 54–56+60.
Mao, L. T., Lian, X. Y., and Hao, L. N. (2014). The fractal calculation of 3D cracks based on digital volumetric images and its application. J. China Univ. Min. Technol. 43 (06), 1134–1139. doi:10.13247/j.cnki.jcumt.000249
Peng, R. D., Yang, Y. C., Ju, Y., Mao, L. T., and Yang, Y. M. (2011). Computation of fractal dimension of rock pores based on gray CT images. Sci. Bull. 56 (26), 3346–2266. doi:10.1007/s11434-011-4683-9
Ren, Z., and Wang, N. (2020). The overburden strata caving characteristics and height determination of water conducting fracture zone in fully mechanized caving mining of extra thick coal seam. Geotechnical Geol. Eng. An Int. J. 38 (3), 329–341. doi:10.1007/s10706-019-01019-4
Sakhno, I., Sakhno, S., Petrenko, S., Barkova, O., and Kobylianskyi, B. (2023). Numerical simulation of the surface subsidence evolution caused by the flooding of the longwall goaf during excavation of thin coal seams. IOP Conf. Ser. Earth Environ. Sci. 1254 (1), 012057. doi:10.1088/1755-1315/1254/1/012057
Stauffer, D. (1979). Scaling theory of percolation clusters. Phys. Rep. 54 (1), 1–74. doi:10.1016/0370-1573(79)90060-7
Wang, C., Jiang, C. F., and Chu, W. (2013). Fractal dimension of coals and analysis of its influencing factors. J. China Univ. Min. Technol. 42 (06), 1009–1014. doi:10.13247/j.cnki.jcumt.2013.06.020
Wang, Y. D., Xu, Y. F., and Xi, Y. (2015). Single rock particle crushing in uniaxial compression tests. J. Solid Mech. 36 (06), 517–523. doi:10.19636/j.cnki.cjsm42-1250/o3.2015.06.006
Wilkinson, D. J., and Willemsen, J. F. (1999). Invasion percolation:A new form of percolation theory. J. Phys. A General Phys. 16 (14), 3365–3376. doi:10.1088/0305-4470/16/14/028
Wu, G. S., Yu, W. J., Wang, P., Liu, Z., Liu, F. F., and Huang, Z. (2018). Deformation failure mechanism and experimental study of gas-bearing coal rock mass based on percolation mechanism. J. Coal 43 (03), 724–734. doi:10.13225/j.cnki.jccs.2017.0817
Xue, D. J., Zhang, Z. P., Zhou, H. W., Cao, Z. G., Wang, L. J., Wang, J. G., et al. (2022). Percolation model of stress redistribution under excavation. J. Rock Mech. Eng. 41 (02), 319–335. doi:10.13722/j.cnki.jrme.2020.1174
Xue, D. J., Zhou, H. W., Wang, C. S., and Gao, H. L. (2013). Percolation model of mining induced crack evolution of the overlying strata. J. China Univ. Min. Technol. 42 (06), 917–922+940. doi:10.13247/j.cnki.jcumt.2013.06.005
Zhang, K., Liu, X. H., Li, K., and Wu, W. Y. (2018). Investigation on the correlation between mechanical characteristics and facturing fractal dimension of rocks containing a hole and multi-flaws. J. Rock Mech. Eng. 37 (12), 2785–2794. doi:10.13722/j.cnki.jrme.2018.0894
Zhang, T., Xu, S. Y., and Yang, K. (2010). Application of fractal dimension to reservoir microporous structure. J. Daqing Petroleum Inst. 34 (03), 44–47+124.
Zhang, X. M., Tong, D. K., and Hu, A. M. (2008). Pressure transient analysis of coal seams based on the fractal dimensionof fractures. Nat. Gas. Geosci. (03), 433–436.
Keywords: deep mining, mining-induced fractures, fracture ratio, fractal geometry, percolation probability
Citation: Wang X, Zhang S, Pan R, Zhao Y, Jia Z, Tursinhali H, Ren X and Kuerban A (2025) Characterization of mining fracture network development in overlying rock layers of deep mining in ordos basin. Front. Earth Sci. 13:1461180. doi: 10.3389/feart.2025.1461180
Received: 13 August 2024; Accepted: 24 February 2025;
Published: 25 March 2025.
Edited by:
Manoj Khandelwal, Federation University Australia, AustraliaReviewed by:
Guangtan Cheng, Shandong Agricultural University, ChinaCopyright © 2025 Wang, Zhang, Pan, Zhao, Jia, Tursinhali, Ren and Kuerban. This is an open-access article distributed under the terms of the Creative Commons Attribution License (CC BY). The use, distribution or reproduction in other forums is permitted, provided the original author(s) and the copyright owner(s) are credited and that the original publication in this journal is cited, in accordance with accepted academic practice. No use, distribution or reproduction is permitted which does not comply with these terms.
*Correspondence: Ruanhang Pan, cHJoMDYwMUAxNjMuY29t; Yongqiang Zhao, MjAwMzk0MjlAY2VpYy5jb20=
†These authors have contributed equally to this work and share first authorship
Disclaimer: All claims expressed in this article are solely those of the authors and do not necessarily represent those of their affiliated organizations, or those of the publisher, the editors and the reviewers. Any product that may be evaluated in this article or claim that may be made by its manufacturer is not guaranteed or endorsed by the publisher.
Research integrity at Frontiers
Learn more about the work of our research integrity team to safeguard the quality of each article we publish.