
94% of researchers rate our articles as excellent or good
Learn more about the work of our research integrity team to safeguard the quality of each article we publish.
Find out more
ORIGINAL RESEARCH article
Front. Earth Sci., 13 March 2025
Sec. Geoscience and Society
Volume 13 - 2025 | https://doi.org/10.3389/feart.2025.1449816
This article is part of the Research TopicGross Ecosystem Product: Valuation of Nature’s Contribution to Human Well-BeingView all 6 articles
 Leshan Du1,2
 Haiyan Liu1Haiou Liu1Wenhui Liu1Ziyuan Li1
 Xiaoyan Liu1Junsheng Li3Zhanjun Quan1*
 Ying Zhang2*
The establishment of national parks is a critical measure for natural ecological protection in China, significantly contributing to biodiversity conservation and regional sustainable development. However, the analysis of temporal-spatial variations in ecosystem services within national parks, along with the factors influencing these variations, remains largely overlooked. This gap limits the effectiveness of ecological protection and refined management in these parks. Using Hainan Tropical Rainforest National Park (HTRNP) as a case study, this study integrates geospatial analysis ArcGIS with the InVEST model to evaluate the regulating ecosystem services (RESs) from 2000 to 2020 at 5-year intervals. The analysis examines the temporal evolution patterns and spatial distribution of RESs, utilizing LightGBM to identify the primary driving factors of these services. The findings reveal the following: (1) Temporally, the RESs exhibit significant fluctuations, with a trend of “initial decline followed by a subsequent rise”. Climate regulation services accounted for the highest proportion at 61.4%, followed by water conservation and soil retention. (2) Spatially, the RESs in the eastern and central regions are slightly higher than those in the western region, demonstrating consistency across different years. The RESs in HTRNP show a strong spatial clustering effect (Moran’s I > 0.5, Z > 2.58), with spatial hotspots (H-H) in the eastern and central regions, and spatial cold spots (L-L) in the western and northern regions. (3) In terms of driving factors, natural factors, including annual precipitation (PRE) and annual potential evapotranspiration (PET) alongside socio-economic factors such as land use and land cover (LULC) and the Human Footprint Index (HFI), make the highest marginal contributions to RESs. Specifically, RESs demonstrate the strongest correlation with LULC, a positive correlation with PRE, and negative correlations with PET and HFI. This study explores the dynamic changes and influencing factors of RESs, providing a scientific guideline for future ecological planning and effective management decisions within HTRNP.
In recent years, global ecological and environmental issues have become increasingly protruding, accompanied by frequent extreme weather events such as air pollution, desertification, and soil erosion. Ecosystem services, which are the benefits humans derive directly or indirectly from ecological processes (Costanza et al., 1997; Costanza et al., 2017), offer a crucial approach to addressing these challenges. Ecosystem Services include four service types, such as provisioning services, regulating services, cultural services, and supporting services (Arico et al., 2005). RESs, encompassing water conservation, soil retention, and climate regulation, among others, are considered the cornerstone of ecosystem services, playing a pivotal role in regional ecological protection and sustainable economic development.
There are differing opinions in the academic community regarding the evaluation of RESs. The concepts, models, and methods used to evaluate RESs vary based on different motivations. For instance, some evaluations are based on a national perspective, with the results supplementing the existing standard national economic system with concepts, such as the quaternary industry of ecological products (Wang et al., 2021; Ma et al., 2024). Other evaluations emphasize cost-benefit analyses (Francisco et al., 2024) or damage compensation assessments (Veklych et al., 2020) for specific projects to propose more reasonable policy recommendations or alternatives. Some evaluations aim to enhance awareness of the importance of ecosystems among governments, enterprises, or the public. Despite these differences, there is a general consensus that RESs should represent the ultimate benefits provided by ecosystems to humans, excluding intermediate process products like material cycling, energy flow, and information transfer. In terms of specific accounting methods, the evaluation methods for RESs are roughly divided into four paradigms: statistical surveys method, the equivalent factor method (Xie et al., 2008; Xie et al., 2015), emergy analysis (Xu et al., 2020; Nadalini et al., 2021), and model-based approaches (Villa et al., 2009; Sherrouse et al., 2022; Gao et al., 2024). Different scholars often select different evaluation models and baseline data, leading to significant discrepancies in the evaluation results of RESs. Therefore, results derived from different methods and evaluation models based on different ecosystem types are often not comparable. However, conducting temporal-spatial dynamic evolution analysis of RESs within the same region is highly significant for systematically understanding the status of the regional ecosystem (Haining et al., 2010; Ye and Wu, 2010). The Integrated Valuation of Ecosystem Services and Tradeoffs (InVEST) is particularly prominent to address these issues and is widely used by scholars, due to its simplicity, ease of data acquisition, flexible parameter adjustment, and spatially expressible evaluation results (Qiu et al., 2023; Yang et al., 2023).
Hainan Tropical Rainforest National Park (HTRNP) is one of the first five national parks in China. It boasts the most concentrated, best-preserved, and largest contiguous tropical rainforest area in the country, forming an integral part of the world’s tropical rainforests. HTRNP is also a critical area for tropical biodiversity conservation in China, serving as a global gene pool for germplasm resources and a biodiversity conservation hotspot (Myers et al., 2000; Francisco-Ortega et al., 2010). Most of the products provided by HTRNP are public goods. Due to their externality, these products require government investment, maintenance, operation, and support. Therefore, conducting an ecosystem service valuation for HTRNP is crucial. On one hand, such an assessment can better analyze the costs and benefits of relevant activities in HTRNP, elucidating the purpose and value of establishing the national park, and ultimately providing a reference for policy decisions. On the other hand, it can help monetize the “tangible” and “intangible” natural capital, thereby vividly demonstrating the immense value of ecosystem services and raising public awareness among governments, enterprises, and the public regarding the “value of natural resources” (Quintas-Soriano et al., 2019; Peng et al., 2023).
Previous studies on ecosystem services in HTRNP have addressed various aspects: Li et al. (2022) focused on the relationship between land use type and ecosystem services; Wu et al. (2023) examined ecosystem services and ecological compensation based on land utilization; Lin and Fu. (2023) explored the implications of ecosystem services on landscape pattern changes, and Zhong et al. (2023) investigated the effects of ecological restoration projects on ecosystem services. However, few studies have simultaneously focused on ecosystem services and their driving factors over a long time series, which may result in a lack of effective guidance for the management of HTRNP.
To explore the temporal-spatial variations of ecosystem services in national park, we selected HTRNP as a case study. Referring to the Millennium Ecosystem Assessment (MA) and the Gross Ecosystem Product (GEP) accounting system, we selected indicators with high academic recognition to represent RESs. These indicators include water conservation, soil retention, carbon sequestration, oxygen release, and climate regulation. The InVEST model was used to evaluate the biophysical quantity and monetary value of these services from 2000 to 2020 at 5-year intervals. This approach allows for a comprehensive understanding of the temporal-spatial variation patterns of RESs. Additionally, Global Moran’s Index and Local Indicators of Spatial Association (LISA) are employed to study the spatial differentiation patterns of RESs within the region. Furthermore, the Light Gradient Boosting Machine (LightGBM) was used to reveal the driving factors behind these services. This paper provided scientific evaluations of the dynamic changes and driving factors of RESs, providing important guideline for the spatial planning and effective management policies for HTRNP.
HTRNP is situated in the central part of Hainan Island, with geographical coordinates ranging from 108°44′32″E to 110°04′43″E and 18°33′16″N to 19°14′16″N. It spans across nine counties (cities): Wuzhishan, Qiongzhong, Baisha, Dongfang, Lingshui, Changjiang, Leong, Baoting and Wanning (website https://www.hntrnp.com). The total area of HTRNP is 4,268.54 km2, accounting for about 12.1% of Hainan Island’s total area and 25.4% of the land area of the nine counties and cities it encompasses (Supplementary Appendix Table S1). The highest elevation within HTRNP is recorded at Wuzhishan Mountain (1867 m asl), which represents the highest peak on Hainan Island. Conversely, the lowest elevation (45 m asl) is situated in the Duzong River basin within the Diaoluoshan Mountain of the national park (Figure 1). The national park enjoys abundant sunlight and favorable thermal conditions, with an annual average temperature ranging from 22.5°C to 26.0°C. It also receives significant rainfall, with an average annual precipitation of 1,759 mm, although the distribution of rainfall is uneven temporally and spatially, leading to distinct wet and dry seasons. The forest coverage rate across the park is 95.86%, with natural forests dominated by tropical rainforests accounting for approximately 76.56% of the area.
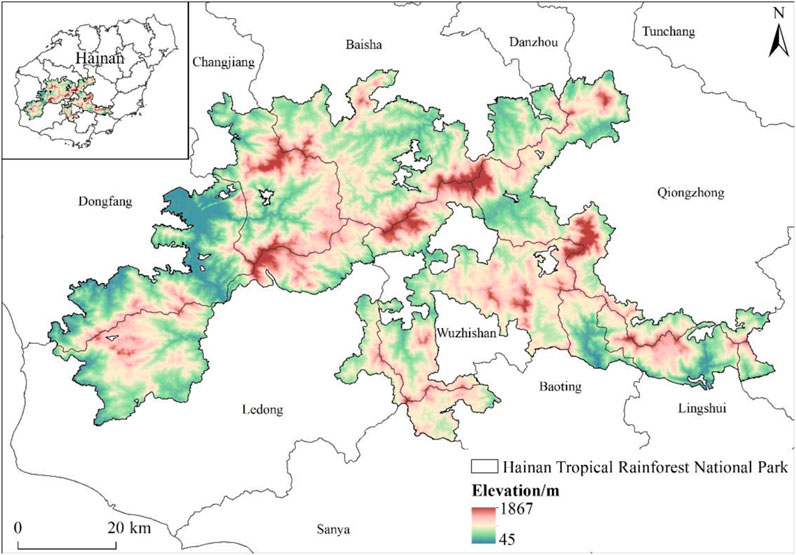
Figure 1. Location and DEM of the study area.
Referring to the MA, The Economics of Ecosystems and Biodiversity (TEEB), the GEP Accounting Technical Guidelines and other scholarly research, we selected five indicators with high academic recognition: water conservation, soil retention, carbon sequestration, oxygen release, and climate regulation. We conducted an ecosystem service valuation from both the biophysical quantity and monetary value perspectives. The biophysical quantity was primarily calculated using the InVEST model (Table 1; Supplementary Appendix Table S2). For the monetary value assessment, we employed the market value method as the basis, incorporating the shadow engineering method and the recovery cost method to estimate the value of each indicator (Table 1; Supplementary Appendix Table S2). Further biophysical quantities and monetary values accounting methods and models are provided in Supplementary Appendix Table S2. Finally, we adjusted the monetary values using local statistical bulletins and yearbooks to ensure that the results more accurately reflect the actual situation.
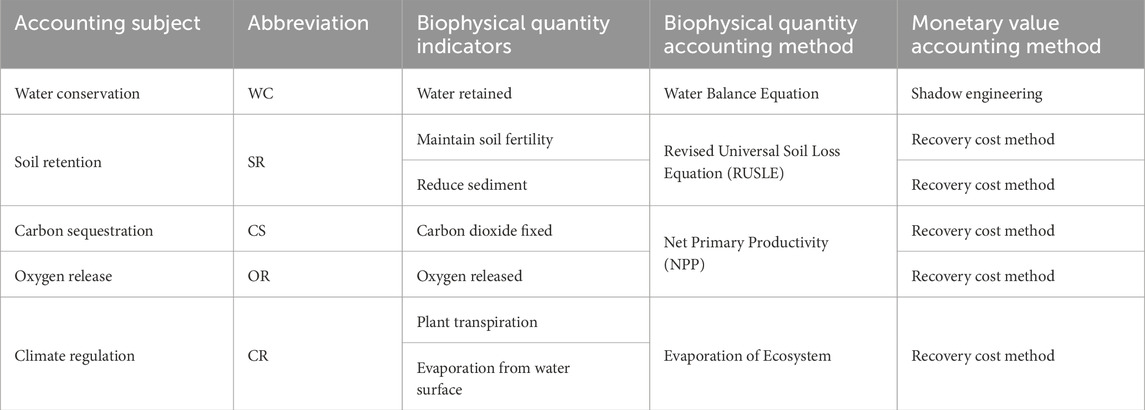
Table 1. Accounting framework for regulating ecosystem services in Hainan Tropical Rainforest National Park.
The Ecosystem Service Change Index (ESCI) was used to manifest the variations in RESs from 2000 to 2020 at 5-year intervals. The ESCI indicates the relative gains or losses of each ecosystem service (Kärkkäinen et al., 2020), thereby elucidating the temporal evolution patterns of these services. The calculation formula is as follows:
Here, ESCIx represents the change index of the value of a single regulating ecosystem service. ESCURx represents the value of the regulating ecosystem service in the final state, in CNY. ESHISx represents the value of the regulating ecosystem service in the initial state, in CNY.
Spatial autocorrelation analysis is a crucial method for examining the spatial clustering and interactions of geographic entities, which can be used to characterize the spatial homogeneity or heterogeneity (Ye and Wu, 2010). It is commonly represented by the Moran’s Index, which comprises both the Global Moran’s Index and the Local Moran’s Index (Dai et al., 2020; Yang et al., 2024). These indices reveal the correlation between the properties of global spatial units and the attribute values of neighboring local spatial units (Haining et al., 2010).
The Global Moran’s Index (Moran’s I) can reflect the overall spatial autocorrelation characteristics of the study area. The calculation formula is as follows:
Here, xi and xj represent the values of grid units i and j, respectively; n denotes the total number of samples in the study area;
The LISA can reflect the spatial differentiation patterns of regional RESs (Anselin, 1995). The calculation formula is as follows:
Here, Wij represents the spatial weight matrix between grid units i and j; Xi is the attribute value of grid unit i;
To further investigate the influencing factors of RESs value, 11 specific indicators were selected from two major categories: natural factors and socio-economic factors (Table 2). Firstly, natural factors, which form the foundation of ecosystem services, include meteorological factors such as PET and PRE, vegetation factors such as the Normalized Difference Vegetation Index (NDVI) and Net Primary Productivity (NPP), and soil and topographic factors including the Digital Elevation Model (DEM) and Soil Organic Matter (SOM). Secondly, socio-economic factors, which primarily influence ecosystem services by altering land use patterns, encompass LULC, population data such as population density (POP) and HFI, and economic data primarily including per capita Gross Domestic Product (GDP) and Nighttime Lighting Data (NL).
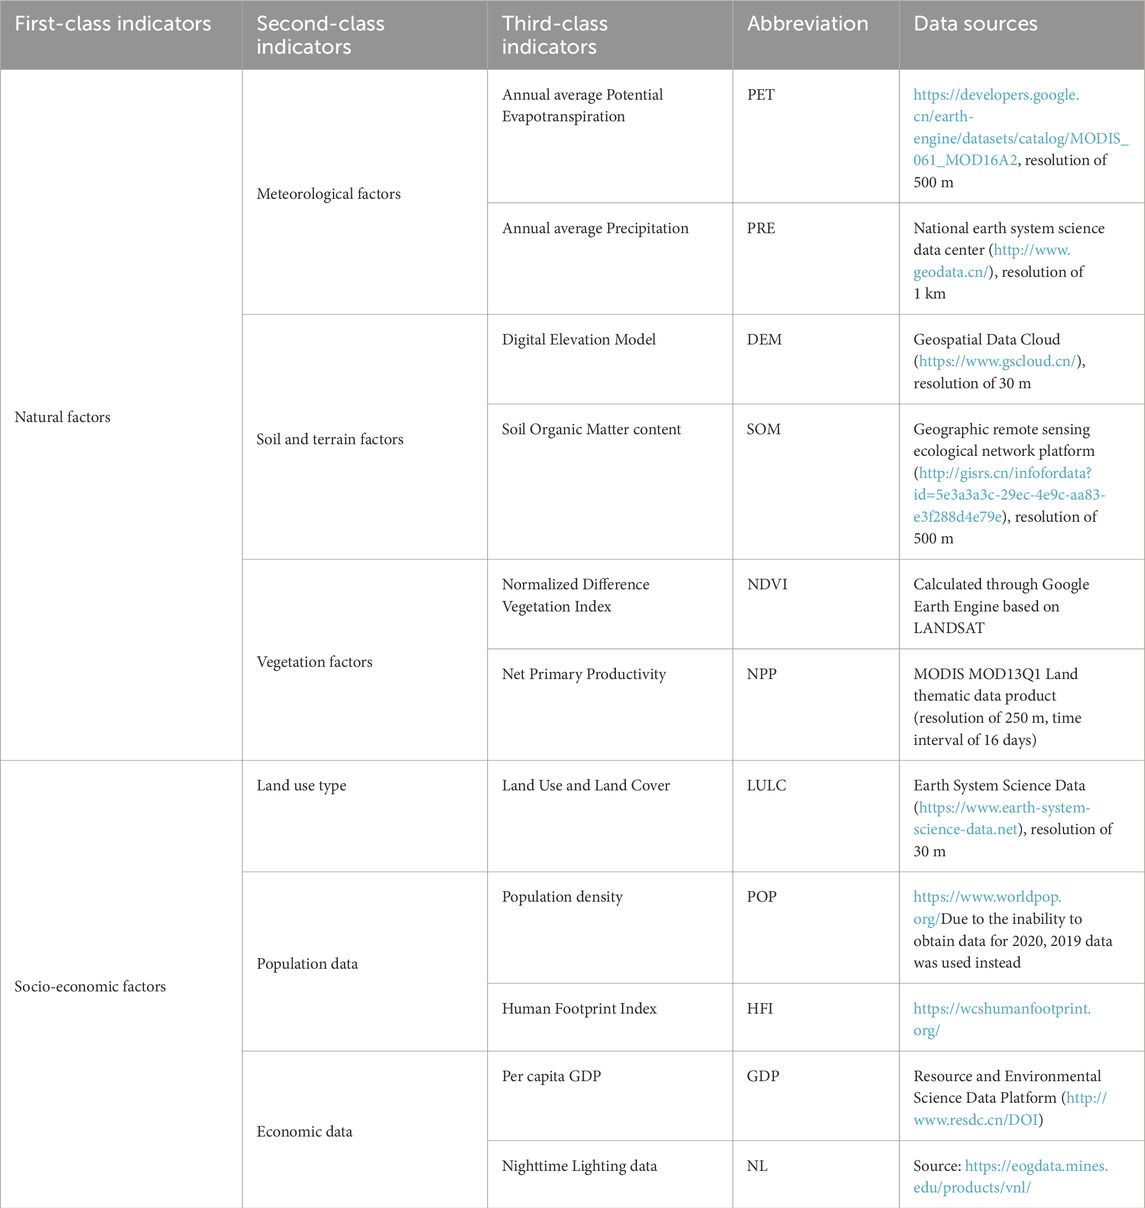
Table 2. The driving factors and data sources of regulating ecosystem services.
The spatial projection coordinates of the aforementioned raster data were standardized to the CGCS2000 national geodetic coordinate system. Using the Extract Values to Points under ArcGIS software, data of different resolutions were resampled to 30 m and aligned to the same grid. LULC data were converted into categorical variables, while other indices are normalized. Based on ArcGIS software, 6,122 sample points were generated annually from 2000 to 2020 at 5-year intervals. Using Python, the data was cleaned, removing null values, resulting in 25,610 samples used for constructing the decision tree. A stratified random sampling method with replacement was employed, dividing 80% of the samples into a training set and 20% into a testing set. LightGBM was utilized to analyze the contribution of various driving factors to the RESs in HTRNP. The results of the LightGBM model were graphically analyzed using the Shape package.
This study employed the InVEST model to evaluate the biophysical quantity of RESs in the HTRNP. The findings reveal that from 2000 to 2010, the water conservation capacity steadily declined, decreasing from 5.362 × 10⁹ m3 to 3.931 × 10⁹ m3, a reduction of 26.7%. However, from 2010 to 2020, the water conservation capacity gradually increased, rising from 3.931 × 10⁹ m3 to 4.338 × 10⁹ m3, an increase of 10.37%. The soil retention capacity showed a gradual decline from 2000 to 2020, decreasing from 1.77 × 10⁸ t to 1.37 × 10⁸ t, a reduction of 22.60%. Notably, from 2010 to 2020, the soil retention capacity exhibited a fluctuating increase, rising from 1.37 × 10⁸ t to 1.50 × 10⁸ t, an increase of 9.49%. Carbon sequestration and oxygen release peaked in 2015 at 2.6112 × 10⁶ t and 6.9906 × 10⁶ t, respectively, and they were at their lowest in 2005, at 2.332 × 10⁶ t and 6.2431 × 10⁶ t, respectively. The climate regulation services showed minimal fluctuation across different years (Figure 2).

Figure 2. Spatial distribution of Regulating Ecosystem Services in Hainan Tropical Rainforest National Park from 2000 to 2020.
By quantifying and summing the values of various regulation services, the total value of RESs from 2000 to 2020 is determined to be CNY221.84 billion, CNY206.626 billion, CNY202.837 billion, CNY207.204 billion, and CNY209.067 billion, respectively (Figure 3). The per unit area value of RESs ranges from CNY0.04751 billion/km2 to CNY0.05197 billion/km2. The overall value of RESs remains stable over the long term, exhibiting a slight trend of “initial decline followed by a subsequent rise.” In terms of the composition of RESs, climate regulation services had the highest value in 2020, accounting for 61.40%. Water conservation and soil retention services also had relatively high proportions, accounting for 20.21% and 15.74%, respectively. Carbon sequestration and oxygen release services had the lowest value, accounting for 2.84% (Figure 3).
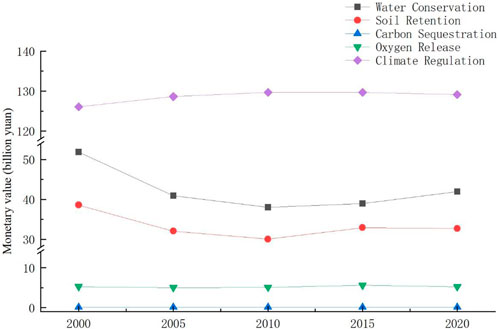
Figure 3. Changes of regulating ecosystem services in hainan tropical rainforest national park from 2000 to 2020.
Using ArcGIS software to spatially visualize the value of RESs in HTRNP, the results indicate a certain differentiation in spatial distribution patterns. The values of RESs in the eastern and central regions of HTRNP are slightly higher than those in the western regions. This pattern demonstrates good consistency across different years (Figure 4).
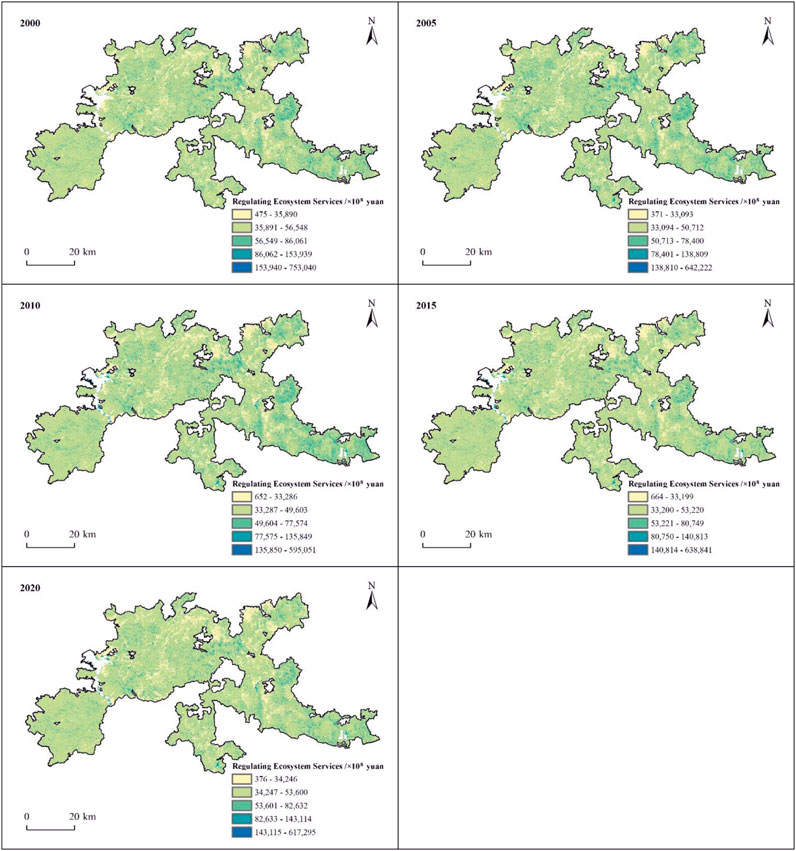
Figure 4. Distribution of regulating ecosystem services in hainan tropical rainforest national park from 2000 to 2020.
There may be spatial autocorrelation in RESs, and accurately measuring their spatial distribution patterns is of significant reference value for understanding regional spatial clustering characteristics. The spatial Moran’s Index is employed to analyze the spatial clustering characteristics of RESs in HTRNP. To balance spatial heterogeneity expression capability and computational workload, a 1 km × 1 km grid is selected as the spatial unit for the autocorrelation analysis of RESs. The results reveal that the Global Moran’s I index for RESs consistently exceeds 0.50 from 2000 to 2020, with Z-scores above 2.58, all passing the 0.001 significance test. This indicates that RESs exhibit strong positive spatial autocorrelation and clear spatial clustering characteristics. However, a decreasing trend was found in spatial autocorrelation in time scale, with Moran’s I decreasing from 0.6807 in 2000 to 0.5082 in 2020, suggesting that the clustering degree of RESs in HTRNP has been weakening over the past 20 years. Additionally, from 2000 to 2020, the spatial hotspots (H-H) generally exhibit a trend of “ initial decline followed by a subsequent rise”, while the spatial cold spots (L-L) remain relatively stable (Table 3).
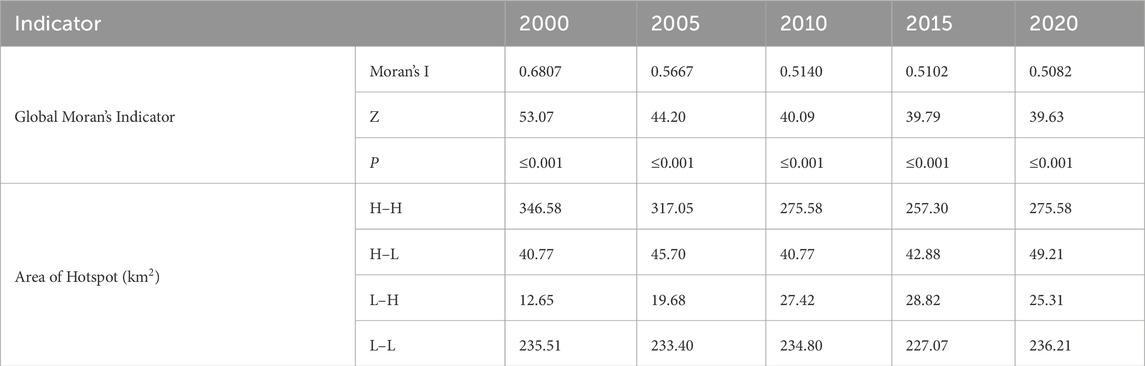
Table 3. Moran’s I and hotspot analysis of regulating services in HTRNP.
To further understand the local spatial clustering characteristics of RESs, a local autocorrelation analysis is conducted, and LISA maps are drawn for each year. The LISA maps clearly show spatial hotspots (H–H) in the eastern and central regions of HTRNP and spatial cold spots (L–L) in the western and northern regions, with consistent patterns across different years. The “H–H″ type is concentrated in the eastern and central regions of HTRNP, aligning with the high-value areas of the spatial distribution of RESs value. The “L–L″ type is primarily distributed in the western and northern regions of HTRNP. The “H–L″ and “L–H″ types are more scattered (Figure 5).
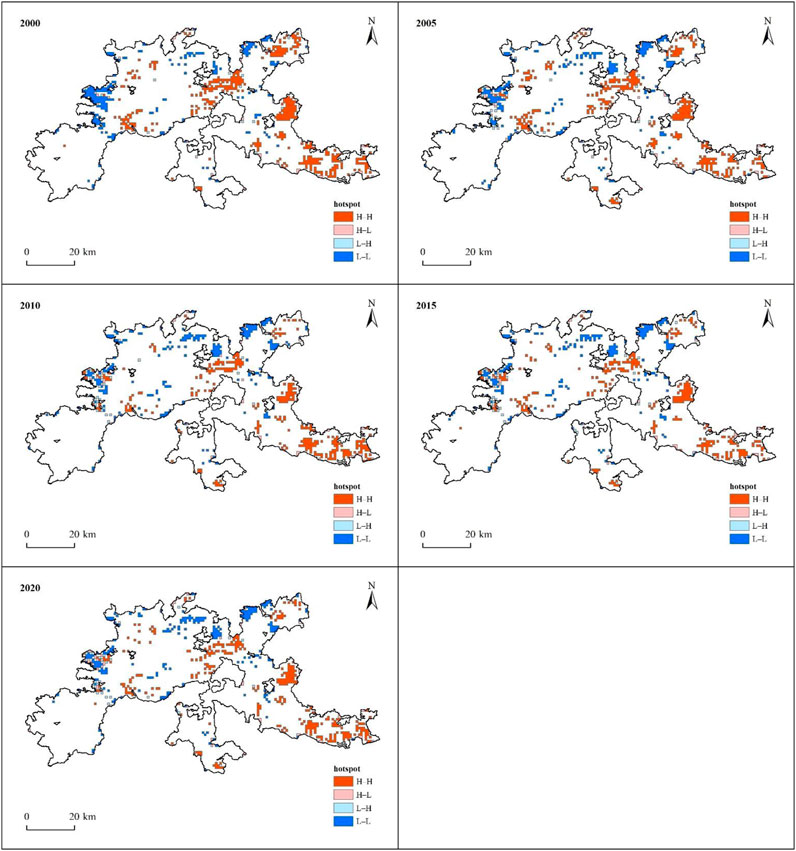
Figure 5. Distribution of Hotspot of regulating services in HTRNP from 2000 to 2020.
LightGBM model was used to conduct decision analysis on RESs from 2000 to 2020, and the results show that the explanatory power of various influencing factors on RESs reaches 68.3%. To further analyze the contribution of each driving factor to RESs, all sampling points are displayed using a hexbin plot. In this plot, SHAP values represent the weight of influence, and the size of each feature value is indicated by color. The wider the distribution area, the greater the impact of that factor. From the hexbin plot, LULC, PRE, and PET have the highest marginal contributions to RESs, making them the primary factors influencing RESs in HTRNP (Figure 6). Among natural factors, RESs show a significant positive correlation with PRE and a significant negative correlation with PET. Other factors in descending order of impact include DEM with a negative correlation, NDVI with a positive correlation, SOM with a positive correlation, and NPP with a positive correlation, though their overall influence on RESs in HTRNP is relatively smaller. Among socio-economic factors, LULC has a significant impact on RESs in HTRNP. The HFI has a substantial negative impact on RESs. Other factors in descending order of impact include POP, NL, and GDP, though their overall influence on RESs in HTRNP is relatively small.
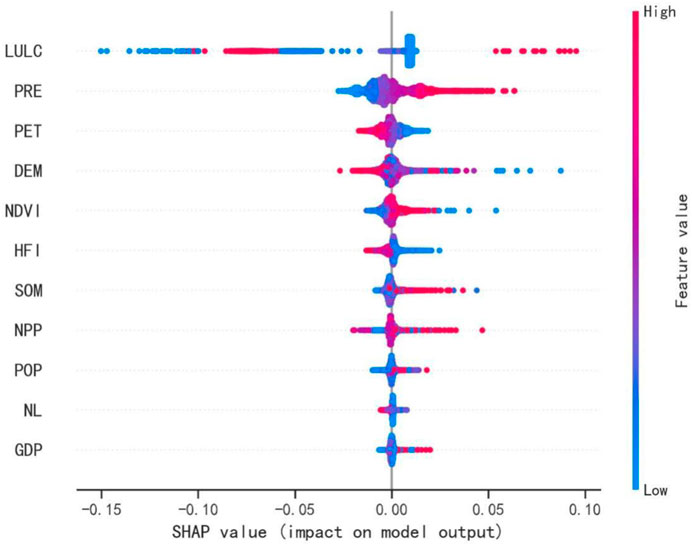
Figure 6. Shap plot of factors driving regulating ecosystem services in Hainan Tropical Rainforest National Park. Red for large values, blue for small values, and purple for values close to the mean.
This paper conducts the comprehensive analysis of temporal-spatial analysis from 2000 to 2020 in 5-year intervals of RESs in HTRNP. The results indicate that the value of RESs ranges from CNY202.837 billion to CNY221.84 billion, with the per unit area value of these services ranging from CNY0.04751 billion/km2 to CNY0.05197 billion/km2. These findings differ significantly from earlier studies (Xiao et al., 2000; Li et al., 2003) and deviated somewhat from a few recent studies (Li, 2022; Lin and Fu, 2023), but are similar to the majority of recent research findings (Supplementary Appendix Table S3). For instance, Chen et al. (2021) found that the total GEP of HTRNP in 2019 was CNY2,045.13 billion, with an average GEP per unit area of CNY0.046 billion/km2. Du et al. (2023) reported that the total GEP of HTRNP in 2015 was CNY226.34 billion, with an average GEP per unit area of CNY0.0514 billion/km2. The results of this study are also close to the official data published by Hainan Province. According to the Hainan Academy of Forestry, the total ecosystem production value of HTRNP in 2019 and 2020 was CNY204.513 billion and CNY205.143 billion, respectively (Chen et al., 2021).
Although the results of this study are similar to some existing researches, significant differences exist in specific indicators. For instance, in terms of soil retention, this study finds the soil retention value in HTRNP to be CNY32.711 billion, whereas previous studies, such as those by Chen et al. (2021) and Du et al. (2023), estimated it at CNY1.750 billion and CNY21.66 billion, respectively. These discrepancies arise from the diversity of evaluation methods, the subjectivity of parameter selection, and the multiplicity of data sources (Lin and Fu, 2023). HTRNP covers a vast area and spans a significant geographic range. The core areas of HTRNP are under strict protection, making access and sampling in most regions challenging. Consequently, obtaining localized parameters for the InVEST model is difficult. This study strives to select parameters based on related research in adjacent regions to align the research results with reality in a maximum way. However, using adjacent areas as references inevitably leads to some discrepancies between the research results and the actual conditions (Lin and Fu, 2023). Nevertheless, the framework and evaluation methods constructed in this study possess a certain degree of scientific and rational validity. The results derived using the same methods, models, and parameters are comparable over time and space, reflecting the ecological environment state and changes within HTRNP. These findings hold significant reference value for guiding the planning and management of national parks.
It is evident that different scholars, utilizing various models, methods, and parameters, produce significantly divergent evaluations of ecosystem service values. While the diversity of evaluation models and research methods for RESs is beneficial for advancing scientific research—allowing for the selection of different methods based on specific research objectives—there is a pressing need for further standardization from the perspective of refined management of the given regions. Clarifying research norms, ensuring the scientific soundness of methods, and maintaining consistency in model parameters are essential for conducting comparative analyses over temporal and spatial scales. This standardization will enhance understanding of the value and changing trends of ecosystem services within the national park. Additionally, it is recommended to establish regular monitoring and evaluation of the parameters required for RESs evaluation, thereby providing accurate data for assessing ecosystem service values, supporting ecological protection, and informing management decisions.
From a temporal perspective, the RESs of HTRNP from 2000 to 2020 exhibit a “initial decline followed by a subsequent rise” trend, which pattern aligns with the previous studies (Lin and Fu, 2023; Zhong et al., 2023). The decline in RESs from 2000 to 2010 can be attributed not only to climate change but also to the expansion of tropical economic forests, such as rubber plantations in Hainan Province during this period (Han et al., 2022; Li et al., 2022). Statistics indicate that the area of rubber plantations on Hainan Island increased from 357,000 ha in 1998 to 455,000 ha in 2008, an expansion of 27.45% (Yu et al., 2016). However, the area of natural forests had sharply reduced 72,000 ha during this period (Hou et al., 2018). Compared to natural forests, rubber plantations have simpler community structures, fewer plant species, and lower carbon storage density, resulting in significant declines in water conservation, soil retention, and carbon sequestration services (Yao et al., 2024). Post-2010, Hainan Province initiated large-scale ecosystem restoration and preservation projects, such as the “Green Hainan Island” initiative, leading to nearly 200,000 ha of afforestation and greening. In 2019, the Chinese government officially commenced the pilot construction of HTRNP, alongside ecological relocation and restoration efforts, leading to the augmentation in the capacity of RESs (Xu et al., 2020). So, the overarching increase in RESs of HTRNP from 2010 to 2020 can be largely attributed to implementation of government-led ecological protection initiatives that were initiated (Jiang et al., 2024).
From a spatial perspective, the RESs exhibit higher values in the eastern and central regions and lower values in the western region of HTRNP, which coincided with the previous results (Du et al., 2023; Yao et al., 2024). This pattern is closely related to meteorological factors and human activities in Hainan Province. Firstly, Hainan Island is situated on the northern edge of the tropical zone, characterized by a tropical monsoon and tropical maritime climate. Influenced by the southeastern monsoon coming from the Pacific and the obstruction of central mountainous regions such as Wuzhishan Mountain, Limu Ridge, and Bawang Ridge, the average annual precipitation gradually decreases from east to west (Han et al., 2022). The eastern region receives an average annual precipitation of up to 2,400 mm, whereas the western region, such as Dongfang and Changjiang, receives only about 1,000 mm (Yao et al., 2024). Secondly, the eastern and central parts of HTRNP such as Qiongzhong County, Baoting County, and Wuzhishan City, are the main distribution areas of natural forests, which have high forest cover and a more complete multi-layer structures consisting of trees, shrubs, grasses, and vines, and provide better ecosystem services generally (Chen et al., 2019; Ma et al., 2021). This forest structure effectively reduces the kinetic energy of rainfall, while the well-developed root systems help stabilize the soil and intercept surface sediments, thereby significantly reducing rainwater runoff and soil erosion (Wen et al., 2017; Zhao and Pan, 2022). Additionally, the central high-altitude areas have a high proportion of natural forests with diverse and vigorous vegetation, leading to higher soil organic carbon content (He et al., 2022) and greater plant carbon sequestration capacity compared to other tree species (Alamgir et al., 2016; Liu et al., 2019). Thirdly, the western region of HTRNP is close to industrial areas with relatively fewer natural forests and extensive coverage of artificial vegetation such as rubber and eucalyptus plantations. This results in weaker water infiltration capacity and increased surface runoff (Deng et al., 2019). Furthermore, the evaporation rate in this region far exceeds its precipitation (with an average annual precipitation of about 1,000 mm and an average annual evaporation rate of 2,000–2,500 mm), which adversely affects the effective performance of RESs(Han et al., 2022; Li et al., 2022). These findings are corroborated by the local spatial autocorrelation analysis, which shows spatial hotspots (H-H) in the eastern and central regions of HTRNP and spatial cold spots (L-L) in the northern and western regions.
In summary, the RESs of HTRNP demonstrate temporal and spatial heterogeneity, underscoring the need for comprehensive protection and tailored management strategies. HTRNP, serving as an ecological highland and a critical ecological security barrier for Hainan Province, is aptly termed the “green lung”, “water tower”, and “natural oxygen bar” of Hainan Island. Future conservation and management endeavors should prioritize integrated planning and holistic protection, facilitating the integrity, authenticity, and diversity of tropical rainforests (Chen et al., 2023; Yang et al., 2023). Furthermore, implementing differentiated management measures across various time periods and regions is essential to enhance the provision of high-quality ecological products and fortify the ecological security barrier of Hainan Island.
Understanding the driving factors behind the RESs is paramount for crafting effective ecological management policies and strategies (Jiang et al., 2024). By comprehensively considering the interactions between the natural and socio-economic factors, policymakers can develop targeted interventions to promote sustainable practices and bolster ecosystem service provision. Previous studies have shown that natural drivers tend to increase the RESs within the region, while the socio-economic drivers perform the opposite effect (Linders et al., 2020; Sun et al., 2023). This conclusion has been partially validated in our study.
Natural factors, encompassing meteorological factors (temperature, PRE, PET, etc.), vegetation factors (NDVI, NPP, etc.), and soil factors (soil depth, SOM, etc.), provide the material basis for ecosystem services. In this paper, RESs show a significant positive correlation with PRE and a significant negative correlation with PET in HTRNP. Because PET affects the growth rate of plants as well as community distribution (Daniela et al., 2019), while PRE influences soil retention functions and the hydrological cycle, making both factors the most significant factors affecting ecosystem services (Tang et al., 2018; Xiao and Ouyang, 2019). Other factors in descending order of impact include DEM with a negative correlation, NDVI with a positive correlation, SOM with a positive correlation, and NPP with a positive correlation, though their overall influence on RESs in HTRNP is relatively smaller. For instance, DEM affects the vertical distribution of vegetation; higher DEM means thinner soil depth and lower soil organ matter, thereby inhibiting carbon sequestration and soil retention services (Li and Zhang, 2021). Soil depth and SOM primarily influence plant growth, which in turn affects RESs as well.
Socio-economic factors, including LULC, POP, and economic aspects, significantly alter the production capacity of ecosystem services. LULC is considered as one of the most important influencing factors for RESs (Xu et al., 2020), which is consistent with our result of driving factors. Shifts in land use types, such as from farmlands and forests to building lands, disrupt existing ecosystem structures and functions (Stephen et al., 2011), posing significant challenges to ecosystem stability (Hashem et al., 2019) and causing notable shifts in ecosystem service functions (Rahman and Szabó, 2021; Wu and Wang, 2024). Other factors in descending order of impact include HFI, POP, NL, and GDP, which could reflect intensive land development, environmental pollution, and human activities, thereby either promoting or inhibiting RESs (Ma et al., 2022). Although the overall influence of these factors on RESs is relatively small, they play a pivotal role in the effectiveness of management, due to lower cost and higher effectiveness compared with natural factors.
This study delved into the influence of anthropogenic-natural drivers on RESs across various spatial and temporal scales. The result revealed that PRE and PET among natural factors, and LULC and the HFI among socio-economic factors, serve as the primary drivers of RESs. These findings align with previous geographical detection analyses on the driving factors of RESs in Hainan Island (Han et al., 2022), and similar conclusions have been drawn in other regions such as Taihu Lake (Gu et al., 2018) and the Sanjiangyuan region (Lv et al., 2020) in China. However, given the complex interplay of factors influencing the spatial distribution and temporal evolution of RESs, further explorations need to be conducted. Firstly, driving factors can be any natural or anthropogenic element that plays a pivotal role in shaping the behavior, distribution, or dynamics of a particular ecosystem or environmental process (Xue et al., 2024), such as climate change, policy frameworks, conservation plans, value systems and others. Furthermore, many driving factors of ecosystem service changes are interlinked (Liu et al., 2023). These factors and their interactions warrant further exploration in future research. Secondly, the accuracy of basic data determines the reliability of the results. So it is recommended to leverage advanced technologies such as big data, the Internet of Things (IoT), and artificial intelligence (AI) to accurately obtain the further data on RESs in the context of climate change. Finally, the human activity also performed significant impacts on the temporal-spatial variations of RESs in HTRNP. So, stereoscopic remote sensing monitoring system based on multilevel platform collaboration, including space-based satellite, space-based remote sensing, aerial drones, mobile patrol monitoring vehicles and ground observation (Gao, 2022; Gao et al., 2023), should be effectively utilized to comprehensively manage and monitor human activities in HTRNP.
This paper evaluated five RESs (i.e., water conservation, soil retention, carbon sequestration, oxygen release, climate regulation) of HTRNP in 2000, 2005, 2010, 2015, and 2020 using the ArcGIS and InVEST models. The ESCI was employed to characterize the temporal-spatial variations of RESs, while the LightGBM model was utilized to investigate the driving mechanisms of RESs. The key conclusions can be summarized as follows: (1) Temporal Dimension: From 2000 to 2020, the RESs of HTRNP exhibited significant fluctuations, showing a trend of “initial decline followed by a subsequent rise”. Climate regulation services constituted the highest proportion at 61.4%, while water conservation and soil retention services accounted for 20.21% and 15.74%, respectively. Carbon sequestration and oxygen release services represented the lowest proportion at 2.84%. (2) Spatial Dimension: The RESs in the eastern and central regions were slightly higher than those in the western region, maintaining consistency across different years. The RESs in HTRNP displayed strong spatial clustering effects (Moran’s I > 0.5, Z > 2.58), with spatial hotspots (H–H) in the eastern and central regions and spatial cold spots (L–L) in the western and northern regions, consistent with the overall spatial distribution of RESs. (3) Driving Factors: Natural factors (PRE and PET) and socio-economic factors (LULC and HFI) had the highest marginal contributions to RESs. Among these, LULC had the greatest impact on RESs, with RESs positively correlated with PRE and negatively correlated with PET and HFI.
The original contributions presented in the study are included in the article/Supplementary Material, further inquiries can be directed to the corresponding authors.
LD: Investigation, Methodology, Software, Writing–original draft, Writing–review and editing, Conceptualization. HyL: Investigation, Methodology, Writing–original draft. HoL: Investigation, Writing–original draft. WL: Investigation, Writing–original draft. ZL: Investigation, Writing–original draft. XL: Software, Writing–original draft. JL: Writing–review and editing, Methodology. ZQ: Supervision, Writing–review and editing, Conceptualization, Methodology. YZ: Supervision, Writing–review and editing, Conceptualization, Methodology.
The author(s) declare that financial support was received for the research, authorship, and/or publication of this article. This work was supported by GEF-Building Sustainability into PA Reforms to Conserve Globally Significant Biodiversity in China (ID: 9461), the National Natural Science Foundation of China (No. 72173011).
The authors declare that the research was conducted in the absence of any commercial or financial relationships that could be construed as a potential conflict of interest.
All claims expressed in this article are solely those of the authors and do not necessarily represent those of their affiliated organizations, or those of the publisher, the editors and the reviewers. Any product that may be evaluated in this article, or claim that may be made by its manufacturer, is not guaranteed or endorsed by the publisher.
The Supplementary Material for this article can be found online at: https://www.frontiersin.org/articles/10.3389/feart.2025.1449816/full#supplementary-material
Alamgir, M., Turton, S. M., Macgregor, C. J., and Pert, P. L. (2016). Ecosystem services capacity across heterogeneous forest types: understanding the interactions and suggesting pathways for sustaining multiple ecosystem services. Sci. Total Environ. 566-567, 584–595. doi:10.1016/j.scitotenv.2016.05.107
Anselin, L. (1995). Local indicators of spatial association—LISA. Geogr. Anal. 27, 93–115. doi:10.1111/j.1538-4632.1995.tb00338.x
Arico, S., Reid, W. V., Mooney, H. A., Cropper, A., Capistrano, D., Carpenter, S. R., et al. (2005). Millennium ecosystem assessment. Ecosystems and human well-being: synthesis. Washington: Island Press.
Chen, W., Chi, G., and Li, J. (2019). The spatial association of ecosystem services with land use and land cover change at the county level in China, 1995–2015. Sci. Total Environ. 669, 459–470. doi:10.1016/j.scitotenv.2019.03.139
Chen, W. X., Zhao, H. B., Li, J. F., Zhu, L. J., Wang, Z. Y., and Zeng, J. (2020). Land use transitions and the associated impacts on ecosystem services in the Middle Reaches of the Yangtze River Economic Belt in China based on the geo-informatic Tupu method. Sci. Total Environ. 701 (20), 134690–13469013. doi:10.1016/j.scitotenv.2019.134690
Chen, Z. L., Lin, J. Y., and Huang, J. L. (2023). Linking ecosystem service flow to water-related ecological security pattern: a methodological approach applied to a coastal province of China. J. Environ. Manag. 345, 118725. doi:10.1016/j.jenvman.2023.118725
Chen, Z. Z., Lei, J. R., Wu, T. T., Chen, D. X., Zhou, Z., Li, W. L., et al. (2021). Gross ecosystem product accounting of national park: taking hainan tropical rainforest national park as an example. Chin. J. Appl. Ecol. 32 (11), 3883–3892. doi:10.13287/j.1001-9332.202111.010
Costanza, R., de-Groot, R., Braat, L., Kubiszewski, I., Fioramonti, L., Sutton, P., et al. (2017). Twenty years of ecosystem services: how far have we come and how far do we still need to go? Ecosyst. Serv. 28, 1–16. doi:10.1016/j.ecoser.2017.09.008
Costanza, R., Groot, R. D., Farberk, S., Belt, M. V. D., Grasso, M., Hannon, B., et al. (1997). The value of the world's ecosystem services and natural capital. Nature 387 (15), 253–260. doi:10.1038/387253a0
Dai, X., Wang, L., Huang, C., Fang, L., Wang, S., and Wang, L. (2020). Spatio-temporal variations of ecosystem services in the urban agglomerations in the middle reaches of the Yangtze River, China. Ecol. Indic. 115, 106394. doi:10.1016/j.ecolind.2020.106394
Daniela, B., de-Rogier, J., Michael, S., Reinhard, F., Hein, L., Kienast, F., et al. (2019). Ecosystem service change caused by climatological and non-climatological drivers: a Swiss case study. Ecol. Appl. a Publ. Ecol. Soc. Am. 29 (4), e01901. doi:10.1002/eap.1901
Deng, L., Kim, D. G., Li, M. Y., Huang, C. B., Liu, Q. Y., Cheng, M., et al. (2019). Land-use changes driven by ‘Grain for Green’ program reduced carbon loss induced by soil erosion on the Loess Plateau of China. Glob. Planet. Change 177, 101–115. doi:10.1016/j.gloplacha.2019.03.017
Du, A., Shen, Y. Q., Xiao, Y., and Ouyang, Z. Y. (2023). Research on accounting of ecological products value in National Parks. Acta Ecol. Sin. 43 (1), 208–218. doi:10.5846/stxb202112163575
Du, L. S., Liu, H. O., Liu, W. H., Wang, H. R., Zhang, Y., and Quan, Z. J. (2023). Spatial and temporal variation of water conservation and driving factor analysis in tropical rainforests: a case study of Hainan Tropical Rainforest National Park. Res. Environ. Sci. 36 (9), 1716–1727.
Francisco, A., Victor, M.-G., Emanuele, B., Heikki, L., Blasi, E., Lehtonen, H., et al. (2024). Cost benefit analysis of diversified farming systems across Europe: incorporating non-market benefits of ecosystem services. Sci. Total Environ. 912, 169272. doi:10.1016/j.scitotenv.2023.169272
Francisco-Ortega, J., Wang, Z. S., Wang, F. G., Xing, F. W., Liu, H., Xu, H., et al. (2010). Seed plant endemism on hainan Island: a framework for conservation actions. Botanical Rev. 76 (3), 346–376. doi:10.1007/s12229-010-9055-7
Gao, J. X. (2022). The construction and application of remote sensing monitoring system based on multilevel platform for ecosystem. Environ. Prot. 50 (22), 13–19.
Gao, J. X., Zhang, L. J., Chao, K., Ma, P. F., Feng, H. Y., Niu, R. F., et al. (2023). Stereoscopic remote sensing monitoring system based on multilevel platform collaboration and methods.
Gao, X., Xiao, F., Liu, Q., Xu, Y., and Yu, C. (2024). Evolution of ecosystem services under the impact of urbanization using the InVEST model in the xiongan new area, China. Environ. Res. Commun. 6 (3), 035021. doi:10.1088/2515-7620/ad3268
Gu, J. Y., Li, Y. P., and Du, W. (2018). Evaluation on water source conservation capacity and analysis of its variation characteristics of Taihu Lake Basin based on InVEST model. Water Resour. Prot. 34 (3), 62–67+84.
Haining, R., Wise, S., and Ma, J. (2010). Exploratory spatial data analysis. J. R. Stat. Soc. 47 (3), 457–469. doi:10.1111/1467-9884.00147
Han, N., Yu, M., and Jia, P. (2022). Multi-scenario landscape ecological risk simulation for sustainable development goals: a case study on the central mountainous area of Hainan Island. Int. J. Environ. Res. Public Health 19 (7), 4030. doi:10.3390/ijerph19074030
Han, N. L., Liu, Z. R., Jia, P. H., and Zhang, W. X. (2022). Spatio-temporal changes and geographic detection of water conservation on Hainan Island from 1996 to 2020. Buletin Soil Water Conservation 42 (5), 193–201.
Hashem, D., Parviz, A., and Mahdis, M. (2019). Land use change, urbanization, and change in landscape pattern in a metropolitan area. Sci. Total Environ. 655, 707–719. doi:10.1016/j.scitotenv.2018.11.267
He, X. X., Sheng, M. Y., Wang, L. J., Zhang, S. L., and Luo, N. N. (2022). Effects on soil organic carbon accumulation and mineralization of long-term vegetation restoration in Southwest China karst. Ecol. Indic. 145, 109622. doi:10.1016/j.ecolind.2022.109622
Hou, P., Hai, J., Cao, W., Yang, M., Cai, M. Y., and Li, J. (2018). Evaluation on ecosystem changes and protection of the national key ecological function zones in mountainous areas of central Hainan Island. Acta Geogr. Sin. 73 (3), 429–441.
Jiang, H., Qin, M., Wu, X., Luo, D., Ouyang, H., and Liu, Y. (2024). Spatiotemporal evolution and driving factors of ecosystem service bundle based on multi-scenario simulation in Beibu Gulf urban agglomeration, China. China Environ. Monit. Assess. 196 (6), 542. doi:10.1007/s10661-024-12663-6
Kärkkäinen, L., Haakana, H., Hirvelä, H., Reetta, L., and Tuula, P. (2020). Assessing the impacts of land-use zoning decisions on the supply of forest ecosystem services. Forests 11 (9), 931. doi:10.3390/f11090931
Li, J. Y., and Zhang, C. (2021). Exploring the relationship between key ecosystem services and socioecological drivers in alpine basins: a case of Issyk-Kul Basin in Central Asia. Glob. Ecol. Conservation 29, e01729. doi:10.1016/j.gecco.2021.e01729
Li, L. M. (2022). Analysis of landscape pattern and spatio-temporal change for ecosystem service value in Hainan Tropical Rain Forest National Park. Hainan University.
Li, L. M., Tang, H. N., Lei, J. R., and Song, X. Q. (2022). Spatial autocorrelation in land use type and ecosystem service value in Hainan Tropical Rain Forest National Park. Ecol. Indic. 137, 108727. doi:10.1016/j.ecolind.2022.108727
Li, Y. D., Chen, B. F., Zhou, G. Y., Zeng, Q. B., Wu, Z. M., and Luo, T. S. (2003). The values for ecological service function of tropical natural forest in Hainan Island‚China. For. Res. (02), 146–152.
Lin, X., and Fu, H. (2023). Optimization of tropical rainforest ecosystem management: implications from the responses of ecosystem service values to landscape pattern changes in Hainan Tropical Rainforest National Park, China, over the past 40 years. Front. For. Glob. Change 6, 1242068. doi:10.3389/ffgc.2023.1242068
Linders, T. E. W., Bekele, K., Schaffner, U., Allan, E., Alamirew, T., Choge, S. K., et al. (2020). The impact of invasive species on social-ecological systems: relating supply and use of selected provisioning ecosystem services. Ecosyst. Serv. 41, 101055. doi:10.1016/j.ecoser.2019.101055
Liu, L., Zheng, L., Wang, Y., Liu, C., Zhang, B., and Bi, Y. (2023). Land use and ecosystem services evolution in Danjiangkou Reservoir Area, China: implications for sustainable management of national projects. Land 12, 788. doi:10.3390/land12040788
Liu, S. J., Li, W. G., Chen, X. M., and Tong, J. H. (2019). Study on the spatial-temporal variation characteristics of vegetation net primary productivity in Hainan province. Ecol. Sci. 38 (5), 52–57.
Lv, L. T., Ren, T. T., Sun, C. Z., Zheng, D. F., and Wang, H. (2020). Spatial and temporal changes of water supply and water conservation function in Sanjiangyuan National Park from 1980 to 2016. Acta Ecol. Sin. 40 (3), 993–1003. doi:10.5846/stxb201808241804
Ma, G. X., Sun, Y. Z., Wang, K., and Yu, F. (2024). Evolutionary logic and characteristics analysis about the Quaternary Industry of Ecological products. Environ. Prot. 52 (Z1), 26–30.
Ma, S., Qiao, Y. P., Wang, L. J., and Zhang, J. C. (2021). Terrain gradient variations in ecosystem services of different vegetation types in mountainous regions: vegetation resource conservation and sustainable development. For. Ecol. Manag. 482 (1), 118856. doi:10.1016/j.foreco.2020.118856
Ma, W. B., Yang, F., Wang, N., Zhao, L. J., Tan, K., Zhang, X. F., et al. (2022). Study on spatial-temporal evolution and driving factors of ecosystem service value in the Yangtze River Delta Urban Agglomerations. J. Ecol. Rural Environ. 38 (11), 1365–1376.
Myers, N., Mittermeier, R. A., Mittermeier, C. G., Fonseca, G. A. B., and Kent, J. (2000). Biodiversity hotspots for conservation priorities. Nature 403 (6772), 853–858. doi:10.1038/35002501
Nadalini, A. C. V., Kalid, R. d. A., and Torres, E. A. (2021). Emergy as a tool to evaluate ecosystem services: a systematic review of the literature. Sustainability 13 (13), 7102. doi:10.3390/su13137102
Peng, J., Xia, P., Liu, Y. X., Xu, Z. H., Zheng, H. N., Lan, T. H., et al. (2023). Ecosystem services research: from golden era to next crossing. Trans. Earth, Environ. Sustain. 1 (1), 9–19. doi:10.1177/2754124x231165935
Qiu, H. H., Zhang, J. Y., Han, H. R., Cheng, X. Q., and Kang, F. F. (2023). Study on the impact of vegetation change on ecosystem services in the Loess Plateau, China. Ecol. Indic. 154, 110812. doi:10.1016/j.ecolind.2023.110812
Quintas-Soriano, C., Garcia-Llorente, M., Norstrom, A., Meacham, M., Peterson, G., and Castro, A. J. (2019). Integrating supply and demand in ecosystem service bundles characterization across Mediterranean transformed landscapes. Landsc. Ecol. 34, 1619–1633. doi:10.1007/s10980-019-00826-7
Rahman, M. M., and Szabó, G. (2021). Impact of land use and land cover changes on urban ecosystem service value in Dhaka, Bangladesh. Land 10 (8), 793. doi:10.3390/land10080793
Sherrouse, B. C., Semmens, D. J., and Ancona, Z. H. (2022). Social values for ecosystem services (SolVES): open-source spatial modeling of cultural services. Environ. Model. Softw. 148, 105259. doi:10.1016/j.envsoft.2021.105259
Stephen, P., Erik, N., Derric, P., and Kris, A. J. (2011). The impact of land-use change on ecosystem services, biodiversity and returns to landowners: a case study in the State of Minnesota. Environ. Resour. Econ. 48 (2), 219–242. doi:10.1007/s10640-010-9407-0
Sun, L., Yu, H. J., Sun, M. X., and Wang, Y. T. (2023). Coupled impacts of climate and land use changes on regional ecosystem services. J. Environ. Manag. 326, 116753. doi:10.1016/j.jenvman.2022.116753
Tang, X., Zhao, X., Bai, Y. F., Tang, Z. R., Wang, W. T., Zhao, Y. C., et al. (2018). Carbon pools in China's terrestrial ecosystems: new estimates based on an intensive field survey. Proc. Natl. Acad. Sci. U. S. A. 115 (16), 4021–4026. doi:10.1073/pnas.1700291115
Veklych, O., Karintseva, O., Yevdokymov, A., and Saorin, E. G. (2020). Compensation mechanism for damage from ecosystem services deterioration: constitutive characteristic. Int. J. Glob. Environ. Issues 19 (1-2-3), 129–142. doi:10.1504/ijgenvi.2020.114869
Villa, F., Ceroni, M., Bagstad, K., Johnson, G., and Krivov, S. (2009). “ARIES (ARtificial Intelligence for Ecosystem Services): a new tool for ecosystem services assessment, planning, and valuation,” in Proceedings of the 11th annual BIOECON conference on economic instruments to enhance the conservation and sustainable use of biodiversity. Venice, Italy, September 21-22, 2009.
Wang, J. N., Ma, G. X., Wang, Z. K., Wang, X. H., Yu, F., Liu, G. H., et al. (2021). Development and application of indicator system about the quaternary industry of ecological products in China. China Popul. Resour. Environ. 31 (10), 1–8.
Wen, Z., Zhao, H., Liu, L., Ouyang, Z. Y., Zheng, H., Mi, H. X., et al. (2017). Effects of land use changes on soil water conservation in Hainan Island, China. Chin. J. Appl. Ecol. 28 (12), 4025–4033. doi:10.13287/j.1001-9332.201712.017
Wu, C., and Wang, Z. (2024). Multi-scenario simulation and evaluation of the impacts of land use change on ecosystem service values in the Chishui River Basin of Guizhou Province, China. Ecol. Indic. 163, 112078. doi:10.1016/j.ecolind.2024.112078
Xiao, H., Ouyang, Z. Y., Zhao, J. Z., and Wang, X. K. (2000). Forest ecosystem services and their ecological valuation A case study of tropical forest in Jianfengling of Hainan Island. Chin. J. Appl. Ecol. 11 (04), 481–484.
Xiao, Y., and Ouyang, Z. Y. (2019). Spatial-temporal patterns and driving forces of water retention service in China. Chin. Geogr. Sci. 29 (01), 100–111. doi:10.1007/s11769-018-0984-0
Xie, G. D., Zhang, C. X., Zhang, L. M., Chen, W. H., and Li, S. M. (2015). Improvement of the evaluation method for ecosystem service value based on per unit area. Jounal Nat. Resourse 30, 1243–1254.
Xie, G. D., Zhen, L., Lu, C. X., Xiao, Y., and Chen, C. (2008). Expert knowledge based valuation method of ecosysten services in China. Jounal Nat. Resourse 23, 911–919.
Xu, J. Y., Chen, J. X., Liu, Y. X., Fan, F. F., and Wei, J. Y. (2020). Spatio-temporal differentiation of interaction of ecosystem services and regional responses in the “Belt and Road” area. Acta Ecol. Sin. 40 (10), 3258–3270. doi:10.5846/stxb201903270588
Xu, Z., Wei, H., Dong, X., Liu, Y., and Xue, H. (2020). Evaluating the ecological benefits of plantations in arid areas from the perspective of ecosystem service supply and demand-based on emergy analysis. Sci. Total Environ. 705, 135853. doi:10.1016/j.scitotenv.2019.135853
Xue, S., Yao, L., Xu, Y., and Li, C. (2024). Spatio-temporal dynamics and driving factors of ecosystem services in the Yellow River Delta, China. Sustainability 16 (8), 3466. doi:10.3390/su16083466
Yang, H., Zhou, H., Deng, S., Zhou, X., and Nie, S. (2024). Spatiotemporal variation of ecosystem services value and its response to land use change in the Yangtze River Basin, China. Int. J. Environ. Res. 18 (2), 17. doi:10.1007/s41742-024-00569-7
Yang, J., Li, J., Fu, G., Liu, B., Pan, L., Hao, H., et al. (2023). Spatial and temporal patterns of ecosystem services and trade-offs/synergies in Wujiang River Basin, China. Remote Sens. 15 (16), 4099. doi:10.3390/rs15164099
Yang, J., Zhai, D., Fang, Z., Alatalo, J. M., Yao, Z. L., Yang, W., et al. (2023). Changes in and driving forces of ecosystem services in tropical southwestern China. Ecol. Indic. 149, 110180. doi:10.1016/j.ecolind.2023.110180
Yao, X., Zhou, L., Wu, T., Yang, X., and Ren, M. (2024). Ecosystem services in national park of hainan tropical rainforest of China: spatiotemporal dynamics and conservation implications. J. Nat. Conservation 80, 126649. doi:10.1016/j.jnc.2024.126649
Ye, X., and Wu, L. (2010). Analyzing the dynamics of homicide patterns in Chicago: ESDA and spatial panel approaches. Appl. Geogr. 31 (2), 800–807. doi:10.1016/j.apgeog.2010.08.006
Yi, H., Güneralp, B., Kreuter, U. P., Güneralp, i., and Filippi, A. M. (2018). Spatial and temporal changes in biodiversity and ecosystem services in the San Antonio River Basin, Texas, from 1984 to 2010. Sci. Total Environ. 619, 1259–1271. doi:10.1016/j.scitotenv.2017.10.302
Yu, B. W., Rao, E. M., Yao, X. L., Shi, J. K., Zhang, C. P., Xu, W. H., et al. (2016). Evaluating the effectiveness of nature reserves in soil conservation on Hainan Island. Acta Ecol. Sin. 36 (12), 3694–3702.
Zhao, T., and Pan, J. (2022). Ecosystem service trade-offs and spatial non-stationary responses to influencing factors in the Loess hilly-gully region: lanzhou City, China. Sci. Total Environ. 846, 157422. doi:10.1016/j.scitotenv.2022.157422
Zhong, J. H., Cui, L. L., Deng, Z. Y., Zhang, Y., Lin, J., Guo, G., et al. (2023). Long-term effects of ecological restoration projects on ecosystem services and their spatial interactions: a case study of Hainan Tropical Forest Park in China. Environ. Manag. 73 (3), 493–508. doi:10.1007/s00267-023-01892-z
Keywords: Hainan Tropical Rainforest National Park, regulating ecosystem services(RESs), value assessment, temporal-spatial variation, driving factors
Citation: Du L, Liu H, Liu H, Liu W, Li Z, Liu X, Li J, Quan Z and Zhang Y (2025) Temporal-spatial variation of regulating ecosystem services and analysis of driving factors in Hainan Tropical Rainforest National Park, China. Front. Earth Sci. 13:1449816. doi: 10.3389/feart.2025.1449816
Received: 16 June 2024; Accepted: 17 February 2025;
Published: 13 March 2025.
Edited by:
Guoxia Ma, Chinese Academy for Environmental Planning, ChinaReviewed by:
Shengqiang Zhai, Peking University, ChinaCopyright © 2025 Du, Liu, Liu, Liu, Li, Liu, Li, Quan and Zhang. This is an open-access article distributed under the terms of the Creative Commons Attribution License (CC BY). The use, distribution or reproduction in other forums is permitted, provided the original author(s) and the copyright owner(s) are credited and that the original publication in this journal is cited, in accordance with accepted academic practice. No use, distribution or reproduction is permitted which does not comply with these terms.
*Correspondence: Zhanjun Quan, cXVhbnpqQGNyYWVzLm9yZy5jbg==; Ying Zhang, emhhbmd5aW5AYmpmdS5lZHUuY24=
Disclaimer: All claims expressed in this article are solely those of the authors and do not necessarily represent those of their affiliated organizations, or those of the publisher, the editors and the reviewers. Any product that may be evaluated in this article or claim that may be made by its manufacturer is not guaranteed or endorsed by the publisher.
Research integrity at Frontiers
Learn more about the work of our research integrity team to safeguard the quality of each article we publish.