 Xiaofeng He1Yongfeng Gong1*
 Jinkai Yan2*Shichang Gao1Zheng He1Gang Zhang1Guorui Wang1Zhiyong Hu1Hui Wang1
- 1Ningxia Hui Autonomous Region Land and Resources Survey and Monitoring Institute, Ningxia, China
- 2Chinese Academy of Geological Sciences, Beijing, China
Debris flow is a significant geological hazard in the mountainous regions of China, characterized by its sudden onset, high mobility, and considerable destructive potential. In the Helan Mountains, debris flows primarily consist of coarse-grained materials transported by water flows, exhibiting both high destructive potential and a broad impact range. Therefore, understanding the dynamics of debris flows in this region is of crucial importance. This study focuses on the Zhengguangou debris flow, utilizing the DAN-3D software based on Smoothed Particle Hydrodynamics (SPH) to construct a dynamic debris flow model. The movement characteristics of the debris flow were investigated by simulating various operating conditions, including differences in formation area conditions and rainfall intensity. The simulation results indicate that under extreme conditions (with a pore pressure coefficient of 0.8), the debris flow with the same initial volume traveled an average distance of 1503 m, significantly farther than the 1323 m travelled under normal conditions (with a pore pressure coefficient of 0.3). Under normal conditions, the final average deposition thickness of the debris flow was 8.9 m, which was thicker than the 8.3 m observed under extreme conditions. Regarding movement speed, the debris flow initially accelerated and then decelerated, with the extreme condition resulting in a greater travel distance compared to the normal condition. Additionally, the debris flow exhibited greater erosion depth and volume under normal conditions. In contrast, under extreme conditions, the debris flow had a larger scraping width, with the maximum width occurring at the point where the flow direction changed. This study enhances our understanding of the dynamic characteristics of debris flows in northern Ningxia and provides valuable insights for hazard prediction and mitigation efforts in the region.
1 Introduction
Debris flows, as highly destructive natural phenomena, seriously threaten human life and infrastructure. These disasters are influenced by climate, geography, and topography and are characterised by their sudden onset, rapid movement, and substantial economic damage (Sun, 2016; Wang et al., 2024). In recent years, with the increased frequency of extreme weather events and seismic activity, debris flow disasters, manifesting in forms such as burial, destruction, impact, and damming of rivers, have severely affected human lives, property, and the ecological environment (Kang et al., 2004; Jakob and Hungr, 2005; Zhang et al., 2023). Studying the dynamic processes of debris flows is critical for early warning and prevention strategies (Bracken et al., 2015; Zhou et al., 2019).
The primary methods for studying the dynamic processes of debris flows include physical flume experiments and numerical simulations (Bai and Dongri, 2021; Gan and Luo, 2020; Wang et al., 2021). With the advancement of computer software technology, numerical simulations have become the leading approach for investigating debris flow dynamics. Various numerical algorithms have been applied based on different physical processes, spatial-temporal scales, and accuracy requirements, including finite element methods (FEM), finite volume methods (FVM), and finite difference methods (FDM), as well as particle-based approaches such as Smoothed Particle Hydrodynamics (SPH) (Crosta et al., 2009; Hu et al., 2012; 2020; Hou et al., 2021; Minatti and Pasculli, 2011; Qiao et al., 2016). Compared to grid-based methods, particle-based algorithms are less reliant on structured grids. They can efficiently handle interfaces between different materials due to the need for grid connectivity between particles. As a result, SPH has been widely applied in debris flow simulations (Xing et al., 2023; Zhao et al., 2023; Yang et al., 2024; Gao et al., 2019; Gao et al., 2023).
The Helan Mountain area in northern Ningxia is rich in mineral resources and has been a significant ore concentration area in China. Mining activities in the area have triggered numerous geological hazards, including landslides and debris flows, making it one of the critical regions for geological disaster prevention in Ningxia. Given the high destructive power and widespread impact of debris flows in the Helan Mountain area (Zhong et al., 2018), there is an urgent need to understand the dynamic characteristics of debris flows in this region to support disaster prevention and mitigation efforts. This study focuses on the Zhengguangou debris flow, using the DAN-3D software (Hungr, 2009) based on the SPH method to develop a dynamic model and simulate debris flow behaviour under different conditions, providing a valuable tool for early warning and risk management.
2 Study area geology
The Zhengguangou debris flow is located 800 m north of the Da Wu Kou Martyrs’ Cemetery in Shizuishan City, approximately 5 km from the city centre. It is situated at longitude 106°22′22″E and latitude 39°03′05″N. The area is part of the erosion and denudation landscape of the Helan Mountains, with a watershed scale of 3.43 km2. The highest elevation in the region reaches 1,681 m, while the lowest point is around 1,145 m, resulting in a vertical drop of 536 m. The area has a well-developed drainage system, with the main channel extending about 4,490 m long and an average slope of 129‰. The sediment supply section accounts for approximately 50% of the total length, and the debris stored near the front of the gorge is estimated to be about 200,000 cubic meters. The climate is semi-arid, with sparse rainfall, primarily concentrated in short, intense storms that are the main triggering factor for debris flows.
The Zhengguangou area exposes a diverse stratigraphic sequence consisting of the Carboniferous-Permian Taiyuan Formation and the Permian Shanxi Formation, which contain coal-bearing clastic rocks. The primary lithology comprises light grey to yellowish-grey quartz sandstone interbedded with greyish-black shale and coal seams, along with Permian Shihezi Formation fluvial clastic. The latter predominantly comprises grey-yellow to yellow-green sandstones and purple-red sandstones interlayered with mudstones. The Archean Helan Mountain complex mixed granite is visible at the valley’s entrance, with some areas showing evidence of collapse. Additionally, the region lies on the eastern limb of the Rujigou-Malianwan anticline. The cross-valley fault is a reverse fault developed at the valley’s entrance. The hanging wall of the fault consists of the Archean Helan Mountain complex, while the footwall comprises the Carboniferous-Permian Taiyuan, Shanxi, and Shihezi formations.
Based on the characteristics of the basin, Zhengguangou can be classified as a typical high-mountain canyon-type debris flow area, which can be divided into three main sections: the formation zone, the transport zone, and the deposition zone (Figure 1). The formation zone is located at elevations ranging from 1773 to 1,315 m. Numerous tributaries characterise it with a dendritic to feathery drainage pattern. The valley is narrow, with a V-shaped morphology. The valley floor width ranges from 5 to 30 m, with a longitudinal slope of 250%–300%. The slopes of the primary and tributary valleys are generally steep, often exceeding 30°, with little surface cover. The bedrock is highly fragmented and intensely weathered, creating a debris-covered surface. Under extreme conditions, such as heavy rainfall or seismic events, large-scale landslides and slope failures are prone to occur, providing abundant material for debris flow generation.
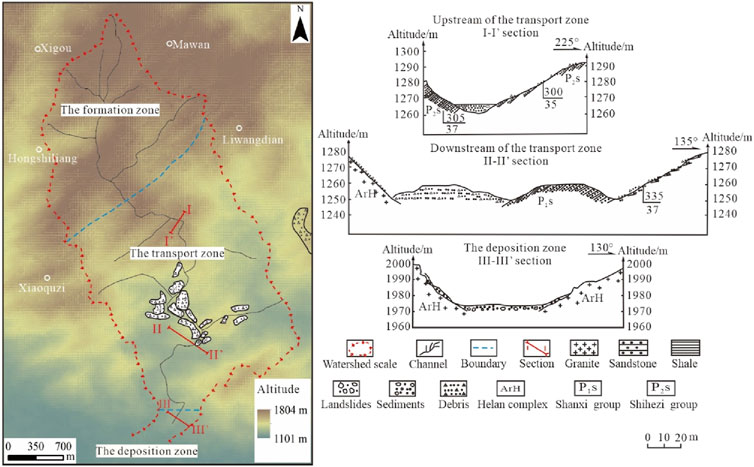
Figure 1. Overview map of the study area.
The transport zone is located between 1,315 m and 1,176 m, representing the primary path of debris flow movement. In this section, the valley shape transitions from a V-shape to a U-shape, with the valley floor widening to 20–40 m and the slope of the valley walls decreasing to about 100%–200%. Intense scouring and erosion on both sides of the valley floor during debris flow events result in localised, small-scale collapses. In the downstream section of the channel, large quantities of loose gravel, primarily shale with some sandstone fragments, accumulated due to coal mining activities. These materials accumulate significantly within the channel and become the primary solid debris flow material source.
The deposition zone lies downstream of the valley. Due to the relatively gentle terrain with a longitudinal slope of less than 80%, debris flow material spreads in a fan-shaped pattern upon exiting the mountain. Approximately 60% of the fan-shaped area is well-preserved, with a length of around 300 m, a width of about 200 m, and a diffusion angle of 60°. The deposition varies by ±0.2 m during each flow event. The deposited debris is predominantly gravel, with poor sorting and rounding, and the gravel size decreases with depth.
3 Numerical simulation
The study employs the DAN-3D numerical simulation software based on the continuum theory and treats moving materials as fluid-like substances with flow characteristics. By adjusting various flow property parameters, the software calculates the velocity, duration, travel distance, and accumulated characteristics of the moving body (Cheon et al., 2020; Hungr and Mcdougall, 2009).
3.1 Model principle
The SPH method has recently been widely applied for simulating flow phenomena. This method uses particles rather than traditional grid structures to model the flow. Each particle contains essential physical parameters such as mass and velocity, and the interactions between particles form a system that represents the fluid’s continuous state. The forces and reactions of the entire system can be derived by tracking the movement of individual particles and calculating their dynamic changes (Zhang et al., 2022).
The flow body unit depth in the DAN-3D software is calculated using interpolation sums (Equations 1, 2).
Equation for fluid thickness and gradient:
In the equation, V represents the volume of each particle, W is the kernel function, and i and j are the particle indices. The straight-line distance between particles i and j is given by (Equation 3):
The equations for the X and Y components are as follows (Equations 4, 5):
According to Monaghan (1992), the current model uses the Gaussian interpolation kernel (Equation 6):
N represents the total number of particles in the equation, and B is the smoothing coefficient.
3.2 Boundary conditions
3.2.1 Mechanical boundary conditions
During the analysis of debris flow accumulation, the weight, slope pressure, and shear resistance of the flowing material must be considered to calculate its kinetic energy. Since the surface of the sliding body is unconstrained, it is only affected by atmospheric pressure. Along the movement path, the primary everyday stress on the base of the sliding body arises from the interaction between atmospheric pressure and the surface topography, generating varying magnitudes of forces. The shear stress on the base can be determined using various shear flow models. However, numerous factors influence shear stress, such as pore water pressure, viscosity, velocity, and turbulence, all of which directly or indirectly affect the base shear resistance of the sliding body, thereby impacting the sliding distance and the extent of the covered area. The expression for the force equation is as follows (Equations 8, 9):
m is the mass of the sliding body, a is the acceleration of the sliding body, Px and Py are the lateral earth pressures in the x and y directions, respectively; τ is the shear resistance during the sliding body’s movement, σ is positive stress, ru is the pore water pressure coefficient, φ is the angle of internal friction.
3.2.2 Motion boundary conditions
The DAN software employs mathematical methods to consider the scraping and erosion boundary conditions of the sliding body. If scraping effects are minimal, these conditions can be disregarded. The scraping effects and volume changes during the debris flow movement are calculated based on time and erosion rate, as shown in the following (Equations 10, 11):
b is the erosion depth, ℎ is the thickness of the sliding body, vx and vy are the movement velocities in the x and y directions, respectively; t is the movement time, Et is the scraping rate.
3.3 Model and parameters
3.3.1 Debris flow model
In the study of debris flow disaster patterns, a data grid file was created based on the elevation model (Figure 2). For this research, the Zhengguangou debris flow formation zone was divided into three different operational conditions, which represent the initiation of material sources from the main channel, the tributary, and both channels simultaneously. Six movement and accumulation processes were analysed. Condition I had an initial volume of 1.98 × 10⁶ m3, with a formation area of approximately 0.4 km2, a scarp elevation of about 1,450 m, and a rear elevation of approximately 1,650 m, with a height difference of 200 m. Condition II had an initial volume of 7.86×10⁵ m3, with a formation area of roughly 0.14 km2, a scarp elevation of 1,420 m, and a rear elevation of about 1,600 m, with a height difference of 180 m. Condition III was an extreme condition where Condition I and Condition II co-occurred, with an initial volume of 2.77 × 10⁶ m3 and a formation area of about 0.54 km2 (Table 1). Each condition was classified into typical and extreme conditions based on local rainfall (Table 2).
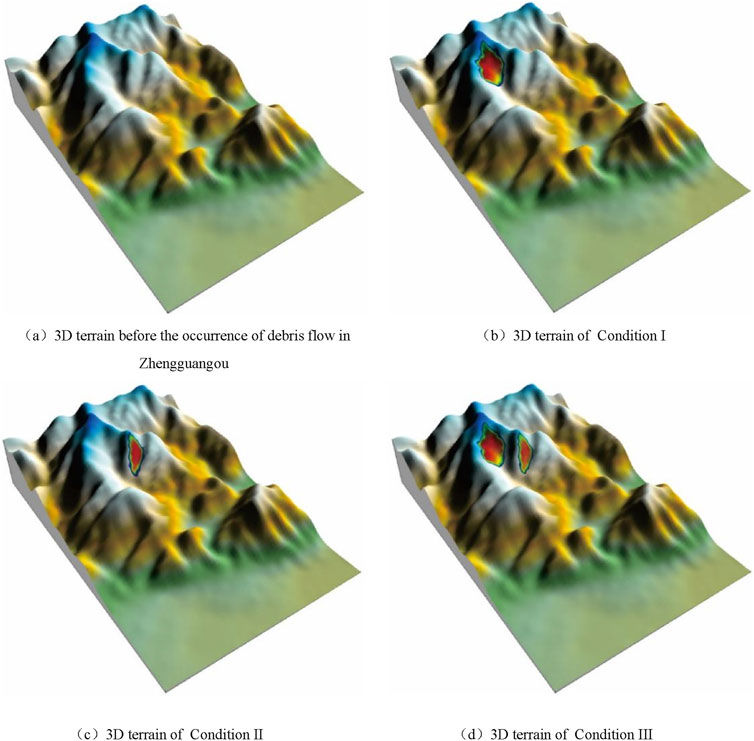
Figure 2. Three-dimensional digital elevation model of the study area. (A) 3D terrain before the occurrence of debris flow in Zhengguangou. (B) 3D terrain of Condition (I) (C) 3D terrain of Condition II. (D) 3D terrain of Condition III.
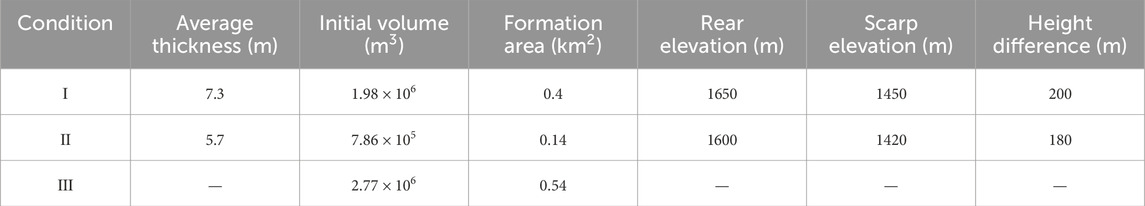
Table 1. Model calculation parameter table.
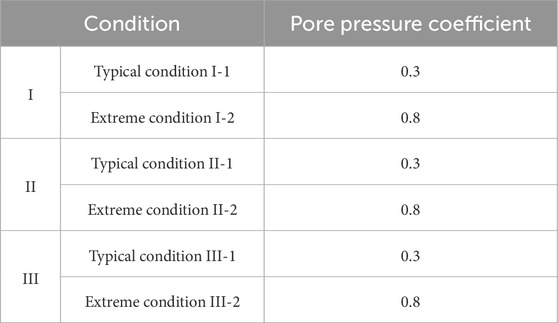
Table 2. Calculation of working conditions of Zhengguangou debris flow.
3.3.2 Base resistance model
Due to the unique nature of debris flows, they often exhibit diverse forms during movement. When performing numerical modelling with DAN-3D, various basic shear models can be selected to capture and replicate the behavioural characteristics of the debris flow. The choice of an appropriate movement model is closely related to the debris flow’s state changes, trajectory, and the involvement of water. The optimal model type can be determined through experimental research. Commonly used models include the friction, Vowelly, and Binghamton models (Qiao et al., 2016; Sosio et al., 2008). In this study, the debris flow formation zone was characterised by solid shear and significant liquefaction, and the friction model was selected. The transport and deposition zones used the Voellmy model.
3.3.3 Model parameters
The numerical simulation parameters include those governing the SPH method and those describing the materials involved in the sliding process. Parameters for the SPH method include the number of particles (N), particle smoothing degree (B), velocity smoothing coefficient (C), and stiffness (D). For the analysis of debris flow movement in Zhengguangou, the selected control parameters are shown in Table 3.

Table 3. Simulation control parameters of Zhengguangou debris flow.
Experimental testing determined the model’s parameters, such as the sliding material’s density, internal friction angle, cohesion, and dynamic friction angle. Empirical methods determined other parameters (Gao et al., 2013; Yang et al., 2016). The selected parameters for this study are shown in Table 4, the values were determined analytically by trial and error method (Hungr, 2009; He et al., 2023; He et al., 2024).
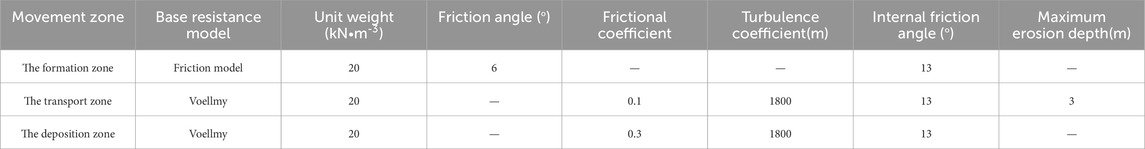
Table 4. Calculation parameters of Zhengguangou debris flow model.
4 Results and discussion
4.1 Analysis of movement and accumulation in Condition I
Based on the model analysis, contour maps of debris flow accumulation were obtained for different stages of the movement process (Figure 3). The total movement time was 150 s, and the red contour lines represent the debris flow accumulation range. The simulation results for Condition I-1 showed that a material volume of 1.98 × 10⁶ m3 was initiated at an elevation of approximately 1,450 m, flowing along the slope. The flow moved southeast for about 1,000 m, then changed direction and moved southwest for about 500 m before stopping. During the movement, the maximum accumulation thickness reached approximately 24 m at 80 s; at 150 s, the final average accumulation thickness was 9.7 m.
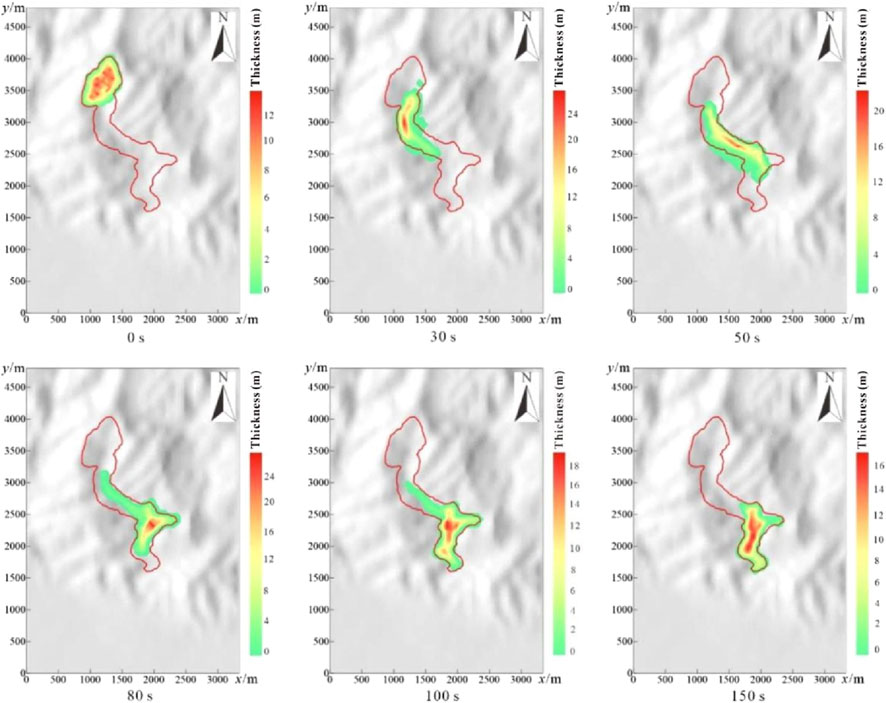
Figure 3. Contour map of motion accumulation of I-1.
The simulation results for Condition I-2 indicated that the same initial material volume started at an elevation of 1,450 m, flowing along the slope southeast for about 1,000 m, then changing direction to the southwest for approximately 550 m before stopping. The maximum accumulation thickness occurred at 30 s, reaching about 22 m; at 150 s, the final average accumulation thickness was 9.4 m (Figure 4).
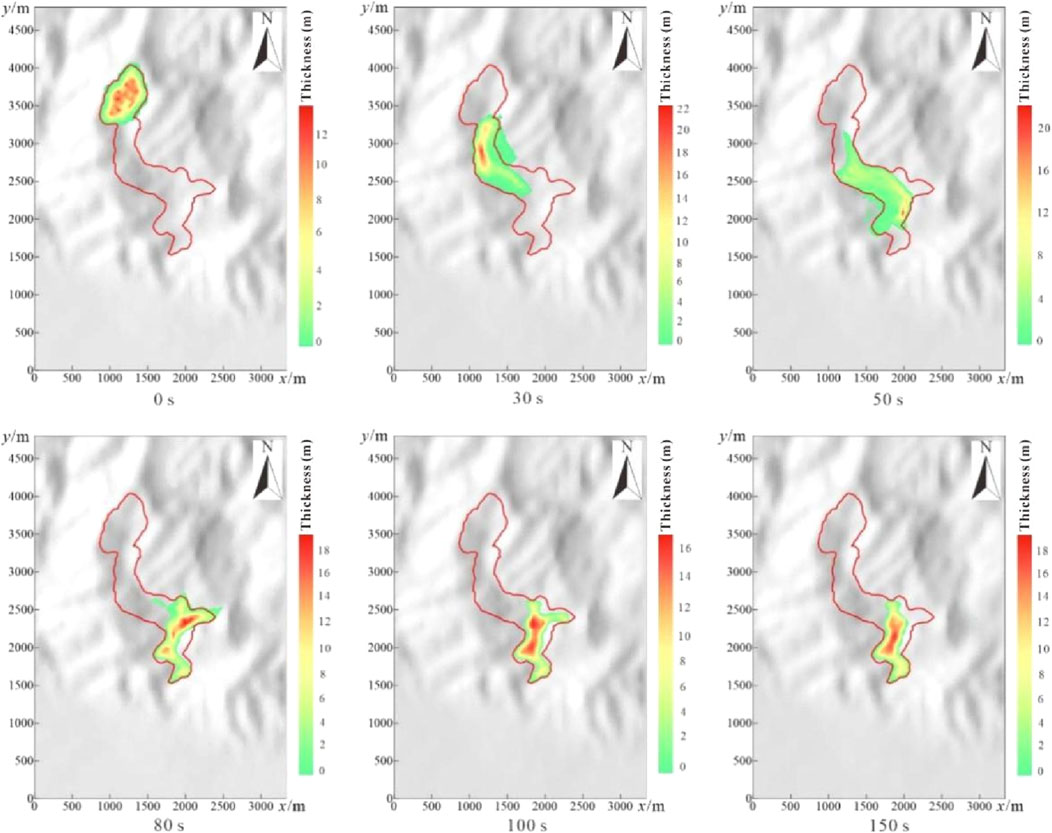
Figure 4. Contour map of motion accumulation of I-2.
4.2 Analysis of movement and accumulation in Condition II
Under Condition II-1, a material volume of 7.86 × 10⁵ m3 was initiated at an elevation of approximately 1,420 m, flowing along the channel. The flow moved southwest for about 400 m, then changed direction by 90° and moved southeast for 500 m before changing direction again and moving southwest for approximately 500 m, stopping after 150 s. The final average accumulation thickness was 5.9 m (Figure 5). In Condition II-2, the material volume of 7.86 × 10⁵ m3 was initiated at 1,420 m, following the same path as in Condition II-1. The flow moved southwest for 400 m, turned 90° and moved southeast for 500 m, and then turned again and moved southwest for about 560 m before stopping. At 150 s, the final average accumulation thickness was 5.1 m (Figure 6).
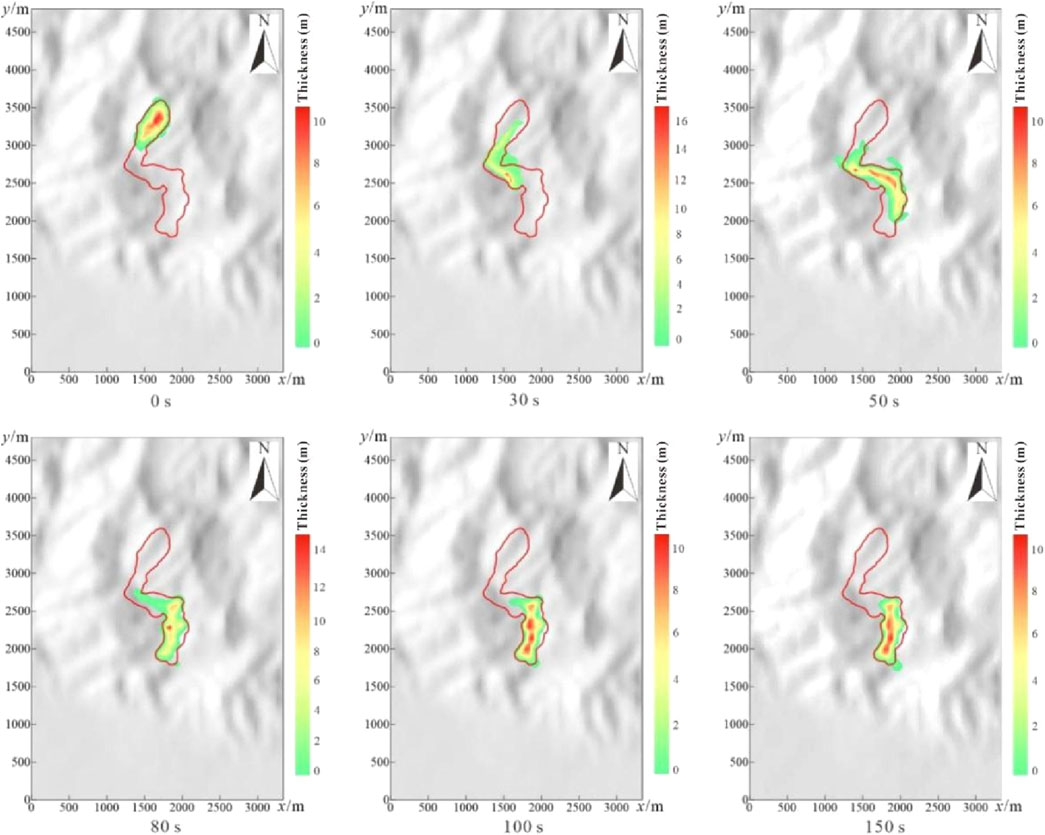
Figure 5. Contour map of motion accumulation of II-1.
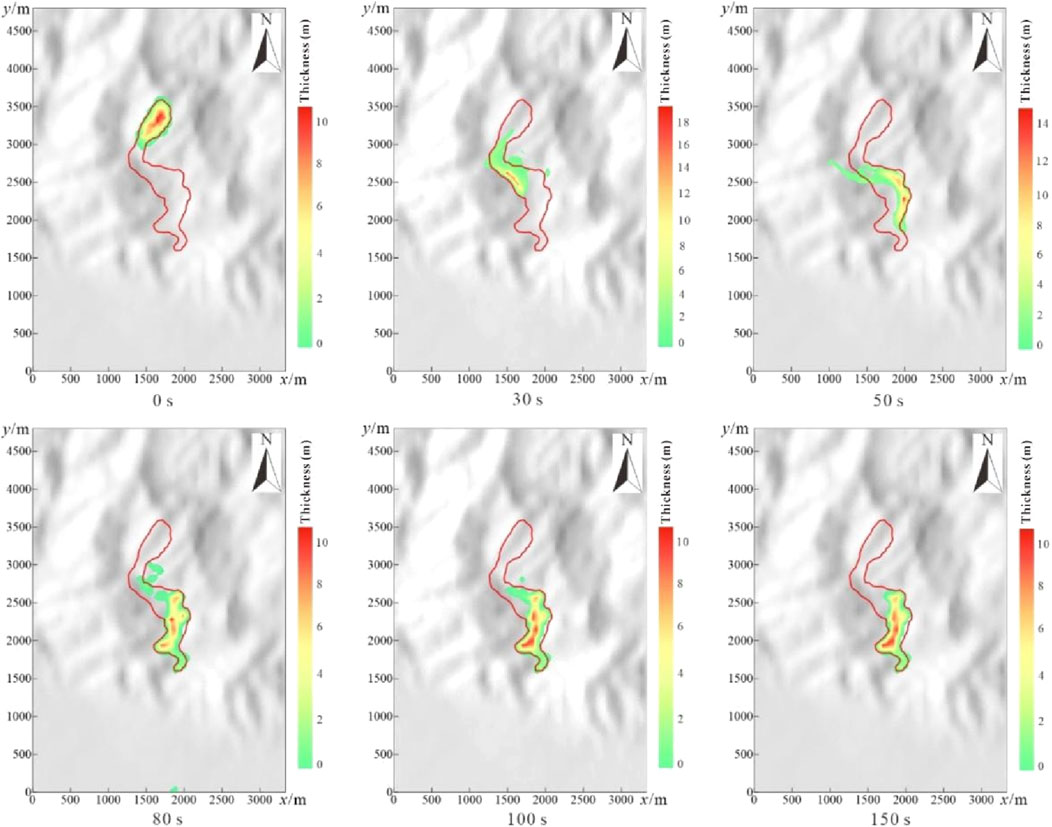
Figure 6. Contour map of motion accumulation of II-2.
4.3 Analysis of movement and accumulation in condition III
The results for Condition III are shown in Figures 7, 8. In the normal condition, a material volume of 2.77 × 10⁶ m3 was initiated from both slopes. After 50 s, the two debris flows wholly merged, and the flow moved southeast for 500 m. The direction changed, and the flow moved southwest for approximately 570 m before stopping. After 150 s, the final average accumulation thickness was 11.1 m. In extreme conditions, a material volume of 2.77 × 10⁶ m3 was initiated from both slopes. After 30 s, the two debris flows merged, and the flow moved southeast for 500 m before changing direction and moving southwest for approximately 1,000 m before stopping. The final average accumulation thickness was approximately 10 m after 150 s.
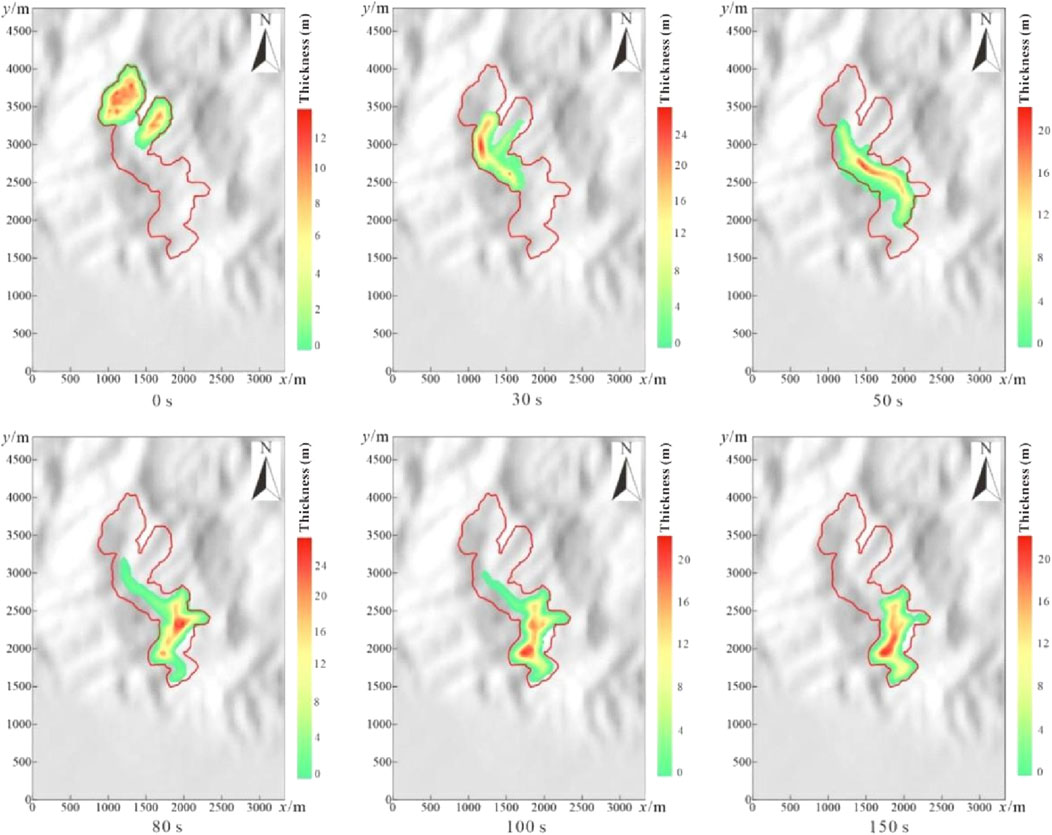
Figure 7. Contour map of motion accumulation of III-1.
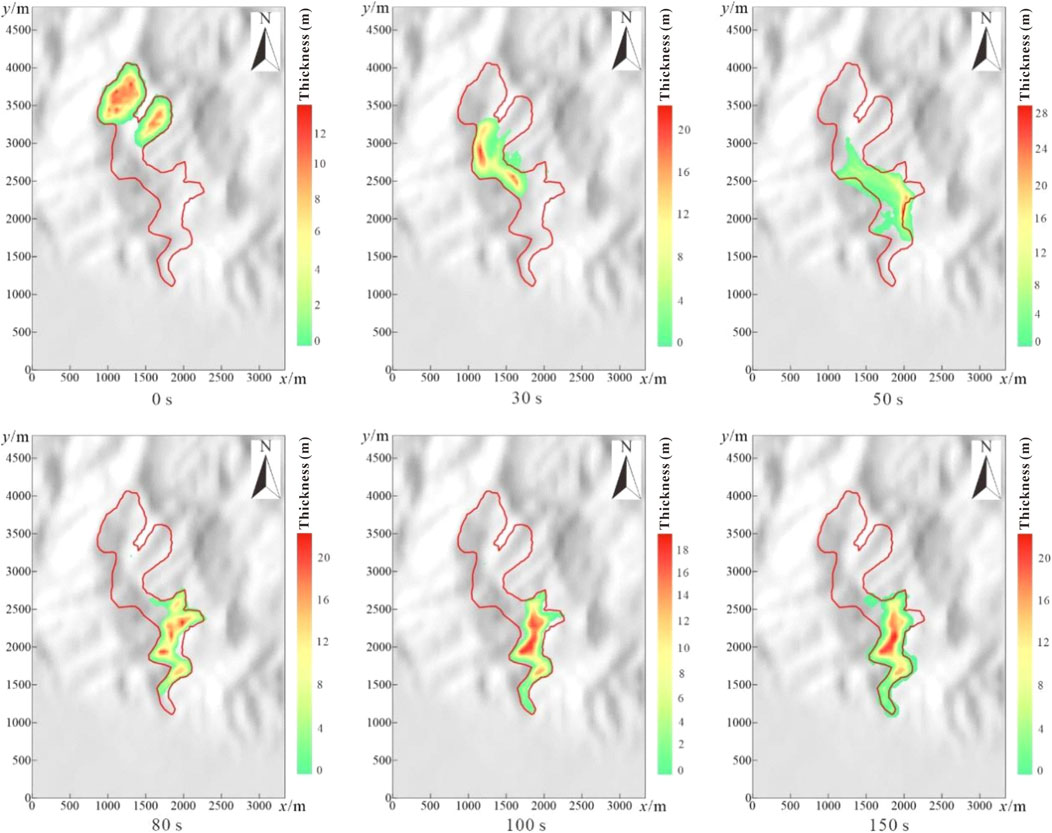
Figure 8. Contour map of motion accumulation of III-22.
4.4 Comparative analysis of conditions I, II, and III
4.4.1 Comparison of movement and accumulation
A comparison of Conditions I-1 and I-2, II-1 and II-2, and III-1 and III-2 showed that for debris flows with the same initial volume, the average movement distance under extreme conditions was 1,503 m, farther than the 1,323 m under normal conditions. This indicates that greater pore water pressure reduces the friction at the boundaries, increases the mobility of the flow, and the movement of the debris flow is more distance. In Condition III-2, the debris flow moved the farthest, reaching the valley mouth, which is the most unfavourable condition. Under normal conditions, the final average accumulation thickness was 8.9 m, thicker than the 8.3 m observed under extreme conditions (Table 5). This is because, under extreme conditions, the debris flow has better mobility, leading to a more dispersed flow and a more uniform accumulation thickness distribution.
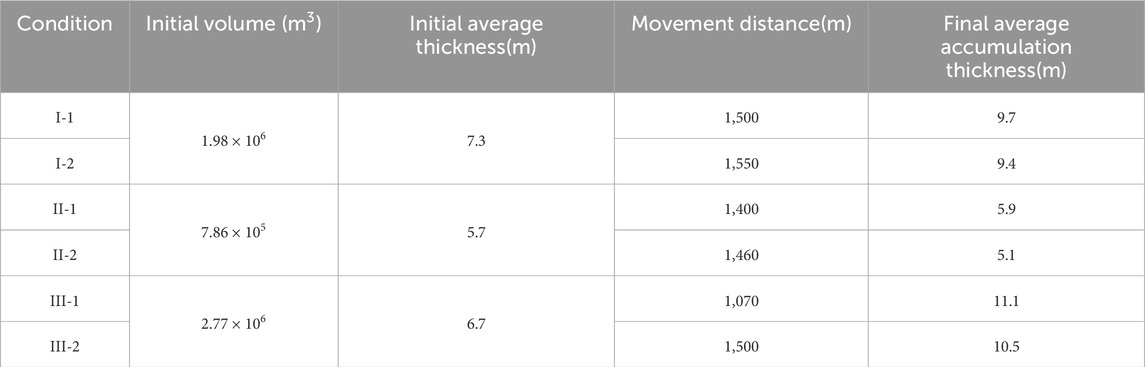
Table 5. Accumulation thickness of debris flow in Zhengguangou
Furthermore, the larger volume resulted in a thicker accumulation of debris flows with the same operational condition but different volumes (Table 5). After a large bend, the terrain enters a wider, gentler area, where most debris flow accumulates in all three conditions. In the most extreme condition (III-2), a small portion of the flow exited the channel and deposited at the mouth of the valley (Figure 8).
4.4.2 Comparison of maximum speeds
In all three conditions examined, the debris flow velocity exhibited an initial increase followed by a decrease, as illustrated in Figure 9. Specifically, under Condition I, the peak velocity was observed approximately 1,100 m downstream from the initiation point. In contrast, under Condition II, the maximum velocity occurred earlier, around 600 m downstream. However, under Condition III, the peak velocity again occurred at approximately 1,100 m downstream. These observations suggest that once the initial debris flow volume attains a certain threshold, the topographic features at around 1,100 m downstream exert a significant influence on the debris flow velocity. Furthermore, the simulation results indicate that an increase in pore water pressure or initial volume will increase the velocity of the debris flow body, as well as contribute to the movement of the debris flow over a longer distance.
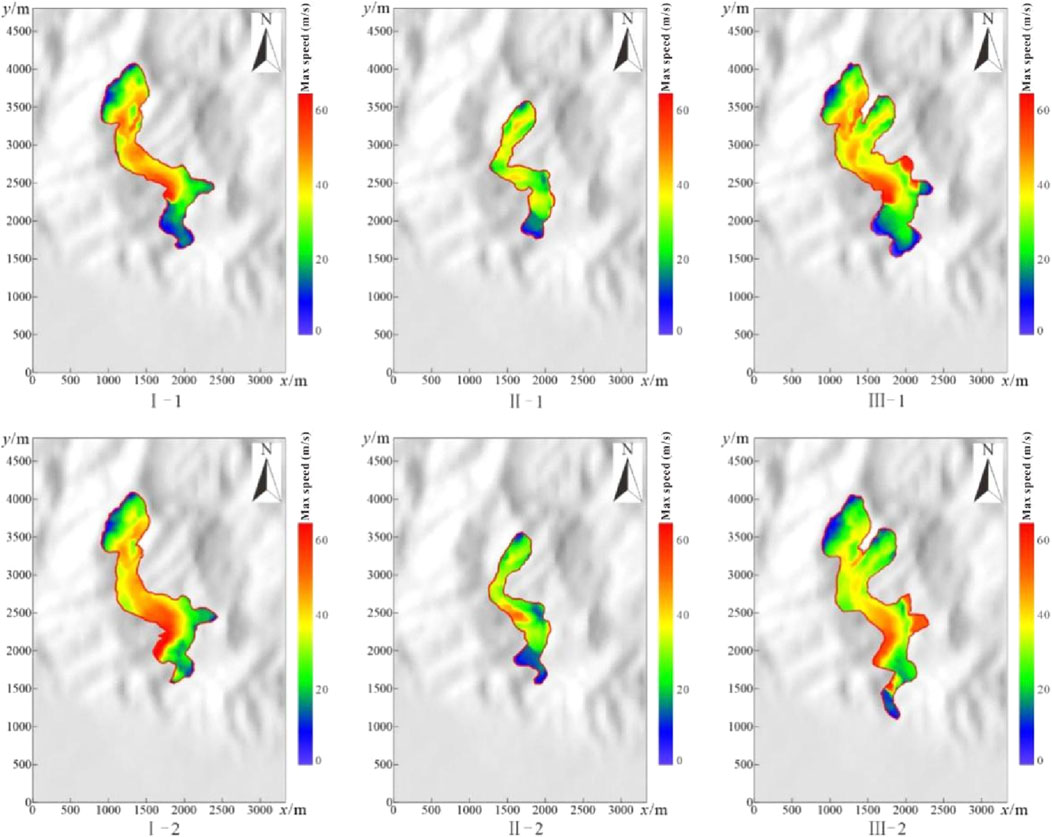
Figure 9. Contour map of maximum speed under different working conditions.
4.4.3 Comparison of erosion depth
As shown in Figure 10, the erosion depth and volume were greater under normal conditions than in extreme conditions (Table 6). During the debris flow, the scraping width was wider in extreme conditions than under normal conditions. The maximum width occurred approximately 1,000 m from the formation area, where the flow direction changed from southeast to southwest.
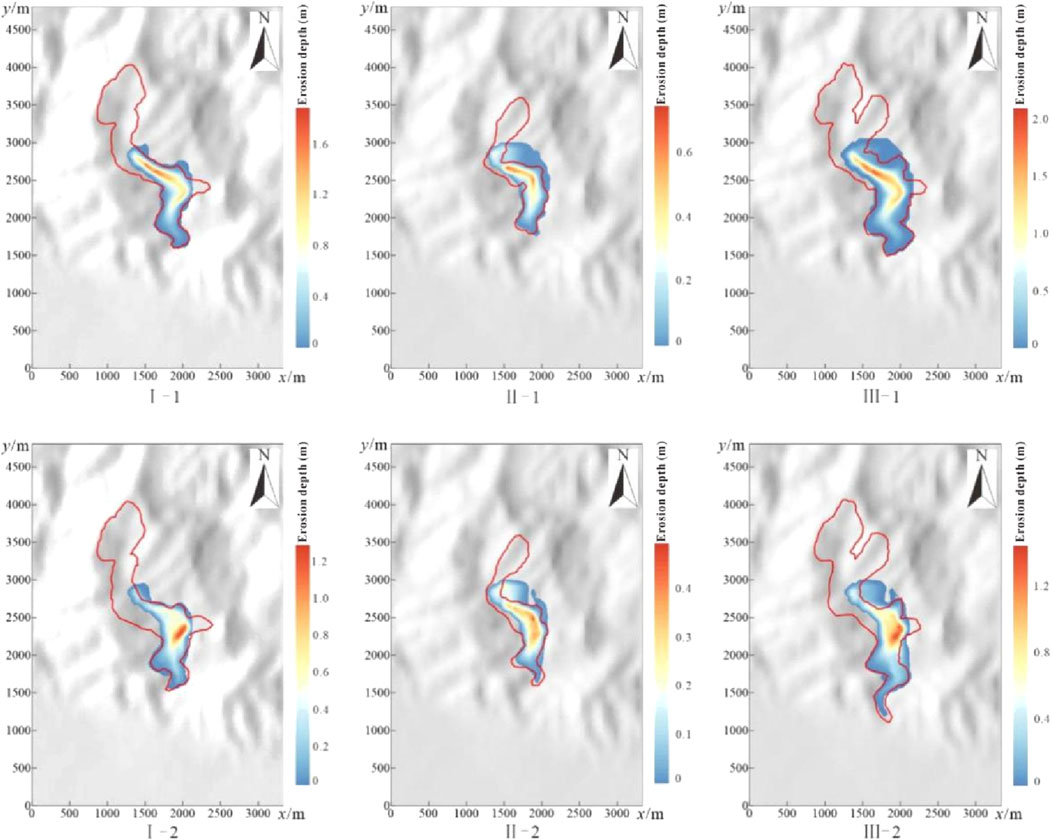
Figure 10. Contour map of erosion depth under different working conditions.
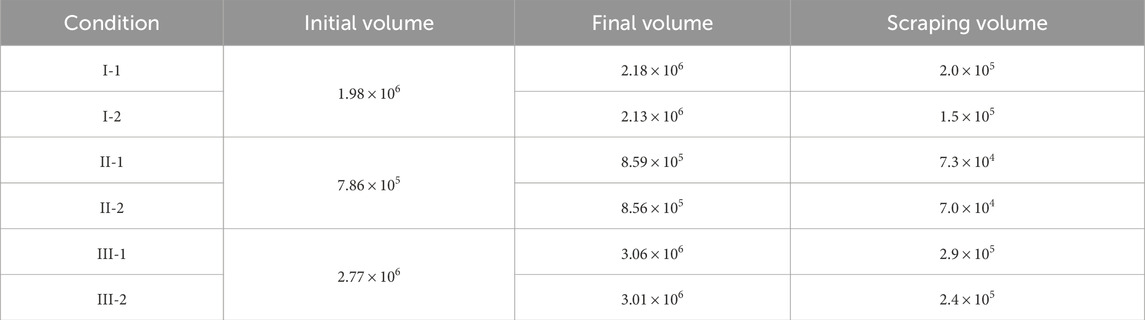
Table 6. Shovel volume of debris flow in Zhengguangou (m3).
The operational conditions and initial volume of debris flows significantly impact both the movement process and the final accumulation pattern. Debris flows under normal conditions have a greater erosion depth, while those under extreme conditions exhibit greater scraping width, with the maximum width occurring where the flow direction changes. This phenomenon combined with Equation 9 shows that as the pore water pressure increases, the friction between the debris flow and the gully bed decreases, thus contributing to a weakening of the debris flow’s erosive capacity. At the same time, because of the increased mobility, the width of the debris flow erosion is greater under extreme conditions.
4.5 Exploring disaster risk prevention and control
4.5.1 Early monitoring and identification
Under extreme rainfall conditions, debris flow will cause great safety hazards to the residential area at the mouth of the ditch, in order to reduce the threat of debris flow disasters to the lives and property of residents, should be strengthened during the rainy season to monitor and early warning of extreme rainfall conditions.
4.5.2 Engineering protection
The presence of a large source of loose material in the Zhengguan Ditch provides conditions for the eruption and erosion of debris flows, which in turn increases the level of risk of debris flow hazards. Therefore, check dams need to be constructed along the ditch to dissipate the kinetic energy of the debris flow and to effectively stop the debris flow body.
4.6 Limitations
Although this study has carefully simulated and analysed the debris flow in Zhengdougou by using DAN-3D software, there are still some limitations:
Firstly, in the model construction, although a smooth granular flow model was used for simplification, this simplification may not fully reflect the real physical properties of the debris flow, especially its complex rheological properties. Therefore, in future research, we need to further optimise the model parameters and improve the accuracy and applicability of the model to more accurately simulate the motion process of debris flow.
Secondly, in the setting of simulation conditions, this study mainly focuses on the volume change of the debris flow and the influence of the pore water pressure on the debris flow movement, while ignoring other important factors that may affect the movement characteristics of the debris flow, such as topography and geomorphology, vegetation cover, and soil type. In order to have a more comprehensive understanding of the debris flow movement pattern and disaster scale, we need to set up more detailed and comprehensive simulation conditions by considering various factors in future studies.
In summary, future studies need to further improve and refine the model optimisation, working condition settings and data support, in order to increase the accuracy of the prediction of debris flow movement characteristics and disaster scale in Zhengdougou.
5 Conclusion
1. When the initial volume is the same, the debris flow travels farther under extreme conditions (pore pressure coefficient of 0.8) than under normal conditions (pore pressure coefficient of 0.3). Under normal conditions, the final average accumulation thickness is thicker than under extreme conditions. For debris flows with the same condition but different volumes, the more significant volume results in a thicker accumulation, and the final deposition range is also more extensive.
2. The debris flow speed initially increases and then decreases. Due to the increased pore pressure coefficient and reduced effective stress, sand and soil liquefaction occurs, causing the flow to travel farther under extreme conditions than usual.
3. The erosion depth is greater under normal conditions than in extreme conditions, while the scraping width is larger under extreme conditions. The maximum width occurs where the flow direction changes.
Data availability statement
The original contributions presented in the study are included in the article/supplementary material, further inquiries can be directed to the corresponding authors.
Author contributions
XH: Conceptualization, Funding acquisition, Writing–original draft, Writing–review and editing. YG: Data curation, Writing–original draft. JY: Formal Analysis, Methodology, Writing–review and editing. SG: Investigation, Methodology, Writing–original draft. ZeH: Project administration, Resources, Writing–review and editing. GZ: Software, Supervision, Writing–original draft. GW: Validation, Visualization, Writing–review and editing. ZiH: Software, Supervision, Writing–original draft. HW: Writing–review and editing.
Funding
The author(s) declare that financial support was received for the research, authorship, and/or publication of this article. The work was supported by the 2021 Top-notch Talent Program of Ningxia, the 2022 Youth Talent Support Program of Ningxia, and the Key Research and Development Program of Ningxia (2023BEG02051). The Innovative Team for Mine Geological Environment Monitoring and Ecological Restoration in Ningxia Hui Autonomous Region (No. 2022BSB03106).
Conflict of interest
The authors declare that the research was conducted in the absence of any commercial or financial relationships that could be construed as a potential conflict of interest.
Generative AI statement
The author(s) declare that no Generative AI was used in the creation of this manuscript.
Publisher’s note
All claims expressed in this article are solely those of the authors and do not necessarily represent those of their affiliated organizations, or those of the publisher, the editors and the reviewers. Any product that may be evaluated in this article, or claim that may be made by its manufacturer, is not guaranteed or endorsed by the publisher.
References
Bai, Y., and Dongri, S. (2021). Experimental study on paving process of debris flow. Mt. Res. 39 (03), 346–355.
Bracken, L. J., Turnbull, L., Wainwright, J., and Bogaart, P. (2015). Sediment connectivity: a framework for understanding sediment transfer at multiple scales. Earth Surf. Process. Landforms 40 (2), 177–188. doi:10.1002/esp.3635
Cheon, E., Lee, S.-R., and Lee, D.-H. (2020). Hazard assessment based on the combination of DAN3D and machine learning method for planning closed-type barriers against debris-flow. Water 12 (1), 170. doi:10.3390/w12010170
Crosta, G. B., Imposimato, S., and Roddeman, D. (2009). Numerical modelling of entrainment/deposition in rock and debris-avalanches. Eng. Geol. 109 (1), 135–145. doi:10.1016/j.enggeo.2008.10.004
Gan, J., and Luo, C. (2020). Runout and process simulation of gully debris flow in middle and low mountains. J. Nat. Disasters 29 (02), 97–110.
Gao, Y., Wei, T. Y., Li, B., and Li, Y. (2019). Dynamics process simulation of long run-out catastrophic landfill flowline on December 20th, 2015 in Shenzhen, China. Hydrogeology and Eng. Geol. 46 (01), 129–138+147.
Gao, Y., Yang, Y., Li, B., and Yan, B. (2023). Numerical simulation method of high-position and long runout landslides under granular state transformation. Chin. J. Rock Mech. Eng. 42 (07), 1623–1637.
Gao, Y., Yin, Y., Xing, B., Wei, Y., and Zhang, Y. (2013). Jiweishan rapid and long run-out landslide-debris flow dynamic characteristics analysis. Chin. J. Geol. Hazard Control 24 (04), 46–51.
He, Q., Guo, F. Y., Li, R. D., Wang, L., Wang, W., Zhang, N., et al. (2023). Characteristics, mobility and dynamic of the Yahuokou flow-like landslide in Zhouqu, Gansu, China. Gansu, China. Landslides 20, 629–643. doi:10.1007/s10346-022-02000-8
He, Q., Wang, Y., Wang, W. P., Xu, W., Zhao, G., Chen, L., et al. (2024). Mechanism of the November 2018 landslide at the Kunming landfill and the geotechnical engineering risk control in the process of urbanization. Bull. Eng. Geol. Environ. 83, 196. doi:10.1007/s10064-024-03703-z
Hou, S., Peng, C., Chen, L., Feng, Z., Liu, J., and Wang, L. (2021). Debris flow hazard assessment of the Eryang River watershed based on numerical simulation. Hydrogeology and Eng. Geol. 48 (02), 143–151.
Hu, J., Qiao, L., and Huang, J. (2020). Dynamic analysis on debris flow in Kekugou gully based on CFX software. Yangtze River 51 (07), 26–32.
Hu, K., Cui, P., Tian, M., Yang, , and Huang, J. (2012). A review of the debris flow dynamic models and numerical simulation. Shuili Xuebao 43 (S2), 79–84.
Hungr, O. (2009). Numerical modelling of the motion of rapid, flow-like landslides for hazard assessment. KSCE J. Civ. Eng. 13 (4), 281–287. doi:10.1007/s12205-009-0281-7
Hungr, O., and Mcdougall, S. (2009). Two numerical models for landslide dynamic analysis. Comput. and Geosciences 35 (5), 978–992. doi:10.1016/j.cageo.2007.12.003
Kang, Z. C., Li, C. F., An, M., and Yin, Y. (2004). Debris flow research in China. Beijing: Science Press.
Minatti, L., and Pasculli, A. (2011) “Sph numerical approach in modelling 2d muddy debris flow,” in 5th International Conference on Debris-flow hazards mitigation:mechanics,prediction and assessment. Padua, Italy, 467–475.
Monaghan, J. J. (1992). Smoothed particle hydrodynamics. Annu. Rev. Astronomy Astrophysics 30 (1), 543–574. doi:10.1146/annurev.aa.30.090192.002551
Qiao, C., Ou, G., Pan, L., Wang, J., and Yan, Y. (2016). Review on numerical modeling methods of debris flow. J. Earth Sci. Environ. 38 (01), 134–142.
Sosio, R., Crosta, G. B., and Hungr, O. (2008). Complete dynamic modeling calibration for the Thurwieser rock avalanche (Italian Central Alps). Eng. Geol. 100 (1), 11–26. doi:10.1016/j.enggeo.2008.02.012
Sun, M. (2016). Zoning evaluation of debris flow susceptibility in yongsheng county, yunnan province. Doctoral thesis. Kunming University of Science and Technology.
Wang, J., Guan, J., Yunjie, W., Liu, Y., and Wang, Z. Z. (2021). A study of the disaster model and movement process simulation of debris flow in the Zhixi River of Deqin County. Hydrogeology and Eng. Geol. 48 (06), 187–195.
Wang, Y., He, Q., Wang, W., Zhang, N., Chen, L., Liu, Z., et al. (2024). Analysis on the mechanism and dynamics of frequent debris flows in typical alpine gorges areas—a case study of Yizhong river in Deqin County, Yunnan, China. Front. Earth Sci. 12, 1418763. doi:10.3389/feart.2024.1418763
Xing, W., Shi, C., Xie, X., and Chen, R. (2023). SPH-FEM simulation of landslide induced by earthquake with considering velocity weakening effect of frictional strength. Chin. J. Geotechnical Eng., 1–9.
Yang, C., Yanmin, G., Zhuang, K., and Zhang, C. (2024). The application of SPS in the simulation of viscous flow by SPH method. Joumal Huazhong Univ. Sci. Technol. Nat. Sci. Ed. 52 (01), 59–65.
Yang, G. A. O., Bin, L. I., and Guozhang, WANG (2016). Motion feature and numerical simulation analysis of Jiweishan landslide with rapid and long run-out. J. Eng. Geol. 24 (03), 425–434.
Zhang, C., Zhu, Y.-J., Wu, D., Adams, N. A., and Hu, X. (2022). Smoothed particle hydrodynamics: Methodology development and recent achievement. J. Hydrodynamics 34 (5), 767–805. doi:10.1007/s42241-022-0052-1
Zhang, X., Yongbo, T., Ning, Z., and Zhang, S. (2023). Characteristics and activity analysis of the catastrophic “6•26” debris flow in the Banzi catchment, Wenchuan County of Sichuan Province. Hydrogeology and Eng. Geol. 50 (05), 134–145.
Zhao, D., Hao, M., and Xiong, H. (2023). Research on the dynamic process of debris flow impacting rigid barrier based on SPH⁃DEM. J. Nat. Disasters 32 (06), 47–57.
Zhong, J., Ni, W., and Huang, W. (2018). Research on development characteristics and mechanism of the Zhengguangou debris flow in Helan Mountain of ningxi. Northwest. Geol. 51 (03), 223–231.
Keywords: debris flow, dynamic characteristics, numerical simulation, DAN-3D software, Zhengguangou
Citation: He X, Gong Y, Yan J, Gao S, He Z, Zhang G, Wang G, Hu Z and Wang H (2025) Research on the movement process of erosion-denudation type debris flow in middle-low mountains based on particle algorithm model. Front. Earth Sci. 12:1532456. doi: 10.3389/feart.2024.1532456
Received: 22 November 2024; Accepted: 27 December 2024;
Published: 28 January 2025.
Edited by:
Shilin Zhang, Southwest Jiaotong University, ChinaReviewed by:
Kun He, Southwest Jiaotong University, ChinaWeigang Shen, Southwest Jiaotong University, China
Hu Yu-xiang, Sichuan University, China
Copyright © 2025 He, Gong, Yan, Gao, He, Zhang, Wang, Hu and Wang. This is an open-access article distributed under the terms of the Creative Commons Attribution License (CC BY). The use, distribution or reproduction in other forums is permitted, provided the original author(s) and the copyright owner(s) are credited and that the original publication in this journal is cited, in accordance with accepted academic practice. No use, distribution or reproduction is permitted which does not comply with these terms.
*Correspondence: Yongfeng Gong, NjQ1OTAyNjU2QHFxLmNvbQ==; Jinkai Yan, eWFuamlua2Fpc3dAMTYzLmNvbQ==