 Hongju Tong1†
 Ziyu Lv2†
 Junyi Jiang1Xingguo Gao1Ziqing Wang2Chaoshuai You1Kun Xu2Yuhang Wu2
 Xin Pan3,4*
- 1Shandong Electirc Power Engineering Consulting Institute Corp. Ltd., Jinan, China
- 2School of Earth Science and Engineering, Hohai University, Nanjing, China
- 3College of Geography and Remote Sensing, Hohai University, Nanjing, China
- 4Key Laboratory of Soil and Water Processes in Watershed, Hohai University, Nanjing, China
Introduction: Solar photovoltaic (PV) power generation, a crucial part of global renewable energy, has been advancing swiftly. However, effective promotion of PV generation relies not only on enhancing generation efficiency but also on thorough evaluations of construction suitability. This study addresses this gap by developing a comprehensive evaluation framework for assessing the suitability of photovoltaic power station locations in China.
Methods: This research developed a subjective-objective evaluation framework that integrates the Analytic Hierarchy Process (AHP) and the Criteria Importance Through Intercriteria Correlation (CRITIC) method. This framework allows for a comprehensive analysis of photovoltaic power station location suitability. Long-term meteorological data and remote sensing products were used to calculate solar radiation and photovoltaic potential data, which were then applied to evaluate the suitability of photovoltaic generation across China.
Results: The study revealed that from 2000 to 2020, China's average annual solar radiation was 5,896.437 MJ·m−2, and the total photovoltaic generation amounted to 1.10726 × 10¹⁵ KWh. By 2020, the average score for photovoltaic construction suitability in China was 0.1058, with suitable areas comprising 51.1% of the national territory. High-suitability regions were primarily concentrated in Northwest China, including Xinjiang and Gansu, where suitability scores exceeded 7.5 and annual generation surpassed 213 KWh. In contrast, southeastern coastal and southern provinces such as Jiangsu, Zhejiang, and Fujian exhibited lower suitability scores (<3.5) and annual average generation of less than 19.2262 KWh, primarily due to limited land availability and reduced solar radiation.
Discussion: The findings emphasize the critical need to prioritize photovoltaic development in Northwest China, where favorable conditions offer considerable potential for large-scale photovoltaic generation. These regions possess rich solar resources and extensive land suitability, making them optimal for photovoltaic power station construction. In contrast, southeastern coastal areas and southern provinces are less suitable for photovoltaic development due to constraints in land availability and solar radiation levels. This study provides valuable insights for strategic photovoltaic development planning in China.
1 Introduction
With the gradual depletion of traditional fossil energy and the increasing severity of environmental issues, photovoltaic (PV) power generation, as an important component of renewable energy, has garnered widespread global attention (Qin et al., 2024). In the past decade, the PV industry has achieved an average annual growth rate exceeding 35%, demonstrating strong expansion momentum. As of 2018, China’s installed PV capacity exceeded 175 GW, ranking first globally (Capizzi et al., 2019); by the end of 2019, the global cumulative PV installed capacity reached 583.5 GW, with an annual capacity of 143 GW (Wirth and Schneider, 2015). China possesses abundant solar energy resources, with approximately 66.8% of its land area receiving annual solar radiation exceeding 5040 MJ/m2. The rational development of these resources is crucial for achieving the goal of carbon neutrality (Lv et al., 2022; Zeng et al., 2022).
In recent decades, there have been significant advancements in domestic and international research on photovoltaic suitability assessment, primarily optimizing through the integration of geographical, meteorological, and socio-economic factors. Early studies predominantly focused on assessing solar radiation availability, relying on models based on meteorological data. For example, the SolarGIS model developed by Šúri et al. estimated the solar energy potential in different regions (Šúri et al., 2007), and the work of Remund et al. involved meteorological satellite models dealing with long-term meteorological data processing (Remund et al., 2003). Zhou et al. revealed the solar radiation potential across various regions of China through analysis of nationwide meteorological station data, particularly highlighting the development prospects in the northwest (Zhou et al., 2010). With the advancement of geospatial technology, Geographic Information Systems (GIS) and Remote Sensing (RS) technologies have become indispensable tools for photovoltaic suitability assessment. Journée et al. and Yu et al. conducted a thorough assessment of the spatial heterogeneity of solar energy resources in China and the spatio-temporal distribution of photovoltaic potential by integrating remote sensing and GIS technologies, thus offering precise data support for the construction of photovoltaic facilities (Journée and Bertrand, 2010; Yu et al., 2023). Sánchez-Lozano et al. and Uyan utilized GIS-based Multi-Criteria Decision Analysis (MCDA) methods to assess the suitability of specific regions for photovoltaic system deployment, comprehensively considering factors such as solar radiation, land use, and transmission lines, providing scientific justification for the site selection of renewable energy projects (Sánchez-Lozano et al., 2013; Uyan, 2013).
To improve assessment accuracy, more and more technologies and methods are being introduced into photovoltaic suitability assessment. For example, Mahmoud et al. used Artificial Neural Networks (ANN) in combination with geographical and climatic factors to predict the solar energy potential in Egypt (Mahmoud and Mahmoud, 2020). Meanwhile, socio-economic and environmental factors are also considered in photovoltaic suitability assessment. For instance, Janke considered factors such as land use conflicts in his GIS-based solar suitability analysis (Janke, 2010). Hernández et al. explored the environmental impacts of large-scale photovoltaic systems in desert regions (Hernandez et al., 2014). Zambrano et al. proposed a photovoltaic suitability assessment model based on MCDA (Zambrano-Asanza et al., 2021), and Yousefi et al. and Yang et al. respectively developed fuzzy logic and machine learning algorithms to improve the accuracy and applicability of photovoltaic suitability assessment (Yousefi et al., 2018; Yang D. et al., 2022).
As the world’s largest solar energy production and consumption market, China has also made important advancements in assessing the suitability and potential of photovoltaic power generation. Li et al. comprehensively considered 13 factors including terrain, weather, and environment, proposing a more comprehensive suitability model for evaluating the feasibility of photovoltaic development in China (Li et al., 2023). The impact of climate change has also become a focus of photovoltaic suitability research. Hua et al. emphasized the potential impacts of climate change on solar radiation distribution, emphasizing the need for future photovoltaic planning to fully consider the long-term effects of climate change (Hua et al., 2024). In China, MCDA methods are widely employed in photovoltaic suitability assessment. Liang et al. proposed a comprehensive evaluation model based on AHP-XGBoost-GIS for evaluating the suitability of photovoltaic power stations in the Beijing-Tianjin-Hebei region (Liang et al., 2024), while Qiu et al. constructed a comprehensive assessment system based on GIS and MCDA to assess the photovoltaic power generation potential in different regions of China (Qiu et al., 2022).
A review of past research reveals that many PV suitability assessments have not fully integrated solar energy resources with PV generation potential, resulting in a lack of comprehensive evaluation. Most PV suitability evaluation methods lack a balanced consideration of subjective and objective factors, and are deficient in systematic assessment. This study integrates the Analytical Hierarchy Process (AHP) with the Criteria Importance Through Intercriteria Correlation (CRITIC) method to create a multi-source remote sensing data-driven framework for PV suitability assessment, taking into account both expert judgment and objective data. By incorporating solar radiation and PV generation data from 2000 to 2020, the study assesses the regional suitability of PV power generation in China in 2020. The study results offer a comprehensive, data-driven PV suitability analysis, integrating long-term meteorological data with socio-economic factors, addressing the challenges of PV development across various geographical regions and enhancing the accuracy of suitability assessments.
The structure of the paper is organized as follows: Section 2 introduces the study area and data sources; Section 3 explains the methods used for PV suitability analysis and the calculation of generation capacity and solar radiation; Section 4 presents the results and discussion; Section 5 summarizes the conclusions.
2 Study area and data
2.1 Overview of the study area
This study is conducted in China, which spans from 73° to 135° E longitude and from 3° to 53° N latitude. Figure 1 illustrates the diversity of China’s terrain, including plateaus, mountains, basins, plains, and hills. China’s climate varies widely, with the north being cold and dry, the south warm and humid, the west arid with little rainfall, and the east experiencing abundant precipitation.
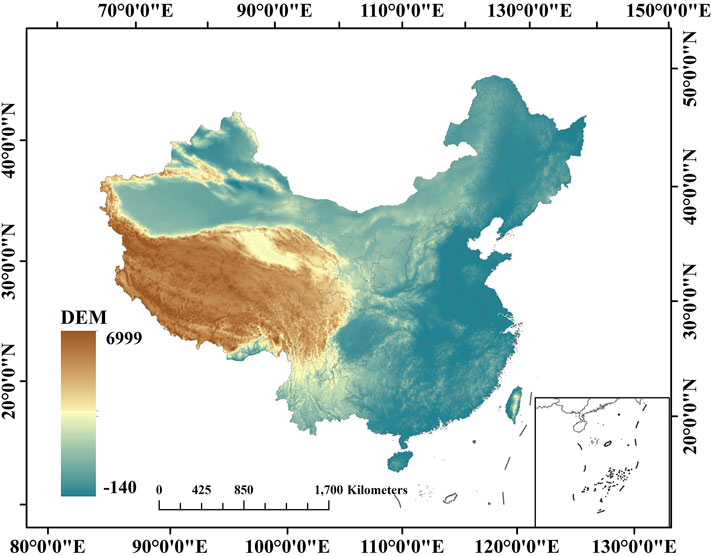
Figure 1. China’s digital elevation model.
2.2 Study data
The radiation data used in this study originate from the high-resolution land reanalysis dataset (ERA5-Land) developed by the European Centre for Medium-Range Weather Forecasts (ECMWF). This dataset covers hourly meteorological data from 1950 to the present. During the data processing, format conversion, integration calculation, and unit conversion are necessary steps to obtain the required radiation data. ERA5-Land reanalysis output provides detailed land surface parameters suitable for various scientific research and practical applications, including analyzing historical climate trends and assessing the impacts of future climate change. Moreover, this study utilized the MODIS Collection 5 Level 3 global land cover type product (MCD12Q1) provided by NASA, based on MODIS sensor data, covering the entire globe. This dataset adopts the “Land Cover Type 1: IGBP Global Vegetation Classification Scheme,” including 17 major land cover types. Population distribution data is sourced from Mu’s Global Annual Human Footprint Dataset (Mu et al., 2022). The NASADEM_HGT dataset is a high-resolution digital elevation model (DEM) released by NASA, derived from SRTM data and integrated and finely corrected with other topographic data sources.
Table 1 presents detailed information regarding the source data utilized in this study. Each data source varies in its temporal and spatial resolution. To facilitate further calculations, we standardized them to a spatial resolution of 0.1 and adjusted the temporal resolution to annual for consistent processing.
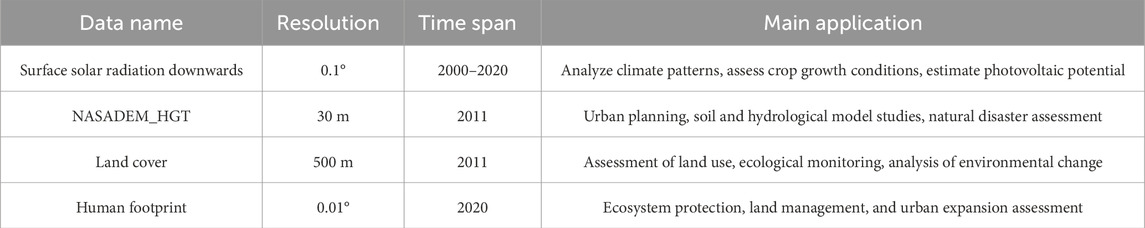
Table 1. Multi-source data profile.
3 Research methods
This study establishes a comprehensive photovoltaic power suitability evaluation system (Figure 2), intended to provide scientific evidence for photovoltaic power station site selection and potential assessment.
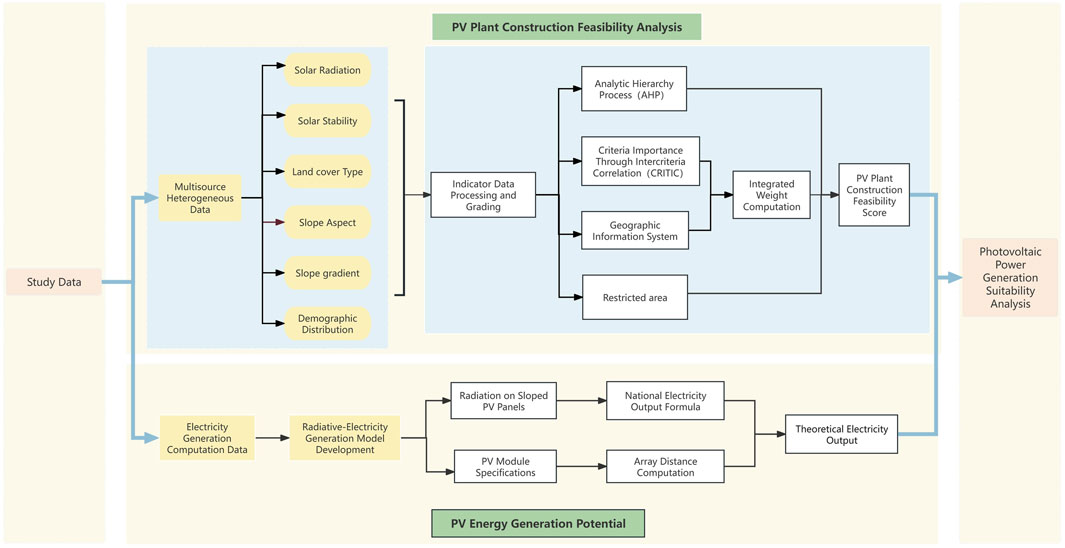
Figure 2. Photovoltaic suitability assessment framework.
3.1 Power generation calculation
At present, photovoltaic station construction in China primarily revolves around fixed photovoltaic systems, and this study also focuses on the application of fixed photovoltaic power generation. By integrating factors such as the optimal tilt angle of photovoltaic arrays, array spacing, conversion efficiency, and system efficiency, photovoltaic power generation was calculated. Zhang et al. revealed that ERA5 data holds high accuracy and applicability in assessing solar energy resources (Zhang and Li, 2023). Building on this validation, this study utilized ERA5-land meteorological data to perform an in-depth analysis of solar radiation resources and photovoltaic power generation.
Photovoltaic power generation is fundamentally dependent on the calculation of solar radiation. In order to precisely estimate power generation on photovoltaic arrays, it is essential to study the radiation received on inclined surfaces. In real-world photovoltaic station operations, the arrays are usually set at specific tilt angles. Different tilt angles correspond to varying inclined surfaces, and the photovoltaic power output primarily depends on the radiation resources available on those surfaces (Hafez et al., 2017). The total irradiance (Et) on the photovoltaic panel surface primarily consists of direct radiation (Ebt) received by the inclined surface, diffuse radiation (Edt), and ground-reflected radiation (Ert). Direct radiation refers to sunlight that directly strikes the photovoltaic panel without being scattered or reflected by the atmosphere. Its intensity depends on factors such as the solar position, the tilt and orientation of the photovoltaic array, and atmospheric transparency. Ground-reflected radiation is the fraction of solar radiation reflected by the ground back onto the photovoltaic panel and is primarily determined by the surface albedo. Diffuse radiation refers to solar radiation that has been scattered by atmospheric molecules and particles, coming from the entire hemisphere of the sky rather than a specific direction. This type of radiation is affected by atmospheric conditions, geographical location, and seasonal changes, which adds complexity to its calculation.
The Hay model (Hay and Davies, 1980) was employed in this study to estimate solar radiation on photovoltaic surfaces. Monthly representative day data were used in iterative calculations to derive the optimal tilt angle and its corresponding radiation, which was then used to calculate monthly-scale photovoltaic radiation data. The detailed formula (Equations 1-6) is as follows:
In the formula: β is the local latitude, Φ is the tilt angle, θ is the sunset angle for the horizontal plane, and θs is the sunset angle for the inclined plane. E represents the total solar radiation on the horizontal plane, G represents solar radiation outside the Earth’s atmosphere,
Tracking photovoltaic systems have been shown in numerous studies to receive significantly more solar radiation compared to fixed systems. However, due to installation and maintenance costs and complexities, this study focuses on fixed photovoltaic systems. Fixed systems require setting a specific tilt angle. In this study, we utilized the Hay model to compare total radiation received by photovoltaic panels at different tilt angles and determined the optimal tilt angle based on the results.
While photovoltaic panels come in various sizes and designs, the industry predominantly utilizes silicon-based materials (PSE, 2022). For evaluating system efficiency, conservative values were used: system efficiency set at 80% and conversion efficiency at 20%. Additionally, the spacing of photovoltaic arrays impacts module performance. Following the “Design Specifications for Photovoltaic Power Stations”, array spacing (S) was calculated, and the useable area ratio (Z) for photovoltaic generation in different Chinese regions was estimated, reflecting the effective area available for photovoltaic power in each region. The calculation formula (Equations 7-9) is as follows:
where Ep represents the theoretical total power generation obtained from the calculation of the photovoltaic tilted surface, L represents the length of the photovoltaic inclined surface, HA represents the total solar radiation received on the inclined surface, converted into electrical units (kWh·m−2), β represents the local latitude, and Φ represents the tilt angle. K is the system’s overall efficiency, and P is the photovoltaic conversion efficiency.
3.2 Selection and grading standards of evaluation indicators
When constructing photovoltaic power stations, multiple factors must be considered, each impacting suitability differently (Sultan et al., 2018). Therefore, the evaluation process should not only involve creating a multi-dimensional index system but also account for the relationships and importance of these indicators (Demir et al., 2023). Additionally, data from various sources must be processed for effective integration and analysis, ultimately creating a scientific framework for evaluating construction suitability with appropriate weight assignments for each criterion.
Based on relevant research literature, this study considers the impacts of solar resources, stability, geographical environmental suitability, construction costs and shading risks, radiation reception, and socio-economic factors to determine specific indicators for constructing a suitability assessment system for photovoltaic power station development (Fard et al., 2022). In the selection and determination of specific indicators, this study adhered to three principal criteria: completeness of the indicator system, independence among indicators, and accessibility of original data. Priority was given to selecting key factors that thoroughly reflect the suitability of locations for photovoltaic power stations. Additionally, independently meaningful and physically clear indicators were chosen to preserve independence, along with widely available and reliable data for better operability. The research considered that some factors fluctuate across regional and temporal scales, which complicates their inclusion as stable indicators in a long-term evaluation system. Additionally, the impacts of certain factors are indirectly represented through other indicators. Ultimately, the chosen indicators included total solar radiation, sunlight stability, land cover type, aspect, slope, and population distribution.
Given the available spatiotemporal resolution of indicator data, this study used a 0.1° spatial resolution as a unified benchmark. This resolution is outstanding in capturing regional differences and effectively represents major national trends and regional disparities. Moreover, this resolution provides both computational efficiency and compatibility in integrating multisource data, such as solar radiation, land cover, and population distribution, making it suitable for comprehensive and efficient evaluations of photovoltaic suitability. Using 2020 total solar radiation data for China at a 0.1° resolution as a unified benchmark enabled the integration of diverse multisource data. However, the datasets still show incompatibility during aggregation and fusion due to differences in measurement units and value ranges. To resolve this, a grading approach was employed to standardize the data, transforming all datasets into a scoring system from 1 to 10, with higher scores indicating better conditions for constructing photovoltaic power stations.
To establish standardized grading, we referenced Zhang et al. to develop criteria for total solar radiation and sunlight stability data (Zhang et al., 2018). Given that China is located in the Northern Hemisphere, we selected the south-facing direction as the optimal aspect to maximize solar radiation capture. Grading standards for slope aspect, slope gradient, and land cover types were adapted from Wang’s research (Wang et al., 2023). Additionally, population distribution was used as an indicator of economic activity, with grading thresholds determined via a Lorenz curve-based method as proposed by Han et al. (2009). The resulting standardized grading for the six evaluation indicators is summarized in Tables 2, 3.
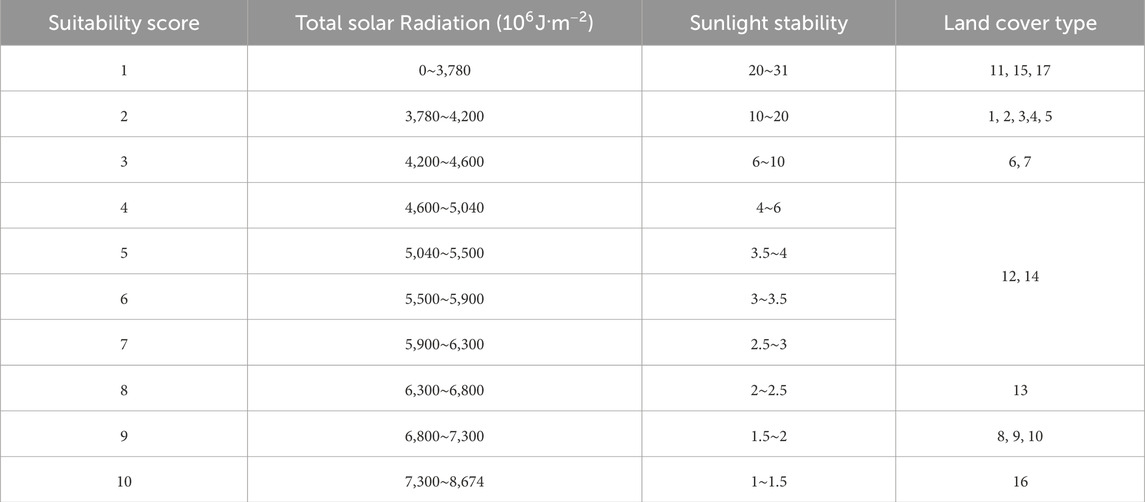
Table 2. Standardized grading of evaluation indicators.
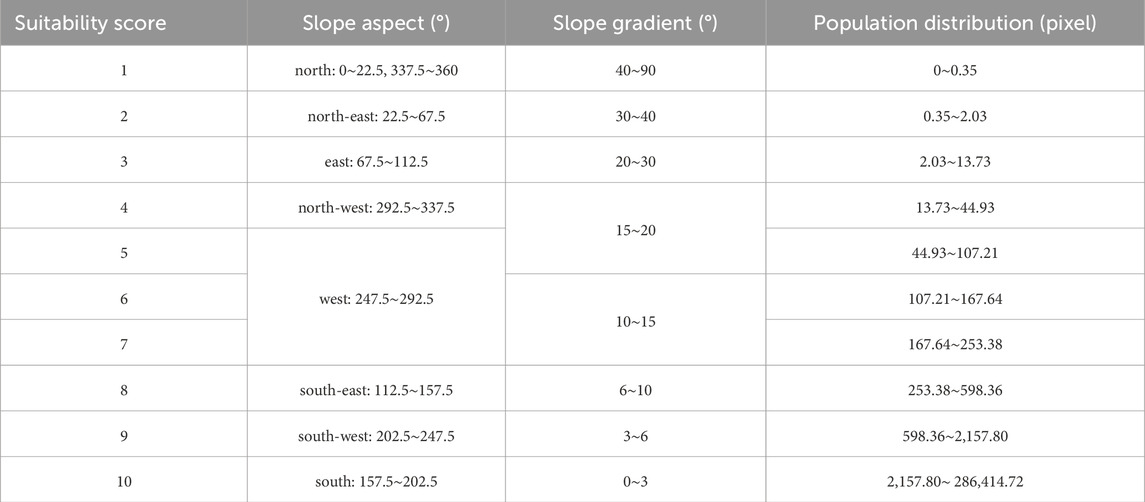
Table 3. Standardized grading of evaluation indicators.
To clearly and effectively illustrate the distribution of suitability scores, we classified the results based on the suitability region threshold table provided below (Table 4). Incorporating restricted areas, we categorized the entire country into five levels: low suitability, moderate suitability, suitable, high suitability, and restricted zones, thereby mapping the distribution of various suitability levels.

Table 4. Suitability threshold classification.
3.3. Suitability analysis methods
This study seeks to perform a thorough and systematic evaluation of To guarantee the precision and scientific validity of the analysis, a multi-criteria decision-making framework combining AHP, CRITIC, and GIS was chosen, demonstrating clear advantages compared to other approaches. The suitability of conditions before the construction of photovoltaic power stations. The AHP method first conducts a subjective analysis of indicator weights based on practical application requirements, offering an indispensable way to express subjective experience and preferences, compared to methods that rely exclusively on data analysis. The CRITIC method, on the other hand, assigns weights to each indicator based on data volatility and contrast, effectively addressing any subjective biases that may exist in AHP, and more accurately capturing the inherent logical relationships between indicators. Furthermore, this framework incorporates GIS’s spatial analysis capabilities, effectively taking into account the geographic and spatial characteristics of various regions. Ultimately, GIS was used to perform weighted summation on various indicator levels, resulting in suitability scores for photovoltaic plant construction across regions, offering a scientific basis for construction decision-making.
The Analytic Hierarchy Process (AHP), developed by operations researcher R.W. Saaty, is a method based on multi-factor comprehensive evaluation and network system theory (Saaty, 1987). Its core principle involves leveraging expert knowledge to evaluate the relative importance of various criteria, resulting in a comparison matrix that facilitates both qualitative and quantitative analysis for determining the importance weights of each factor. The steps for determining these weights are as follows:
(1) First, identify the contents of the goal layer, criteria layer, and solution layer, and construct a hierarchical structure model.
(2) Construct the judgment matrix A according to the importance of each criterion. The elements on the diagonal of the matrix are 1, and Aij denotes the degree to which criterion i is better than criterion j. Aij and Aji are symmetrically distributed along the matrix diagonal (i ≠ j), and Aij × Aji = 1. When i = j, Aij = Aji = 1 (i = j), and both are sequentially distributed along the diagonal of the judgment matrix.
(3) Compute the sum of each column of the comparison matrix A, divide each element in the matrix by its corresponding column sum, and then take the average value of each row to derive the weights (Table 5).
(4) A consistency check is introduced to verify whether the judgment matrix is logically consistent. First, the maximum eigenvalue of the judgment matrix A is calculated, and then the consistency index (CI) is determined based on the number of criteria, n (Equation 10).
Based on the number of criteria, refer to the table of average random consistency index values (Table 6) to find the random consistency index (RI), and then calculate the consistency ratio (CR) to assess the quality of the CI (Equation 11).

Table 5. Results of indicator data weight calculation (AHP).

Table 6. Random consistency Index Values.
The consistency ratio (CR) is calculated according to Equation 11, yielding a result of 0.03895. If CR < 0.10, the judgment matrix is considered to have reasonable consistency; otherwise, the matrix must be reconstructed until it satisfies the consistency test.
The CRITIC (Criteria Importance Through Intercriteria Correlation) objective criticism method is an objective weighting approach proposed by Diakoulaki et al. (1995). It employs a mathematical model that considers both the contrast intensity and conflict between indicators to determine their weights. This method is scientifically rigorous and objectively sound, as it accounts for the information within the indicator data and the relationships between different indicators. The specific steps of the CRITIC method used in this study are as follows:
(1) Normalization was applied to achieve dimensionless standardization, scaling the six suitability indicators for photovoltaic power station construction to a range of 1–10. The standard deviation Sj of each graded dataset was calculated to reflect data variability.
(2) The correlation coefficient measures the similarity between the indicator data. Conflicts Rj among indicators are constructed based on the correlation coefficient rij to quantify the relationship between indicators (Equation 12).
(3) Information content Cj is determined by combining standard deviation with indicator conflict, accounting for data variability and correlation, serving as the basis for objective weight allocation (Equation 13).
Weights are assigned based on the proportion of information content for each factor (Table 7).

Table 7. Results of indicator data weight calculation (CRITIC).
In evaluating the suitability of photovoltaic power station construction, expert knowledge should dominate, while the objective data serves a secondary role. Given these considerations, the relative importance coefficient method is used to combine the subjective weights from the AHP method with the objective weights from the CRITIC method, resulting in a comprehensive weighting that balances subjective judgment and objective data.
The formula (Equation 14) for combining subjective and objective weights using the relative importance coefficient method is:
where

Table 8. Results of comprehensive weight calculation.
4 Results
4.1 Analysis of solar radiation resources
Through analysis of solar radiation data, we derived the average total solar radiation from 2000 to 2020 (Figure 3A). We conducted an analysis of the changes in total annual and monthly solar radiation in China from 2000 to 2020, plotting radiation change curves (Figures 3B, C) and examining the trends in average annual and monthly radiation curves (Figure 3D).
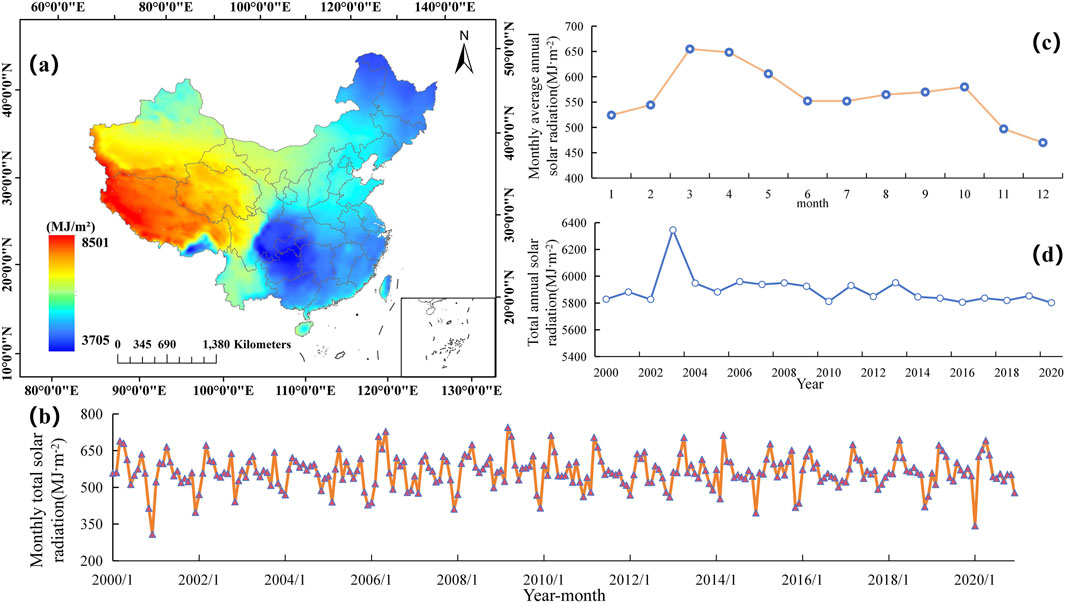
Figure 3. Spatiotemporal Distribution of Solar Radiation Data (2000–2020). (A) Average solar radiation; (B) Monthly total radiation variation curve; (C) Interannual Variation Curve of Solar Radiation; (D) Intra-annual monthly average radiation variation curve.
Figure 3A illustrates the spatial distribution of average annual total solar radiation across China from 2000 to 2020, ranging from 3,705.25 to 8,501.94 MJ·m⁻2, with an average of 5,896.437 MJ·m⁻2 and a total of 5.66×101⁶ MJ. This data underscores the richness of solar energy resources and reveals significant regional variation. Western China, particularly the Tibetan Plateau, Qinghai, and Xinjiang, has significantly higher average annual solar radiation than other areas, showing tremendous potential for solar energy development. This regional disparity is primarily linked to topography: western regions benefit from high altitudes and low cloud cover, enabling greater solar radiation reception, while eastern coastal and northeastern areas, influenced by monsoon climates and atmospheric circulation, have relatively lower solar radiation. The spatial distribution indicates that western China has substantial potential for solar energy development, especially in photovoltaic power generation. While eastern regions have lower radiation levels, they still hold potential for effective solar utilization through technology improvements and enhanced efficiencies (Yang D. et al., 2022). These findings offer essential scientific support for the future development and regional optimization of solar energy resources.
The monthly and interannual variation line graphs of total solar radiation in China from 2000 to 2020 (Figures 3B, C) illustrate the seasonal and year-to-year fluctuation characteristics of solar radiation. The monthly variation data indicate clear seasonal fluctuations in solar radiation, with peak radiation occurring in summer (May to August) and the lowest levels in winter (November to January). This pattern aligns with changes in solar altitude and daylight duration. winter radiation levels show a marked decline, reflecting shorter daylight hours and weaker solar radiation intensity. This fluctuation amplitude illustrates monthly radiation’s sensitivity to seasonal climate variations, underscoring the pronounced seasonal differences in photovoltaic power potential. The year-to-year variation reveals a fluctuating decline in China’s annual total solar radiation from 2000 to 2020, with an unusual peak in 2003, followed by a quick drop, indicating a temporary phenomenon. Since 2010, the radiation trend has leveled out, signifying relatively stable radiation conditions during this period. Despite fluctuations in total annual radiation, the overall trend demonstrates relative consistency, reflecting the predictability of solar radiation resources on an annual scale in China. Moreover, the changes in monthly average radiation within the year (Figure 3D) further affirm seasonal fluctuation characteristics, notably with peaks in June and July and troughs in winter. In general, monthly average radiation exhibits substantial variations across different months, particularly during spring and autumn, where radiation levels show gradual transitions, indicating the influence of natural climate changes on radiation conditions.
On the whole, China’s spatiotemporal distribution of solar radiation exhibits significant regional disparities as well as seasonal and year-to-year fluctuation characteristics. These spatiotemporal distribution patterns offer essential scientific support for the development and utilization of solar resources in China. In the photovoltaic power generation sector, the western region, with its favorable sunlight conditions, stands out as a priority area for development. Furthermore, long-term monitoring of solar radiation trends aids in crafting more precise solar energy utilization strategies, advancing the effective development and broad application of renewable energy.
4.2 Calculation and evaluation of photovoltaic power generation
Based on the data and calculations from Section 3.1, we obtained the average power generation data for 2000–2020 (Figure 4A), with an annual average range of 19.2262–213.367 KWh·m⁻2, and an average total of 115.34 KWh·m⁻2. The total generation across China is 1.10726 × 10¹⁵KWh. To more effectively assess the overall power generation potential in China, annual and monthly-scale analyses were conducted on the regional average power generation data for 2000–2020, resulting in the interannual and monthly variation curves (Figure 4b and 4C), with further analysis of intra-annual monthly average data changes (Figure 4D).
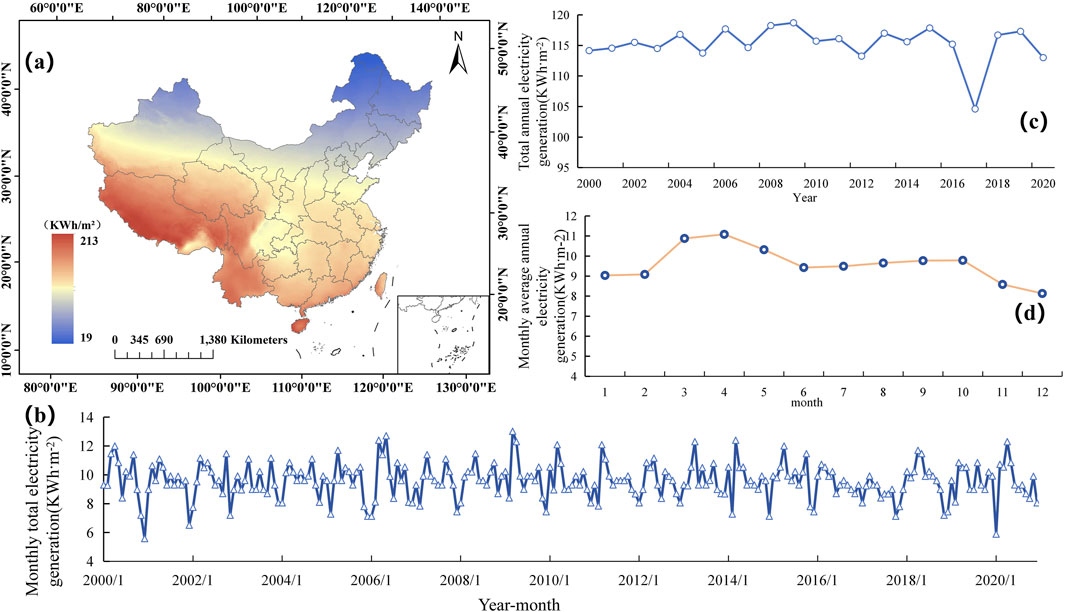
Figure 4. Spatiotemporal Distribution of Theoretical Electricity Generation Data (2000–2020). (A) Average power generation; (B) Monthly total power generation variation curve; (C) Interannual power generation variation curve; (D) Intra-annual monthly average power generation variation curve.
The spatial distribution map of photovoltaic generation across China from 2000 to 2020 (Figure 4A) indicates that the power generation potential in the southern regions is substantially higher than in the north. This is mainly attributed to the higher solar radiation and extended sunlight hours in southern regions, especially in southwestern provinces like Yunnan and Guizhou, where, despite complex terrain, abundant radiation resources result in high generation potential. The eastern regions exhibit a considerable photovoltaic power potential owing to stable meteorological conditions. The Tibetan Plateau and northwest regions show strong power generation potential, benefiting from high solar intensity and advantageous radiation conditions. By contrast, the North China Plain, Northeast, and other central and northern plains areas have relatively low power generation due to weaker solar radiation and shorter winter daylight hours. Furthermore, certain regions experience limited generation potential due to cloud cover and climate variability. Overall, photovoltaic power potential in high-radiation areas of the southern and western regions is likely to remain strong in the future. While climate change might affect local conditions, the spatial distribution of power generation potential in these regions is not anticipated to undergo fundamental changes.
The monthly power generation variation curve (Figure 4B) clearly reveals the seasonal fluctuations in monthly photovoltaic power generation in China between 2000 and 2020. Power generation reaches its peak in the summer, significantly increasing with extended daylight hours and intensified solar radiation, particularly at the summer solstice. Conversely, winter shows lower power generation, primarily owing to weaker solar radiation and reduced daylight hours. These seasonal fluctuations result from the Earth’s orbital characteristics, creating notable differences in solar radiation conditions between seasons, with high consistency across the years.
Furthermore, the trend in mean annual total power generation (Figure 4C) from 2000 to 2020 reveals fluctuation patterns over time. Annual total power generation fluctuates only slightly, remaining between 95 and 120 kWh/m2, with occasional peaks in years such as 2003 and 2004; however, the general trend remains stable, supporting the reliability of theoretical power generation analysis and forecasting on an annual scale. Nonetheless, a marked decrease occurred in 2017, possibly due to climate change or unusual meteorological conditions. Monthly average power generation variation within the year (Figure 4D) further validates the seasonal fluctuations, indicating generation differences among months. Despite interannual variability, summer power generation consistently surpasses winter, peaking notably in June and July, while winter remains a sustained low. This seasonal variation illustrates the influence of natural climate on photovoltaic power generation conditions.
In summary, despite fluctuations in certain years, China’s photovoltaic power generation shows a stable growth trend, with a clear sensitivity to climate change. Future research should increasingly address climate change and its long-term effects on solar resources to support more precise generation planning and response strategies (Chen et al., 2019). This indicates that at a monthly scale, photovoltaic generation remains highly reliant on seasonal climate variation; even with future technological advances, seasonal fluctuations will be an unavoidable trend in power generation. Consequently, photovoltaic power planning and management must account for these seasonal variations to achieve optimal and efficient energy distribution.
4.3 Suitability analysis
Based on the standardized grading results of the evaluation indicators, we standardized and graded the six types of multi-source heterogeneous data (total solar radiation, solar stability, land cover type, slope, aspect, and population distribution), with the results presented in the Figure 5. We can observe the distribution characteristics of these six different suitability evaluation indicators, which display distinct spatial patterns across geographic regions.
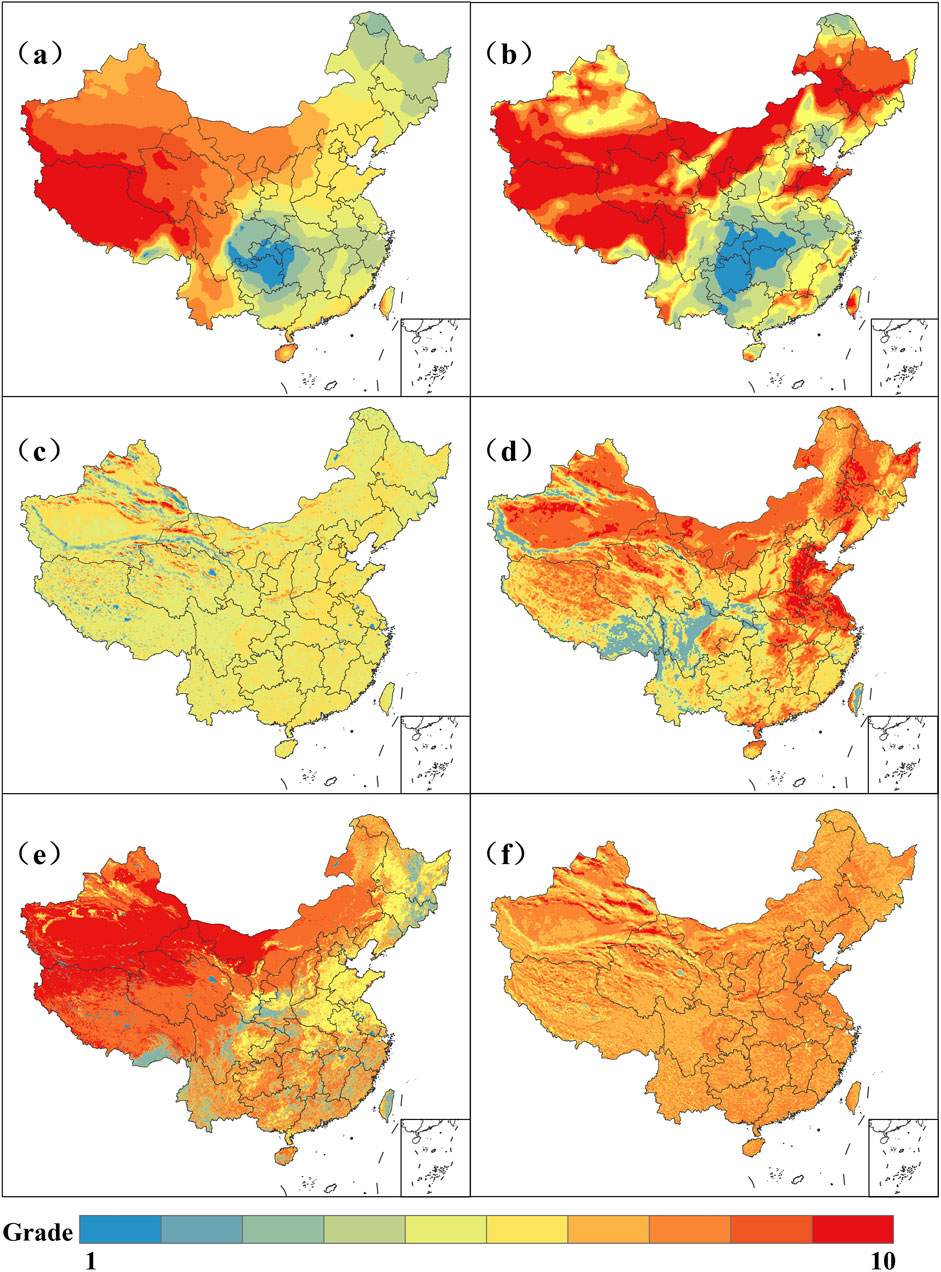
Figure 5. Grading Results of Evaluation Indicators. (A) Total solar radiation; (B) Sunlight stability; (C) Slope aspect; (D) Slope gradient; (E) Land cover type; (F) Population distribution.
The western regions exhibit higher total solar radiation, which is associated with the high altitude and the large number of sunny days in these areas. Solar radiation in the eastern and southern coastal areas is relatively lower. This distribution pattern suggests that the western regions possess significant potential for solar energy resources, particularly for solar power generation applications. Regarding solar stability, the northwestern and northern regions have higher stability, indicating relatively stable solar radiation duration in these areas. This stability is advantageous for sustained, long-term photovoltaic power generation operations. In contrast, southeastern coastal and southern regions exhibit lower stability, likely due to the influence of monsoon climates, causing significant fluctuations in sunlight duration. The land cover distribution map shows that the eastern and central regions are predominantly covered by farmland, grasslands, and forests, which reflects dense populations and active agricultural activities. In the western regions, desert and grassland dominate, indicating a more fragile ecological environment and lower population density. The variation in land cover types significantly affects the availability of land for solar energy utilization. Population distribution is mainly concentrated in the eastern coastal and central regions, where population density is high. In contrast, the population density in the western regions is much lower, which is linked to the challenging natural environment and complex terrain. Population distribution influences the planning and deployment of solar energy infrastructure, with higher population densities in the eastern and central regions driving greater energy demand.
The aspect map reveals the orientation characteristics of slopes across the country. The western mountainous regions and the Tibetan Plateau exhibit significant slope variations, with a wide distribution of orientations, while the eastern plains have smaller, more uniform changes in aspect. Aspect influences the optimal tilt and layout of solar photovoltaic panels, with south-facing slopes typically more suitable for photovoltaic power generation in China’s northern hemisphere. The slope map indicates that the slopes are steeper in the western mountainous areas and the Tibetan Plateau, especially around the Himalayas, while the eastern and central plains have much gentler slopes. This slope information is essential for selecting solar energy sites, as steep slopes may increase construction difficulty and cost but could offer favorable orientations to enhance power generation efficiency. The distribution of these suitability evaluation factors reflects the influence of natural and socio-economic conditions on solar energy development across different regions of China. Although the terrain in the western regions is complex, strong solar radiation and stable sunlight conditions highlight the area’s potential for solar energy development. While the eastern and central densely populated regions exhibit relatively lower solar stability, high energy demand and flat land make them suitable for constructing solar photovoltaic power generation facilities.
Following the grading standards in Section 3.2., the data for each evaluation indicator factor was processed, resulting in the grading outcomes for the evaluation indicators. Subsequently, using the comprehensive weight coefficients calculated through AHP (Analytic Hierarchy Process) and CRITIC methods in Section 3.3, the multi-source data indicator factors were weighted and aggregated to calculate the photovoltaic construction suitability score (Figure 6A). Based on the calculations, China’s average suitability score is 5.907. This score reflects the suitability of different regions for photovoltaic power station construction, where higher scores indicate greater suitability.
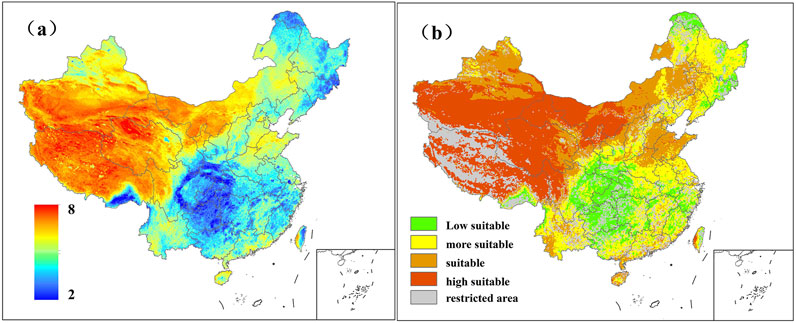
Figure 6. (A) Appropriateness evaluation scores; (B) Distribution of suitability.
The suitability score map (Figure 6A) shows that northwestern and southwestern regions have higher suitability scores. Northwestern and parts of southwestern China exhibit higher suitability scores for photovoltaic construction, thanks to strong solar radiation, favorable land conditions (e.g., deserts, grasslands), and low population density. These regions offer vast areas of developable land, especially in the deserts and semi-deserts of Xinjiang, Qinghai, Gansu, and Tibet, which are highly suitable for large-scale photovoltaic power station development. In contrast, the eastern coastal and central regions show relatively lower suitability scores, largely due to dense populations and complex land-use types (e.g., farmland, urban development). Despite stronger solar radiation in these regions, intense land competition and multiple development constraints reduce their suitability. Overall, the suitability scores in northern regions are lower than in the south, particularly in Northeast China, where fewer sunlight hours and weaker solar radiation limit the potential for photovoltaic development. Although certain southern regions enjoy good solar radiation conditions, their suitability scores are lowered due to complex terrain (e.g., mountains) and land-use restrictions.
Given the technical challenges of building photovoltaic stations and the difficulty of construction at high altitudes, regions with elevations above 5,000 m have been designated as restricted areas. Regions with slopes greater than 50° are also designated as restricted areas, based on the mountainous terrain conditions. Additionally, to preserve the ecological environment and meet soil requirements, permanent wetlands, snow-covered regions, water bodies, forests, and urban areas have been classified as restricted zones. The suitability scores provide an assessment of photovoltaic construction potential across regions, though the complex data may be difficult to interpret.
To gain a clearer understanding of the distribution of suitability, the regions in China were classified according to the suitability thresholds established in Section 3.2, incorporating restricted zones, as shown in Figure 6B. Figure 6B displays the distribution of different suitability zones, and the area proportions of suitable regions across China and its provinces were also calculated (Table 9). The results indicate that low-suitability areas account for 2.915% of the total area, while moderately suitable areas account for 29.017%. Suitable regions occupy the largest area at 42.179%, high-suitability areas make up 8.921%, and restricted zones account for 16.969%. Northwest China (e.g., Ningxia, Qinghai, Tibet) demonstrates extremely high photovoltaic power generation potential, whereas southeastern regions, particularly those with higher urbanization levels, exhibit lower suitability due to factors such as land and climate. Overall, China’s potential for photovoltaic power station construction is significant. The administrative area of Macau is just 32.9 km2. Given the limitations of the current resolution, no suitability analysis for Macau is carried out in this study.
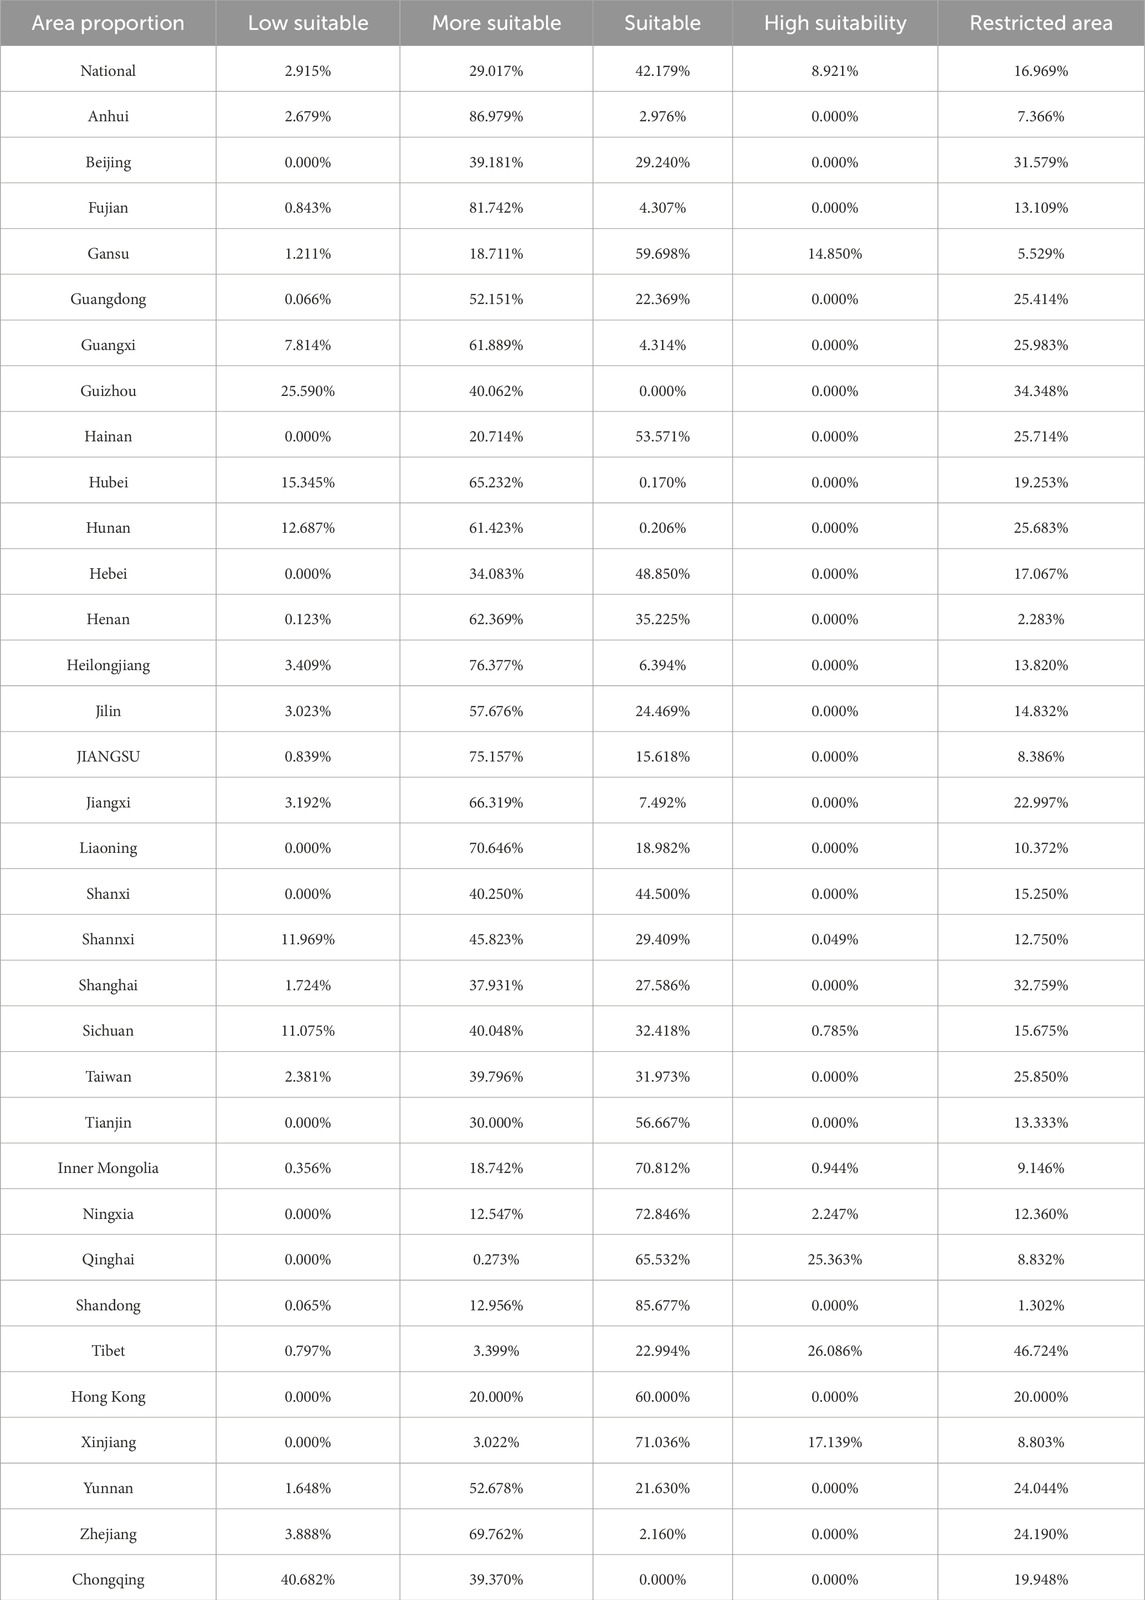
Table 9. Distribution of suitability.
To assess the robustness and scientific validity of the photovoltaic power station suitability evaluation system, a sensitivity analysis was performed on indicator weights and data values. A sensitivity analysis was conducted by setting positive and negative deviations (±20%) in the indicator weights, recalculating the overall weights to obtain suitability scores, and assessing how weight changes affect the area proportion of suitable regions (Figure 7). The results indicated that the influence of different indicators on the area proportion of suitable regions for photovoltaic power stations varied. Among these, solar radiation showed the highest sensitivity, with weight adjustments leading to an average change of up to 9.57%. In contrast, the influence of the population distribution indicator was relatively low, with weight changes having an impact of less than 3.1% on the score. Additionally, scenario analysis further revealed that positive bias adjustments had a greater overall impact than negative bias adjustments. The fluctuation of high-sensitivity indicators directly influenced the regional pattern of These findings further confirmed the reliability of the indicator weights and provided a scientific foundation for the future optimization of the evaluation system and the improvement of indicator design suitability distribution.
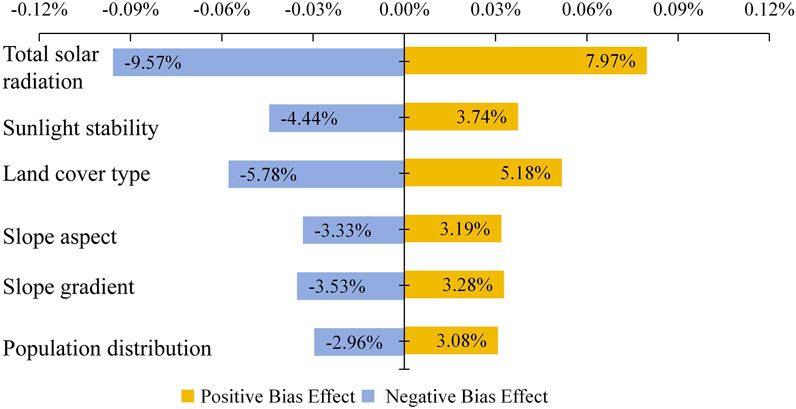
Figure 7. Indicator weight sensitivity analysis, Orange bars indicate a +20% positive deviation adjustment of the indicator weights, while blue bars indicate a −20% negative deviation adjustment. The X-axis shows the effect of these weight adjustments on the proportion of suitable area.
From the comprehensive evaluation and analysis, highly suitable regions are primarily found in the northwest, southwest, and northern parts of China. These regions boast abundant solar resources, high total solar radiation, and relatively stable sunlight conditions, making them ideal for photovoltaic power station construction. The suitable areas are mainly distributed across North China and the northeastern regions. While these regions may not be as ideal as the highly suitable areas, they still have good solar energy resources and relatively favorable conditions for construction. Moderately suitable areas are primarily located in central regions and along the coast. Although these regions perform less favorably on some evaluation indicators, they still possess potential for photovoltaic development due to their geographic advantages and other favorable factors (Zhou et al., 2022). These analysis results offer valuable references for the construction of photovoltaic power stations.
4.4 Discussion
This study aims to tackle the scientific problem of evaluating the suitability of photovoltaic power generation in China by proposing and constructing a comprehensive evaluation model that combines AHP with the CRITIC method, balancing both subjective and objective assessments. By utilizing multi-source data from 2000 to 2020, we calculated solar radiation and photovoltaic power generation potential to provide a thorough and scientific analysis of the suitability for photovoltaic power generation in 2020.
The study results reveal that China’s solar resources and power generation potential show distinct regional characteristics in their spatial distribution, and they have remained relatively stable over the long term, though with notable seasonal fluctuations. Prior studies have also highlighted the unique spatial distribution characteristics of solar energy resources and power generation potential in different parts of China (Liu and Lv, 2019; Li et al., 2022). However, further analysis indicates that the discrepancies between solar radiation and photovoltaic power generation are mainly attributed to a combination of various factors. Firstly, the terrain and climatic conditions play a crucial role in the construction and operation of photovoltaic power stations, restricting the effective use of radiation resources. Secondly, regional variations in resource conditions such as temperature and radiation can also affect the calculated power output, with generation efficiency potentially being lower than theoretical estimates. These combined factors increase the complexity of regional differences between radiation and power generation, requiring further consideration and optimization in future planning.
By calculating comprehensive weights for multiple indicator factors using both subjective and objective perspectives, we found that most regions in China are suitable for photovoltaic construction, which aligns with the broad consensus in the literature (Yang G. et al., 2022). Compared with previous studies, this research offers new insights into regional variations in photovoltaic suitability. The conventional view holds that photovoltaic construction suitability is mainly influenced by regional solar radiation and meteorological conditions (Song et al., 2023). However, our research reveals a more complex relationship although certain regions may have higher power generation potential and their suitability scores may be lower. By combining suitability evaluation with power generation potential analysis, our study offers a more comprehensive perspective on photovoltaic suitability, allowing for a more thorough assessment of factors affecting photovoltaic development and providing a basis for strategic planning of photovoltaic infrastructure (Hu et al., 2024).
Although this study has made significant progress, it also has certain limitations. One such limitation is the spatial resolution of the data used in the study. Although high-resolution data was used, results could be further improved with even higher precision data, particularly in areas with complex topography. Additionally, while environmental and technical factors were included in our analysis, future research could incorporate additional socio-economic variables, such as photovoltaic capacity potential and regional electricity demand, to provide a more comprehensive assessment of photovoltaic power station feasibility and suitability (Sward et al., 2021). Furthermore, while the combination of AHP and CRITIC methods effectively reduces subjectivity, the reliance on expert opinion for AHP weight selection still introduces an element of subjectivity. Future studies could explore alternative weighting methods or introduce more objective techniques like machine learning to further enhance the fairness of the evaluation framework.
The overall suitability evaluation framework is not only applicable to China but can also serve as a reference for assessing photovoltaic potential in other regions globally. Firstly, a thorough understanding of local geographical and climatic conditions in different countries is essential, accompanied by necessary adjustments to the radiation-to-power generation model. Additionally, suitability analyses must carefully account for local policies and land-use conditions, ensuring the selection of indicators is both comprehensive and scientifically rigorous. Furthermore, defining constraints in a reasonable manner and refining restricted areas and conditions are critical steps to enhance the accuracy and applicability of suitability assessments across diverse countries and regions. As the world shifts towards renewable energy, countries and regions will require flexible, multi-criteria evaluation methods to assess photovoltaic potential and make informed energy planning decisions. Our framework can be expanded and optimized in the future, contributing to global efforts in addressing climate change and accelerating the adoption of clean energy technologies.
5 Conclusion
This study focused on analyzing the suitability of photovoltaic power generation in China. It established a comprehensive evaluation framework that combines subjective and objective factors, systematically assessing the suitability of photovoltaic power generation across China’s regions in 2020, based on multi-year spatiotemporal distribution characteristics of solar radiation and photovoltaic power potential. The main research findings are as follows: China’s solar energy resources and photovoltaic power generation potential are immense, with total radiation amounting to 5.66 × 10^16 MJ and total power generation reaching 1.10726 × 10^15 kWh. These resources show clear regional patterns, remain relatively stable over time, and exhibit significant seasonal fluctuations. Solar radiation in western China is significantly higher than in the east, gradually decreasing as it moves toward the east. Eastern, southern, and northeastern China have relatively low levels of solar radiation. Southern and western China maintain high and stable photovoltaic power generation potential.
Based on the comprehensive weight calculations, the suitability of different regions in China for photovoltaic power generation was analyzed. The results show that photovoltaic suitability is widely distributed, with highly suitable regions primarily located in the northwest, southwest, and northern regions, while suitable areas are mainly in northeastern North China and Northeast China. Suitable regions are the most widely distributed across China, with an average suitability score of 5.907. Suitable areas account for 42.179% of the total, and highly suitable areas account for 8.921%. The study found that there is some correlation and spatial heterogeneity between areas with high power generation potential and regions identified in the suitability evaluation. Analyzing photovoltaic construction suitability together with photovoltaic potential allows for a more comprehensive assessment of photovoltaic power generation suitability. This study holds great significance for advancing renewable energy development in China, especially in the context of achieving the 2060 carbon neutrality goal.
Data availability statement
The original contributions presented in the study are included in the article/supplementary material, further inquiries can be directed to the corresponding author.
Author contributions
HT: Writing–original draft, Conceptualization, Data curation, Methodology. ZL: Formal Analysis, Resources, Software, Writing–original draft. JJ: Investigation, Software, Supervision, Validation, Writing–original draft. XG: Data curation, Formal Analysis, Supervision, Writing–review and editing. ZW: Conceptualization, Investigation, Methodology, Writing–original draft. CY: Formal Analysis, Investigation, Project administration, Validation, Writing–review and editing. KX: Data curation, Investigation, Software, Writing–review and editing. YW: Methodology, Resources, Writing–review and editing. YY: Data curation, Supervision, Validation, Writing–review and editing. XP: Conceptualization, Data curation, Supervision, Validation, Writing–review and editing.
Funding
The author(s) declare that no financial support was received for the research, authorship, and/or publication of this article.
Conflict of interest
Authors HT, JJ, XG, and CY were employed by Shandong Electirc Power Engineering Consulting Institute Corp. Ltd.
The remaining authors declare that the research was conducted in the absence of any commercial or financial relationships that could be construed as a potential conflict of interest.
Generative AI statement
The author(s) declare that no Generative AI was used in the creation of this manuscript.
Publisher’s note
All claims expressed in this article are solely those of the authors and do not necessarily represent those of their affiliated organizations, or those of the publisher, the editors and the reviewers. Any product that may be evaluated in this article, or claim that may be made by its manufacturer, is not guaranteed or endorsed by the publisher.
References
Capizzi, F., Das, A., and Dauwe, T. (2019). Renewable energy in europe—2019. Mol, Belgium: European Environmental Agency-European Topic Centre on Climate Change Mitigation and Energy.
Chen, S., Lu, X., Miao, Y., Deng, Y., Nielsen, C. P., Elbot, N., et al. (2019). The potential of photovoltaics to power the belt and road initiative. Joule 3 (8), 1895–1912. doi:10.1016/j.joule.2019.06.006
Demir, A., Dinçer, A. E., and Yılmaz, K. (2023). A novel method for the site selection of large-scale PV farms by using AHP and GIS: a case study in İzmir, Türkiye. Sol. Energy 259, 235–245. doi:10.1016/j.solener.2023.05.031
Diakoulaki, D., Mavrotas, G., and Papayannakis, L. (1995). Determining objective weights in multiple criteria problems: the critic method. Comput. and Operations Res. 22(7), 763–770. doi:10.1016/0305-0548(94)00059-h
Fard, M. B., Moradian, P., Emarati, M., Ebadi, M., Chofreh, A. G., Jiří, J. K., et al. (2022). Ground-mounted photovoltaic power station site selection and economic analysis based on a hybrid fuzzy best-worst method and geographic information system: a case study Guilan province. Renew. Sustain. Energy Rev. 169, 112923. doi:10.1016/j.rser.2022.112923
Hafez, A. Z., Soliman, A., Metwally, K. A., and Ismail, I. M. (2017). Tilt and azimuth angles in solar energy applications–A review. Renew. Sustain. energy Rev. 77, 147–168. doi:10.1016/j.rser.2017.03.131
Han, J., Hongsheng, L., and Zhang, Z. (2009). Population density map grading method based on Lorenz curve. J. Geogr. Inf. Sci. 11 (6), 833–838. in Chinese.
Hay, J. E., and Davies, J. A. (1980). “Calculation of the solar radiation incident on an inclined surface,” in Proceedings of the first Canadian solar radiation data workshop, Toronto.
Hernandez, R. R., Easter, S. B., Murphy-Mariscal, M. L., Maestre, F. T., Tavassoli, M., Allen, E. B., et al. (2014). Environmental impacts of utility-scale solar energy. Renew. and Sustain. energy Rev. 29, 766–779. doi:10.1016/j.rser.2013.08.041
Hu, Y., Duan, W., Zou, S., Chen, Y., De Maeyer, P., Goethals, P. L. M., et al. (2024). Coupling coordination analysis of the water-food-energy-carbon nexus for crop production in Central Asia. Appl. Energy 369, 123584. doi:10.1016/j.apenergy.2024.123584
Hua, Y., Wei, M., Yuan, J., He, W., Chen, L., Gao, Y., et al. (2024). The impact of climate change on solar radiation and photovoltaic energy yields in China. Atmosphere 15 (8), 939. doi:10.3390/atmos15080939
Janke, J. R. (2010). Multicriteria GIS modeling of wind and solar farms in Colorado. Renew. energy 35 (10), 2228–2234. doi:10.1016/j.renene.2010.03.014
Journée, M., and Bertrand, C. (2010). Improving the spatio-temporal distribution of surface solar radiation data by merging ground and satellite measurements. Remote Sens. Environ. 114 (11), 2692–2704. doi:10.1016/j.rse.2010.06.010
Li, M., Virguez, E., Shan, R., Tian, J., Gao, S., Dalia, P.-E., et al. (2022). High-resolution data shows China’s wind and solar energy resources are enough to support a 2050 decarbonized electricity system. Appl. energy 306, 117996. doi:10.1016/j.apenergy.2021.117996
Li, Y., Zhou, J., and Feng, Z. (2023). Location of mountain photovoltaic power station based on fuzzy analytic hierarchy process—taking Longyang District, Baoshan City, Yunnan Province as an example. Sustainability 15 (24), 16955. doi:10.3390/su152416955
Liang, L., Chen, Z., Chen, S., and Zheng, X. (2024). Evaluation of site suitability for photovoltaic power plants in the beijing-tianjin-hebei region of China using a combined weighting method. LAND 13 (1), 40. doi:10.3390/land13010040
Liu, F., and Lv, T. (2019). Assessment of geographical distribution of photovoltaic generation in China for a low carbon electricity transition. J. Clean. Prod. 212, 655–665. doi:10.1016/j.jclepro.2018.12.045
Lv, A., Li, T., Zhang, W., and Liu, Y. (2022). Spatiotemporal distribution and complementarity of wind and solar energy in China. Energies 15, 7365. doi:10.3390/en15197365
Mahmoud, M. A., and Mahmoud, M. A. (2020). Prediction of solar energy using ANN. Renew. Energy 160, 162–170.
Mu, H., Li, X., Wen, Y., Huang, J., Du, P., Soliman, A., et al. (2022). A global record of annual terrestrial Human Footprint dataset from 2000 to 2018. Sci. Data 9 (1), 176. doi:10.1038/s41597-022-01284-8
Qin, G., Duan, W., Shan, Z., Chen, Y., Huang, W., Rosa, L., et al. (2024). Global energy use and carbon emissions from irrigated agriculture. Nat. Commun. 15 (1), 3084. doi:10.1038/s41467-024-47383-5
Qiu, T., Wang, L., Lu, Y., Zhang, M., Qin, W., Wang, S., et al. (2022). Potential assessment of photovoltaic power generation in China. Renew. Sustain. Energy Rev. 154, 111900. doi:10.1016/j.rser.2021.111900
Remund, J., Wald, L., Lefevre, M., Ranchin, T., and Page, J. (2003). “Worldwide Linke turbidity information,” in ISES solar world congress 2003 (Göteborg, Sweden: International Solar Energy Society ISES), 13.
Saaty, R. W. (1987). The analytic hierarchy process—what it is and how it is used. Math. Model. 9 (3-5), 161–176. doi:10.1016/0270-0255(87)90473-8
Sánchez-Lozano, J. M., Teruel-Solano, J., Soto-Elvira, P. L., and García-Cascales, M. S. (2013). Geographical Information Systems (GIS) and Multi-Criteria Decision Making (MCDM) methods for the evaluation of solar farms locations: case study in south-eastern Spain. Renew. Sustain. energy Rev. 24, 544–556. doi:10.1016/j.rser.2013.03.019
Song, Z., Cao, S., and Yang, H. (2023). Assessment of solar radiation resource and photovoltaic power potential across China based on optimized interpretable machine learning model and GIS-based approaches. Appl. Energy 339, 121005. doi:10.1016/j.apenergy.2023.121005
Sultan, H. M., Oleg, N. K., and Ahmed, A. Z. (2018). “Site selection of large-scale grid-connected solar PV system in Egypt,” in 2018 IEEE Conference of Russian Young Researchers in Electrical and Electronic Engineering (EIConRus), Moscow and St. Petersburg, Russia, 29 January 2018 - 01 February 2018 (IEEE).
Šúri, M., Huld, T. A., Dunlop, E. D., and Ossenbrink, H. A. (2007). Potential of solar electricity generation in the European Union member states and candidate countries. Sol. energy 81 (10), 1295–1305. doi:10.1016/j.solener.2006.12.007
Sward, J. A., Nilson, R. S., Katkar, V. V., Stedmand, R. C., Kay, D. L., Ifft, J. E., et al. (2021). Integrating social considerations in multicriteria decision analysis for utility-scale solar photovoltaic siting. Appl. energy 288, 116543. doi:10.1016/j.apenergy.2021.116543
Uyan, M. (2013). GIS-based solar farms site selection using analytic hierarchy process (AHP) in Karapinar region, Konya/Turkey. Renew. Sustain. Energy Rev. 28, 11–17. doi:10.1016/j.rser.2013.07.042
Wang, H., Tang, R., Yushi, Z., and Zhang, Y. (2023). Based on ArcGIS and multi-factor model for photovoltaic power station site selection assessment. J. Sol. Energy 44 (11), 120–130. in Chinese. doi:10.19912/j.0254-0096.tynxb.2022-1194
Wirth, H., and Schneider, K. (2015). Recent facts about photovoltaics in Germany. Fraunhofer Ise 92.
Yang, D., Wang, W., Xia, X., et al. (2022). A concise overview on solar resource assessment and forecasting. Adv. Atmos. Sci. 39 (8), 1239–1251. doi:10.1007/s00376-021-1372-8
Yang, J., Yang, Z., and Duan, Y. (2022). Capacity optimization and feasibility assessment of solar-wind hybrid renewable energy systems in China. J. Clean. Prod. 368, 133139. doi:10.1016/j.jclepro.2022.133139
Yousefi, H., Hafeznia, H., and Yousefi-Sahzabi, A. (2018). Spatial site selection for solar power plants using a gis-based boolean-fuzzy logic model: a case study of Markazi Province, Iran. Energies 11 (7), 1648. doi:10.3390/en11071648
Yu, S., Han, R., and Zhang, J. (2023). Reassessment of the potential for centralized and distributed photovoltaic power generation in China: on a prefecture-level city scale. Energy 262, 125436. doi:10.1016/j.energy.2022.125436
Zambrano-Asanza, S., Quiros-Tortos, J., and Franco, J. F. (2021). Optimal site selection for photovoltaic power plants using a GIS-based multi-criteria decision making and spatial overlay with electric load. Renew. Sustain. Energy Rev. 143, 110853. doi:10.1016/j.rser.2021.110853
Zeng, N., Jiang, K., Han, P., Hausfather, Z., Cao, J., Daniel, K.-D., et al. (2022). The Chinese carbon-neutral goal: challenges and prospects. Adv. Atmos. Sci. 39 (8), 1229–1238. doi:10.1007/s00376-021-1313-6
Zhang, Q., Xiaozhou, X., Zhang, H., Li, Y., Li, X., Yi, C., et al. (2018). Suitability analysis of photovoltaic power station construction in China based on remote sensing data and multi-factor evaluation. J. Geogr. Inf. Sci. 20 (1), 119–127. in Chinese. doi:10.12082/dqxxkx.2018.170393
Zhang, S., and Li, X. (2023). Study on application of era5 data to solar energy resource assessment over china's region, Acta Energiae Solaris Sinica 44.5.
Zhou, Y., Wu, W.-X., Hu, Y., and Liu, G. X. (2010). The temporal-spatial distribution and evaluation of potential solar energy resources in Northwest China. J. Nat. Resour. 25 (10), 1738–1749. doi:10.11849/zrzyxb.2010.10.012
Keywords: suitability analysis, solar energy resources, photovoltaic power generation, multi-source data, comprehensive assessment
Citation: Tong H, Lv Z, Jiang J, Gao X, Wang Z, You C, Xu K, Wu Y and Pan X (2025) Analysis of regional photovoltaic power generation suitability in China using multi-source data. Front. Earth Sci. 12:1528134. doi: 10.3389/feart.2024.1528134
Received: 14 November 2024; Accepted: 31 December 2024;
Published: 23 January 2025.
Edited by:
Weili Duan, Chinese Academy of Sciences (CAS), ChinaReviewed by:
Yujiu Xiong, Sun Yat-sen University, ChinaWeizhong Su, Nanjing Institute of Geography and Limnology (CAS), China
Han Zhou, Wuhan University of Technology, China
Copyright © 2025 Tong, Lv, Jiang, Gao, Wang, You, Xu, Wu and Pan. This is an open-access article distributed under the terms of the Creative Commons Attribution License (CC BY). The use, distribution or reproduction in other forums is permitted, provided the original author(s) and the copyright owner(s) are credited and that the original publication in this journal is cited, in accordance with accepted academic practice. No use, distribution or reproduction is permitted which does not comply with these terms.
*Correspondence: Xin Pan, cHgxMDEzQGhodS5lZHUuY24=
†These authors have contributed equally to this work