 Yunyun Zhang1,2,3
 Xiaobin Chen1,2*
 Peijie Wang4
 Juntao Cai1,2Zhongyin Liu1,2
 Jiong Zhang1,2Xingxing Huang1,2
- 1National Institute of Natural Hazards, Ministry of Emergency Management of China, Beijing, China
- 2Key Laboratory of Compound and Chained Natural Hazards Dynamics, Ministry of Emergency Management of China, Beijing, China
- 3School of Geophysics and Information Technology, China University of Geosciences, Beijing, China
- 4Department of Earth and Space Sciences, Southern University of Science and Technology, Shenzhen, China
The Sichuan-Yunnan diamond block is a significant region of material flow from the Tibetan Plateau. However, its northwest electrical boundary remains undefined. Our study conducted a magnetotelluric profile from Chazha to Luomai across the geological boundary of the Sichuan-Yunnan block in its northwest sector. Using the nonlinear conjugate gradient three-dimensional inversion method, we obtained the deep electrical structure across the northern part of the block. Our findings reveal distinct segmental characteristics in the electrical structure along the profile. Marked by a high-resistivity zone along the Dedeng-Batang-Riyu fault, two high-conductivity layers exist in the upper-middle crust of the southwestern and central sections of the profile, at depths of 5–20 km and 10–30 km, respectively. Thus, our study suggests that the northwest boundary of the Sichuan-Yunnan diamond block, contrary to previous studies that considered it a transitional boundary, is located at the Dedeng-Batang-Riyu fault. Here, the boundary is a high-resistivity barrier, electrically isolating the Qiangtang block in the southwest from the Sichuan-Yunnan block in the northeast. The two significant high-conductivity zones in the upper-middle crust appear within the block’s interior, contrasting with previous assumptions of lower crustal flow.
1 Introduction
The Sichuan-Yunnan diamond block is a crucial lateral outflow pathway for material from the present-day Tibetan Plateau. It plays a key role in, and serves as major supporting evidence for, the lower crustal flow dynamics model, which is applied in this area (Zhang et al., 2004; Shen et al., 2005; Bai et al., 2010). Due to lateral extrusion at the eastern margin of the Tibetan Plateau and strong resistance from the South China block, the Sichuan-Yunnan diamond block, located on the eastern margin of the Tibetan Plateau, has become the most complex and distinctive mobile block in the plateau’s eastward and southward expansion (Cui et al., 2006). This block has a unique geological structure, with varying fault orientations, scales, and activities. It is highly seismically active, prone to frequent earthquake disasters, and provides a critical window for studying post-collisional tectonic deformation and evolution processes of continental plates. Therefore, research on the deep structure of the Sichuan-Yunnan block holds theoretical importance. Geologically, the block is bounded by major active faults: the nearly NS Jinshajiang fault zone (western boundary), the NW-SE Ganzi-Yushu-Xianshuihe fault zone (northern boundary), the nearly NS Anninghe-Zemuhe-Xiaojiang fault zone (eastern boundary), and the NW-SE Red River fault zone (southern boundary) (Kan et al., 1977; Deng et al., 2002; Zhang et al., 2003; Shen et al., 2005; Xu et al., 2005). The Jinshajiang fault was previously an active suture structure, showing marked compressional characteristics (Xu et al., 1992). Influenced by eastward extrusion from the Tibetan Plateau, it has exhibited clear strike-slip motion, shifting from early left-lateral to right-lateral motion since the Pliocene (4.7 Ma) (Xu et al., 1992; Deng et al., 2002). Segmented by the NE-SW Batang fault and the NW-SE Zhongdian-Deqin fault, the Jinshajiang fault is divided into southern, central, and northern sections, with seismic activity gradually decreasing from south to north. The northern segment is the least active, with its main activity period in the early Quaternary; apart from local late Quaternary activity on the western branch, there is no geological evidence for significant fault activity since the late Pleistocene (Wu et al., 2019).
Typically, the material outflow from the Tibetan Plateau is explained by two main modes: middle-lower crustal flow and rigid extrusion. The first model proposes that material from the central plateau flows toward the eastern margin through a low-viscosity channel in the middle-lower crust. Extensive geophysical surveys indicate that low-velocity (Bao et al., 2015; Yang et al., 2020) and highly conductive partially molten material may be present along the southeastern margin of the plateau (Sun et al., 2003; Bai et al., 2010; Cheng et al., 2015). The second model suggests that the rigid lithosphere extrudes laterally along large strike-slip faults, with the middle-upper crust escaping outward from the plateau, driven by internal forces, while the lower crust impedes this escape process (Tapponnier et al., 1982; Tapponnier et al., 2001).
Previous studies on the diamond block boundaries have focused on crustal deformation (Lv et al., 2002), surface strain accumulation characteristics (Liu et al., 2022a; Zheng et al., 2017), and stress field features (Guo et al., 2024), primarily using geophysical methods such as seismology and geodesy. Due to the seismic activity along the Xianshuihe fault, the eastern boundary of the diamond block has long been a hot research area. However, studies on the deep electrical structure and dynamics of the Sichuan-Yunnan diamond block have mainly concentrated around and south of the Red River fault, the Anninghe-Zemuhe-Xiaojiang fault, and the Lijiang-Xiaojinhe fault (Yu et al., 2020; Li et al., 2020), with limited research on the northern area, resulting in a lack of comprehensive understanding of the region. To investigate the deep distribution range of material flow along the eastern margin of the Tibetan Plateau and delineate the electrical boundary of the Sichuan-Yunnan diamond block, we conducted a magnetotelluric survey across the geological boundary of the block in its northwest sector. This profile extends from Chazha Township, Sichuan Province, to Luomai Township, Tibet Autonomous Region.
2 Survey region
There are primarily northwest-oriented structures in Sichuan-Yunnan block. In this study, the survey profile originates in the southern part of the Bayan Har block (BHB), cuts southwest across the northwest sector of the Sichuan-Yunnan block (SYB), and reaches the western part of the Qiangtang block (QTB). The northeastern end of the line is located at Chazha Township (C) in Ganzi County, Sichuan Province, and extends to Luomai Township (M) in Gongjue County, Tibet Autonomous Region, with a total length of approximately 220 km at an angle of 30° northeast. There are 17 survey points in total. The survey line successively crosses the Ganzi-Litang fault (GL), the Dalangsonggou fault (DLSG), the Maisu fault (MS), a branch of the Jinshajiang fault zone (JSJ), the Dedeng-Batang-Riyu fault (DBR), another branch of the Jinshajiang fault zone, and the Zigasi-Deqin fault (ZD) (Figure 1).
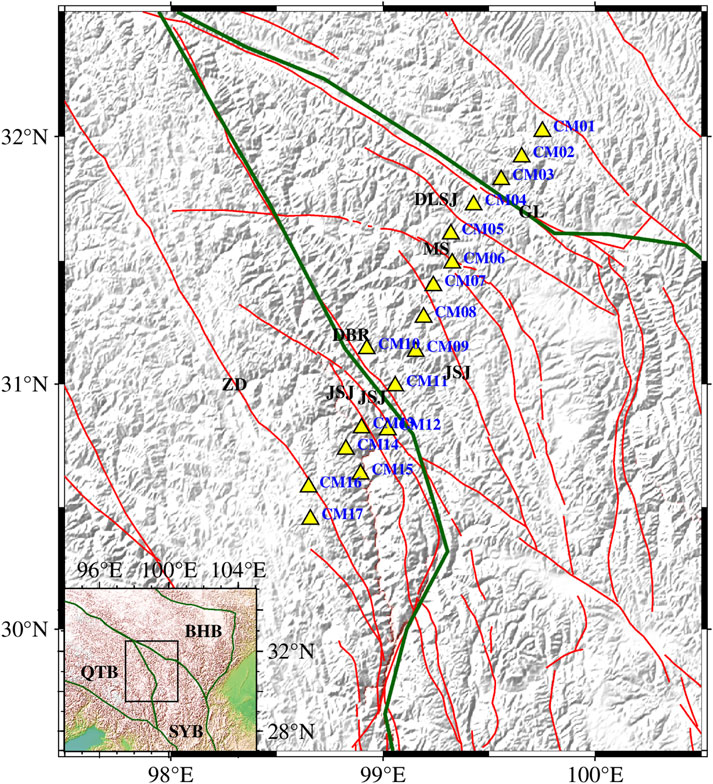
Figure 1. Locations of the magnetotelluric (MT)survey points. Yellow triangles represent the MT survey locations, with blue labels for point names, green lines marking block boundaries (Zhang et al., 2003), and red lines indicating active faults (Xu et al., 2016). ZD, Zigasi-Deqin Fault; JSJ, Jinshajiang Fault Zone; DBR, Dedeng-Batang-Riyu Fault; MS, Maisu Fault; DLSG, Dalangsonggou Fault; GL, Ganzi-Litang Fault Zone; BHB, Bayan Har block; QTB, Qiangtang block; SYB, Sichuan-Yunnan block.
3 Data and qualitative analysis
3.1 Field data collection and processing
Data for this study was collected in October 2020 using the MTU-5A magnetotelluric acquisition system from Phoenix Geophysical, Canada. The data acquisition involved a five-component setup (two orthogonal horizontal electric fields, two orthogonal horizontal magnetic fields, and one vertical magnetic field), with horizontal components aligned along the true north-south and east-west directions. A broad frequency band was used for MT observations: high frequency at 2,400 Hz, mid-frequency at 150 Hz, and low frequency at 15 Hz. To ensure data quality, a remote reference station was set up 1,050 km away in Otog Front Banner, Inner Mongolia Autonomous Region (107°49′40.31″N, 38°1′27.33″E), which offered an ideal electromagnetic environment with minimal human interference. Each site collected data for over 40 h and applied remote reference techniques (Gamble et al., 1979b; Gamble et al., 1979a) and non-Robust techniques (Zhang et al., 2022) for time series processing. The apparent resistivity and phase curves for each site were generally smooth, indicating high data quality, with most sites covering an effective period range of 1/320 s–2000 s, specially, CM06, CM08, and CM17 had an effective period reaching nearly 10,000 s (Figure 2).
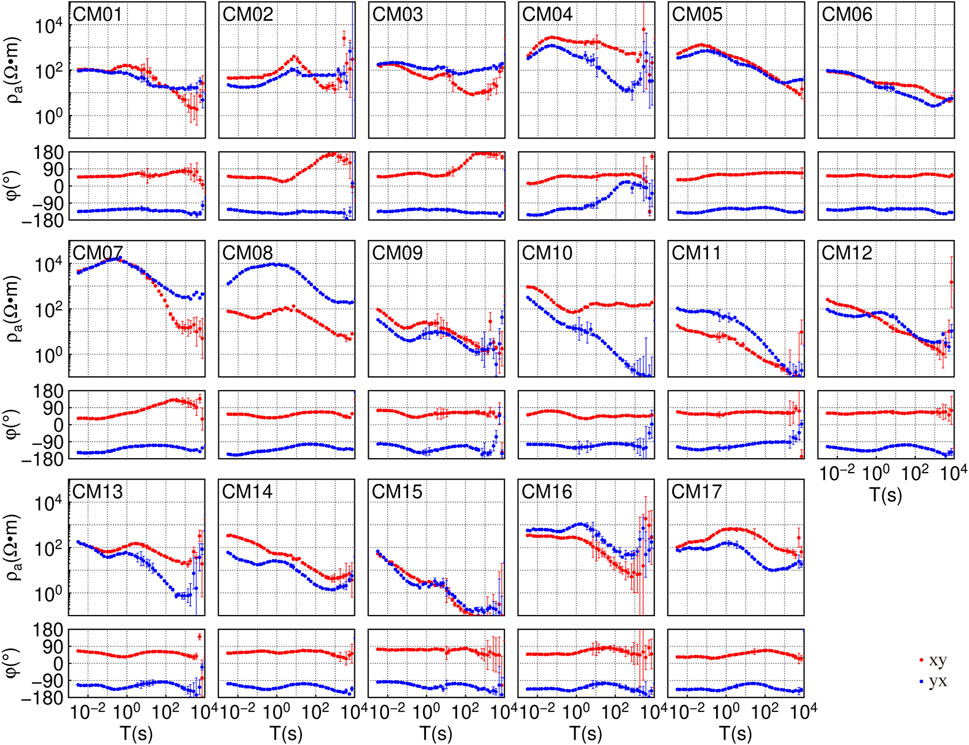
Figure 2. Apparent resistivity and impedance phase curves.
The apparent resistivity and impedance phase curves for each site preliminarily reveal differences in the electrical structure within the three distinct tectonic units: the southern edge of the Bayan Har block, the northwest sector of the Sichuan-Yunnan diamond block, and the western margin of the Qiangtang block. As shown in Figure 2, site CM01, located within the Bayan Har block, exhibits overlapping apparent resistivity curves in both polarization directions at high frequencies, with minimal variation. From mid to low frequencies, the apparent resistivity curves diverge and cross again, indicating a simple shallow structure and a more complex deep structure. Sites CM02 to CM04, located in the contact zone between the Bayan Har block and the Sichuan-Yunnan diamond block, display out of quadrant phases phenomena at low frequencies. Specifically, CM02 and CM03 exhibit quadrant-exceeding phases in the xy polarization, while CM04 exhibits this phenomenon in the yx polarization, suggesting that the Ganzi-Litang fault between CM03 and CM04 may serve as the boundary fault and that the deep contact relationship between these two blocks is complex. Other sites located between the Sichuan-Yunnan diamond block and the Qiangtang block exhibit high-frequency high-resistivity and low-frequency low-resistivity characteristics, though the specific curve shapes vary, indicating that the overall electrical structure of the Sichuan-Yunnan diamond block and the Qiangtang block consists of a shallow high-resistivity and a deep high-conductivity. The boundary between these blocks cannot be determined from the apparent resistivity curves alone, and details require inversion analysis.
3.2 Structural dimensionality analysis
Figure 3 illustrates the real tipper vector diagram of the CM profile, which is a new method for depicting the tipper vector orientation. The direction of the tipper’s real vector aligns with the real induction vector, typically pointing from high resistivity to low resistivity. The size of the vector’s tail indicates the size of the imaginary induction vector; however, the physical significance of this feature requires further investigation. The color-filled areas represent the arithmetic average of the two main phases (Pxy, Pyx), in general, a higher arithmetic average of the phase (closer to red) corresponds to low resistivity, and vice versa for high resistivity (closer to blue). From Figure 3, it can be seen that low resistivity is present beneath points CM17, CM14-CM12, and CM10-CM08. Most of the faults in the survey area strike NW, and the profile is oriented to the NE. The real induction vector points in different directions, and some are opposite to one another. Therefore, 2D inversion is not applicable for this profile.
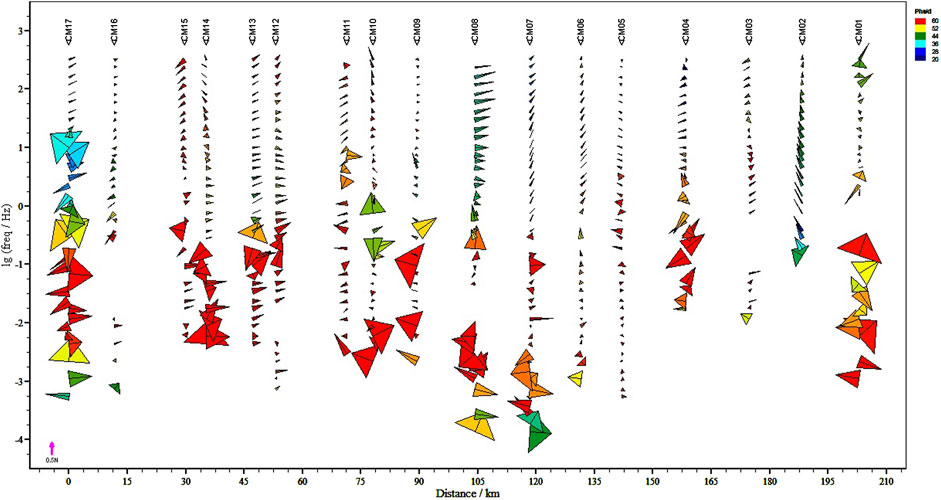
Figure 3. Tipper vector paper airplane diagram. The vector direction corresponds to the real induction vector, and the opening size of the tail represents the magnitude of the imaginary induction vector. The color filling indicates the arithmetic average of the main phase values.
The impedance tensor decomposition double rhombus diagram is a new analytical technique for constructing dimensionality analysis. In Figure 4, the rhombus is defined by the 1D deviation, 2D deviation, and the orientation of the best principal axis. The 1D deviation is represented by the long axis of the rhombus, the 2D deviation by the short axis, and the orientation of the best principal axis is the same as that of the long axis. Due to a 90° ambiguity in the orientation of the best principal axis, an orthogonal double rhombus is used to eliminate this ambiguity. A small double rhombus indicates strong one-dimensionality, while a large double rhombus approaching a cross shape indicates strong two-dimensionality. A large double rhombus nearing a circular shape suggests strong three-dimensionality. The color filling follows the same pattern as in Figure 3. From the diagram, it is observed that the shallow area are dominated by 1D and 2D structures, while the 3D structure is generally enhanced in the low-frequency range. In the northeastern part of the study area, specifically at the measurement points (CM01-CM06) located at the northern section of the Baren Kalla Block and the northwest sector of the Sichuan-Yunnan Diamond Block, the shallow area are mainly one-dimensional and two-dimensional, while the deep area show enhanced three-dimensionality, indicating differences between the shallow and deep area. At the measurement points CM07-CM15, the low-frequency part remains dominated by three-dimensionality, while the medium and high frequencies exhibit alternating complex features of three-dimensional and non-three-dimensional characteristics between adjacent measurement points.
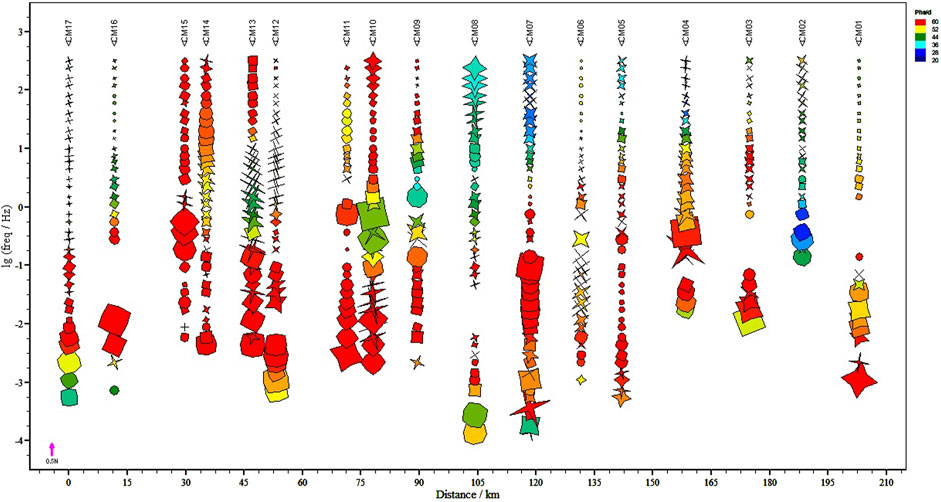
Figure 4. The impedance tensor decomposition double rhombus diagram. The long axis of the rhombus represents the one-dimensional deviation, the short axis represents the two-dimensional deviation, and the color filling is consistent with that in Figure 3.
By analyzing the apparent resistivity phase curves and structural dimensionality, qualitative information about the dimensionality and electrical distribution of deep structures can be obtained. More accurate quantitative information about the deep electrical structure requires inversion. The data we collected are from survey profile, where the faults and blocks intersect near-perpendicular to the survey profile. In most cases, 2D inversion would suffice; however, the data analysis above indicates that this survey profile is not suitable for 2D inversion. The main reasons are as follows: The deep structure exhibit pervasive three-dimensionality. Performing a 2D inversion with a unified principal axis orientation could introduce false structures, particularly when including the TE polarization mode, which would significantly distort the results from the true model (Cai et al., 2010). The survey profile has only 17 measurement points, and there is poor continuity in the electrical principal axes between adjacent points. Additionally, there is no consistent principal axis direction between high and low frequencies at the same point, making frequency-band or segment-based two-dimensional inversion unsuitable (Guo and Chen, 2018). CM02, CM03, CM04, and CM07 all exhibit phase over-quadrant phenomena, which typically occur in three-dimensional or anisotropic two-dimensional media. Conventional isotropic two-dimensional inversion cannot fit phase over-quadrant data (Lezaeta and Haak, 2003). Both theoretical model testing (Siripunvaraporn et al., 2005) and inversion of field data (Jiang et al., 2019) have demonstrated that 3D inversion of single-profile data can resolve local fault structures and even provide clearer deep information than 2D inversion. Therefore, this study selects 3D inversion techniques, more suited to the observed data characteristics, for subsequent inversion work.
4 Three-dimensional inversion
Traditional inversion grids generally align with the data observation direction, and there is no need to consider data rotation during the inversion process. However, for datasets like the one in this study, where the survey line direction (not oriented exactly north-south) differs from the observation direction (true north-south), conventional grid subdivision methods may result in grid cells in the two corners of missing measurement points, where the data do not constrain the model. These regions are not part of the target area and contribute to unnecessary computational resource waste. While rotating the grid or survey line to match the observation direction can avoid grid waste, it still presents the issue of misalignment between grid and observation directions. Previous methods involve rotating the observed data to align with the grid direction before inversion. However, rotating the observed data carries certain risks, as the rotated data may degrade. This study adopts a new approach of rotating the model response to match the observation data (Liu et al., 2024). After each forward modeling step, the result is rotated to match the direction of the observation data, ensuring high-quality grid subdivision while also optimizing the fitting of high-quality data in the observation direction.
In the horizontal direction, the core region grid size is 3.5 km × 3.5 km, with 59 grids along the survey profile direction and 9 grids in the perpendicular direction. Outside the core region, both directions extend by a factor of 1.5 for 11 additional grids, with the maximum grid size reaching 200 km × 200 km. The terrain in the study area is highly variable, with height differences between measurement points reaching up to 0.5 km. To adequately fit the terrain, the vertical terrain grid is set at 50 m with 12 layers. The terrain grid for the core region is constructed based on actual terrain data, while the terrain for the non-core region is extended parallelly outward from the core region boundary. Below the terrain grid, the grid thickness increases gradually by a certain factor, extending downward, with a maximum grid thickness of 50 km. The final model grid size is 31 × 81 × 80 (Figure 5).

Figure 5. Plan view of the 3D inversion grid. From left to right are sites 17 to 1.
We choose apparent resistivity and phase data (RP) for inversion, rather than the full impedance data (Z4) or full impedance dipoles (ZT) commonly used in previous studies. Newman et al. found that because the xx and yy element data have lower baselines and signal-to-noise ratios, using full impedance data combinations for inversion can reduce inversion performance (Newman et al., 2008). Current understanding of the characteristics of the main diagonal elements of impedance, is still unclear, and the criteria for evaluating data quality are vague. Compared to full impedance or full impedance tipper data, apparent resistivity and phase data are more stable in quality, with clearer criteria for selecting data for inversion. Increasingly, scholars have chosen to use resistivity and phase data for inversion (Cai et al., 2017; Fan et al., 2022; Cai et al., 2023; Cui et al., 2024).
The inversion calculations are performed in the visualization-based 3D magnetotelluric inversion software system ToPeak (Liu et al., 2022b). Initially, a model with a resistivity of 100 Ω·m is constructed, incorporating topographic data, with an initial regularization factor of 1,000. During the inversion process, when the relative change in the root mean square error (RMS) of the fit falls below 0.25%, the regularization factor is reduced by a factor of 0.2. The inversion stops when the regularization factor is less than 10−8. The initial inversion is exited after 78 iterations, and the RMS is 3.4. Following this, the model undergoes a “fill-hole and peak-cutting” reconstruction, limiting areas of excessively high or low resistivity within a certain range. Specifically, the contours of anomalous resistivity regions from the previous inversion results are retained. The extreme resistivity values in these anomalous regions are replaced with the surrounding resistivity values to construct a new initial model for the subsequent inversion. By doing so, the new initial model based on the existing inversion results avoids focusing excessively on local details, thereby reducing the risk of overfitting. This reconstructed model then serves as the starting model for further inversion, improving the reliability and stability of the results. After several reconstruction iterations, the final inversion consists of 212 iterations with an RMS of 0.729.
5 Result and verification
5.1 Inversion result
The vertical profile of the inversion results is shown in Figure 6. Large-scale high-conductivity bodies, C1 and C2, are present in the middle to upper crust within the Qiangtang Block and the Sichuan-Yunnan diamond block. C1 is located at depths of approximately 5 km–20 km and extends laterally for about 70 km. It has a generally eastward-low and westward-high configuration, with a weak zone beneathCM15. C2 is located at depths of approximately 10 km–30 km and extends over 100 km laterally in a “spoon” shape, with the “handle” being narrow and extending from CM01 to the surface. Above these high-conductivity bodies, there is significant electrical heterogeneity, and the regions above the high-conductivity bodies are consistent with data qualitative analysis. Below the high-conductivity bodies, there is a homogeneous half-space with a resistivity close to 100 Ω·m, consistent with the initial model’s resistivity.
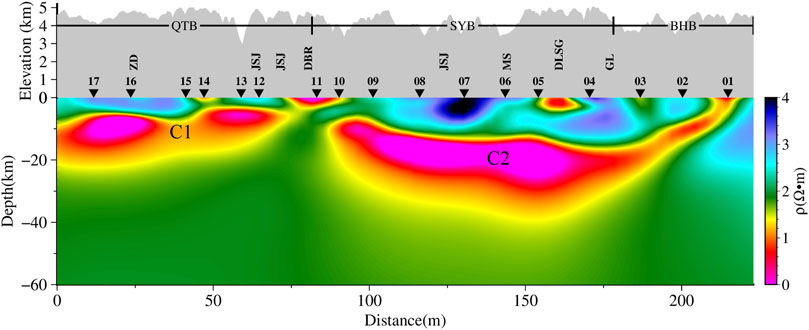
Figure 6. The vertical profile of the inversion results.
5.2 Verification
To assess the reliability of the inversion results and determine whether the observation data can constrain the structure beneath the high-conductivity bodies, we performed a forward modeling verification. First, we validated the high-conductivity bodies C1 and C2 by erasing the high-conductivity parts of C1 and C2 and replacing them with 20 Ω·m. The corrected model was then used for forward modeling calculations (Figures 7A, B), and the RMS was recalculated (Figure 7F). From the figure, it is clear that the RMS of the measurement points above the corrected model increases significantly, indicating that the high-conductivity bodies are constrained by the data, thus confirming the existence of the high-conductivity bodies as reliable.
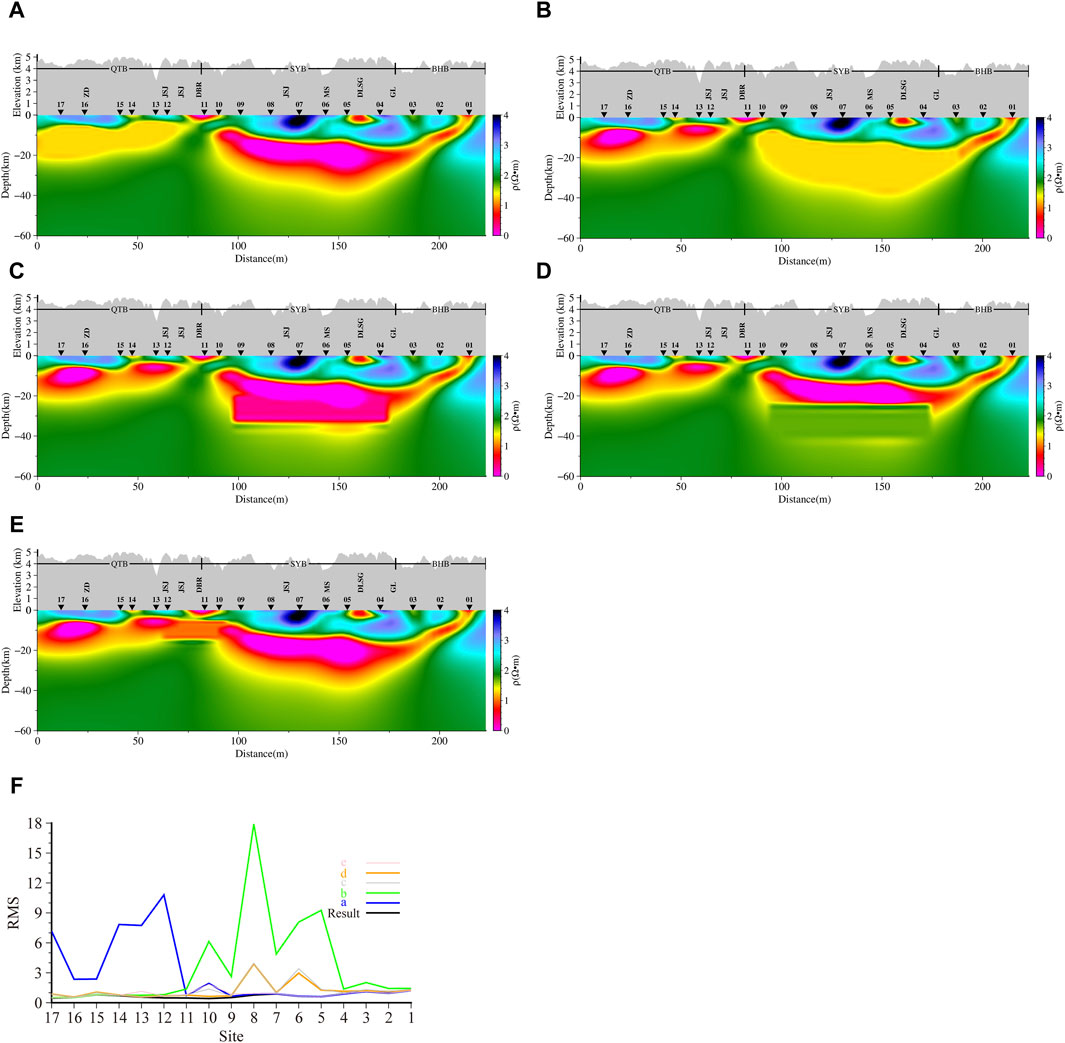
Figure 7. Reliability verification of inversion results. (A) C1, (B) C2, (C) downward extension of C2, (D) upward extension of high-resistivity body below C2, (E) C1&C2 connectivity, (F) abcde model RMS.
Next, we verified whether the bottom boundary of the C2 structure is constrained by the data. Typically, the resolution below high-conductivity bodies is lower. We extended the C2 high-conductivity body downward by 10 km (Figure 7C) and performed forward modeling with the modified model, recalculating the RMS to obtain Figure 7F. Subsequently, we extended the high-resistivity region beneath C2 upward by 10 km (Figure 7D) and recalculated the RMS (Figure 7F). It can be observed that the RMS values above the modified model increase, which suggests that the bottom boundary of the high-conductivity body is constrained by the data, confirming the reliability of the high-conductivity layer’s thickness.
Finally, we verified the connectivity between the two high-conductivity bodies, C1 and C2. Again, we filled the area between them with 10 Ω·m grids (Figure 7E), and the calculated RMS is shown in Figure 7F. It is evident that the RMS of the measurement points above and around the modified model increases significantly, proving that the high-conductivity bodies C1 and C2 are not connected.
6 Discussion
We believe that the boundary region between high-conductivity bodies C1 and C2 is the northwest electrical boundary of the Sichuan-Yunnan Diamond Block, located at the Dedeng-Batang-Riyu fault. The thickness of C1 is approximately 15 km, and C2 is about 20 km, which differs from the findings of Bai et al. (2010). Bai et al. suggested that there is a lower crustal material flow in the eastern Tibetan Plateau and provided MT evidence for plateau uplift and crustal deformation. Through theoretical calculations, they proposed two weak material flows in the middle to lower crust: one extends eastward from the Lhasa block along the Yarlung Zangbo suture zone, turns south around the eastern Himalayas, and eventually passes through the Tengchong volcanic area; the other extends eastward from the Qiangtang block along the Jinshajiang fault Zone and the Xianshuihe fault zone, turns south at the western edge of the Sichuan Basin, and finally passes through the Sichuan-Yunnan diamond block between the Xiaojiang fault and the Honghe fault (Bai et al., 2010). Due to the limitations of MT inversion techniques at the time, previous studies only employed 2D inversion techniques, but 2D inversion has limited ability to identify the lower boundary of high-conductivity bodies. In contrast, modern 3D inversion techniques have significantly improved the vertical resolution of MT inversion. The 3D inversion results indicate that there is a high-conductivity layer within the Sichuan-Yunnan diamond block, with a thickness of only 20 km, which is insufficient to drive material outflow. This high-conductivity layer acts as a decoupling surface, a view consistent with the rigid material extrusion model (Tapponnier et al., 2001). As the upper-middle crust escapes toward the exterior of the plateau, the driving force originates from within the plateau itself, and the weak material flow is not the source of force. We speculate that the weak material layer is merely a “transition surface” where the upper and lower crust move in opposite directions.
7 Conclusion
Based on the MT profile data from the northwest sector of the Sichuan-Yunnan diamond block, a nonlinear conjugate gradient-based 3D inversion with terrain was performed. We conclude that the northwest electrical boundary of the Sichuan-Yunnan block is Dedeng-Batang-Riyu fault. There is a high-conductivity layer within Sichuan-Yunnan block, but it is shallow and does not reach the lower crust. Future studies are hoped to expand MT work in the northwest region of the Sichuan-Yunnan block.
Data availability statement
The raw data supporting the conclusions of this article will be made available by the authors, without undue reservation.
Author contributions
YZ: Data curation, Investigation, Validation, Visualization, Writing–original draft, Writing–review and editing. XC: Funding acquisition, Investigation, Methodology, Resources, Software, Supervision, Validation, Writing–review and editing. PW: Investigation, Writing–review and editing. JC: Writing–review and editing. ZL: Software, Writing–review and editing. JZ: Writing–review and editing. XH: Writing–review and editing.
Funding
The author(s) declare that financial support was received for the research, authorship, and/or publication of this article. This work is supported by the National Natural Science Foundation of China (42174093), the Fundamental Scientific Research Project of National Institute of Natural Hazards, Ministry of Emergency Management of China (ZDJ2019-26), and the Fundamental Scientific Research Project of National Institute of Natural Hazards, Ministry of Emergency Management of China (ZDJ2020-13).
Acknowledgments
We would like to thank Dr. Xingbing Xie, Dr. Yurong Mao and Dr. Lei Zhou and others who helped with the MT data acquisition in the field.
Conflict of interest
The authors declare that the research was conducted in the absence of any commercial or financial relationships that could be construed as a potential conflict of interest.
Generative AI statement
The author(s) declare that Generative AI was used in the creation of this manuscript. Optimized English expression.
Publisher’s note
All claims expressed in this article are solely those of the authors and do not necessarily represent those of their affiliated organizations, or those of the publisher, the editors and the reviewers. Any product that may be evaluated in this article, or claim that may be made by its manufacturer, is not guaranteed or endorsed by the publisher.
References
Bai, D., Unsworth, M. J., Meju, M. A., Ma, X., Teng, J., Kong, X., et al. (2010). Crustal deformation of the eastern Tibetan plateau revealed by magnetotelluric imaging. Nat. Geosci. 3, 358–362. doi:10.1038/ngeo830
Bao, X. W., Sun, X. X., Xu, M. J., Eaton, D. W., Song, X. D., Wang, L. S., et al. (2015). Two crustal low-velocity channels beneath SE Tibet revealed by joint inversion of Rayleigh wave dispersion and receiver functions. Earth Planet. Sci. Lett. 415, 16–24. doi:10.1016/j.epsl.2015.01.020
Cai, J. T., Chen, X. B., and Zhao, G. Z. (2010). Refined techniques for data processing and two-dimensional inversion in magnetotelluric I: tensor decomposition and dimensionality analysis. Chin. J. Geophys. 53, 2516–2526. doi:10.3969/j.issn.0001-5733.2010.10.025
Cai, J., Chen, X., Dong, Z., Zhan, Y., Liu, Z., Cui, T., et al. (2023). Three-dimensional electrical structure beneath the epicenter zone and seismogenic setting of the 1976 Ms7.8 tangshan earthquake, China. Geophys. Res. Lett. 50, e2022GL102291. doi:10.1029/2022gl102291
Cai, J., Chen, X., Xu, X., Tang, J., Wang, L., Guo, C., et al. (2017). Rupture mechanism and seismotectonics of the s6.5 Ludian earthquake inferred from three-dimensional magnetotelluric imaging. Geophys. Res. Lett. 44, 1275–1285. doi:10.1002/2016gl071855
Cheng, Y., Tang, J., Chen, X., Dong, Z., Xiao, Q., and Wang, L. (2015). Electrical structure and seismogenic environment along the border region of Yunnan, Sichuan and Guizhou in the south of the North-South seismic belt. Chin. J. Geophys. 58, 3965–3981. doi:10.6038/cjg20151107
Cui, T. F., Chen, X. B., Fan, Y., Liu, Z. Y., and Li, W. Q. (2024). Branched crustal flow and its dynamic significance in sanjiang area, eastern Tibetan plateau--insights from 3-D magnetotelluric imaging. J. Geophys. Research-Solid Earth 129, 16. doi:10.1029/2024jb028678
Cui, X. F., Xie, F. R., and Zhang, H. Y. (2006). Division of modern tectonic stress fields and their dynamic significance in the Sichuan-Yunnan region. Acta Seismol. Sin. 28, 451–461. doi:10.3321/j.issn:0253-3782.2006.05.001
Deng, Q., Zhang, P., Ran, Y., Yang, X., Min, W., and Chu, Q. (2002). Basic characteristics of activity structure in China. Sci. China Ser. D-Earth Sci. 32, 1020–1031. doi:10.3969/j.issn.1674-7240.2002.12.007
Fan, Y., Chen, X. B., Tang, J., Cui, T. F., Sun, X. Y., Wang, P. J., et al. (2022). Three-dimensional modelling of magnetotelluric data from the hefei-suqian segment of the tanlu Fault Zone, eastern China. Chin. J. Geophys. 65, 1336–1353. doi:10.6038/cjg2022P0682
Gamble, T. D., Goubau, W. M., and Clarke, J. (1979a). Error analysis for remote reference magnetotellurics. Geophysics 44, 959–968. doi:10.1190/1.1440988
Gamble, T. D., Goubau, W. M., and Clarke, J. (1979b). Magnetotellurics with a remote magnetic reference. Geophysics 44, 53–68. doi:10.1190/1.1440923
Guo, C. L., and Chen, X. B. (2018). Refined processing and two-dimensional inversion of Magnetotelluric (MT) data(VI) Two-dimensional magnetotelluric inversion based on the staggered model. Chin. J. Geophys. 61, 2548–2559. doi:10.6038/cjg2018K0244
Guo, X., Fang, L., Han, L., Li, C., and Su, S. (2024). Characteristics of focal mechanism and stress field in the eastern boundary of the Sichuan-Yunnan block. Seismol. Geol. 46, 371–396. doi:10.3969/j.issn.0253-4967.2024.02.008
Jiang, F., Chen, X., Dong, Z., Cui, T., Liu, Z., and Wang, P. (2019). Applying 3D inversion of single-profile magnetotelluric data to identify the Shade and Yunongxi faults. Seismol. Geol. 41, 1444–1463. doi:10.3969/j.issn.0253-4967.2019.06.009
Kan, R., Zhang, S., Yan, F., and Yu, L. (1977). Present tectonic stress field and its relation to the characteristics of recent tectonic activity in southwestern china. Chin. J. Geophys. 20, 96–109.
Lezaeta, P., and Haak, V. (2003). Beyond magnetotelluric decomposition: induction, current channeling, and magnetotelluric phases over 90°. J. Geophys. Research-Solid Earth, 108. doi:10.1029/2001jb000990
Liu, Z. Y., Kelbert, A., and Chen, X. B. (2024). 3D magnetotelluric inversion with arbitrary data orientation angles. Comput. and Geosciences 188, 105596. doi:10.1016/j.cageo.2024.105596
Liu, X., Zhang, F., Ma, L., and Li, L. (2022a). Current strain accumulation characteristics and the risk of strong earthquakes on the eastern boundary of the Sichuan-Yunnan Block. J. Geodesy Geodyn. 42, 687–693. doi:10.14075/j.jgg.2022.07.005
Liu, Z., Chen, X., Cai, J., Cui, T., Zhao, G., Tang, J., et al. (2022b). The design and application of topeak: a threedimensional magnetotelluric inversion cloud computing system. Seismol. Geol. 44, 802–820.
Li, X., Ma, X. B., Chen, Y., Xue, S., Varentsov, I. M., and Bai, D. H. (2020). A plume-modified lithospheric barrier to the southeastward flow of partially molten Tibetan crust inferred from magnetotelluric data. Earth Planet. Sci. Lett. 548, 116493. doi:10.1016/j.epsl.2020.116493
Lv, Y., Liao, H., Su, Q., and Wang, L. (2002). The recent crustal deformation in Sichuan-Yunnan Rhombic block boundary. Earthq. Res. China 18, 28–37. doi:10.3969/j.issn.1001-4683.2002.01.003
Newman, G. A., Gasperikova, E., Hoversten, G. M., and Wannamaker, P. E. (2008). Three-dimensional magnetotelluric characterization of the Coso geothermal field. Geothermics 37, 369–399. doi:10.1016/j.geothermics.2008.02.006
Shen, Z. K., Lü, J. N., Wang, M., and BüRGMANN, R. (2005). Contemporary crustal deformation around the southeast borderland of the Tibetan Plateau -: art. no. B11409. J. Geophys. Research-Solid Earth 110. doi:10.1029/2004jb003421
Siripunvaraporn, W., Egbert, G., Lenbury, Y., and Uyeshima, M. (2005). Three-dimensional magnetotelluric inversion: data-space method. Phys. Earth Planet. Interiors 150, 3–14. doi:10.1016/j.pepi.2004.08.023
Sun, J., Jin, G., Bai, D., and Wang, L. (2003). Sounding of electrical structure of the crust and upper mantle along the eastern border of Qinghai-Tibet Plateau and its tectonic significance. Sci. China Ser. D Earth Sci. 46, 243–253. doi:10.1360/03dz0019
Tapponnier, P., Peltzer, G., Ledain, A. Y., Armijo, R., and Cobbold, P. (1982). Propagating extrusion tectonics in asia - new insights from simple experiments with plasticine. Geology 10, 611–616. doi:10.1130/0091-7613(1982)10<611:petian>2.0.co;2
Tapponnier, P., Xu, Z., Roger, F., Meyer, B., Arnaud, N., Wittlinger, G., et al. (2001). Oblique stepwise rise and growth of the Tibet plateau. Science 294, 1671–1677. doi:10.1126/science.105978
Wu, F., Jiang, L., Zhang, G., and Wang, D. (2019). Discussion on quaternary activity characteristics of northern section of Jinshajiang Fault Zone along sichuan-tibet railway. High. Speed Railw. Technol. 10, 23–28. doi:10.12098/j.issn.1674-8247.2019.04.005
Xu, X., Han, Z., Yang, X., Zhang, S., Yu, G., Zhou, B., et al. (2016). Seismotectonic map in China and its adjacent regions. Beijing: Seismological Press.
Xu, X., Zhang, P., Wen, X., Qin, Z., Chen, G., and Zhu, A. (2005). Features of active tectonics and recurrence behaviors of strong earthquakes in the western Sichuan province and its adjacent regions. Seismol. Geol. 27, 446–461. doi:10.3969/j.issn.0253-4967.2005.03.010
Xu, Z., Hou, L., Wang, Z., Fu, X., and Wang, D. (1992). Orogenic process of the Songpan-Ganzi orogenic belt in China. Beijing: Geology Press.
Yang, Y., Yao, H. J., Wu, H. X., Zhang, P., and Wang, M. M. (2020). A new crustal shear-velocity model in Southwest China from joint seismological inversion and its implications for regional crustal dynamics. Geophys. J. Int. 220, 1379–1393. doi:10.1093/gji/ggz514
Yu, N., Unsworth, M., Wang, X., Li, D., Wang, E., Li, R., et al. (2020). New insights into crustal and mantle flow beneath the Red River fault zone and adjacent areas on the southern margin of the Tibetan plateau revealed by a 3-D magnetotelluric study. J. Geophys. Res. Solid Earth 125. doi:10.1029/2020jb019396
Zhang, P. Z., Shen, Z., Wang, M., Gan, W. J., BüRGMANN, R., Molnar, P., et al. (2004). Continuous deformation of the Tibetan Plateau from global positioning system data. Geology 32, 809–812. doi:10.1130/g20554.1
Zhang, P., Deng, Q., Zhang, G., Ma, J., Gan, W., Min, W., et al. (2003). Strong seismic activity and active faults in mainland China. Sci. China Ser. D-Earth Sci. 33, 12–20.
Zhang, Y., Wang, P., Chen, X., Zhan, Y., Han, B., Wang, L., et al. (2022). Magnetotelluric time series processing in strong interference environment. Seismol. Geol. 44, 786–801. doi:10.3969/j.issn.0253-4967.2022.03.014
Keywords: magnetotelluric, Sichuan-Yunnan diamond block, three-dimensional inversion, electrical boundary, upper-middle crust
Citation: Zhang Y, Chen X, Wang P, Cai J, Liu Z, Zhang J and Huang X (2025) Three-dimensional electrical structure in the northwestern sector of the Sichuan-Yunnan diamond block. Front. Earth Sci. 12:1527559. doi: 10.3389/feart.2024.1527559
Received: 13 November 2024; Accepted: 31 December 2024;
Published: 22 January 2025.
Edited by:
Bo Yang, Zhejiang University, ChinaReviewed by:
Nian Yu, Chongqing University, ChinaShan Xu, China University of Geosciences Wuhan, China
Copyright © 2025 Zhang, Chen, Wang, Cai, Liu, Zhang and Huang. This is an open-access article distributed under the terms of the Creative Commons Attribution License (CC BY). The use, distribution or reproduction in other forums is permitted, provided the original author(s) and the copyright owner(s) are credited and that the original publication in this journal is cited, in accordance with accepted academic practice. No use, distribution or reproduction is permitted which does not comply with these terms.
*Correspondence: Xiaobin Chen, Y3hiQHBrdS5lZHUuY24=