- 1College of Geology and Environment, Xi’an University of Science and Technology, Xi’an, China
- 2Shaanxi Provincial Key Laboratory of Geological Support for Coal Green Exploitation, Xi’an, China
Introduction: With the increased application of super-long working faces in coal mining, the surface movement and crack development laws of super-long working faces present an urgent problem to be studied and solved. This study aimed to determine the surface movement and crack development laws of super-long working faces when mining medium-depth buried coal seams.
Methods: The research area in Xiaobaodang No. 2 coal mine, China, was the adjacent working faces 01, 02 and 03, with inclination widths of 300 m and 450 m, respectively. The laws were determined by applying methods such as manual surface movement observation, GNSS automatic surface movement observation, surface crack observation, and crack morphology tracing.
Results: Compared to the working face with an inclination width of 300 m, the maximum subsidence, maximum horizontal movement value, and maximum subsidence coefficient of the super-long working face with an inclination width of 450 m increased by 15.31%, 4.56%, and 16.13%, respectively. Under the influence of mining the 02 working face, the maximum subsidence of the 01 working face increased by 15% and the surface subsidence patterns of the 01 and 02 working face inclination observation lines showed an asymmetric W shape.
Discussion: The widths of the cracks parallel to the open-off cut followed the dynamic development law of opening first, then closing or semi-closing. The widths of the cracks parallel to grooves followed the dynamic development law of opening first, then remaining open. The study results are important to protect mining buildings and the ecological environment.
1 Introduction
The lack of gas and oil but comparatively abundant coal in China indicates that coal is the country’s primary energy source (Shang et al., 2017). Coal resources in western China account for more than 70% of its total coal resources, and the northern Shaanxi coal mining area has become a billion-ton coal production base (Bai et al., 2018; Zhang et al., 2023). Coal mining frequently causes ecological and environmental problems such as land destruction, soil erosion, and building and road destruction in coal mining areas to varying degrees (Qiao et al., 2017; Guo Q. L. et al., 2019; Zha and Xu, 2019; Song et al., 2021). Those are due mainly to mining destroying the rock strata overlying the working face and the surface movement above the working face. The primary damage from surface movement and deformation is both surface subsidence and surface cracking. Surface movement and deformation, as well as surface cracks, are caused by the movement and destruction of the rock strata overlying the mined-out area (Yi et al., 2022; Yan et al., 2023). Their laws are influenced by a combination of geological and mining factors (Guo W. B. et al., 2019; Dudek et al., 2022). Determining the laws of surface movement deformation and surface crack development from coal mining has an important theoretical significance and practical application value for preventing and controlling the problems of surface movement destruction.
The degrees of surface movement deformation and surface crack development are affected by various factors, such as the coal mining method, the mine depth and height, the inclination width of the working face, the structure of the rock and soil layers overlying the coal seam, and the mechanical strength of the coal seam. Therefore, it has become important to explore the characteristics, laws, and formation mechanisms of surface movement deformation and surface cracks under the conditions of several factors.
The most basic way to study surface movement and deformation is to establish a surface movement and deformation observation station for continuous on-site observation. Material and numerical simulations are also frequently used (Zhou et al., 2015; Prakash et al., 2018; Zhu et al., 2019). For the surface movement characteristics and laws for coal mining faces with various inclination widths, existing research has focused mainly on the surface movement and deformation above mining faces with inclination widths not more than 350 m. Guo et al. (2010) and Guo et al. (2011) analysed the surface subsidence characteristics of the 11,206 working face with its medium-depth buried thick coal seam and an inclination width of 170 m in Zhaojiazhai coal mine in Henan Province, China. Zhang B. C. et al. (2022) observed the surface subsidence of the 24,213 working face with its shallowly buried inclined coal seam, an inclination width of 180 m, and a mining height of 2 m in the 1930 coal mine in Xinjiang, China. Chen et al. (2019) observed and analysed the surface subsidence characteristics of the 52,305 working face with its deeply buried, thick coal seam, an inclination width of 280 m, and a mining height of 6.7 m in the Daliuta colliery in China’s Shendong coalfield. Zou et al. (2023) studied the surface movements of the 22,108 and 42,108 working faces with an inclination width of 300 m in the Buertai coal mine in China’s Shendong coalfield through on-site measurement and numerical simulation methods. Fu et al. (2021) monitored the surface subsidence of the S12013 working face with an inclination width of 330 m and a mining height of 4 m in the Ningtiaota coal mine in the northern Shaanxi province of China. Xie et al. (2021) studied the surface movements of the 112,201 working face with a deeply buried, thick coal seam and an inclination width of 350 m in the No.1 Xiaobaodang coal mine in the northern Shanxi province of China. These studies obtained surface movement characteristic parameters such as subsidence amount, subsidence coefficient, subsidence velocity, advance influence distance, and delay distance of maximum subsidence velocity through observation and analysis. Yin et al. (2022) analysed and predicted the surface movement characteristics of deeply buried Jurassic coal seam mining in the Hujierte mining area in western China and concluded that there was a certain positive correlation between the ratio of mining width to mining depth and the coefficients of subsidence.
On-site observation and mapping of surface cracks are standard methods for studying surface cracks. In recent years, UAV remote sensing technology has also been applied to surface crack research (Yang et al., 2022; Fu et al., 2023). Zhang Y. J. et al. (2022) observed surface cracks above the working face with its deeply buried coal seam, an inclination width of 180 m, and a mining height of 10 m in the gully terrain of a coal mine in the southern Shanxi province of China. Li et al. (2017) and Xu et al. (2017), Xu et al. (2019) observed surface cracks above the working face of the Bulianta coal mine in China’s Shendong coalfield, which had a medium-depth buried coal seam and an inclination width of 300 m. Feng et al. (2022) and Feng et al. (2023) observed characteristics of surface cracks width variation above the 125,203 working face in the gully terrain of Anshan coal mine in northern Shaanxi province of China, which had a shallow-depth buried coal seam and an inclination width of 270 m. Hou et al. (2021) observed surface cracks in the working face of the No.1 Xiaobaodang coal mine in China’s northern Shaanxi province, which had a medium-depth coal seam, an inclination width of 350 m, and a mining height of 5.8 m. These studies found that surface cracks caused by coal mining mainly included cracks inside the working face and cracks at the boundary of the working face. The width of cracks within the working face showed a characteristic of opening first, then closing, while the width of cracks at the working face boundary showed a characteristic of only opening and not closing. The width of surface cracks including its dynamic change in the loess gully region was greatly influenced by terrain, and the degree of surface cracks development was relatively strong. When the mining height of the medium-depth buried coal seam was 5.8 m, the depth of surface cracks development in the blown-sand region would not exceed 3.5 m.
In recent years, there have been many studies on the laws of surface movement deformation and surface crack development above working faces with inclination widths of less than 350 m. However, research is lacking on the laws of surface movement deformation and surface crack development in super-long working faces with inclination widths greater than 350 m. Since August 2021, a 450 m super-long working face was successfully mined in the No.2 Xiaobaodang coal mine, which improved coal production and economic benefits. The developers of many other coal mines have begun experimenting with super-long working face mining. The present study was done on the No. 2 Xiaobaodang coal mine in the aeolian (wind deposited) sand area of northern Shaanxi Province, China. It focused on the 01 working face with an inclination width of 300 m, the 02 super-long working face with an inclination width of 450 m and the 03 super-long working faces with an inclination width of 450 m. It explored the laws of surface movement deformation and surface crack development above the super-long working faces caused by mining medium-depth coal seams.
2 Study area and method
2.1 Study area
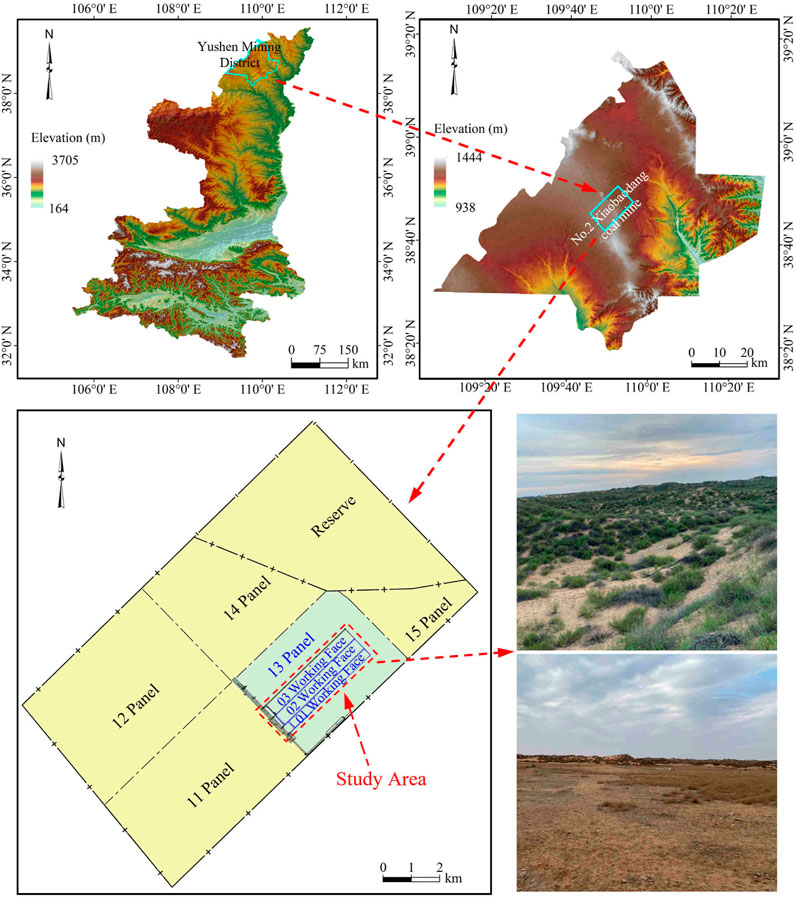
The study area was at the 01, 02 and 03 working faces of the 13 panel area of the Xiaobaodang No. 2 coal mine in the Yushen mining district in northern Shaanxi Province, China (Figure 1). Those working faces were adjacent, and their surface was covered by an aeolian sand layer. Based on borehole exploration data and stratigraphic maps, the stratigraphy of the study area from old to new groups was as follows: Jurassic Yan’an, Zhiluo, Anding, Neogene Pliocene Baode, and Quaternary. The attitude of strata in the study area was nearly horizontal, and the structure was simple without faults.
The 01, 02 and 03 working faces adopted a longwall retreating mining method, and the roof was managed by the all-caving mining method. The 01 working face was the first mining face in the 13 panel area, with an inclination width of 300 m and a strike length of 4,002 m. The 2−2 coal seam in that face was 311 m deep. Its thickness ranged from 1.60 to 2.60 m; the average thickness was 2.14 m. The 01 working face started mining at a mining height of 2.60 m from July 2020 to August 2021.
The 02 super-long working face was on the northwest side of the 01 working face, with an inclination width of 450 m and a strike length of 3,868 m. The 2−2 coal seam in that face was 312 m deep. Its thickness ranged from 1.70 to 3.60 m; the average thickness was 2.50 m. The 02 working face started mining at a mining height of 2.60 m from August 2021 to July 2022. The northwest side of the 02 working face was the 03 super-long working face with an inclination width of 450 m, which has the same geological and mining conditions as the 02 working face.
The burial depth of medium-depth coal seams was generally greater than 150 m and less than 600 m. The 2−2 coal seam mined in the study area was a medium-depth buried coal seam. In the 01, 02 and 03 working face, the coal seams were horizontally mined, with the mining characteristics of low mining height, medium mining depth and a mining depth to height ratio of approximately 120.
2.2 Methods
2.2.1 Design of manual surface movement observation stations
Manual observation comprises independent overall observation before mining, daily observation during mining, and observation of surface stabilisation after mining. First, the control points of the mining area and the observation line are connected so that measurement can determine the benchmark for surface subsidence and horizontal displacement observation. Then, independent overall observations are made, and the results are used as the benchmark for data processing. After that, daily observations and surface stability monitoring are done from the start of mining until the ground surface stabilises. In observation of surface movement, the instrument of real-time kinematic (RTK) was used for planar observation, and the instrument of electronic level was used for elevation observation. The error of plane measurement was controlled within 10 mm, and the error of elevation measurement was controlled within 3 mm. Surface movement observation stations are arranged in the form of strike observation lines and inclination observation lines.
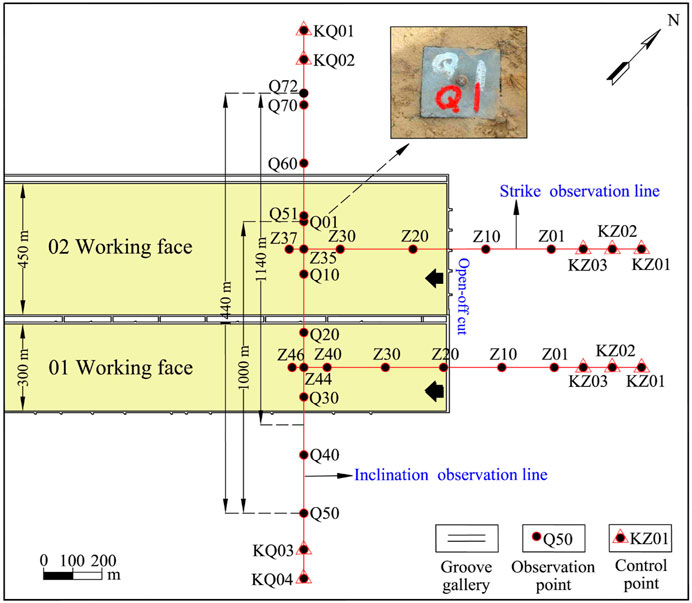
The strike observation line of the 01 working face was 900 m long, comprising 540 m on the inner side of the open-off cut and 360 m on its outer side. Along the strike observation line of the 01 working face, a total of 46 observation points numbered Z01 to Z46 were set up with a spacing of 20 m, and three control points numbered KZ01 to KZ03 were set up with a spacing of 100 m. The strike observation line of the 02 working face was 900 m long, comprising 550 m on the inner side of the open-off cut and 350 m on its outer side. Along the strike observation line of the 02 working face, a total of 37 observation points numbered Z01 to Z37 were set up with a spacing of 25 m, and three control points numbered KZ01 to KZ03 were set up with a spacing of 100 m. A same inclination observation line with a length of 1,420 m was used on the surface of working faces 01 and 02. That line was 500 m away from the open-off cut of the 01 and 02 working faces and perpendicular to the strike observation lines. Along the inclination observation line, 74 observation points were set up with a spacing of 20 m, including Q1 to Q72 points, Z44 point of the 01 strike observation line and Z35 point of the 02 strike observation line point. On the inclination observation line, there were four control points numbered KQ1 to KQ4 with a spacing of 100 m. The Q1 to Q50 points and Z44 point of the 01 strike observation line were used to observe the 01 working face surface movement in the inclination direction; the observation line composed of them was 1,000 m long. The Q1 to Q35 points, Q51 to Q72 points, Z44 point of the 01 strike observation line, and Z37 point (closed to Q6) of the 02 strike observation line were used to observe the 02 working face surface movement in the inclination direction; the observation line composed of them was 1,140 m long (Figure 2).
Before and after mining of the 01 working face, two independent overall observations and 52 daily observations and surface stability observations were made. Among them were included observations of the secondary surface movement affected by the mining of the 02 working face. Before and after mining of the 02 working face, two independent overall observations and 16 daily observations and surface stability observations were made (Supplementary Table S1).
2.2.2 Design of GNSS automatic surface movement observation stations
Global Navigation Satellite System (GNSS) automatic surface movement observation stations were based on the measurement principle of calculating the 3D coordinates of observation points by receiving signals from multiple satellites and using the time differences of the signals. Unlike manual observation stations, GNSS observation stations have the advantages of high frequency, many data collected, and greater accuracy in analysing the dynamic change characteristics of surface subsidence. The GNSS observation stations numbered ZK2 and ZK3 were installed in the centres of the 02 and 03 working faces surface respectively. The observation stations were 1,800 m away from the open-off cut and were set to obtain one set of surface movement data every 10 min (Figure 3).

Figure 3. Design of GNSS surface movement automatic observation stations for working faces 02 and 03.
2.2.3 Surface crack investigation methods
To study the development characteristics of surface cracks caused by super-long working face coal mining, manual on-site investigation, observation of surface crack width and drop changes, and excavation observations of surface crack development depths were adopted. The manual on-site investigation involved mainly investigating and mapping surface cracks’ location, length, width, and drop. The location of surface cracks was determined by real-time kinematic instruments. The length, width, and drop of surface cracks were measured using a small steel ruler. The steps to measure the dynamic changes in the width and drop of crack development were to spray-paint markings on crack monitoring points and measure them once a day. The steps to measure the depth of crack development included first injecting a mixed slurry of putty powder and water along the crack for tracing, then excavating manually or using an excavator, and finally observing and measuring.
The surfaces of working faces 01 and 02 were covered by aeolian sand, and the widths of the surface cracks were small. The actions of wind and rainwater erosion quickly buried them. Consequently, complete data of the dynamic evolution of surface crack widths of the 01 and 02 working faces were not obtained. Afterwards, surface crack observations were made near the open-off cut of the 03 working face. The development width and drop changes of 18 surface cracks were monitored, and relevant data on them were obtained. Among them, 11 surface cracks were grouted, traced, excavated, and observed, and their development depth data were obtained (Figure 4).
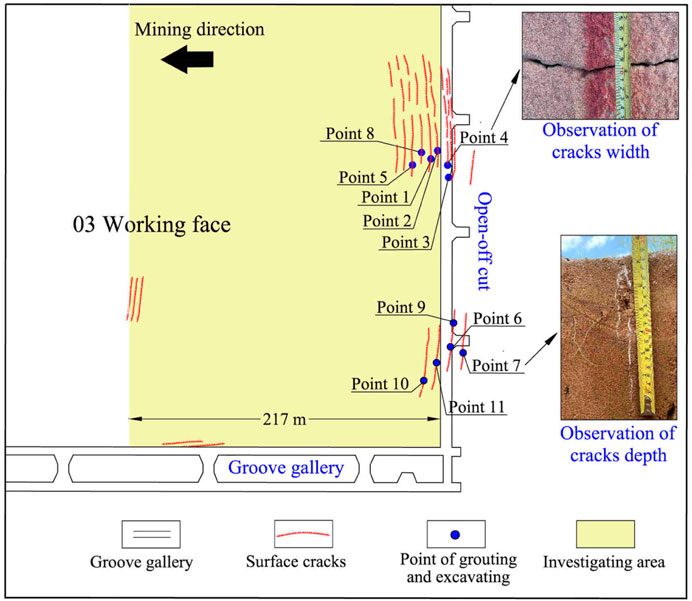
Figure 4. Distribution of observation points for surface crack width and depth near the open-off cut above the 03 working face.
3 Results
3.1 Surface movement characteristic parameters and laws of the 01 working face mining
3.1.1 Changes of subsidence along surface strike and inclination observation lines
Along the strike observation line, when the 01 working face was mined to 87 m, the surface above it began to be affected. Within the range of 40–100 m inside the open-off cut, namely from observation points Z21 to Z24, the surface subsidence reached 10 mm. When the face was mined to 540 m, point Z28 at 180 m inside the open-off cut was the maximum surface subsidence point. Its maximum subsidence was 1,570 mm, and it lagged behind the mining position by 360 m. With continuous mining of the working face, a surface subsidence basin gradually formed and eventually stabilised. After 6 months of mining the face, when the 01 working face was mined to 1,182 m, point Z28 on the surface had a subsidence value of 1,613 mm (Figure 5A). The maximum coefficient of surface subsidence was 0.62.
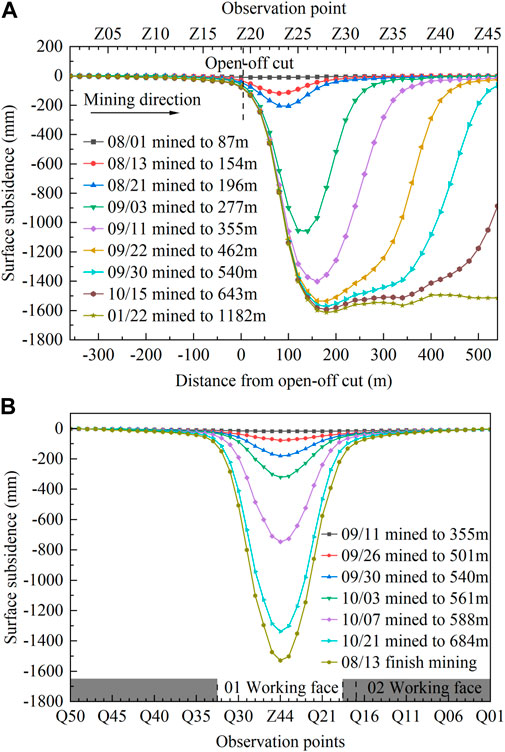
Figure 5. Surface subsidence curve of 01 working face. (A) in strike direction (B) in inclination direction.
The gray shadow represented the unmined coal seam in Figure 5B. When the 01 working face was mined to 355 m, the mining position was 167 m away from the surface inclination observation line, and the maximum surface subsidence of the inclination observation line was 18 mm. When the face was mined to 540 m, the mining position exceeded the inclination observation line by 30 m, and the maximum subsidence point of the inclination observation line was Z44 at 180 mm. Point Z44 was at the centre position in the inclination direction of the working face, and the face’s surface subsidence curve had a V shape. When the mining of the face was completed, its surface subsidence was generally stable. Point Z44’s maximum subsidence was 1,528 mm. The surface subsidence curve in the inclination direction of the face had a V shape, and its symmetrical centre was located at the mine-out area (Figure 5B).
3.1.2 Surface horizontal strain and displacement
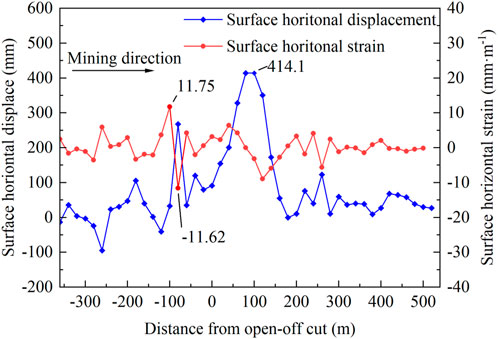
The surface horizontal movement in the strike line of the 01 working face was mainly towards the centre of the subsidence basin. Along the mining direction, the surface horizontal displacement fluctuation increased from the outer side to the vicinity of the open-off cut. The surface horizontal displacement on the inner side of the open-off cut initially increased, then decreased, and finally tended to be relatively stable. The horizontal displacement near the open-off cut was generally large and peaked at 414.1 mm at 100 m medial to the open-off cut. The surface horizontal strain value ranged from −11.62 to +11.75 mm/m. The proportions of tensile and compressive deformations on the outer side of the open-off cut were similar, whereas compressive deformation was the main deformation on the inner side of the open-off cut (Figure 6).
3.1.3 Durations of phases of surface movement and deformation
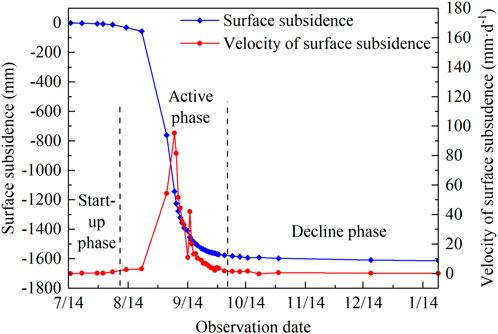
The duration phases of surface movement and deformation were start-up, active, and decline. During the start-up phase of surface movement, the value and speed of surface subsidence slowly increased. The surface subsidence and deformation activities were intense, with surface subsidence of 1,551 mm accounting for approximately 96.15% of the total cumulative subsidence of 1,613 mm (Figure 7).
During the decline phase, the velocity of surface subsidence slowly decayed until the surface movement and deformation stabilised. The total surface movement and deformation duration averaged approximately 185 d, including the start-up phase of 6 d, the active phase of 54 d, and the decline phase of 125 d (Supplementary Table S2). Therefore, the surface movement and deformation of the 01 working face mining had a short start-up phase, a short active phase, and a long decline phase.
3.1.4 Maximum surface subsidence velocity
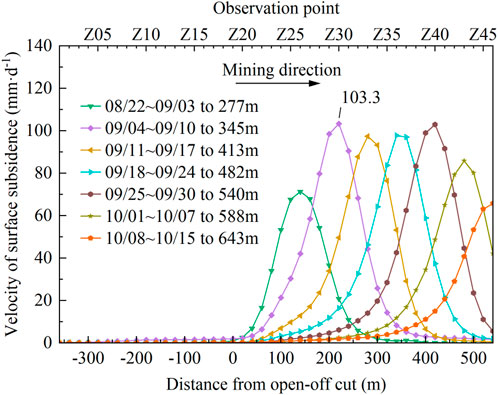
The maximum subsidence velocity curves at different periods all had a similar “unimodal” shape. As the working face mining continued to advance, the maximum subsidence velocity of the surface at each period along the strike observation line increased from low to high, then decreased again, and finally stabilised. The maximum subsidence velocity reached approximately 103.3 mm/d (Figure 8).
3.1.5 Delay distance and angle of maximum subsidence velocity
The average delay distance of the maximum subsidence velocity of the 01 working face was 102.14 m. According to the Equation 1 for calculating the delay angle of maximum subsidence velocity, its average value was 71.8° (Table 1).
where φ was the delay angle of maximum subsidence velocity, L was the delay distance of maximum subsidence velocity, H was the mining depth.
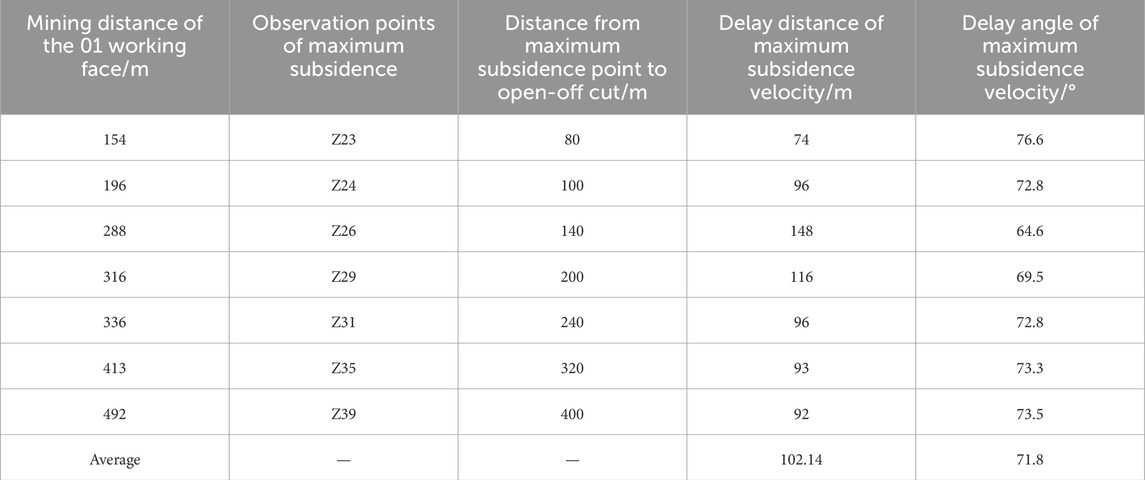
Table 1. Calculation result of delay distance and delay angle of maximum subsidence velocity in the 01 working face.
3.1.6 Distance and angle of advance influence
The average distance of the advance influence of the 01 working face was 128 m. According to the Equation 2 for calculating the angle of advance influence, its average angle was 67.6° (Table 2).
where ω was the angle of advance influence, l was the distance of advance influence, H was the mining depth.
3.1.7 Characteristic parameters of surface movement after stability
The angular characteristic parameters of the ground surface movement after stability were calculated in accordance with the measured data and related formulas, as shown in Table 3. The angle of draw in the strike direction was 57.2°. The angle in the inclination direction was 49.7°. The angle of critical deformation in the strike direction was 80.8°. The angle in the inclination direction was 86.8°. The angle of crack in the strike direction was 86.7°. The angle in the inclination direction was 86.8°. The subsidence limit angle was 90°, and the angle of full subsidence was 59.9°.
3.2 Surface movement characteristic parameters and laws of the 02 working face mining
3.2.1 Changes of subsidence along surface strike and inclination lines
Along the strike observation line, when the 02 working face was mined to 103 m, its surface subsidence exceeded 10 mm, and its surface began to be affected by the mining. When the working face was mined to 653 m, the maximum subsidence point on the surface was Z25 at 250 m inside the open-off cut. Its maximum subsidence was 1,802 mm, and it lagged behind the mining position by 403 m. When the 02 working face was mined to 3,665 m, the surface of the observation range had formed a stable subsidence basin. By June 2022, 10 months after the 02 working face was mined, the maximum subsidence point Z25 on the surface had a subsidence value of 1,860 mm, and the maximum coefficient of surface subsidence was 0.72 (Figure 9A).
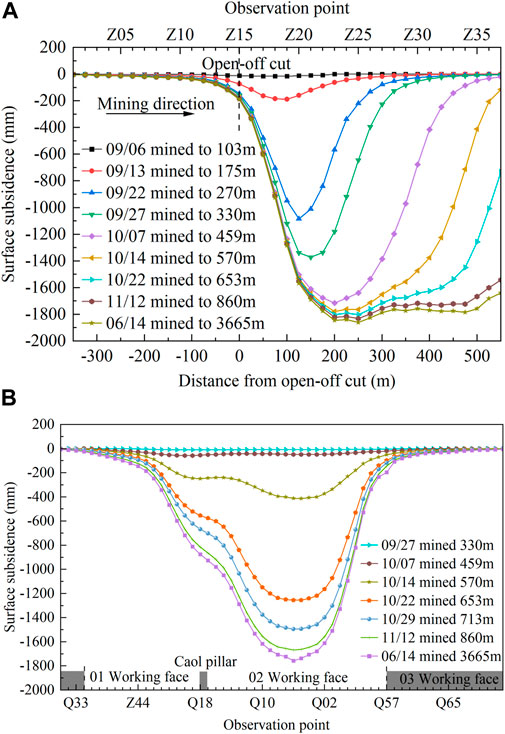
Figure 9. Surface subsidence curve of 02 working face in mining period of 02 working face. (A) in strike direction. (B) in inclination direction.
When the 02 working face was mined to 330 m, the mining position was 170 m away from the surface inclination observation line, and the maximum surface subsidence of the line was 10 mm. Afterwards, as the working face continued to be mined, the inclination observation line continued to subside. Compared to the area near the solid coal body of the 03 working face, which had not yet been mined, the surface subsidence in the area near the mine-out of the 01 working face was larger. By June 2022, 10 months after the 02 working face was mined, the surface subsidence on the inclination observation line of that face was generally stable. The maximum subsidence point Z35 was at the centre position in the inclination direction of the 02 working face with a maximum subsidence value of 1,758 mm. The surface subsidence curve of the 02 working face had a U shape, with its symmetrical centre located at the mine-out area. The surface subsidence on the side of the area near the mine-out of the 01 working face was relatively large, and the subsidence curve was relatively flat. However, the subsidence on the side of the area near the 03 working face, which had not been mined, was relatively small, and the subsidence curve was steep (Figure 9B).
Affected by the 01 working face mining, the 02 working face surface had already experienced varying degrees of subsidence before mining. Its surface subsidence ranged from 3 to 91 mm on the inclination observation line from Q01 to Q17. During the mining of the 02 working face, the 01 working face surface had a secondary subsidence whose maximum was 875 mm at point Q18 at the boundary between working faces 01 and 02. Affected by the secondary subsidence, the maximum subsidence point of the 01 working face moved from Z44 to Q25. The secondary subsidence value of Q25 was 185 mm, which increased by 12.3% compared to the first subsidence value. The cumulative surface subsidence at the coal pillar section (Q17 to Q18) were 1,005 to 1,019 mm. The surface subsidence curve on the inclination observation line had an asymmetric W shape as a whole (Figure 10).
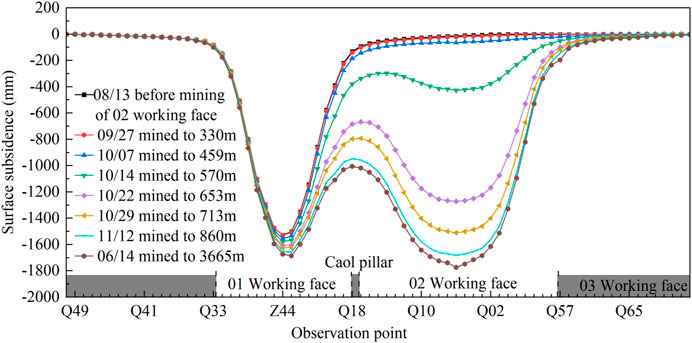
Figure 10. Accumulated surface subsidence curve of inclination direction in the working faces 01 and 02.
3.2.2 Surface horizontal strain and displacement
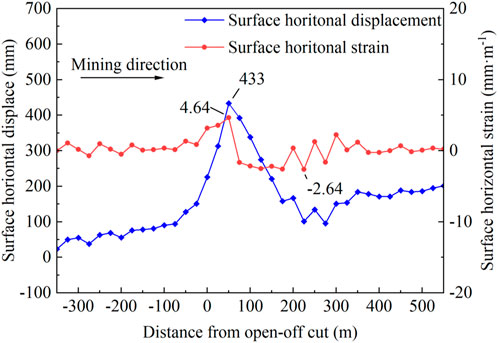
The surface horizontal displacement in the strike line of the 02 working face was mainly towards the centre of the subsidence basin. Along the mining direction, the surface horizontal displacement of the strike direction first increased, then decreased, and finally stabilised within a certain range. The horizontal displacement near the open-off cut was relatively large, with a peak of 433 mm at a distance of 50 m on the inner side of the open-off cut. The horizontal strain of the surface ranged from −2.64 to 4.64 mm/m (Figure 11).
3.2.3 Durations of surface movement and deformation phases
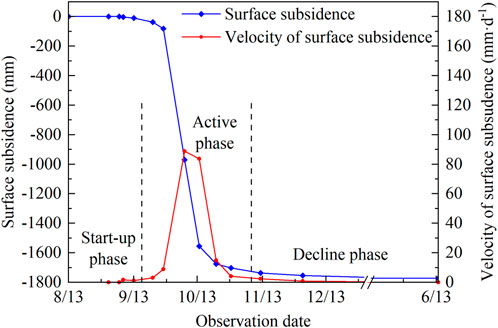
The total duration of surface movement and deformation was on average approximately 243 d, including a start-up phase of approximately 4 d, an active phase of approximately 53 d, and a decline phase of approximately 186 d (Supplementary Table S3). During the active phase, the surface subsidence of 1798 mm was severe, accounting for 96.66% of the total subsidence of 1860 mm. During that period, the surface subsidence’s speed increased rapidly, then decreased rapidly (Figure 12).
3.2.4 Maximum surface subsidence velocity
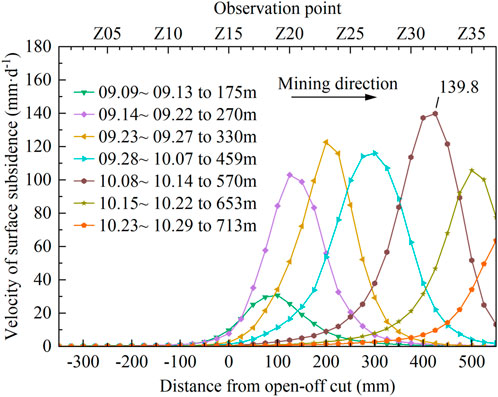
As the 02 working face continued to be mined, the maximum subsidence velocity of the surface in each period along the observation line had a trend of increasing from low to high, then decreasing and tending towards stability. The maximum subsidence velocity was 139.8 mm/d (Figure 13).
3.2.5 Delay distance and angle of maximum subsidence velocity
The average delay distance of the maximum subsidence velocity of the 02 working face was 112.8 m. According to the Equation 1 for calculating the delay angle of maximum subsidence velocity, its average value was 70.1° (Table 4).
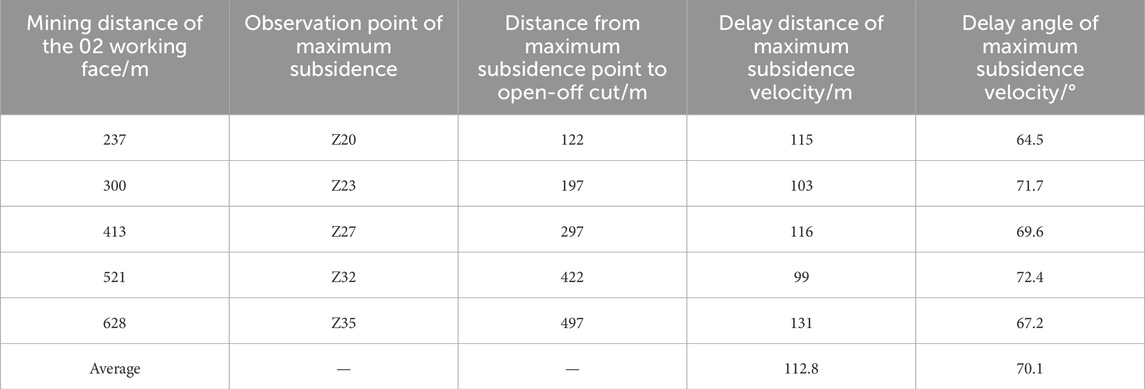
Table 4. Calculation result of delay distance and delay angle of maximum subsidence velocity in the 02 working face.
3.2.6 Distance and angle of advance influence
The average distance of advance influence of the 02 working face was 160 m. According to the Equation 2 for calculating the angle of advance influence, its average angle was 62.9° (Table 5).
3.2.7 Characteristic parameters of surface movement after stability
The angular characteristic parameters of the ground surface movement after stability were calculated in accordance with the measured data and related formulas, as shown in Table 6. The 02 working face’s draw angle in the strike direction was 46.1°. The draw angle near the 03 face in the inclination direction was 49.2°. The draw angle near the 01 face in the inclination direction was 39.8°. The 02 working face’s critical deformation angle in the strike direction was 80.8°. The critical deformation angle near the 03 face in the inclination direction was 82.7°. The critical deformation angle near the 01 face in the inclination direction was 83.6°. For the 02 working face, the crack angle in the strike direction was 86.3°, the average of crack angle in the inclination direction was 86.8°, the subsidence limit angle was 90°, and the angle of full subsidence was 52.4°.
3.2.8 Result of GNSS automatic surface movement observation stations for the 02 working face
The ZK2 point of the GNSS automatic surface movement observation station was at the centre of the 02 working face. According to the observation data, the surface began to subside with a value of 12.3 mm when the working face was mined to a distance of 201 m before ZK2. When the 02 working face was mined 668 m beyond the ZK2 point, the surface subsidence at that observation point was basically stable, with a maximum subsidence value of approximately 1,700.0 mm. As of the completion of mining of the 02 working face, the maximum subsidence of the ZK2 observation point stabilised at about 1,720.0 mm with a subsidence coefficient of 0.66 (Figure 14A).
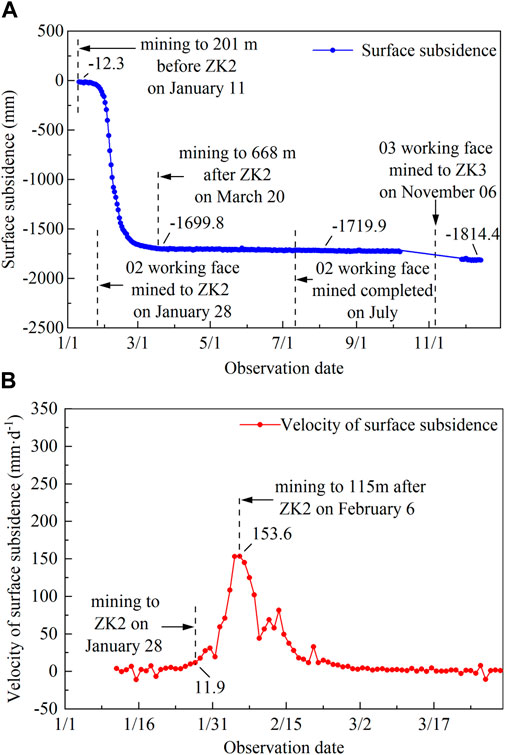
Figure 14. Surface subsidence characteristics curve of ZK2 point in the 02 working face. (A) surface subsidence. (B) velocity of surface subsidence.
The overall trend of the surface subsidence velocity was a slow increase, then a rapid increase, then a rapid decrease, then a slow decrease, and finally approaching zero. After the surface subsidence velocity approached zero, the surface subsidence value remained basically stable. When the mining of the 02 working face exceeded 115 m after ZK2, the surface subsidence velocity of ZK2 peaked at 153.6 mm/d (Figure 14B). The total duration of surface movement and deformation at the ZK2 GNSS observation averaged approximately 246 d, including a start-up phase of approximately 10 d, an active phase of approximately 56 d, and a decline phase of approximately 180 d. During the active phase, the surface subsidence velocity of the ZK2 GNSS observation was high, and its duration was short. When the adjacent working face 03 was mined before and after the ZK3 observation point, the surface subsidence value of the ZK2 GNSS observation point, which was on the surface of the mine-out in the 02 working face, increased from 1,720.0 mm to 1,814.4 mm. The secondary surface subsidence of the ZK2 GNSS observation point was approximately 94.4 mm. In accordance with the observation data of the ZK2 GNSS observation station, it could be calculated that the distance of advance influence was 247 m, the angle of advance influence was 51.6°, and the delay distance and angle of the maximum subsidence velocity were 15 m and 69.8° respectively.
3.3 Development characteristics and laws of surface cracks caused by mining
In the study area including the 01, 02, and 03 working faces, the mining height was relatively small, and the ratio of mining depth to mining height was relatively large. The surface of the study area was covered mainly by an aeolian sand layer. The mining surface cracks in the study area were generally weak and buried by aeolian sand soon after mining. Based on the observation results of surface cracks in the 02 and 03 working faces, it was found that the main types of surface cracks developed during mining were cracks with the mining direction parallel to the open-off cut and cracks with the spreading direction of parallel grooves. In the area around the open-off cut, the width of surface cracks parallel to the open-off cut was relatively large, in the 0.1–0.5 cm range. In the area within the working face, the width of surface cracks parallel to the open-off cut was relatively small, in the 0.05–0.2 cm range. The distance between the surface cracks was mostly between 3 and 5 m, and they had almost no drop. The surface crack widths of the parallel grooves were slightly larger than those parallel to the open-off cut inside the working face and slightly smaller than those parallel to the open-off cut near the open-off cut area.
The width of surface cracks parallel to the open-off cut had a dynamic evolution law pattern of opening first, then closing over time. That specifically showed that the width of the surface cracks was basically unchanged within 3–4 d after they were generated, then the cracks were completely closed or semi-closed within 1 d (Figure 15). The width of the surface crack parallel grooves had a dynamic evolution law pattern of only opening first and not matching over time. Over time, both types of surface cracks were buried by aeolian sand and lost their traces.
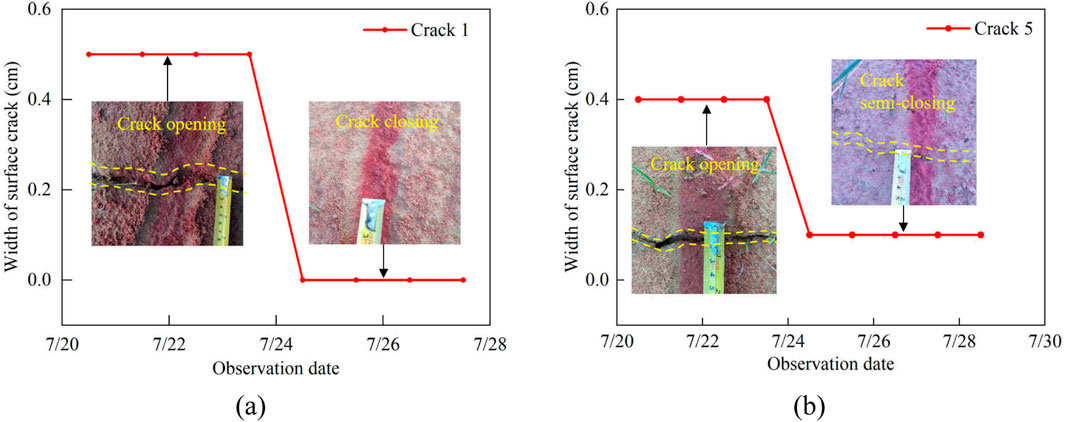
Figure 15. Dynamic evolution curve of width of cracks parallel to the open-off cut. (A) Width of crack 1. (B) Width of crack 5.
Based on the observation results of grouting and excavating for 11 surface cracks near the open-off cut on the 03 working face, the depth of surface crack development ranged from 4 to 68 cm, most of which ranged from 20 to 40 cm. The profile morphology of surface cracks included mainly “falling wedge” and “associated bifurcation” types (Figure 16).
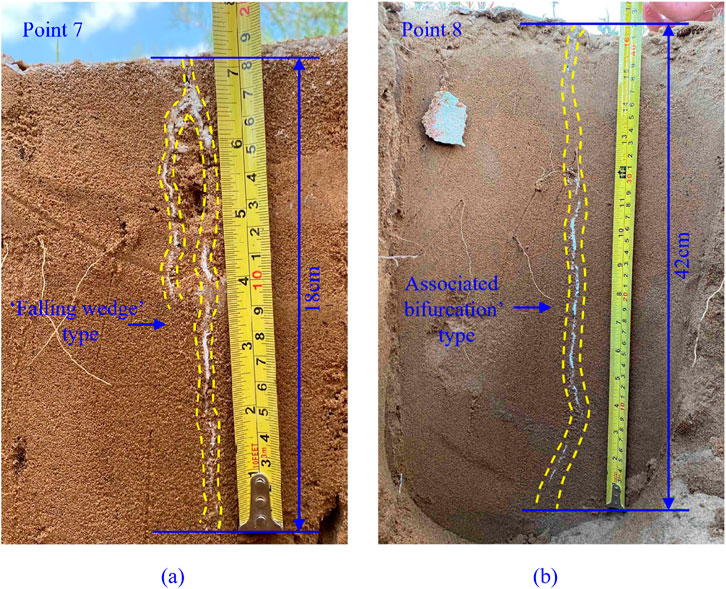
Figure 16. Development depth and profile morphology of cracks parallel to the open-off cut. (A) Point 7. (B) Point 8.
4 Discussion
Determining the characteristics and laws of surface movement and surface crack development caused by coal mining is the scientific basis for protecting surface buildings, land resources, and ecological environments in coal mining areas. Some coal mining enterprises have begun to adopt super-long working faces with an inclination width greater than 350 m. To acquire their characteristics and laws of surface movement deformation and surface crack development, this study took the adjacent mining working faces 01 and 02 of the No. 2 Xiaobaodang coal mine as an example, which had the same mining heights, depths, and methods, nearly horizontal coal seams, and a similar geotechnical structure of the coal seam overburden. Through applying methods of manual observation of surface movement deformation, GNSS automatic observation of surface movement deformation, manual observation of surface cracks, and tracing excavation of surface cracks, the characteristics and laws of surface movement and surface crack development of working faces with inclination widths of 300 m and 450 m were studied.
Table 7 compares surface movement and deformation observation results in the strike direction of the 01 and 02 working faces. The inclination widths of the 01 and 02 workings, whose mining depths and heights were basically the same, were 300 m and 450 m respectively. The average mining speed of the 02 working face, 12.2 m/d, was faster than that of the 01 face with 6.4 m/d. Compared with the 01 working face, the maximum subsidence point of surface movement deformation in the strike direction of the 02 workface was 70 m farther away from the open-off cut, with an increase ratio of 39%. Its maximum subsidence was 247 mm larger with an increase ratio of 15.31%, the maximum coefficient of subsidence was 0.10 larger with an increase ratio of 16.13%, and the maximum horizontal displacement was 18.9 mm larger with an increase ratio of 4.56%. The increases in maximum subsidence, coefficient of subsidence, and maximum horizontal displacement were related mainly to the fact that the inclination width of the 02 working face exceeded that of the 01 working face. Compared with the 01 working face, the angles of advance influence, draw, and full subsidence, and the delay angle of maximum subsidence velocity of the 02 working face, decreased by 4.7°, 11.1°, 7.5°, and 1.7° respectively.
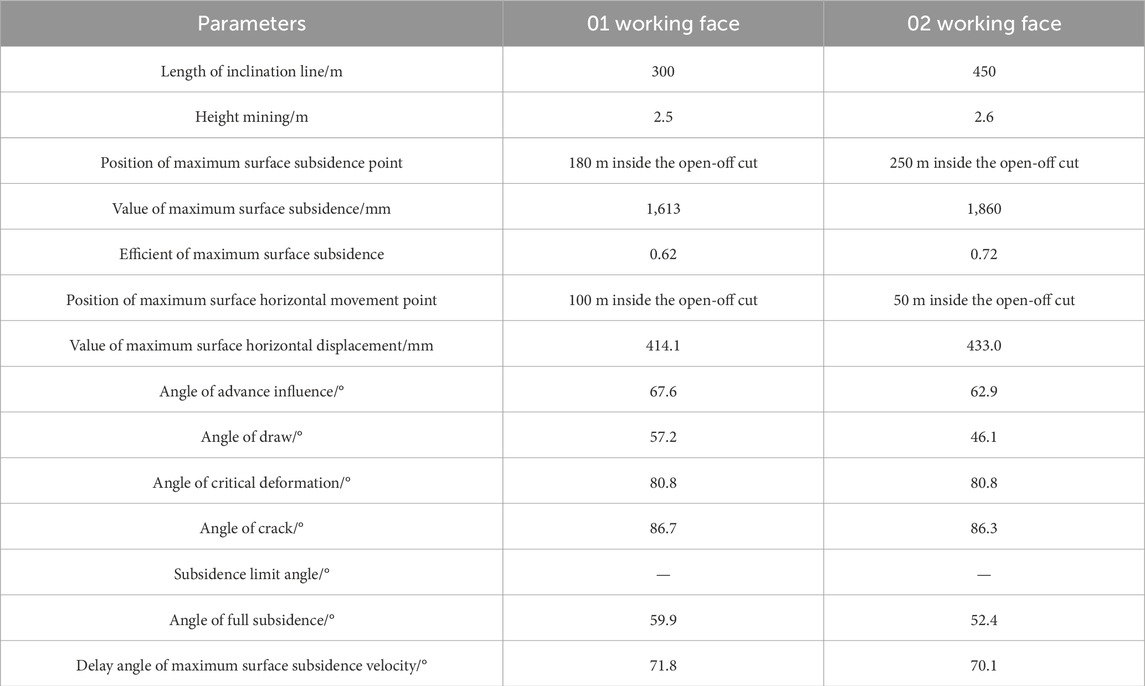
Table 7. Comparison of surface movement observation results in the strike direction between working faces 01 and 02.
The decreases in the angle of advance influence and the delay angle of the maximum subsidence velocity were related mainly to the fact that the mining speed of the 02 working face was faster than that of the 01 working face, and the decreases in the angles of draw and full subsidence might have been related to the larger inclination width of the 02 working face. Critical deformation and crack angles were essentially the same for working faces 01 and 02. Therefore, the inclination width of a coal mining face has some influence on the surface movement deformation of the working face under similar conditions of geology and mining. When the inclination width of the working face increased from 300 m to 450 m, the maximum subsidence, subsidence coefficient, and maximum horizontal displacement of the ground surface increased, the angles of the draw and full subsidence decreased, and the range and depth of the moving basin increased. Because 450 m super-long faces were developed in only recent years, there are no research reports on its surface movement characteristics and laws or its differences from conventional faces. This study determined the surface movement characteristics and laws of 450 m super-long working faces by observing and comparing the surface movement of conventional working faces with an inclination width of 300 m to those of super-long working faces with inclination widths of 450 m. That was important to understanding the influence of the inclination width of the working face on surface movement deformation to prevent and control subsidence disasters of super-long working faces.
As shown in Table 8 and Figure 17, under the influence of the adjacent 02 working face mining, the surface above the mined-out area of the 01 working face underwent obvious secondary subsidence from points Q27 to Q18, with a secondary subsidence value exceeding 100 mm. The maximum subsidence point Z44 in the inclination observation line centre of the 01 working face shifted to the direction of the adjacent 02 working face with an offset distance of 20 m. In the area of the coal pillar surface between the two working faces and its surrounding surface, the secondary subsidence of the surface was notable, with a maximum of 875 mm. Relative to the solid coal seam side of the 02 working face, the surface subsidence amplitude increased obviously, and its curve of cumulative surface subsidence was relatively gentle, so the cumulative subsidence curves of the two working faces were in an asymmetric W shape. That indicated that the coal seam’s overlying rock and soil mass had undergone secondary fracturing and movement in the area of the coal pillar between the two working faces and its vicinity, but those activities of secondary breaking and movement were limited. After mining, the subsidence curve of the 01 working face was close to a V shape. Due to the influence of the mining of the 02 working face, the bottom of the subsidence curve of the 01 working face became flatter when the face was approaching full extraction. The maximum subsidence point of the 02 working face was at the centre of the working face, and the bottom of the subsidence curve was close to flat within a range of approximately 100 m. That indicates that the centre and its vicinity of the super-long working face with an inclination width of 450 m reached full extraction in the inclination direction. In the study area, it could be concluded that the inclination width of the full extraction for the working face in the inclination direction was slightly greater than 300 m, while the mining depth-to-height ratio was approximately 120. Previous studies focused mainly on the surface movement deformation of a single working face caused by coal mining (Guo et al., 2010; 2011; Chen et al., 2019; Fu et al., 2021; Xie et al., 2021; Yin et al., 2022; Zhang B. C. et al., 2022; Zou et al., 2023). There have been fewer studies on the surface subsidence changes of working faces and the characteristics of subsidence curves in the inclination direction caused by adjacent working face mining. From this study, based on the analysis of surface subsidence observations in the inclination direction of. From this study, based on the analysis of surface subsidence observations in the inclination direction of working faces 01 and 02, the surface cumulative subsidence curve of the adjacent faces had an asymmetric W shape. The study found that the rock surrounding the coal pillar and its vicinity experienced secondary fractures and movement and provided evidence that the centre area of the super-long working face with an inclination width of 450 m had reached full mining. Those findings have important reference value for preventing and controlling surface subsidence disasters caused by coal mining of working faces.
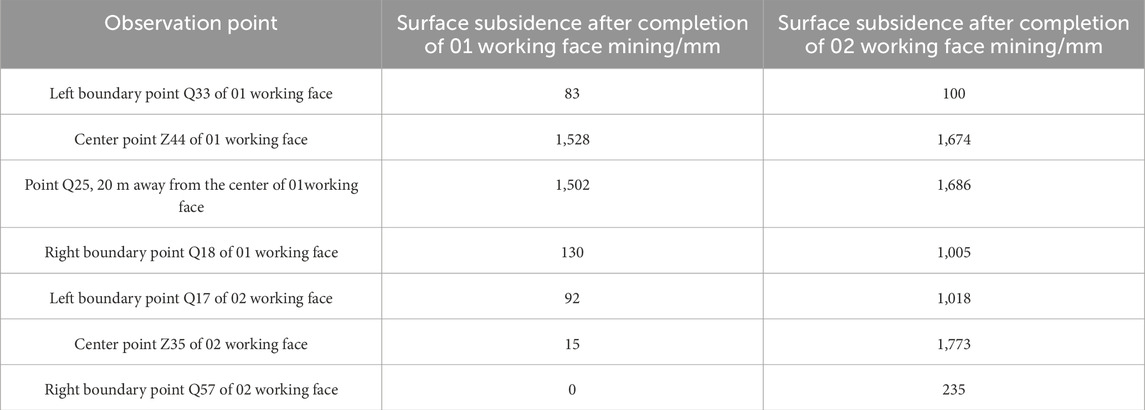
Table 8. Accumulated surface subsidence of inclination observation points in working faces 01 and 02.
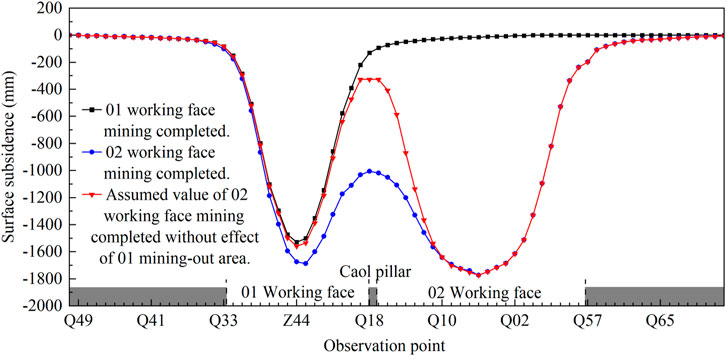
Figure 17. Cumulative surface subsidence curve of inclination observation line in working faces 01 and 02.
In the study area, medium-depth coal seams with thick, loose layers were mined in the upper part of the overlying strata. The mining heights were low at 2.6 m, and the mining depth-to-height ratio reached 120. Two types of surface cracks were caused by mining on the working face: those with a spreading direction parallel to the open-off cut and those with a spreading direction parallel to grooves. The crack development width was less than 0.5 cm without a drop, and the depth was less than 1 m. After mining of the working face, the surface cracks could be closed quickly by aeolian sand. The surface cracks in the study area were developed in unconsolidated loose sand layers. This loose sand layer was mainly subjected to plastic deformation, which was not conducive to stress transmission and crack propagation. Therefore, under the same level of stress, the depth of crack development was smaller on the surface covered by unconsolidated loose sand layers, while the depth of crack development was larger on the surface of loess with relatively better consolidation and fully consolidated rock layers. The widths of surface cracks near the working face’s open-off cut and groove had a dynamic change characteristic of opening first, then remaining open, whereas the widths inside the working face opened first, then closed. Xiaobaodang No.1 coal mine adjacent to the study area had geological conditions similar to those of the study area, but its working face had a relatively large mining height of 5.8 m, with a mining depth-to-height ratio of 52. In that mine’s area, the maximum width and drop of surface cracks were 15 cm and 20 cm respectively (Xie et al., 2021). It was evident that, for working faces with similar geological conditions, higher depth-to-height ratios and lower mining heights result in smaller surface crack development widths and weaker surface crack development degrees. Unlike previous research, this study found that the surface cracks of a coal mining face with a mining depth-to-height ratio of 120 were weakly damaging and could self-repair. That provides a basis for evaluating the degree of surface destruction faced by coal mining working faces.
The surface movement and deformation caused by coal seam mining were influenced by various factors such as topographic features, coal seam depth, overlying rock and soil structure, rock mechanical strength, inclination length of working face, mining height. The 01 conventional working face and 02 super-long working face observed in this research could not represent all situations. Therefore, with the promotion and application of super-long working faces, further research was needed on the surface movement and surface cracks development laws of super-long working faces under different topographic features, mining heights and overlying rock structures in the future.
5 Conclusion
(1) Through on-site measurement and calculation, the parameters and characteristics of surface movement and deformation of working faces with different inclination widths, the same geological conditions and the same mining height were obtained. The 01 working face, with an inclination width of 300 m, had a maximum surface subsidence of 1,613 mm, a maximum horizontal displacement of 414.1 mm, a maximum surface subsidence coefficient of 0.62, and a surface subsidence active phase of 54 d. The 02 working face, with an inclination width of 450 m, had a maximum surface subsidence of 1,860 mm, a maximum horizontal displacement of 433 mm, a maximum surface subsidence coefficient of 0.72, and a surface subsidence active phase of 53 d. Compared to the 01 working face, the maximum subsidence, maximum horizontal movement value, and maximum subsidence coefficient of the 02 super-long working face increased by 15.31%, 4.56%, and 16.13%, which indicated that the inclination width of the coal mining working face had some effect on its surface movement and deformation.
(2) Affected by the mining of the 02 working face, the 01 working face experienced secondary subsidence with a maximum increase of 12.3%. Along the direction of the inclination observation line, the surface subsidence curve of the 01 working face had a V shape after the mining, and the overall surface subsidence curve of working faces 01 and 02 had an asymmetric W shape after the mining of the 02 working face. The middle of the 02 working face surface subsidence curve was approximately flat bottomed, and a short distance at the bottom of the 01 working face surface subsidence curve became flat when it was affected by the mining of the 02 working face. That indicated that a super-long working face could achieve full extraction in the inclination direction, and the full extraction’s mining depth-to-height ratio was slightly greater than 120.
(3) Surface cracks caused by mining of the two main types included cracks with a spreading direction parallel to the open-off cut and cracks with a spreading direction parallel to grooves. The crack widths ranged from 0.1 to 0.5 cm, and their depths were less than 1 m. The width dynamic evolution law of surface cracks with a spreading direction parallel to the open-off cut was opening first, then closing over time. The width dynamic evolution law of surface cracks with the spreading direction parallel to grooves was opening first, then remaining open. The greater the mining depth-to-height ratio, the weaker the development degree of surface cracks. The development degree of surface cracks was very weak in the coal mining face whose mining depth-to-height ratio was 120, and those cracks could be closed quickly by aeolian sand.
Data availability statement
The original contributions presented in the study are included in the article/Supplementary Material, further inquiries can be directed to the corresponding author.
Author contributions
PH: Conceptualization, Data curation, Formal Analysis, Investigation, Methodology, Resources, Validation, Writing–original draft, Writing–review and editing. SW: Conceptualization, Supervision, Writing–review and editing. DF: Data curation, Investigation, Writing–review and editing. XX: Validation, Writing–review and editing. EH: Conceptualization, Funding acquisition, Methodology, Project administration, Supervision, Writing–review and editing.
Funding
The author(s) declare that financial support was received for the research, authorship, and/or publication of this article. This research was funded by the National Natural Science Foundation of China (No. 42177174), the Basic Research Program of Natural Science of Shaanxi Province (2020ZY-JC-03), and the Shaanxi Province Joint Fund Project (2021JLM-09).
Acknowledgments
The authors would like to sincerely thank Pei Xu and Xicheng Bai from Shaanxi Xiaobaodang Mining Co., Ltd. for their help in basic data collection and field survey work, and Liu Feng from Shaanxi 185 Coal Field Geology Co., Ltd. for his help in surface movement observation.
Conflict of interest
The authors declare that the research was conducted in the absence of any commercial or financial relationships that could be construed as a potential conflict of interest.
Generative AI statement
The author(s) declare that no Generative AI was used in the creation of this manuscript.
Publisher’s note
All claims expressed in this article are solely those of the authors and do not necessarily represent those of their affiliated organizations, or those of the publisher, the editors and the reviewers. Any product that may be evaluated in this article, or claim that may be made by its manufacturer, is not guaranteed or endorsed by the publisher.
Supplementary material
The Supplementary Material for this article can be found online at: https://www.frontiersin.org/articles/10.3389/feart.2024.1526950/full#supplementary-material
References
Bai, X. F., Ding, H., Lian, J. J., Ma, D., Yang, X. Y., Sun, N. X., et al. (2018). Coal production in China: past, present, and future projections. Int. Geol. Rev. 60 (5-6), 535–547. doi:10.1080/00206814.2017.1301226
Chen, C., Hu, Z. Q., Wang, J., and Jia, J. T. (2019). Dynamic surface subsidence characteristics due to super-large working face in fragile-ecological mining areas: a case study in Shendong coalfield, China. Adv. Civ. Eng. 2019. doi:10.1155/2019/8658753
Dudek, M., Sroka, A., Tajdus, K., Misa, R., and Mrochen, D. (2022). Assessment and duration of the surface subsidence after the end of mining operations. Energies 15 (22), 8711. doi:10.3390/en15228711
Feng, D., Hou, E. K., Xie, X. S., Che, X. Y., Hou, P. F., and Long, T. W. (2022). Prediction and treatment of water leakage risk caused by the dynamic evolution of ground fissures in gully terrain. Front. Earth Sci. 9. doi:10.3389/feart.2021.803721
Feng, D., Hou, E. K., Xie, X. S., Wei, J. B., and Hou, P. F. (2023). Differences in the dynamic evolution of surface crack widths at different locations in the trench slope area and the mechanisms: a case study. Environ. Geochem. And Health 45 (10), 7161–7182. doi:10.1007/s10653-022-01452-0
Fu, Y. K., Shang, J. X., Hu, Z. Q., Li, P. Y., Yang, K., Chen, C., et al. (2021). Ground fracture development and surface fracture evolution in N00 method shallowly buried thick coal seam mining in an arid windy and sandy area: a case study of the Ningtiaota mine (China). Energies 14 (22), 7712. doi:10.3390/en14227712
Fu, Y. K., Wu, Y. Z., Yin, X. W., and Zhang, Y. J. (2023). Mapping mining-induced ground fissures and their evolution using UAV photogrammetry. Front. Earth Sci. 11. doi:10.3389/feart.2023.1260913
Guo, Q. L., Han, Y. Y., Yang, Y. S., Fu, G. B., and Li, J. L. (2019a). Quantifying the impacts of climate change, coal mining and soil and water conservation on streamflow in a coal mining concentrated watershed on the loess plateau, China. Water 11 (5), 1054. doi:10.3390/w11051054
Guo, W. B., Guo, M. J., Tan, Y., Bai, E. H., and Zhao, G. B. (2019b). Sustainable development of resources and the environment: mining-induced eco-geological environmental damage and mitigation measures-A case study in the henan coal mining area, China. Sustainability 11 (16), 4366. doi:10.3390/su11164366
Guo, W. B., Huang, C. F., and Chen, J. J. (2010). The dynamic surface movement characteristics of fully mechanized caving mining under thick hydrous collapsed loess (in Chinese). J. Of China Coal Soc. 35 (S1), 38–43. doi:10.13225/j.cnki.jccs.2010.s1.014
Guo, W. B., Huang, C. F., and Chen, J. J. (2011). Observation and study on surface ground subsidence speed of fully mechanized top coal caving mining in thick seam (in Chinese). Coal Sci. Technol. 39 (04), 114–117. doi:10.13199/j.cst.2011.04.119.guowb.030
Hou, E. K., Xie, X. S., Wang, S. M., Cong, T., Feng, D., and Chen, Z. (2021). Development law of ground cracks induced by fully-mechanized mining of medium-buried coal seams (in Chinese). J. Min. and Saf. Eng. 38 (06), 1178–1188. doi:10.13545/j.cnki.jmse.2020.0293
Li, L., Wu, K., Hu, Z. Q., Xu, Y. K., and Zhou, D. W. (2017). Analysis of developmental features and causes of the ground cracks induced by oversized working face mining in an aeolian sand area. Environ. Earth Sci. 76 (3), 135. doi:10.1007/s12665-017-6452-9
Prakash, A., Kumar, N., Kumbhakar, D., Singh, A. K., and Paul, A. (2018). A safe depillaring design for shallow depth of cover with influence of surface ground movements: a study in Jharia Coalfield. Arabian J. Of Geosciences 11 (8), 164. doi:10.1007/s12517-018-3508-4
Qiao, W., Li, W. P., Li, T., Chang, J. Y., and Wang, Q. Q. (2017). Effects of coal mining on shallow water resources in semiarid regions: a case study in the shennan mining area, Shaanxi, China. Mine Water And Environ. 36 (1), 104–113. doi:10.1007/s10230-016-0414-4
Shang, Y. Z., Lu, S. B., Li, X. F., Hei, P. F., Lei, X. H., Gong, J. G., et al. (2017). Balancing development of major coal bases with available water resources in China through 2020. Appl. Energy 194, 735–750. doi:10.1016/j.apenergy.2016.07.002
Song, J. X., Yang, Z. Y., Xia, J., and Cheng, D. D. (2021). The impact of mining-related human activities on runoff in northern Shaanxi, China. J. Of Hydrology 598, 126235. doi:10.1016/j.jhydrol.2021.126235
Xie, X. S., Hou, E. K., Wang, S. M., Liu, F., Xie, Y. L., Chen, Z., et al. (2021). Study on surface movement and deformation law of the middle deep buried thick seam in sandy region (in Chinese). Saf. Coal Mines 52 (12), 199–206. doi:10.13347/j.cnki.mkaq.2021.12.034
Xu, Y. K., Wu, K., Bai, Z. H., and Hu, Z. Q. (2017). Theoretical analysis of the secondary development of mining-induced surface cracks in the Ordos region. Environ. Earth Sci. 76 (20), 703. doi:10.1007/s12665-017-7050-6
Xu, Y. K., Wu, K., Li, L., Zhou, D. W., and Hu, Z. Q. (2019). Ground cracks development and characteristics of strata movement under fast excavation: a case study at Bulianta coal mine, China. Bull. Of Eng. Geol. And Environ. 78 (1), 325–340. doi:10.1007/s10064-017-1047-y
Yan, W. T., Guo, J. T., and Yan, S. G. (2023). Difference in surface damage between deep and shallow mining of underground coal resources in China. Sustainability 15 (9), 7296. doi:10.3390/su15097296
Yang, K., Hu, Z. Q., Liang, Y. S., Fu, Y. K., Yuan, D. Z., Guo, J. X., et al. (2022). Automated extraction of ground fissures due to coal mining subsidence based on UAV photogrammetry. Remote Sens. 14 (5), 1071. doi:10.3390/rs14051071
Yi, S. H., Zhang, Y., Yi, H. Y., Li, X. L., Wang, X., Wang, Y., et al. (2022). Study on the instability activation mechanism and deformation law of surrounding rock affected by water immersion in goafs. Water 14 (20), 3250. doi:10.3390/w14203250
Yin, H. J., Guo, G. L., Li, H. Z., Wang, T. N., and Yuan, Y. F. (2022). Prediction method and research on characteristics of surface subsidence due to mining deeply buried Jurassic coal seams. Bull. Of Eng. Geol. And Environ. 81 (10), 449. doi:10.1007/s10064-022-02946-y
Zha, J. F., and Xu, M. Q. (2019). High-grade highways deformation and failure laws in mining area - a case in Nantun Coal Mine, China. Int. J. Of Pavement Eng. 20 (11), 1251–1263. doi:10.1080/10298436.2017.1402592
Zhang, B. C., Liang, Y. P., Zou, Q. L., Chen, Z. H., Kong, F. J., and Ding, L. Q. (2022a). Evaluation of surface subsidence due to inclined coal seam mining: a case study in the 1930 coal mine, China. Nat. Resour. Res. 31 (6), 3303–3317. doi:10.1007/s11053-022-10117-9
Zhang, C., Wang, P., Wang, E., Chen, D., and Li, C. (2023). Characteristics of coal resources in China and statistical analysis and preventive measures for coal mine accidents. Int. J. coal Sci. and Technol. 10 (1), 22. doi:10.1007/s40789-023-00582-9
Zhang, Y. J., Lian, X. G., Yan, Y. G., Zhu, Y. H., and Dai, H. Y. (2022b). Study on the development law of mining-induced ground cracks under gully terrain. Remote Sens. 14 (23), 5985. doi:10.3390/rs14235985
Zhou, D. W., Wu, K., Cheng, G. L., and Li, L. (2015). Mechanism of mining subsidence in coal mining area with thick alluvium soil in China. Arabian J. Of Geosciences 8 (4), 1855–1867. doi:10.1007/s12517-014-1382-2
Zhu, X. J., Guo, G. L., Liu, H., and Yang, X. Y. (2019). Surface subsidence prediction method of backfill-strip mining in coal mining. Bull. Of Eng. Geol. And Environ. 78 (8), 6235–6248. doi:10.1007/s10064-019-01485-3
Keywords: medium-depth buried coal seam, mining subsidence, super-long working faces, surface movement and deformation, surface cracks
Citation: Hou P, Wang S, Feng D, Xie X and Hou E (2025) Surface movement and crack development laws of super-long working faces in medium-depth coal seam mining. Front. Earth Sci. 12:1526950. doi: 10.3389/feart.2024.1526950
Received: 12 November 2024; Accepted: 05 December 2024;
Published: 08 January 2025.
Edited by:
Chong Xu, Ministry of Emergency Management, ChinaReviewed by:
Yulong Cui, Anhui University of Science and Technology, ChinaChengyu Xie, Xiangtan University, China
Hengzhong Zhu, Shandong University of Science and Technology, China
Hao Jian, Shandong University of Science and Technology, China
Dongjing Xu, Shandong University of Science and Technology, China
Copyright © 2025 Hou, Wang, Feng, Xie and Hou. This is an open-access article distributed under the terms of the Creative Commons Attribution License (CC BY). The use, distribution or reproduction in other forums is permitted, provided the original author(s) and the copyright owner(s) are credited and that the original publication in this journal is cited, in accordance with accepted academic practice. No use, distribution or reproduction is permitted which does not comply with these terms.
*Correspondence: Pengfei Hou, NDUxMjYyMjE2QHFxLmNvbQ==
 Pengfei Hou
 Shuangming Wang1,2
 Dong Feng
 Xiaoshen Xie