- 1College of Civil Engineering, Jiangsu Open University, Nanjing, Jiangsu, China
- 2Nanjing Water Planning and Designing Institute Corp., Ltd, Nanjing, Jiangsu, China
- 3Department of Geotechnical Engineering, Nanjing Hydraulic Research Institute, Nanjing, Jiangsu, China
An improved electroosmotic method which involves coupling anode movement with injection of calcium chloride (CaCl2) solution into soils during the electroosmotic process was proposed in this paper. The laboratory-based experimental study was conducted in a custom-designed test set-up to assess the effectiveness of the proposed method. During the electroosmotic process, the drained water, drainage rate, electric current, electric resistance, power consumption, settlement, and penetration resistance were monitored. The experimental study showed that after treatment, the drainage volume was about 3.5 times that of the pure electroosmotic, 1.6 times that of the electroosmotic process with injection only, and 2.4 times that of the electroosmotic process with anode movement only. Further, electrochemical injection coupled with anode movement can significantly reduce the non-uniform electrochemical changes in the treated samples, resulting in a relatively uniform settlement and considerable cementation area throughout the sample. The results demonstrate that using this method can effectively alleviate anode corrosion, double the voltage gradient and mitigate the electric resistance increase, further enhancing electroosmotic treatment efficiency.
1 Introduction
Electroosmosis is a process induced by electricity in which pore water moves from the anode to the cathode along with dissolved electrolytes, resulting in soil drainage and consolidation (Asadi et al., 2013; Pandey et al., 2024). Casagrande (1949) pioneered the use of this phenomenon to strengthen soft soil and improve the geotechnical properties of engineering materials. Since then, several studies followed to explore the characteristics of electroosmotic treatment (Bian et al., 2024; He et al., 2023; Alshawabkeh and Sheahan, 2003).
To enhance the effect of electroosmotic flow, the method of injecting chemical solutions into soil during electroosmotic process was adopted in recent years (Abdullah and Al-Abadi, 2010; Sun et al., 2023). The electroosmotic chemical method takes advantage of the interactions between chemical solutions and soil particles, including cation exchange and particle cementation, under the influence of an electric field (Martin et al., 2019). By using the electroosmotic chemical method one can inject chemical solutions into soft clay and avoid fracturing, making it a suitable approach for improving low permeability soils (Xue et al., 2018). Numerous solutions have been utilized as the injection materials during electroosmotic process, such as NaCl, KCL, CaCl2 (Chien et al., 2009), aluminum ions (Mohamedelhassan and Shang, 2003), NaOH, and Na2SiO3 (Moayedi et al., 2012), Mg(CH3COO)2, AgNO3 and ZnSO4 (Otsuki et al., 2007), and positively charged SiO2@Al2O3 core-shell nanoparticles (NPs) (Zhang et al., 2017). Injecting chemical solutions during electroosmotic process can increase the soil conductivity at the soil-electrode contact and effectively double the electrical potential transmitted to the soil, thereby improving the performance of electroosmotic consolidation (Chien et al., 2011; Chien et al., 2015). However, it also can be observed from previous studies that the improvements are primarily concentrated in the regions of the anode and cathode (Ou et al., 2009; Chien et al., 2010; Asavadorndeja and Glawe, 2005) despite that injecting chemical solutions during the electroosmotic process can effectively enhance the effectiveness of electroosmotic flow and improve soil strength.
In addition to the inhomogeneous effects, problems such as anode corrosion (Shi et al., 2021a; Liu et al., 2014), high energy consumption (Xiao et al., 2021), potential loss due to increasing contact resistivity (Mohamedelhassan and Shang, 2001; Zhuang and Wang, 2007), and formation of gases (Kalumba et al., 2009), also hinder the widespread application of electroosmotic technique in engineering projects. To overcome the aforementioned issues, a number of technical solutions have been proposed and experimentally studied. Lo et al. (1991) implemented electrode polarity reversal to achieve uniform soil strength between the electrodes. However, after the polarity reversal, the electrode interface resistance increases sharply, resulting in current reduction and low energy efficiency (Tao et al., 2014). Xiao et al. (2021) found that electrokinetic geosynthetics (EKG) electrodes can efficiently alleviate anode corrosion and accumulation of gases during the electroosmotic process. Nonetheless, the EKG electrodes exhibit a greater increase in resistance compared to conventional electrodes. Moreover, Asavadorndeja and Glawe (2005) reported an anode depolarization technique that prevents the formation and migration of hydrogen ions, achieving more uniform strength improvements compared to traditional methods. Peng et al. (2013) adopted a method that combines vacuum preloading and electroosmosis, which significantly and uniformly improved soil strength. However, the practical application of vacuum preloading combined with electroosmotic flow is extremely difficult, as the membrane used in vacuum preloading cannot maintain the tightness of the seal under the electric field conditions (Peng et al., 2015).
The main objective of this paper is to develop an improved method for electroosmotic treatment which could effectively expand the improvement area, decrease the extent of anode corrosion, and enhance the efficiency of the electroosmotic process. The improved electroosmotic method combines anode movement technique with injection of calcium chloride (CaCl2) solution into soils during the electroosmotic process. Treatment effect was investigated through monitoring the main characteristics of soft soils including drained water, drainage rate, electric current, electric resistance, power consumption, settlement, and penetration resistance. For comparison, pure electroosmotic process, electroosmotic process with anode movement technique only and electroosmotic process with injection of calcium chloride (CaCl2) only were also studied.
2 Experimental study
2.1 Experimental apparatus
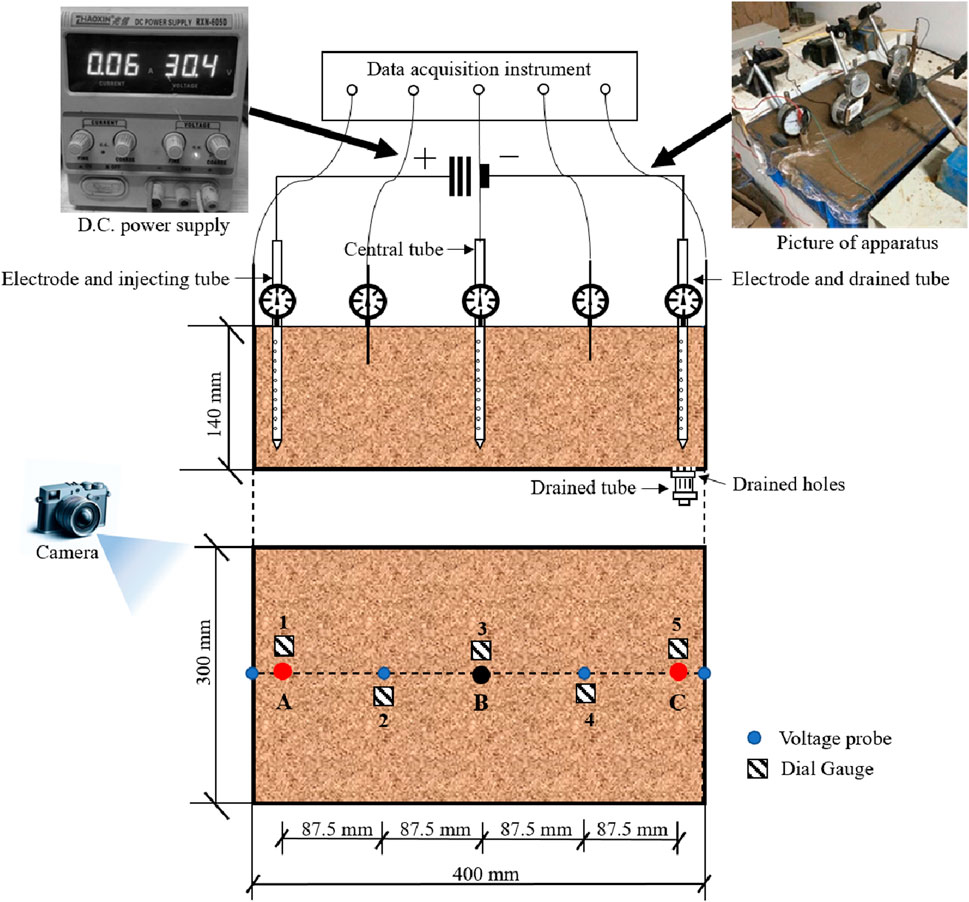
The test apparatus, as is displayed in Figure 1 in detail, was comprised of an electrokinetic cell and a D.C. power supply device. The electrokinetic cell, made of acrylics, holds a dimension of 440 mm in length, 330 mm in width, 140 mm in height and 10 mm in thickness. Similar to the experiment disposition designed by Chien et al. (2010), tubular stainless steel tubes were used as both electrodes (350 mm apart from each other) and the central tube (a tube at the midpoint between the anode and the cathode, 175 mm away from both electrodes), while the holes were drilled along the surface of the tube for injection (anode and central tube) and draining (cathode) during the electroosmotic process. The D.C. power supply device, which can provide an output voltage of up to 60 V and a current of 5 A, was connected to both the anode and cathode tube for electric supply. A number of drainage holes with a diameter of 3 mm were scattered at the bottom of the cell with a spacing of 10 mm from the cathode. The drainage process could be controlled through a drained tube at the end of the cell during the test.
Five voltage probes were installed on top of the cell to measure the voltage following an organized time interval. In the meantime, the vertical deformation resulting from soil consolidation is monitored by five dial gauges disposed on the top plater. Figure 1 illustrates the specific position of both voltage probes and dial gauges. The measuring cylinder and the multimeter were utilized to monitor of drained water volume and voltage, respectively. In addition, a camera was applied during the electroosmosis tests to investigate the physical behavior of soil-anode interface.
2.2 Materials
The soils used in this study were collected from the Jiangning District of Nanjing, China. The physical properties of the soil were assessed in accordance with the Chinese Standard GB/T 50,123-2019 (Standard for Soil Test Methods) (Chinese Standard GB/T 50123-2019, 2019) and were summarized in Table 1. Based on the Unified Soil Classification System (USCS) (ASTM International Standard D2487-17e1, 2017), the soil was classified as low plasticity clay (CL). Additionally, calcium chloride (CaCl₂) solution was employed as the injection material during the electroosmosis process.
2.3 Test procedure
A specified amount of air-dried soil was first mixed with distilled deionized water using a mechanical mixer to reach a water content of 1.5 times the liquid limit. This mixture was then stored in an airtight container with a sealed lid for 3 days to facilitate moisture equilibration. Subsequently, the prepared soil sample was layered into the electrokinetic cell in five separate layers, allowing for the placement of electrodes and a central tube. A saturated geomembrane was then positioned over the soil surface to create a horizontal flow condition.
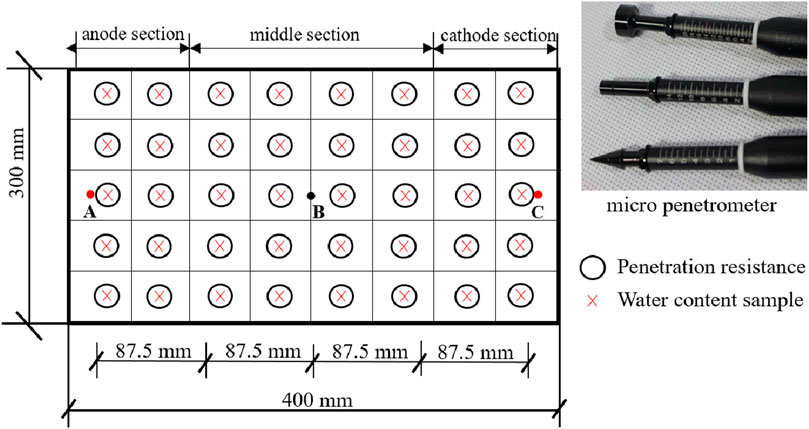
A direct current of 30 V was applied to the soil with a voltage gradient of 50 V/m to undertake the electroosmotic process, with each test lasting for 25 h. A total of 140 mL of CaCl2 solution with concentration of 2 mol/L was injected into the anode or the central tube, and water was discharged from the cathode during electroosmotic process. The voltage, current, surface settlement and drained water from the cathode were monitored during the test. The penetrometer resistance of the soil sample was assessed using a specially designed laboratory micro penetrometer, as illustrated in Figure 2. This micro penetrometer featured three dynamometers (I, II, and III) and three probes (A, B, and C). The actual penetration resistance can be obtained by multiplying the recorded reading by the corresponding calibration coefficient, with a measurement accuracy of ±5%. After the experiments, penetrometer resistance values were measured at various locations within the sample, as shown in Figure 2. Data readings were recorded electronically using a digital data logger. A total of four types of test were performed. The procedures for each type of tests are described below.
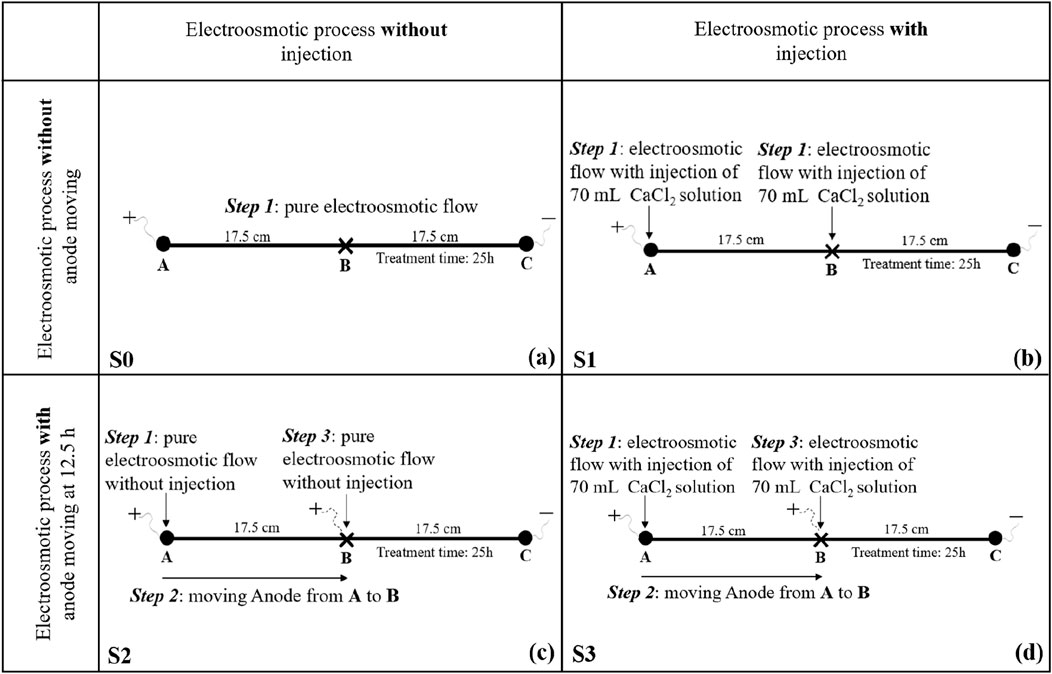
Four electroosmotic tests were denoted as S0, S1, S2 and S3 respectively. As presented in Figure 3, S0 refers to pure electroosmotic flow, S1 refers to electroosmotic flow with simultaneous injection through both the anode (Point A) and central tube (Point B), S2 refers to electroosmotic flow with anode movement (from Point A to B) only, and S3 refers to electroosmotic flow with anode movement (from Point A to B) coupled with injection of CaCl2 solution (through Point A followed by Point B). Specifically, for test S1, 70 mL of CaCl2 solution was firstly injected into the anode (Point A) and central tube (Point B) simultaneously immediately after powering on, and the electroosmotic process will continue for the whole treatment time of 25 h. For test S2, a pure electroosmotic process was first conducted for 12.5 h, after that the anode was pulled out and moved from Point A to Point B, followed by another 12.5 h of electroosmosis. While for test S3, 70 mL of CaCl2 solution was firstly injected into the anode (Point A) immediately after powering on, then the electroosmotic process will last for 12.5 h. After that, the anode was pulled out and moved from Point A to Point B, and another 70 mL of CaCl2 solution was injected into the anode (Point B), then the electroosmotic process will last for another 12.5 h. A detailed schematic diagram of these four tests are tabulated in Figure 3.
3 Results and discussions
3.1 Drained water and drainage rate
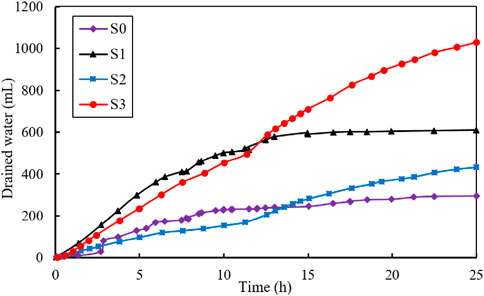
Figure 4 illustrates the variation of drained water (mL) during the electroosmotic process. The total volume of the drained water was 295, 609, 432, and 1030 mL for test S0, S1, S2 and S3, respectively. As shown in the figure, the drainage volume for the S3 test was the largest, approximately 3.5 times that of S0 test, 1.6 times that of the S1 test and 2.4 times that of the S2 test. It is worth noting that for S2 and S3 tests, a turning point in the drainage curve is observed around 12.5 h. In the first 12.5 h, the drainage volume was 170 mL for S2 and 496 mL for S3 test. Following this turning point, the drainage volume increased to 262 and 534 mL for S2 and S3 test, respectively.
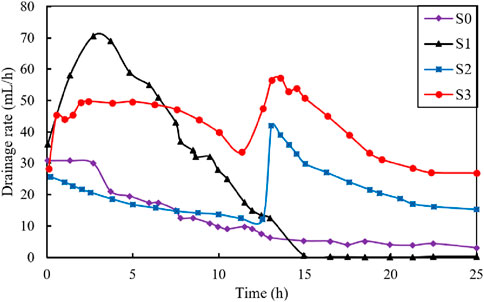
Figure 5 shows the drainage rate (mL/h) vs. time (h) during the electroosmotic process. The initial drainage rate for the four tests was approximately 30 mL/h. During electroosmotic process, the drainage rate of S0 exhibited a continuous decrease until it reached a state of stability. For S1 test, the drainage rate initially increased rapidly and reached a peak drainage rate value of 70.6 mL/h at 2.25 h. This was followed by a slow decrease in the next 13–15 h, after which a stable stage was reached. In comparison, both S2 and S3 curves exhibited a subsequent peak around 12.5 h. For the S3 test, the drainage rate increased from 28.5 to 49.4 mL/h in the first 2.5 h, followed by a gradual decrease and a subsequent peak of 57.2 mL/h was reached around 12.5 h. Conversely, the S2 test showed a continuous decrease in drainage rate from 26.0 to 12.4 mL/h in the first 12.5 h and reached its maximum value of 42 mL/h when the anode was moved, followed by a downward trend thereafter. Yoshida (2000) and Burnotte et al., (2004) showed that with the continuous application of a direct current, the electrical contact resistance between the electrodes (mainly the anode) and the soil is considerably increased, leaving an effective voltage gradient too small for significant electroosmotic dewatering. Therefore, it can be concluded that the increase in drainage rate of S2 and S3 during the subsequent 12.5 h was attributed to the movement of the anode, which effectively doubled the voltage gradient, thereby enhancing the drainage capacity of the soil matrix. In contrast, under the same condition of anode movement, S3 exhibited better drainage performance than S2. This is mainly because the injection of CaCl2 solution during the electroosmotic process in S3 will lead to an increase in electric conductivity and hydration of cation, resulting in a better drainage effect.
3.2 Electric current and electric resistance
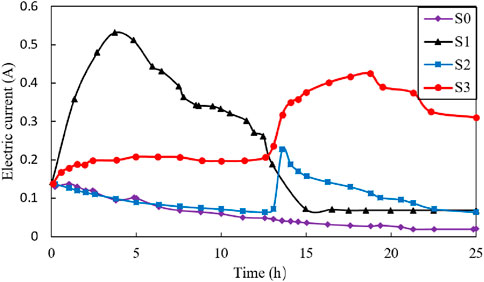
Figure 6 illustrate the variation of electric current (A) during the electroosmotic process. As noticed in Figure 6, the electric current in S0 test continuously decreased over time. Additionally, the electric current of S1 showed a rapid increase to more than 0.5 A due to the presence of salt solution, as well as the desorption and mobilization of ions in the soil matrix. Subsequently, the electric current decreased from 0.53 A to 0.06 A and finally a stable stage was reached. The decrease in electric current can be attributed to two reasons: first, a decline in the gradient of ionic concentration and a partial saturation of charge sites within the clay (Yukselen-Aksoy and Reddy, 2012), and second, anode corrosion and the formation of cracks near the anode area, which caused significant voltage loss and further reduced the electric current (Wu et al., 2015; Shi and Zhao, 2020; Shi et al., 2021b). For S2 and S3 tests, the change in electric current curve was similar to that in drainage rate curve, with a subsequent current peak value of 0.21 A for S2 and 0.42 A for S3 around 12.5 h. This observed increments in drainage efficiency and electric current around 12.5 h of S2 and S3 tests were may be due to fact that the anode being moved during the electroosmotic process. As mentioned, the movement of the anode, coupled with the injection of CaCl2 solution can significantly decrease the power loss and double the voltage, thereby leading to a substantial increase in electric current. In addition, the peak value of electric current of S3, which is twice that of S2, is mainly due to the fact that injection of the CaCl2 solutions.
A plot of electric resistance of the soil with regard to time is presented in Figures 7B–E. To provide a more comprehensive analysis of the electric resistance variations during the electroosmotic process, the changes in electric resistance for Part 1 (the soil adjacent to Point A), Part 2 (soil near the left side of the midline/Point B), Part 3 (the soil near the right side of the midline/Point B), and Part 4 (soil adjacent to Point C) were examined, as depicted in Figure 7A. Overall, the soil sample can be delineated into two main regions by the midline: the upper regions, which include Part 1 and Part 2, and the lower regions, which include Part 3 and Part 4.
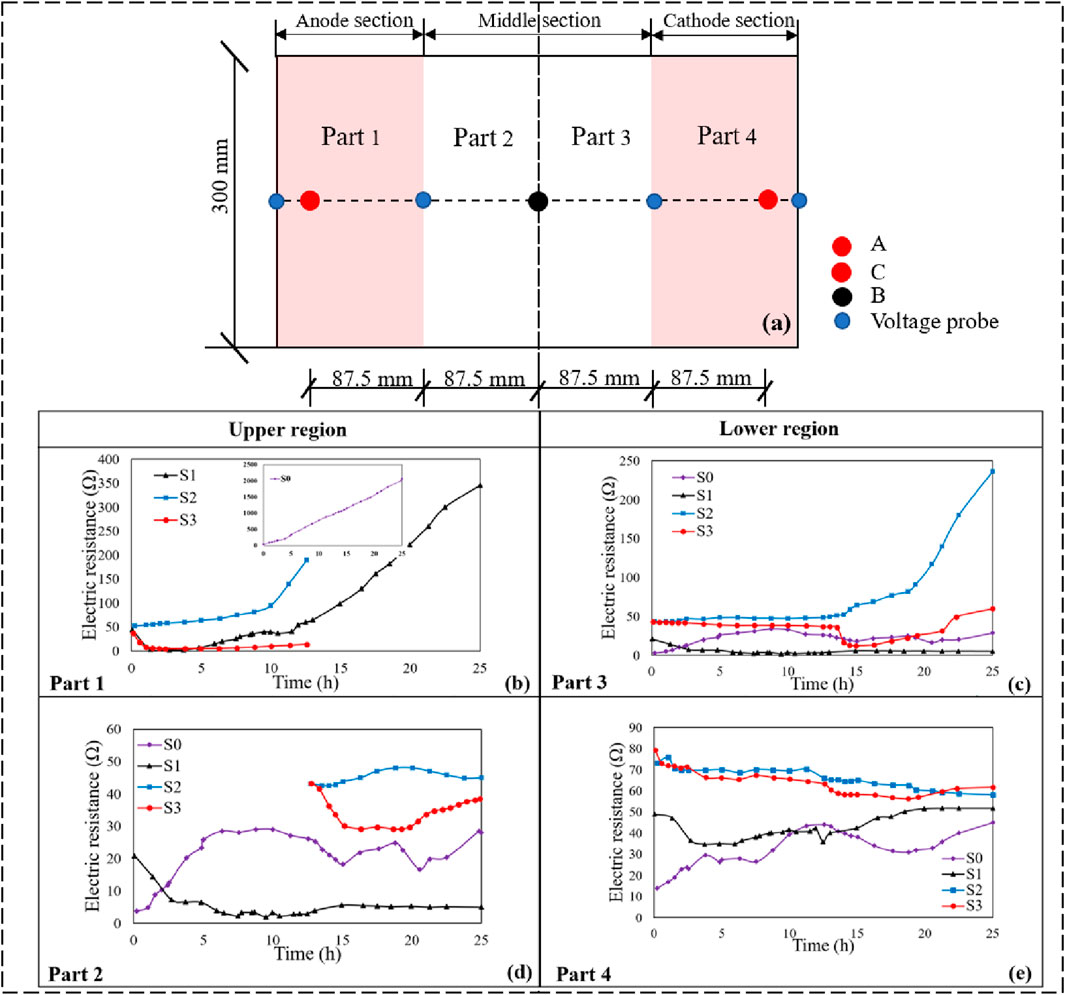
Figure 7. Electric resistance versus time during tests: (A) Schematic diagram of sample segmentation, (B) electric resistance of part 1, (C) electric resistance of part 3, and (D) electric resistance of part 2, and (E) electric resistance of part 4.
As illustrated in Figure 7B, the electric resistance of S0 test rapidly increased over time, reaching a value of 1,200 Ω after 25 h in Part 1. In comparison, the electrical resistance of S1 was obviously lower than that of S0 in the same section. This is attributed to the injection of CaCl2 solution, which markedly increased the total ion concentration within the soil matrix, resulting in an increase of current flow and a corresponding decrease in electric resistance. Comparing S1 and S3 tests in Figure 7B, it also can be observed that under the same treatment condition (electroosmotic process with injection of CaCl2 solution), the electric resistance of both tests remained at a relatively low level (below 60 Ω) in the first period of 12.5 h in Part 1. Subsequently, S1 experienced a significant increase in electric resistance, surging from 55 Ω to more than 300 Ω, while the electroosmotic process of S3 was halted due to the movement of the anode. Observing the electric resistance curves in Figure 7C, it can be noted that the electric resistance of S2 increased progressively after 12.5 h. In contrast, under the same conditions of anode movement, the resistance of S3 initially decreased and then experienced a slight increased, while it consistently remained below 55 Ω. Therefore, it can be concluded that injecting of CaCl2 solution coupled with moving the anode can significantly reduce the growth of electric resistance in Part 3. It is also worth noting that the electric resistance in the S2 and S3 tests was slightly higher than that in S0 and S1 within the regions of Parts 2 and 4, with the increase being generally less than 60 Ω, which is considered within an acceptable range for the tested soils. Clearly, the electric resistance was mainly affected in the regions of Parts 1 and 3 because the soil near the anode was more prone to water loss. In addition, water electrolysis and the impervious boundary led to an increase in gas pressure at the anode-soil interface, leading to significant volume shrinkage and cracks in both the Part 1 and Part 3 regions. These shrinkage cracks and gas accumulations substantially elevated the electric resistance, further reducing the electric current. Therefore, coupling anode movement with the injection of calcium chloride (CaCl2) solution during electroosmotic process can effectively prevent the increase in electric resistance, which further enhance the electroosmotic treatment efficiency.
3.3 Power consumption
High power consumption limits the engineering applications of electroosmosis. To evaluate the power consumption of the three tests, the electrical power consumption during the electroosmotic process and the unit drainage energy consumption were calculated and analyzed.
The electrical power consumption,
Where
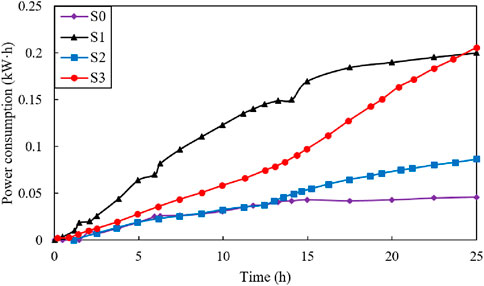
Figure 8 shows the power consumption (kW∙h) vs. time (h) during the electroosmotic process for the three tests. The power consumption after treatment is also presented in Table 2. The final power consumption was 0.05, 0.20, 0.09, and 0.21 kW h for tests S0, S1, S2 and S3, respectively. Analysis of the results from the S1 and S3 tests indicated that moving anode during the electroosmotic process had no significant impact on power consumption. Conversely, the power consumption following the injection of CaCl2 was approximately twice that of the condition without any solution injection. This is mainly because the electroosmotic flow with injection will result in an increase in electric conductivity, thus the power required for the process increases proportionally (Mohamedelhassan and Shang, 2001). Although the power consumed in tests S1 and S3 was slightly greater than that in tests S0 and S2, but the increment is acceptable in the case of the tested soils.
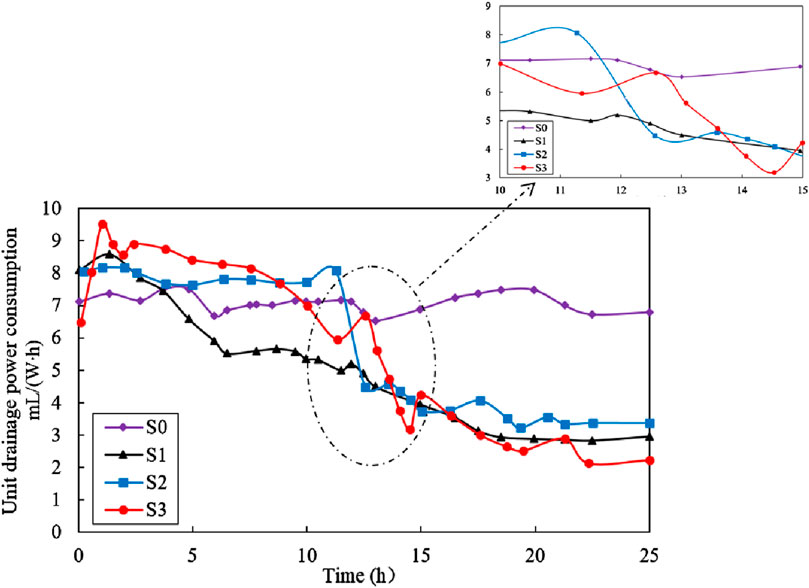
Figure 9 illustrates the variation of unit drainage power consumption (mL/(W∙h)) with time during treatment. The unit drainage power consumption, η, was obtained by the volume of drained water (mL) by dividing power consumption (W∙h). As shown in the figure, the η of S0 fluctuated around 7 mL/(W∙h) over time, while the η of S1 initially increased rapidly, peaking at 2.25 h with a value of 6.1 mL/(W∙h). This was followed by a gradual decrease in the next 13–15 h and afterwards a stable stage. The changes in η of S2 and S3 in this study was quite different from those of S0 and S1. In the first 12.5 h, the η for S2 and S3 tests exhibited a similar trend, with minor fluctuations around 8 mL/(W∙h) over time. Subsequently, both S2 and S3 experienced a notable reduction in η, with values decreased from 8.0 mL/(W∙h) for S2 and 67 mL/(W∙h) for S3 to 3.4 mL/(W∙h) and 2.3 mL/(W∙h), respectively. In summary, the η values for S2 and S3 were consistently higher than that of S1 test throughout the entire electroosmotic process, indicating that S1 test requires more electrical power to discharge the same volume of water.
3.4 Settlement
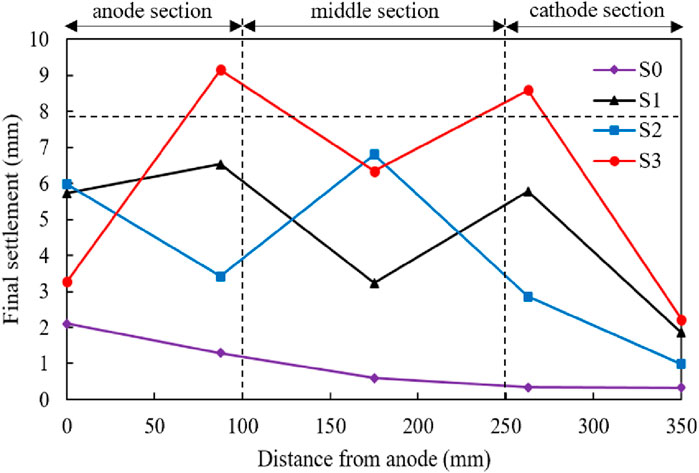
The final settlement measured at five locations, namely 0, 8.75, 17.5, 26.3 and 35 cm after treating vs. the distance from the anode for four different test procedures are presented in Figure 10. It is not surprising that all the settlements of five locations treated by test S0 keep the lowest, which was consistent with the previously observed lowest drained water among the four tests as shown in Figure 4. It can be readily seen that the settlement near Point A induced by test S1 was close to 6 mm, which is almost twice than that induced by S2 and S3, indicating that keeping the anode at Point A is benefit for the increase of final settlement near Point A. However, throughout the testing area, the settlement induced by S3 always keeps the largest except the observed Point A. To be specific, the final settlements measured at 8.75 and 26.3 cm away from Point A induced by S3 are 9 and 8.5 mm, 1.5 times than those induced by S1 and triple than those induced by S2. It can be concluded that moving the anode from Point A to B can certainly improve the settlement distribution throughout the whole treating area, especially for the area between Point A and B as well as Point B and C. It is interesting that the final settlement measured at Point B induced by S2 was lower than that induced by S3 and larger than that induced by S1, which means that the improvement on settlement brought by moving the anode from Point A to B is more drastic than that brought by electroosmotic flow with injection. It should also be admitted that the final settlements measured around cathode (Point C) induced by S1, S2 and S3 were close to each other and show not too much improvement compared with S0.
3.5 Penetration resistance
Penetration resistance can describe the strength of soils after electroosmotic treating. Figure 11 shows the contour plots of penetration resistance for the whole treating area after treatment for four tests. The contour plots were generated using Kriging method (Liang et al., 2018), which is a spatial interpolation estimator that is applied to find the best linear unbiased estimate at each location and is determined according to the linear combination of the known values of all sampled locations. The initial penetration resistance for natural samples ranged from 50 to 75 kPa for all the four tests. It is readily seen that Figure 11 can be divided into two categories, i.e., Figures 11A, B present the results for electroosmotic flow without anode moving, while Figures 11C, D present the results for electroosmotic flow with anode moving. It is obvious that the contour lines around Point B induced by S2 and S3 were denser compared with those induced by S1, indicating that moving anode from Point A to B could significantly improve the penetration resistance of soils around Point B. Furthermore, it is apparent that the soils, not only between the anode and the cathode, but also away from the alignment of the anode and the cathode, were significantly improved in S3. It should be noted that the penetration resistance of soils around Point A would be weakened by moving the anode from Point A to B. For example, the peak penetration resistance of soils around Point A treated by S1 was more than 1,400 kPa, while the peak values for S2 and S3 were about 500 kPa and 125 kPa, respectively. However, it has been proved that the area of penetration resistance greater than 100 kPa after treatment could be defined as a cementation area to describe the improvement of electroosmotic treatment, similar to the method used by Chien et al. (2010). It is expected that cementation between soil particles due to the chemical reaction between injected solutions should contribute to a large proportion of the cone resistance when it is greater than 100 kPa. Figure 12 plots the cementation area after treatment for four tests. It was calculated from Figure 12A and c that the cementation area for S0 and S2 were about 18.05% and 26.76% of the whole treating area, respectively. It is also evident that the cementation area in S1 and S3 were larger than that in S0 and S2, accounting for about 62.30% and 63.20% of the total area for S1 and S3, respectively. It is interesting that the cementation area treated by S1 and S3 were very close, the main difference lied in that the cementation area treated by S1 covers most of the area between Point B and C, whereas the cementation area treated by S3 covers most of the area between Point A and B. This is mainly because the injection of CaCl2 solution into Point B was kept during the treatment time for S1, while for S3, CaCl2 solution was injected to Point B only after the abode was moved from Point A to B. This observation indicates that electroosmotic process with anode movement coupled with injection of CaCl2 solution could further improve the homogeneous distribution of the treatment area.
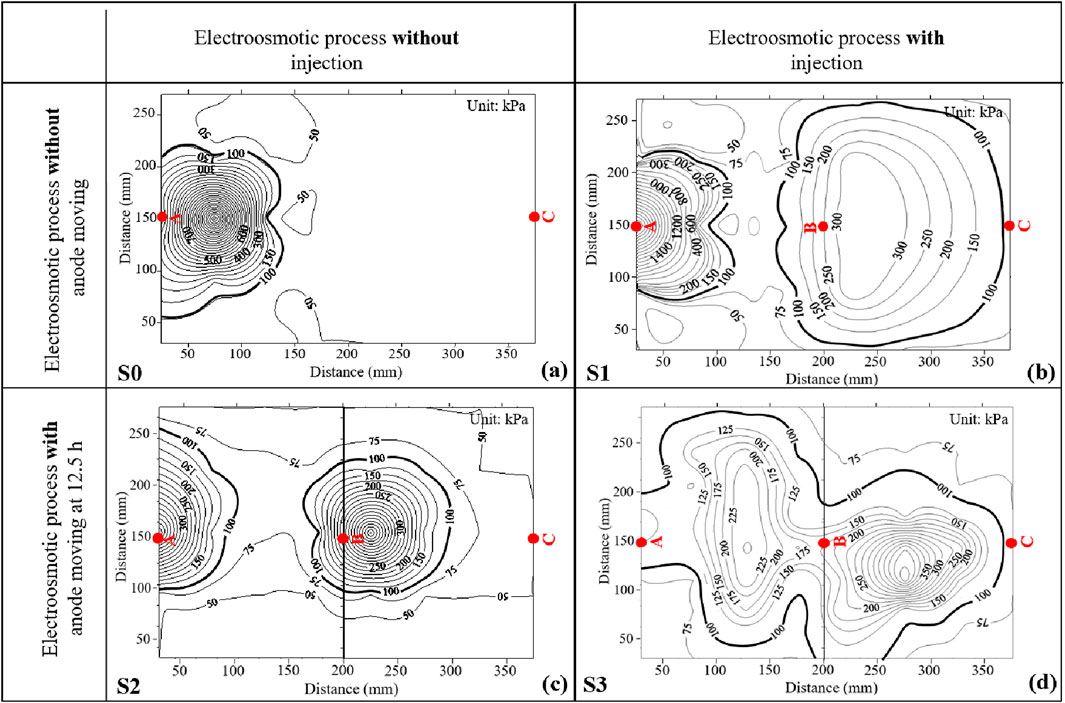
Figure 11. Penetration resistance contour plot after treatment: (A) S0 (pure electroosmotic flow); (B) S1 (electroosmotic flow with injection of CaCl2 solution); (C) S2 (electroosmotic flow with anode movement); (D) S3 (electroosmotic flow with anode movement coupled with injection of CaCl2 solution).
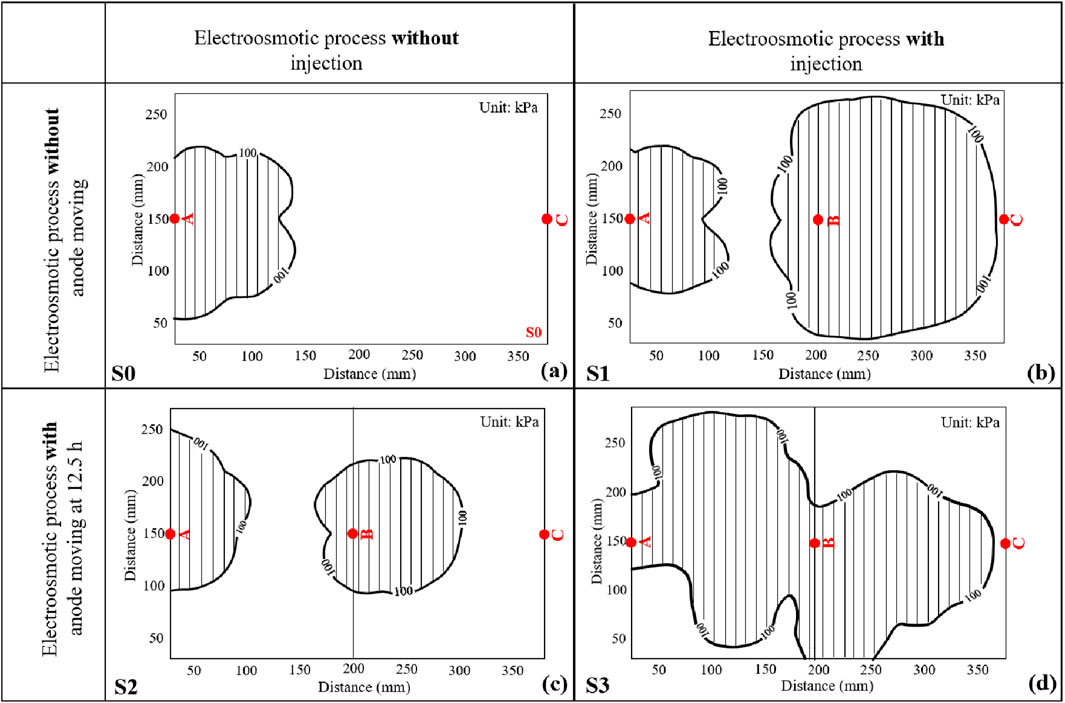
Figure 12. Comparison of the cementation area after treatment: (A) S0 (pure electroosmotic flow); (B) S1 (electroosmotic flow with injection of CaCl2 solution); (C) S2 (electroosmotic flow with anode movement); (D) S3 (electroosmotic flow with anode movement coupled with injection of CaCl2 solution).
4 Conclusion
In this study, the effect of electroosmotic process with and without anode movement was investigated through laboratory tests. For comparison, pure electroosmotic flow and electroosmotic flow with injection of calcium chloride (CaCl2) were also studied. During the tests, drained water, drainage rate, electric current, electric resistance, power consumption, settlement, and penetration resistance were analyzed to investigate drainage and consolidation behaviors. Based on the results of this study, the following conclusions can be drawn:
(1) The effect of electroosmotic flow can be improved by the injection of CaCl2 solution during electroosmotic process. After electroosmotic flow with injection of CaCl2 solution for a period of 25 h, the total volume of drained water was 609 mL, about 2.06 times that of pure electroosmotic flow without injection. Furthermore, the cementation area after treatment was increased to 62.30% of the entire sample, compared to 18.05% for pure electroosmotic flow.
(2) After pure electroosmotic process with anode movement, the drained water of soil was increased by 46%, compared to anode without movement. The test result also indicates that the electroosmotic process with anode movement can further improve the homogeneous distribution of the treatment area. In the electroosmotic process, the movement of the anode resulted in an approximate 8.71% increase in the cementation area compared to the anode not moving.
(3) After electroosmotic process with anode movement coupled with injection of CaCl2 solution, the drainage volume reached up to 1,030 mL, approximately 1.6–3.5 times greater than that of other schemes. Additionally, the corresponding cementation area extended to 63.20%, compared to 18.05% for pure electroosmotic flow and 26.76% for electroosmotic flow with anode movement only.
(4) The results found that the electroosmotic process with anode movement coupled with injection of CaCl2 solution was superior to other schemes in this study, which may be a potential technique for the improvement of soft clay.
Data availability statement
The original contributions presented in the study are included in the article/supplementary material, further inquiries can be directed to the corresponding author.
Author contributions
SH: Conceptualization, Data curation, Funding acquisition, Methodology, Validation, Writing–original draft. DY: Conceptualization, Methodology, Writing–review and editing. HL: Conceptualization, Formal Analysis, Writing–review and editing. TL: Funding acquisition, Methodology, Writing–review and editing. YW: Validation, Visualization, Writing–review and editing. YZ: Conceptualization, Data curation, Funding acquisition, Investigation, Writing–review and editing.
Funding
The author(s) declare that financial support was received for the research, authorship, and/or publication of this article. This work was supported by the National Natural Science Foundation of China (No. 52308355, 52309158, 52209166). The financial support from the Foundation of Nanjing Hydraulic Research Institute (NHRI, Grant Number Y323003) and the University Natural Science Foundation of Jiangsu Province (Grant No. 23KJB130004) are also greatly appreciated.
Conflict of interest
Authors DY and HL were employed by Nanjing Water Planning and Designing Institute Corp.
The remaining authors declare that the research was conducted in the absence of any commercial or financial relationships that could be construed as a potential conflict of interest.
Generative AI statement
The author(s) declare that no Generative AI was used in the creation of this manuscript.
Publisher’s note
All claims expressed in this article are solely those of the authors and do not necessarily represent those of their affiliated organizations, or those of the publisher, the editors and the reviewers. Any product that may be evaluated in this article, or claim that may be made by its manufacturer, is not guaranteed or endorsed by the publisher.
References
Abdullah, W. S., and Al-Abadi, A. M. (2010). Cationic–electrokinetic improvement of an expansive soil. Appl. Clay Sci. 47, 343–350. doi:10.1016/j.clay.2009.11.046
Alshawabkeh, A. N., and Sheahan, T. C. (2003). Soft soil stabilization by ionic injection under electric fields. Proc. Institution Civ. Eng. - Ground Improv. 7, 135–144. doi:10.1680/grim.2003.7.4.177
Asadi, A., Huat, B. B. K., Nahazanan, H., and Keykhah, H. A. (2013). Theory of electroosmosis in soil. Int. J. Electrochem. Sci. 8, 1016–1025. doi:10.1016/s1452-3981(23)14076-4
Asavadorndeja, P., and Glawe, U. (2005). Electrokinetic strengthening of soft clay using the anode depolarization method. B Eng. Geol. Environ. 64, 237–245. doi:10.1007/s10064-005-0276-7
ASTM International Standard D2487-17e1 (2017). Practice for classification of soils for engineering purposes. West Conshohocken, PA, U.S: Unified Soil Classification System.
Bian, X. Y., Yang, H. D., Liu, H., Xu, Z. Y., and Zhang, R. J. (2024). Experimental study on the improvement of sludge by vacuum preloading-stepped electroosmosis method with prefabricated horizontal drain. Geotext. Geomembr. 52, 753–761. doi:10.1016/j.geotexmem.2024.04.001
Burnotte, F., Lefebvre, G., and Grondin, G. A. (2004). A case record of electroosmotic consolidation of soft clay with improved soil–electrode contact. Can. Geotech. J. 41, 1038–1053. doi:10.1139/t04-045
Casagrande, I. L. (1949). Electro-osmosis in soils. Geotechnique 1, 159–177. doi:10.1680/geot.1949.1.3.159
Chien, S. C., Ou, C. Y., and Lee, Y. C. (2010). A novel electroosmotic chemical treatment technique for soil improvement. Appl. Clay Sci. 50, 481–492. doi:10.1016/j.clay.2010.09.014
Chien, S. C., Ou, C. Y., and Wang, M. K. (2009). Injection of saline solutions to improve the electro-osmotic pressure and consolidation of foundation soil. Appl. Clay Sci. 44, 218–224. doi:10.1016/j.clay.2009.02.006
Chien, S. C., Ou, C. Y., and Wang, Y. (2011). Soil improvement using electroosmosis with the injection of chemical solutions: laboratory tests. Chin. Inst. Eng. 34, 863–875. doi:10.1080/02533839.2011.591915
Chien, S. C., Teng, F. C., and Ou, C. Y. (2015). Soil improvement of electroosmosis with the chemical treatment using the suitable operation process. Acta Geotech. 10, 813–820. doi:10.1007/s11440-014-0319-y
Chinese Standard GB/T 50123-2019 (2019). Standard for geotechnical testing method. Beijing, China: Ministry of Housing and Urban-Rural Development of the People’s Republic of China.
He, B., Qin, X. H., Zhou, Z. Q., Xu, B., Yu, Sl, Qin, G. L., et al. (2023). Experimental study on composite flocculant-electroosmosis combined with segmented solidification treatment of high-water-content slurry. Constr. Build. Mater 400, 132729. doi:10.1016/j.conbuildmat.2023.132729
Kalumba, D., Glendinning, S., Rogers, C., Tyrer, M., and Boardman, D. (2009). Dewatering of tunneling slurry waste using electrokinetic geosynthetics. J. Environ. Eng. 135, 1227–1236. doi:10.1061/(asce)0733-9372(2009)135:11(1227)
Liang, C. P., Chen, J. S., Chien, Y. C., Jang, C. S., and Chen, C. F. (2018). Spatial analysis of the risk to human health from exposure to arsenic contaminated groundwater: a kriging approach. Sci. Total Environ. 627, 1048–1057. doi:10.1016/j.scitotenv.2018.01.294
Liu, F. Y., Wei, M. I., Zhang, L., and Wang, J. (2014). “Experimental study of the electro-osmosis consolidation of soft clay under anode follow-up,” in Ground improvement and geosynthetics, 188–197.
Lo, K. Y., Inculet, I. I., and Ho, K. S. (1991). Electroosmotic strengthening of soft sensitive clays. Can. Geotech. J. 28, A345–A373. doi:10.1016/0148-9062(91)91244-l
Martin, L., Alizadeh, V., and Meegoda, J. (2019). Electro-osmosis treatment techniques and their effect on dewatering of soils, sediments, and sludge: a review. Soils Found. 59, 407–418. doi:10.1016/j.sandf.2018.12.015
Moayedi, H., Kazemian, S., Huat, B. B. K., Mazloomi, K., Niroumand, H., and Daud, N. N. N. (2012). Effect of calcium chloride on the electrokinetic characteristics of organic soil. Int. J. Electrochem Sci. 7, 7740–7749. doi:10.1016/s1452-3981(23)15819-6
Mohamedelhassan, E., and Shang, J. Q. (2001). Effects of electrode materials and current intermittence in electro-osmosis. Proc. Institution Civ. Eng. - Ground Improv. 5, 3–11. doi:10.1680/grim.5.1.3.39435
Mohamedelhassan, E., and Shang, J. Q. (2003). Electrokinetics-generated pore fluid and ionic transport in an offshore calcareous soil. Can. Geotech. J. 40, 1185–1199. doi:10.1139/t03-060
Otsuki, N., Yodsudjai, W., and Nishida, T. (2007). Feasibility study on soil improvement using electrochemical technique. Constr. Build. Mater 21, 1046–1051. doi:10.1016/j.conbuildmat.2006.02.001
Ou, C. Y., Chien, S. C., and Wang, Y. G. (2009). On the enhancement of electroosmotic soil improvement by the injection of saline solutions. Appl. Clay Sci. 44, 130–136. doi:10.1016/j.clay.2008.12.014
Pandey, B. K., Rajesh, S., and Chandra, S. (2024). Engineering and physicochemical response of soft clay with electrokinetic consolidation process. Acta Geotech. 19, 5125–5141. doi:10.1007/s11440-024-02227-w
Peng, J., Xiong, X., Mahfouz, A. H., and Song, E. R. (2013). Vacuum preloading combined electroosmotic strengthening of ultra-soft soil. J. Cent. South Univ. 20, 3282–3295. doi:10.1007/s11771-013-1852-9
Peng, J., Ye, H., and Alshawabkeh, A. N. (2015). Soil improvement by electroosmotic grouting of saline solutions with vacuum drainage at the cathode. Appl. Clay Sci. 114, 53–60. doi:10.1016/j.clay.2015.05.012
Shi, X. S., Liu, K., and Yin, J. H. (2021b). Effect of initial density, particle shape, and confining stress on the critical state behavior of weathered gap-graded granular soils. J. Geotech. Geoenviron 147, 04020160. doi:10.1061/(asce)gt.1943-5606.0002449
Shi, X. S., and Zhao, J. D. (2020). Practical estimation of compression behavior of clayey/silty sands using equivalent void-ratio concept. J. Geotech. Geoenviron 146, 04020046. doi:10.1061/(asce)gt.1943-5606.0002267
Shi, X. S., Zhao, J. D., and Gao, Y. F. (2021a). A homogenization-based state-dependent model for gap-graded granular materials with fine-dominated structure. Int. J. Numer. Anal. Methods 45, 1007–1028. doi:10.1002/nag.3189
Sun, Z., Zhao, M., Chen, L., Gong, Z., Hu, J., and Ma, D. (2023). Electrokinetic remediation for the removal of heavy metals in soil: limitations, solutions and prospection. Sci. Total Environ. 903, 165970. doi:10.1016/j.scitotenv.2023.165970
Tao, Y. L., Zhou, J., Gong, X. N., Chen, Z., and Hu, P. C. (2014). Influence of polarity reversal and current intermittence on electro-osmosis. Ground Improv. Geosynth., 198–208. doi:10.1061/9780784413401.020
Wu, H., Hu, L., and Wen, Q. (2015). Electro-osmotic enhancement of bentonite with reactive and inert electrodes. Appl. Clay Sci. 111, 76–82. doi:10.1016/j.clay.2015.04.006
Xiao, F., Guo, K., and Zhuang, Y. F. (2021). Study on electroosmotic consolidation of sludge using EKG. Int. J. Geosynth. Ground Eng. 7, 33. doi:10.1007/s40891-021-00273-y
Xue, Z., Tang, X., Yang, Q., Tian, Z., Zhang, Y., and Xu, W. (2018). Mechanism of electro-osmotic chemical for clay improvement: process analysis and clay property evolution. Appl. Clay Sci. 166, 18–26. doi:10.1016/j.clay.2018.09.001
Yoshida, H. (2000). Electro-osmotic dewatering under intermittent power application by rectification of A.C. electric field. J. Chem. Eng. Jpn. 33, 134–140. doi:10.1252/jcej.33.134
Yukselen-Aksoy, Y., and Reddy, K. R. (2012). Effect of soil composition on electrokinetically enhanced persulfate oxidation of polychlorobiphenyls. Electrochim Acta 86, 164–169. doi:10.1016/j.electacta.2012.03.049
Zhang, H., Zhou, G., Zhong, J., Shen, Z., and Shi, X. (2017). Effect of nanomaterials and electrode configuration on soil consolidation by electroosmosis: experimental and modeling studies. RSC Adv. 7, 12103–12112. doi:10.1039/c6ra26674f
Keywords: electroosmotic process, soil improvement, anode movement, injection, cementation area
Citation: Han S, Yu D, Luo H, Li T, Wang Y and Zhang Y (2024) Experimental study on soil improvement by electrochemical injection coupled with anode movement technique. Front. Earth Sci. 12:1523656. doi: 10.3389/feart.2024.1523656
Received: 11 November 2024; Accepted: 26 November 2024;
Published: 09 December 2024.
Edited by:
Yifei Sun, Taiyuan University of Technology, ChinaCopyright © 2024 Han, Yu, Luo, Li, Wang and Zhang. This is an open-access article distributed under the terms of the Creative Commons Attribution License (CC BY). The use, distribution or reproduction in other forums is permitted, provided the original author(s) and the copyright owner(s) are credited and that the original publication in this journal is cited, in accordance with accepted academic practice. No use, distribution or reproduction is permitted which does not comply with these terms.
*Correspondence: Yijiang Zhang, eWp6aGFuZ0BuaHJpLmNu
 Shaoyang Han1
 Yijiang Zhang