- 1College of Earth Science and Engineering, Shandong University of Science and Technology, Qingdao, China
- 2Longshou Mine of Jinchuan Group Co., Ltd., Jinchuan, China
Introduction: In the excavation engineering of tunnels and mines in the western cold region, the unloading failure zone is mainly caused by stress release. This study aimed to investigate the deformation and failure mechanism of frozen weakly cemented sandstone (FWCS) when the initial principal stress σ3 was 3, 6, or 10 MPa.
Methods: A conventional triaxial compression test and a triaxial unloading test with an unloading rate of 0.05 MPa/s were carried out. Based on the experimental data and mathematical analysis methods, the non-linear criterion was constructed and analyzed. The microfracture characteristics of the damaged surface were studied by scanning electron microscopy (SEM).
Results: The results show that compared with conventional triaxial compression and room temperature triaxial compression tests, the strength and plastic deformation characteristics of FWCS during unloading were significantly weakened, with transverse deformation and volume strain increased, showing obvious dilatancy characteristics. Unloading reduced the cohesion of FWCS, increased the internal friction angle, and increased the risk of rock failure. Macroscopic and microscopic analysis revealed the failure mechanism of FWCS. The unloading stress ratio was introduced to establish relationships. A non-linear criterion based on the Mohr–Coulomb strength criterion was established, with the power function strength criterion being more accurate in describing the failure of FWCS.
Discussion: This study provides valuable insights into the mechanical properties and failure mechanism of FWCS under unloading conditions, which is beneficial for the excavation engineering of tunnels and mines in the western cold region.
1 Introduction
Weakly cemented soft rock (WCSR) is a general name for a type of soft rock widely distributed in Western China. There are many types of WCSRs, which have different mechanical properties, but they have common characteristics such as poor cementation, low strength, easy disintegration in water, susceptibility to softening, and extremely unstable mechanical properties (Chen et al., 2018; You et al., 2018; Hadi and Ali, 2018). Their extremely weak mechanical characteristics pose many challenges to engineering practices, and it is easy to induce engineering disasters if they are not properly mitigated (Cai and Zou, 2020; Liu J. S. et al., 2020; Lyu et al., 2019). Artificial freezing is widely utilized for the reinforcement of weakly cemented strata, which can improve strength, deformation resistance, and impermeability (Bai et al., 2020; Wang L. et al., 2020). The excavation and support of frozen rock mass is actually a process of loading and unloading, and the stress state of rock mass changes (Vazaios et al., 2019; Li et al., 2019). When disturbed by underground excavation, WCSR is unloaded, and its strength characteristics are obviously different from those of rock under loading conditions. If the research results on the strength of WCSR unloading are not accurately distinguished, potential risks may arise in guiding weakly consolidated soft rock engineering involving excavation and unloading, potentially leading to accidents and disasters. Therefore, it is highly significant to investigate the loading and unloading mechanical properties of WCSR and establish a failure criterion for the design and stability analysis of underground engineering involving weakly cemented rock.
In recent years, some scholars have studied the loading–unloading mechanical characteristics of frozen weakly cemented soft rock (FWCSR). Shan et al. (2016) pointed out that the ultimate strength of FWCSR under confining pressure unloading before the peak is lower than the peak strength in conventional triaxial tests; the lower the temperature, the smaller the deformation of the specimen caused by confining pressure unloading. Tensile failure is dominant in the specimen at the same time, and confining pressure unloading accelerates the axial compression and lateral expansion of the rock. Furthermore, the lateral expansion is much larger than the axial compression, which is positively correlated with the initial confining pressure (Dong et al., 2018). The ultimate bearing strength of rock under confining pressure unloading is positively related to the unloading rate, and brittle failure occurs at a high unloading rate, while plastic failure characteristics, including creep deformation, are observed at a low unloading rate, presenting an overall splitting failure form. With a decrease in the freezing temperature, the number of acoustic emission (AE) counts decreases, and the peak of AE energy increases. The peak of AE energy is positively correlated with the initial confining pressure and unloading rate (Liu, 2020; Liu et al., 2021). Other scholars have studied the mechanical properties of FWCSR using the cyclic loading–unloading tests, and the results show the energy-driven unloading process significantly affects the stress–strain evolution and failure characteristics of frozen soft rock. The peak strength increases under low confining pressure and decreases under high confining pressure. The elastic modulus first increases and then decreases with an increase in deviatoric stress (Li et al., 2018).
At present, the research on the loading–unloading mechanical properties of WCSR at room temperature is relatively sufficient (Zhao G. Y. et al., 2015; Fan et al., 2018; Wang et al., 2021); however, the loading–unloading mechanical properties of FWCSR are not sufficient, and the meso-failure mechanisms are not clear. Accordingly, several scholars have conducted qualitative analyses of mineral composition, micro-structure, and disintegration mechanisms of rocks using techniques including X-ray diffraction, scanning electron microscopy (SEM), and other microscopic observation methods. Research suggests that lithology, crystal structure, grain morphology, cement type, and clay mineral content are the key factors influencing the mechanical properties and failure mechanisms of rock (Zhao et al., 2023). Current research primarily aims to elucidate the microscopic influence of porosity on the strength of FWCSR (Qu et al., 2023). In our previous studies on the failure mechanisms of FWCSR (Liu et al., 2023; Lyu et al., 2024), we have identified a correlation between macroscopic failure characteristics and the development of microscopic fracture patterns. However, the macro and micro failure mechanisms of FWCSR under the unloading path are unclear and require further study.
Rock strength criterion has strong specificity. The strength criterion between different rocks is seriously affected by diagenesis, stress state, and internal structure (Yang et al., 2019), and only by constructing the strength criterion under the unloading path can the ultimate stress state of rock failure be better described. Many scholars have investigated different types of rocks. They pointed out that the non-linear Mohr strength criterion can be used as the strength criterion of rock failure in conventional triaxial loading–unloading tests (Wang et al., 2010; Zhao Y. C. et al., 2015; Zhou, 2020), and the linear Mohr–Coulomb strength criterion can be used as the strength criterion of rock failure in true triaxial loading–unloading tests (Liu S. et al., 2020; Feng et al., 2021; Lu et al., 2021). However, the current research mainly focuses on common rocks, and few reports present the research on the strength criterion of WCSR. Research on the strength criterion of FWCSR under loading–unloading tests is scarce, leading to a lack of applicable strength criterion for rock failure in engineering practice.
In this paper, the triaxial unloading test of FWCS is carried out, the stress–strain evolution under unloading conditions is obtained, and its mechanical characteristics are analyzed. The meso-failure mechanism of rock is analyzed using the FEI Quanta 450 field emission scanning electron microscope. Based on the experimental data, three non-linear strength criteria of FWCS are established, and the strength criterion is evaluated using the ordinary least squares. It is expected that the findings of this study can provide theoretical guidance for underground engineering in frozen weakly cemented strata.
2 Test overview
2.1 Specimen preparation
The weakly cemented sandstone specimens used in this paper were taken from the same area of weakly cemented strata in Mengcun, Xi’an. They are symmetrical, no cracks, fewer impurities, and good integrity. The specimen is a cylinder of Φ50 mm × 100 mm. The non-parallelism of the two ends of the specimen is controlled within 0.05 mm, the diameter error is not more than 0.3 mm, and the angle between the normal line of the end face and the axis of the specimen is not more than 0.25° (GB/T 50266-99, 2013).
2.2 Test scheme
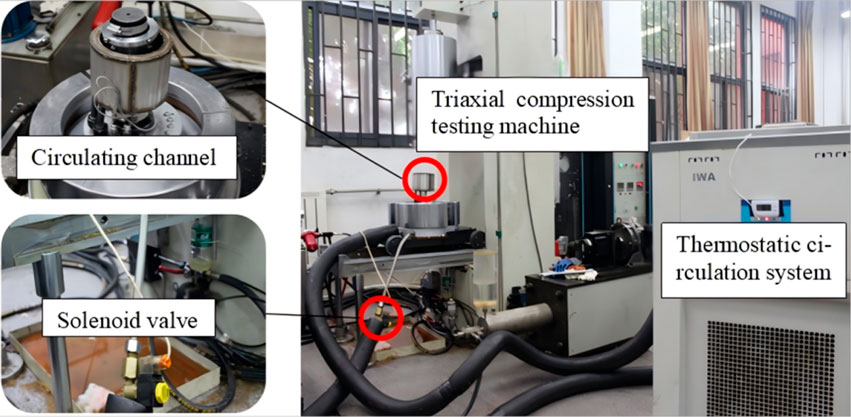
First, the sandstone specimens were placed in the DWX low-temperature freezing test chamber at −10°C for 48 h and then taken out for the next test step. The TAW-2000 constant temperature triaxial test system is selected to conduct the test, as shown in Figure 1. The initial confining pressures of triaxial unloading (σ3, σ2=σ3) were set at three levels: 3, 6, and 10 MPa. In addition, the conventional triaxial test is also conducted with the same confining pressures (3, 6, and 10 MPa) and loading rates for comparative analysis.
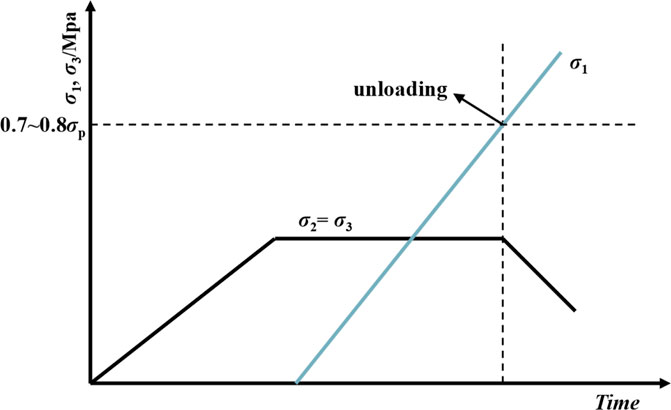
During the excavation of artificial frozen ground, stress redistribution leads to an increase in circumferential stress and a decrease in radial stress. Based on this, the triaxial unloading test program is designed, which mainly comprises three stages: (1) increase the confining pressure σ3 to the predetermined value (3, 6 ,and 10 MPa) with a loading rate of 0.05 MPa/s; (2) increase the axial pressure σ1 to 70∼80% of the peak strength with a loading rate of 0.02 mm/min through displacement control (the strength is greater than the uniaxial compressive strength); and (3) decline the confining pressure with a rate of 0.05 MPa/s and increase the axial pressure with a rate of 0.02 mm/min through displacement control until sample failure. The stress path diagram is shown in Figure 2.
The thermostatic circulation system was turned on to maintain the temperature at −10°C during the test. After the test, FEI Quanta 450 Field Emission Scanning Electron Microscope was used to scan the meso-structure of the FWCS fracture surface. Subsequently, the meso-structure of rock specimens was observed and analyzed.
3 Test results and analysis
3.1 Stress–strain curve and analysis
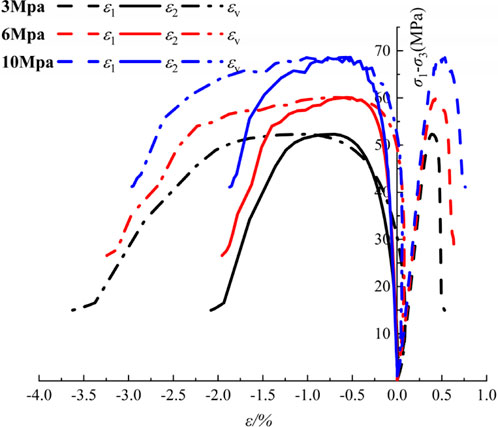
The stress–strain (axial, lateral, and bulk) curves of FWCS subjected to various initial confining pressures are depicted in Figure 3 during conventional triaxial compression tests.
Under various confining pressures, the stress–strain curves of FWCS manifest distinct elastic–plastic phases. As the confining pressure increases, the elastic stage gradually shortens, while the plastic stage gradually prolongs. Correspondingly, the principal stress difference increases when the volume strain of the rock sample changes from compression to expansion. The turning point stress difference increases from 50 MPa at an initial confining pressure of 3 MPa to 68 MPa at a confining pressure of 10 MPa. Under low confining pressure, the dilatancy of FWCS is notable. Under high confining pressure, the expansion phenomenon is relatively minor. This is because microfractures are more prone to develop in weakly consolidated sandstones with lower confining pressure, leading to an increase in volume. However, at higher confining pressure, the development of microcracks is restricted, resulting in a relatively small expansion phenomenon. With the growth of confining pressure, the yield strength of weakly cemented sandstone gradually decreases, and the yield strain gradually increases. The elastic modulus and Poisson’s ratio of FWCS also vary under different confining pressures.
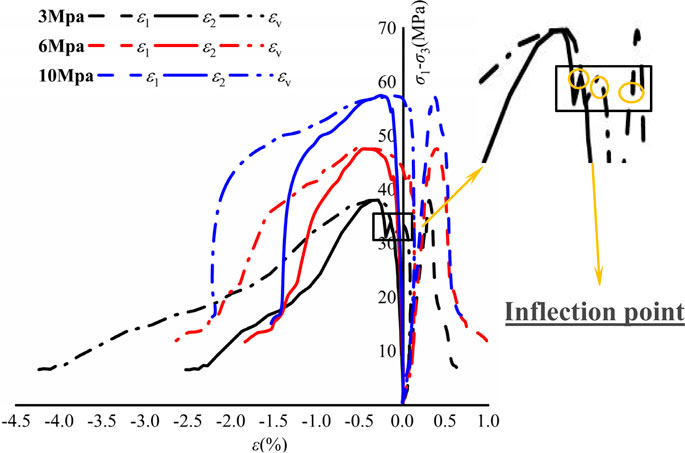
Triaxial unloading deviatoric stress–strain (axial, lateral, and volumetric) curves of FWCS with different initial confining pressures are shown in Figure 4.
FWCS, under various confining pressures, exhibits distinct brittle failure characteristics. As the test proceeds, the axial and lateral strain increase, and the body strain shifts from positive to negative. Before unloading, sandstone undergoes an elastic–plastic stage, during which the main fracture is gradually closed and compressed, and the secondary fracture forms in the plastic stage. The lateral strain increases rapidly, and the bulk strain decreases. The higher the confining pressure is, the more pronounced the inhibitory effect on secondary cracks becomes. At the onset of unloading, axial, lateral, and volumetric strains all present different “inflection points,” with those of lateral strain and volumetric strain being more evident. The lateral and bulk strain curves are relatively prominent, and the lower the confining pressure, the more conspicuous the decrease. Additionally, the lateral deformation of the rock sample increases rapidly at the beginning of confining pressure relief, and the bearing capacity of the rock sample decreases sharply when its strength exceeds the peak value of the principal stress difference. Taking the initial confining pressure of 6 MPa as an example, when the peak value of the principal stress difference is exceeded, the principal stress difference decreases directly from 48 MPa to 13 MPa, and the corresponding lateral strain value increases from −0.5% to −1.8%. The volume strain value increases from −0.4% to −2.6%, and the dilatation characteristics of rock samples are notable, indicating that the confining pressure relief of the unloading shaft before the peak accelerates the deformation and failure of rock samples. With axial loading and unloading of the confining pressure, the deviational stress gradually increases and reaches the ultimate bearing strength, the higher the initial confining pressure, the greater the ultimate bearing strength. Subsequently, the stress decreases significantly, the deviational stress decreases rapidly, the rock sample softens rapidly, the bearing capacity decreases rapidly, and the expansion volume continues to increase. After the peak strain, the rock sample loses its bearing capacity. The higher the residual confining pressure, the greater the inhibitory effect on the propagation of secondary cracks, the smaller the peak strain, and the greater the residual strength.
The stress–strain (axial and bulk) curves of conventional triaxial compression tests and triaxial unloading confining pressures of FWCS under different initial confining pressures are shown in Figure 5.
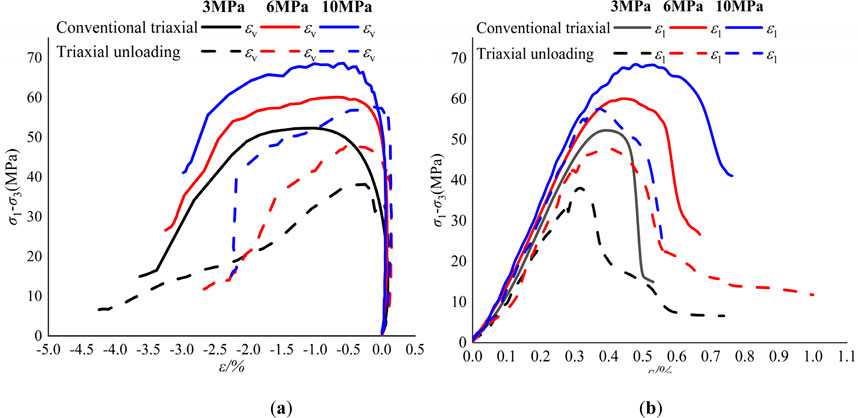
Figure 5. Stress–strain (axial and bulk) curves of conventional triaxial compression tests and triaxial unloading confining pressures: (A) Stress–strain (bulk) curve and (B) stress–strain (axial) curve.
The stress–strain (axial) curve of FWCS under the conventional triaxial compression test and triaxial unloading test at different initial confining pressures shows a consistent trend during the initial densification stage.
Under conventional triaxial conditions, with increases in the initial confining pressure, the axial strain values increase, respectively, from 0.38%, 0.47%, 0.55%–0.52%, 0.69%, and 0.77%. The volume strain values increase, respectively, from −0.75%, −0.2%, −0.15% to −3.68%, −3.25%, and −3.1%. Additionally, with the increase in axial stress, the stress–strain relationship of the rock turns non-linear, and the axial curve begins to bulge and tends to be horizontal. The main reason for non-linear deformation is the formation and development of micro-cracks in the rock. Meanwhile, the lateral strain increases rapidly and dominates, causing the rock to expand.
Under the triaxial unloading confining pressure condition, the strain curve of the rock sample exhibits a stress decrease with a small amplitude, and the axial strain of the rock sample does not vary significantly. This occurs because when the confining pressure is released, the control mode switches to maintain displacement, which, in turn, reduces the axial pressure and the principal stress difference of the rock sample. The lower the initial confining pressure, the more pronounced the stress decrease in the stress–strain curve. During the unloading stage, as the confining pressure continuously decreases, the deviatoric stress increases again. Although the axial strain remains essentially unchanged, a slight reduction in the confining pressure leads to a rapid increase in the volumetric strain. The confining pressure continues to decrease until the rock sample exceeds the peak point. At this stage, the bearing capacity of the rock sample decreases rapidly, the rock sample expands vigorously along the unloading direction, the rock sample strain surges, and the axial strain values increase, respectively, from 0.33%, 0.43%, 0.35%–0.72%, 1%, and 0.6%. The volumetric strain values increase, respectively, from −0.25%, −0.5%, 0.1% to −4.4%, −2.75%, and −2.25%. The rock samples expanded sharply along the unloading direction, and the brittle failure characteristics were more pronounced than those of conventional loading tests. When the peak strain is reached, the rock sample loses its bearing capacity.
3.2 Analysis of the failure strength characteristics of triaxial unloading
According to the above analysis, in the loading state, the stress of the rock gradually increases to its peak strength and failure occurs, while in the unloading process, the deviational stress of the rock does not reach its peak strength. In order to quantitatively analyze the influence of triaxial unloading on the strength characteristics of FWCS, Mohr-Coulomb strength criterion was used to determine the strength parameters, and the obtained results were shown in Table 1. Among them, the peak strength level of rock failure during unloading is expressed by the ultimate bearing strength σp.

Table 1. Conventional triaxial compression test and triaxial unloading confining pressure strength characteristic value of FWCS.
It can be observed from the data in Table 1 that the strength of FWCS along three axial confining paths under different initial confining pressures shows an obvious confining effect. The confining amounts under 3 MPa, 6 MPa, and 10 MPa confining pressures are 53.6%, 44.2%, and 44.9%, respectively. According to the state of residual stress, the residual stress of the rock sample under the triaxial unloading path is the smallest, which indicates that the plastic deformation of the rock sample under this path is larger..
Compared with the conventional triaxial compression tests, the cohesion of the triaxial unloading rock sample decreases by approximately 27%, while the internal friction angle increases by approximately 5.1%. The greater the cohesion, the stronger the tensile resistance of the rock; the greater the internal friction angle, the stronger the shear resistance of the rock and, the more stable the rock.
3.3 Analysis of the deformation characteristics of triaxial unloading
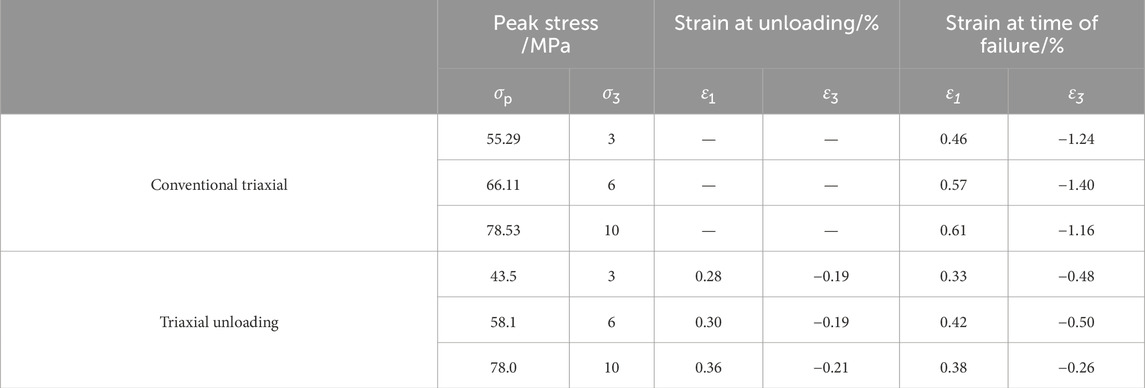
In order to quantitatively analyze the deformation characteristics of rock samples under triaxial loading, the axial and volumetric strain data of each initial confining pressure of FWCS under different stress paths are shown in Table 2.
It can be observed from Table 2 that the axial and lateral strains of rock samples under the unloading stress path are smaller than those under the loading stress path, indicating a reduction in the deformation resistance of rocks. Moreover, it is observed that as the initial confining pressure decreases, the axial strain of rock samples during conventional triaxial failure increases, while the lateral strain during both triaxial unloading and conventional triaxial failure decreases. In terms of triaxial unloading, it is noted that the applied peak axial stress does not reach the ultimate strength capacity of rocks. Additionally, lower initial confining pressures result in smaller applied peak axial stresses and reduced susceptibility to failure for rock samples. As confinement progresses, internal cracks within rock samples fully develop, leading to larger lateral strains.
3.4 Macro-meso failure mechanism of weakly cemented sandstone under triaxial unloading
3.4.1 Macro-failure characteristics
The failure characteristics of rock have an obvious correlation with the stress path, and the failure forms of different stress paths are different. The macro-failure patterns of weakly cemented sandstone in triaxial unloading and conventional triaxial are shown in Figure 6.
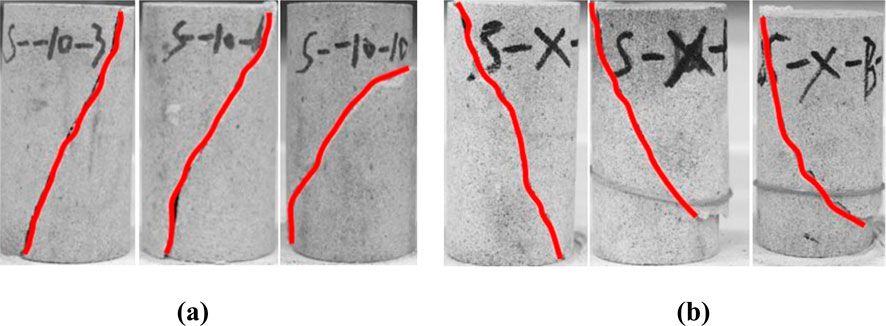
Figure 6. Macro-failure characteristics of FWCS: (A) conventional triaxial and (B) triaxial unloading.
As shown in Figure 6, there is a main fracture and no incomplete fracture on the surface of the specimen in the triaxial unloading test. The rock specimen exhibits shear failure as the dominant mode, with the shear characteristics being more obvious. When the initial confining pressure is 3 MPa, the main fracture penetrates both ends of the rock specimen. As the initial confining pressure increases, the main fracture no longer penetrates both ends of the rock specimen, and the left and right parts of the main fracture surface are obviously dislocated. Similar to the conventional triaxial test, a large amount of rock powder and a small amount of rock fragments are attached to the main fracture surface, but the rock powder and rock fragments in the triaxial unloading test are more than those in the conventional triaxial test. The higher the initial confining pressure, the more rock powder and rock fragments on the fracture surface. The reason for this phenomenon is that during the continuous axial loading process, the confining pressure decreases, which is equivalent to the lateral tension applied to the rock specimen; as the lateral inhibition to the rock specimen weakens, the friction between particles decreases, making it easier for the particles on the fracture surface to fall off. Furthermore, the expansion phenomenon gradually intensifies as the lateral inhibition weakens. Similar to the conventional triaxial test, the angle between the main fracture surface and the axis of the rock specimen increases with the initial confining pressure. However, under the same initial confining pressure, the angle between the main fracture surface and the axis of the rock specimen in the triaxial unloading test is smaller than that in the conventional triaxial test, and the brittle failure characteristics of rock in the triaxial unloading test are more pronounced than those observed in the conventional triaxial test.
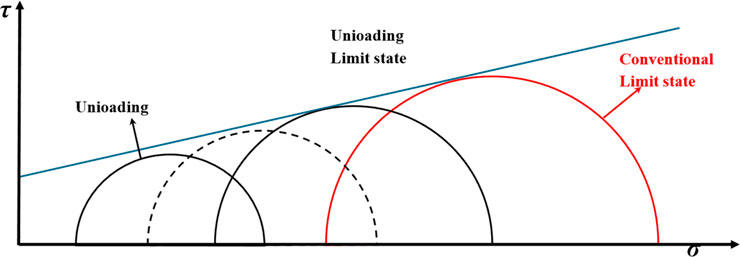
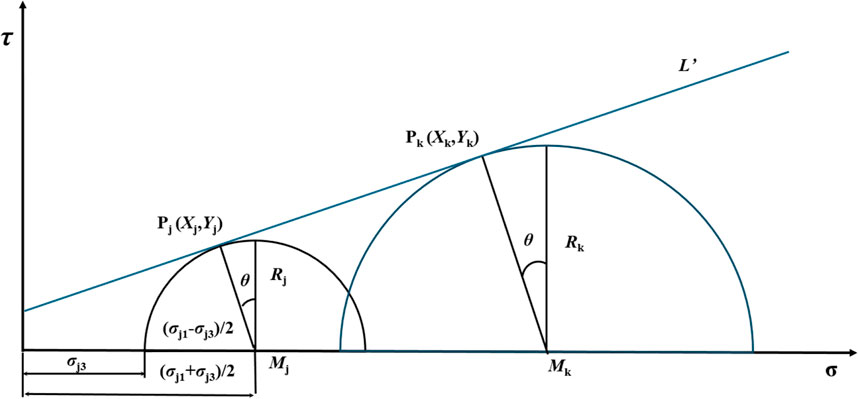
In the triaxial unloading test, the corresponding maximum principal stress σ1 increases continuously, and the minimum principal stress σ3 decreases continuously due to continuous axial loading and lateral unloading. According to the Mohr–Coulomb yield criterion, the center of Mohr’s circle is (σ1+σ3)/2, and the radius is (σ1-σ3)/2. As shown in Figure 7, because the unloading rate of the confining pressure is less than the axial loading rate, the center of Mohr’s circle gradually shifts to the right. However, the radius of Mohr’s circle increases rapidly. Thus, the yield limit is reached quickly, and the rock specimen showed brittle tensile-shear failure. The higher the initial confining pressure, the greater the residual confining pressure and the stronger the inhibition effect on the lateral deformation of the rock specimen. Therefore, the higher the initial confining pressure, the less obvious the tensile failure characteristics of the rock specimens.
3.4.2 Meso-failure characteristics
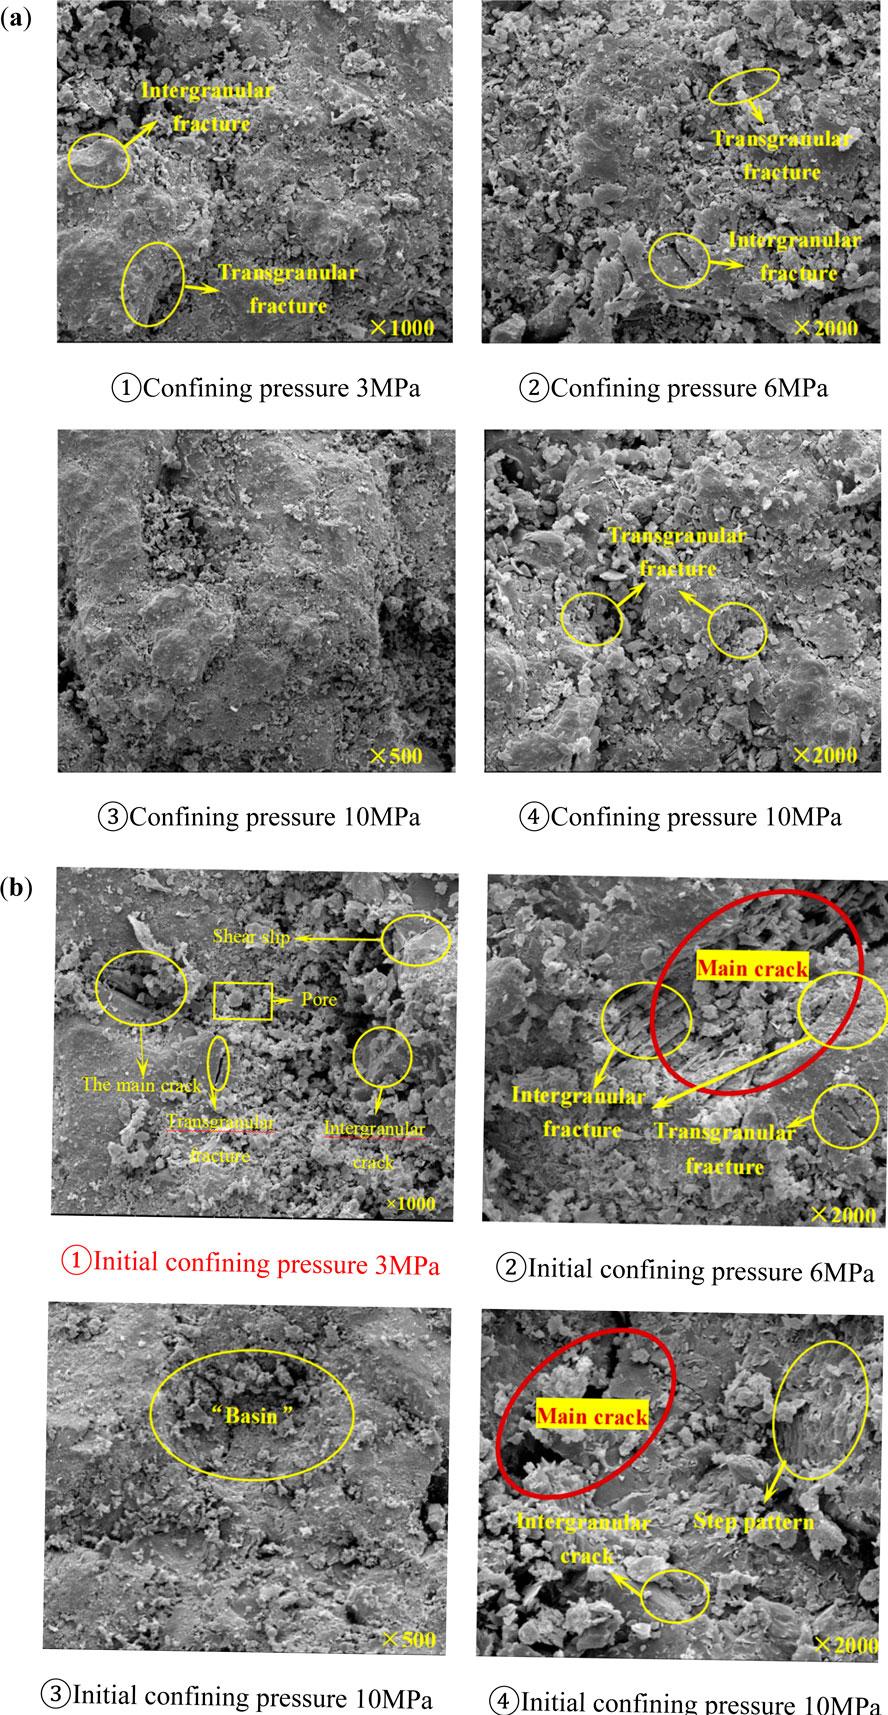
The deformation and failure of rock materials are products of microcrack evolution (Wang S. et al., 2020). From the point of view of fracture mechanics, the formation of macroscopic failure surfaces of rock is mainly due to the drive of external load and the generation and expansion of internal cracks and their interaction. The meso-fracture morphology can qualitatively reflect the meso-failure mechanism of rock (Fu et al., 2022; Wu et al., 2020; Niu et al., 2021). Typical fractures under different paths are shown in Figure 8.
As shown in Figure 8, the meso-fracture morphology of triaxial unloading and conventional triaxial have some similarities, showing areas that are locally flat and locally rough, and because of the existence of the primary pores, cracks, and the shear slide friction of the rock specimen, some particles fall off and break, creating local unevenness and causing the rock particles to attach to the surface.
For triaxial unloading, when the initial confining pressure is 3 MPa, the meso-fracture of FWCS is mainly intergranular, with localized transgranular fractures. Because of the low confining pressure, the pores inside the rock are relatively large, resulting in shear slip cracks, with shear failure characteristics being obvious. Shedding particles and debris are present in the main crack, and a few cracks are perpendicular to the main crack, indicating that tensile failure in the main crack is accompanied by shear failure during unloading. When the initial confining pressure is 6 MPa, many intergranular fractures are randomly distributed around the main crack; these intergranular fractures only produce cracks due to the longitudinal adhesion of some particles. Some particles fall off and fill the main crack due to the weak longitudinal bonding force between particles, and there are transgranular fractures in some places. The tensile failure characteristics still exist. When the initial confining pressure is 10 MPa, intergranular fractures are clearly visible, higher pressure aggravates the particles falling off. A transgranular fracture refers to a fracture mode in which the crack spreads through the grain inside the crystal in the form of tearing. A intergranular fracture is a type of the fracture mode in which the crack expands along the grain boundary when the material is fractured. Several cracks are perpendicular to the main fracture surface, indicating that during unloading, tensile failure within the main fracture surface transitions to shear failure. This further confirms a shear-dominated, shear-tensile combined failure mechanism. Under low magnification, a “Basin” structure appears locally, with numerous pieces of debris of different sizes. Under high magnification, a step pattern can be clearly observed, the width of the main crack increases, corresponding to the dislocation of the fracture surface, while secondary cracks are not developed, and the tensile failure characteristics are not obvious.
With an increase in the initial confining pressure, the tensile failure characteristics of rock specimens gradually weaken. The transgranular failure effect also gradually weakens except for the main crack, and the amount of rock debris and rock particles increase gradually. In addition, there are some differences between triaxial unloading and conventional triaxial tests. Under the same (initial) confining pressure, the size of debris and particles attached to the conventional triaxial meso-surface is smaller than that in the triaxial unloading test. As the confining pressure decreases, the interlocking and cementation strength between particles weakens, making it more prone to large rock debris spalling. Furthermore, no main cracks are found on the conventional triaxial meso-surface, while unloading causes the meso-structure to be more prone to large-scale, connected failures.
Combined with the macro-failure analysis, the rock samples under triaxial unloading show a tensile-shear failure form under low initial confining pressure in a macro-view, which gradually transforms into shear-tensile failure as the confining pressure increases. This indicates that the shear failure is closely related to the transgranular fracture of rock, while the tensile failure is closely related to the intergranular fracture. After unloading to a certain extent, when the shear-tensile stress in the rock sample exceeds the maximum tensile stress that the rock particle bonding and the ice crystal itself and the contact surface can withstand, cracks commence and spread gradually. At this point, lateral deformation increases rapidly, which eventually leads to the brittle failure of the rock sample. The mesoscopic rock debris corresponds to the rock powder and fragments found on the macro-fracture surface.
4 Triaxial unloading strength characteristics and criterion of frozen weakly cemented sandstone
4.1 Triaxial unloading strength characteristics of frozen weakly cemented sandstone
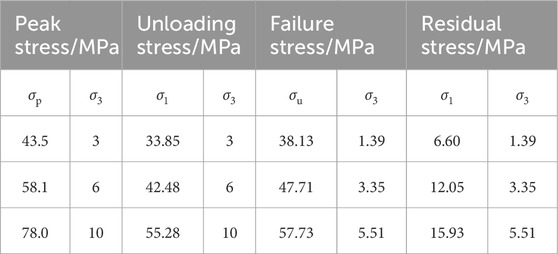
The stress value of FWCS is shown in Table 3.
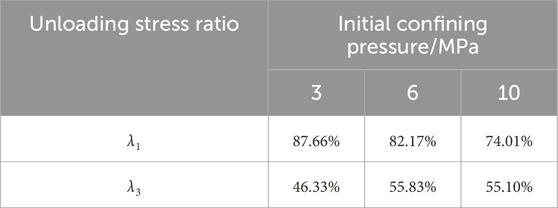
As shown in Table 3, σu < σp, which proves that confining pressure unloading reduces the bearing capacity of rock, making rock specimens more susceptible to destruction (Hu et al., 2022); this defines the unloading stress ratio λi. This is shown in Equation 1.
where λi, σi|u, and σi|c are the unloading stress ratio, principal stress of triaxial unloading of rock failure, and principal stress of conventional triaxial of rock failure, respectively; when subscript i is 1, it represents the maximum principal stress, and when i is 3, it represents the minimum principal stress. The unloading stress ratio under different initial confining pressures can be obtained, as shown in Table 4.
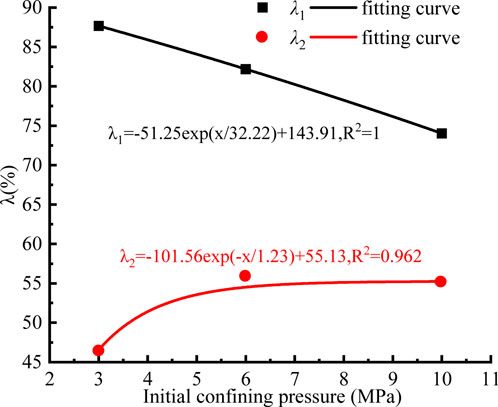
The data in Table 4 are plotted and fitted to obtain Figure 9.
It can be observed that there is an exponential function relationship between the initial confining pressure and the unloading stress ratio. According to the fitting relationship, as the initial confining pressure increases, the maximum principal stress of unloading decreases, and the minimum principal stress ratio of unloading increases.
For FWCS, the following relationship exists.
Extending Equation 2 to other types of FWCSR, we obtain
In Equations 2, 3, σu is the ultimate triaxial unloading bearing strength; σp is the peak strength of conventional triaxial loading; σ3|r and σ3|i are triaxial unloading residual confining pressure and initial confining pressure, respectively; A, B, C, D, E, and F are the parameters related to the test, respectively.
4.2 Triaxial unloading strength criterion of frozen weakly cemented sandstone
Assuming that the maximum principal stress is σi1 and the corresponding minimum principal stress is σi3 when rock failure occurs, the abscissa of the center and the radius of any Mohr’s circle are as follows in Equation 4:
where Mi and Ri are the abscissa of the center and the radius of any Mohr’s circle, respectively. Two Mohr’s circles and their common tangent should be drawn as shown in Figure 10.
In Figure 10, Pj (Xj, Yj) and Pk (Xk, Yk) are tangent points on any two non-nested Mohr’s circles and L′ is the common tangent. According to the geometric relationship, Equation 5 can be written as follows:
Among them,
Equation 5 can be written as
Combining Equations 6, 7, in the case of obtaining two groups of maximum and minimum principal stresses when rock specimens are destructed, the inclination angle, tangent point coordinates, and the expression of common tangent line can be obtained. Assuming that there are k (k ≥ 2) groups of Mohr’s circles, the number of common tangent points on any two Mohr’s circles can be obtained as shown in Equation 8.
where N and C are the number of common tangent points on any two Mohr’s circles and combination operation symbol, respectively. Assuming the fitting relationship of the strength envelope for the triaxial unloading test of the FWCS is an n-order polynomial, it can be expressed as the Equation 9
where ψ represents the shear stress τ, X represents the principal stress σ, and ζi (i=1, 2, 3, … , n) is the regression coefficient. According to the least-squares principle (Zeng, 2018),
Solving partial derivative of Equation 10,
Let
Combining Equations 11, 12, it is expressed in the matrix form as follows:
The envelope curve of any n-order polynomial can be fitted by Equation 13. Based on the data in Table 1, all the tangent points of Mohr’s circles of the three sets of rock specimens are calculated as follows:
For the triaxial unloading test of FWCS, the non-linear Mohr–Coulomb strength criterion such as power function type, parabolic function type, and logarithmic function type are used for fitting.
4.2.1 Power function strength criterion
The fitting expression of the single parameter power function strength criterion can be expressed as the Equation 15 (Zhang and Yu, 2020)
Let X0.75=K; after the linear transformation of the matrix (Equation 14), ζ0 = 2.69 and ζ1 = 2.41 can be obtained according to the method described in Section 4.2. So, the power function strength criterion expression can be expressed as the Equation 16
4.2.2 Parabolic function strength criterion
Referring to the single parameter parabolic strength criterion (Bieniawski, 1974), the fitting expression of the parabolic function strength criterion can be expressed as the Equation 17
After the linear transformation of the matrix (Equation 14), ζ0 = −7.359, ζ1 = 1.175, and ζ2 = −0.00598 can be obtained according to the method described in Section 4.2. Thus, the parabolic function strength criterion expression can be expressed as the Equation 18
4.2.3 Logarithmic function strength criterion
The fitting expression of the logarithmic function strength criterion can be expressed as the Equation 19 (Shi et al., 2015)
Let lnX = W, after the linear transformation of the matrix (14), ζ0 = −5.99 and ζ1 = 9.80 can be obtained according to the method described in Section 4.2. Thus, the logarithmic function strength criterion expression can be expressed as the Equation 20
4.2.4 Strength criterion evaluation
The standard deviation SD of the fitting envelope is used to evaluate the error of the strength criterion. The standard deviation calculation formula can be expressed as the Equation 21
where Yj, Ŷj, and N are the vertical ordinate of the tangent point of common tangent, the vertical ordinate corresponding to the abscissa of the tangent point in each strength criterion fitting curve, and the total number of tangent points, respectively. To determine the reliability of the test data, the mean square error Ŝ of all tangent points on any Mohr’s circle can be calculated as follows in Equation 22:
where Yi, Ŷi, and n are the vertical ordinate of the tangent point of common tangent, the vertical ordinate corresponding to the abscissa of the tangent point in each strength criterion fitting curve, and the total number of tangent points on any Mohr’s circle, respectively. The test data are proved reliable if Ŝ<1.8 SD (Guo et al., 2020). The standard deviation SD and mean square error Ŝ of the non-linear strength criterion fitting curve are shown in Table 5.
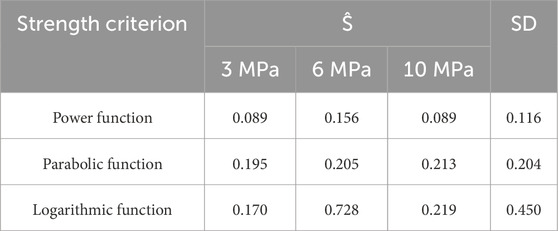
Table 5. Standard deviation and mean square deviation of non-linear strength criterion fitting curve.
It can be observed from Table 5 that three non-linear strength criteria satisfy Ŝ <1.8 SD, which proves that the test data are very reliable. In the case of confining pressure of 3 MPa, the mean square error of the logarithmic function is slightly smaller than that of parabolic function. In other cases, given standard deviation or mean square error, the power function is the smallest, the parabolic function is the second, and the logarithmic function is the largest, which indicates that the power function strength criterion is the best criterion for the triaxial unloading failure of FWCS.
5 Conclusion
In this paper, the triaxial unloading test is carried out with FWCS as the research object. The stress–strain evolution of FWCS under triaxial unloading is clarified, and the macro-meso failure mechanism of FWCS under triaxial unloading is revealed. The strength criterion of FWCS is constructed and optimized by the least squares method, and the following conclusions are obtained:
(1) The axial, lateral, and volumetric strains bend to different degrees because of confining pressure unloading. The stress–strain curve is no longer smooth, and the lateral expansion and volume expansion are obvious. The larger the initial confining pressure, the smaller the peak strain, and the greater the ultimate bearing strength and residual strength. Compared with the conventional loading peak strength, the higher the initial confining pressure, the greater the difference between the ultimate bearing strength and the peak strength.
(2) The meso-failure of the specimen is mainly characterized by intergranular and transgranular fractures, with the intergranular fracture being dominant, and there are a lot of particles and rock debris on the meso-fracture surface. The lower the initial confining pressure, the more obvious the transgranular fracture and the tensile characteristics. With an increase in the initial confining pressure, transgranular fractures gradually decreased, tensile characteristics weakened, and debris and particles on the meso-fracture surface gradually increased. Under the condition of low initial confining pressure, the mesoscopic tensile failure characteristics make the specimen show tensile-shear failure, and the main fracture penetrates both ends of the rock specimen. With an increase in the initial confining pressure, the mesoscopic tensile characteristics weaken, so the macro-failure of the rock gradually transforms into shear-tensile failure, and rock debris and particles are macroscopically manifested as rock powder and rock fragments.
(3) With an increase in the initial confining pressure, the unloading maximum principal stress ratio decreases and the unloading minimum principal stress ratio increases. The relations between σu, σp, σ3|i, and σ3|r are constructed, and the applicability of the power function, parabolic function, and logarithmic function strength criterion for triaxial unloading of FWCS is analyzed. The results show that the power function strength criterion can best reflect the triaxial unloading mechanical properties of frozen weakly cemented sandstone.
Data availability statement
The original contributions presented in the study are included in the article/Supplementary Material; further inquiries can be directed to the corresponding author.
Author contributions
QD: project administration, supervision, validation, writing–original draft, and writing–review and editing. HF: conceptualization, data curation, methodology, supervision, validation, writing–original draft, and writing–review and editing. JW: data curation, project administration, writing–original draft, and writing–review and editing. XA: software, supervision, validation, visualization, and writing–review and editing. XL: data curation, formal analysis, supervision, validation, and writing–review and editing.
Funding
The author(s) declare that no financial support was received for the research, authorship, and/or publication of this article.
Acknowledgments
The authors wish to acknowledge the support of the Department of College of Earth Science and Engineering of the Shandong University of Science and Technology and the Longshou Mine of Jinchuan Group Co.
Conflict of interest
Author JW was employed by Longshou Mine of Jinchuan Group Co., Ltd.
The remaining authors declare that the research was conducted in the absence of any commercial or financial relationships that could be construed as a potential conflict of interest.
Generative AI statement
The author(s) declare that no Generative AI was used in the creation of this manuscript.
Publisher’s note
All claims expressed in this article are solely those of the authors and do not necessarily represent those of their affiliated organizations, or those of the publisher, the editors and the reviewers. Any product that may be evaluated in this article, or claim that may be made by its manufacturer, is not guaranteed or endorsed by the publisher.
References
Bai, Y., Shan, R. L., Ju, Y., Wu, Y. X., Sun, P. F., and Wang, Z. N. (2020). Study on the mechanical properties and damage constitutive model of frozen weakly cemented red sandstone. Cold. Reg. Sci. Technol. 171, 102980. doi:10.1016/j.coldregions.2019.102980
Bieniawski, Z. T. (1974). Estimating the strength of rock materials. J. S. Afr. I. Min. Metall. 74, 312–320.
Cai, J. L., and Zou, W. (2020). Triaxial compressive failure characteristics and constitutive model study of jurassic-cretaceous weakly cemented sandstone. Adv. Civ. Eng. 2020, 8812575. doi:10.1155/2020/8812575
Chen, Z. Q., He, C., Dong, W. J., Ma, G. Y., Pan, X. Y., and Pei, C. Y. (2018). Physico-mechanical properties and its energy damage evolution mechanism of the Jurassic and Cretaceous argillaceous sandstone in Northern Xinjiang. Rock. Soil. Mech. 39, 2873–2885. doi:10.16285/j.rsm.2018.0212
Dong, X. H., Yang, G. S., Tian, J. F., Rong, T. L., Jia, H. L., and Liu, H. (2018). Characteristics of deformation properties of frozen sandstone under lateral unloading condition. Rock. Soil. Mech. 39, 2518–2526. doi:10.16285/j.rsm.2017.1299
Fan, G. W., Chen, M. W., Zhang, D. S., Wang, Z., Zhang, S. Z., Zhang, C. G., et al. (2018). Experimental study on the permeability of weakly cemented rock under different stress states in triaxial compression tests. Geofluids 2018, 1–9. doi:10.1155/2018/9035654
Feng, F., Chen, S. J., Wang, Y. J., Huang, W. P., and Han, Z. Y. (2021). Cracking mechanism and strength criteria evaluation of granite affected by intermediate principal stresses subjected to unloading stress state. Int. J. Rock. Mech. Min. Sci. 143, 104783. doi:10.1016/j.ijrmms.2021.104783
Fu, X. D., Du, Y. X., Sheng, Q., Zhang, Z. P., and Huang, J. H. (2022). Influences of water on the microstructure and mechanical behavior of the Xigeda formation. Bull. Eng. Geol. Environ. 81, 72. doi:10.1007/s10064-022-02567-5
GB/T 50266-99 (2013). Standard for test methods of engineering rock mass. Available at: https://www.codeofchina.com/standard/GBT50266-2013.html (Accessed October 1, 2013).
Guo, B. H., Wang, L., Li, Y. Z., and Chen, Y. (2020). Triaxial strength criteria in Mohr stress space for intact rocks. Adv. Civ. Eng. 2020, 8858363. doi:10.1155/2020/8858363
Hadi, A., and Ali, M. (2018). The influence of mean grain size on unconfined compressive strength of weakly consolidated reservoir sandstones. J. Petrol. Sci. Eng. 171, 63–70. doi:10.1016/j.petrol.2018.07.029
Hu, X. Z., Li, Q. B., Wu, Z. M., and Yang, S. T. (2022). Modelling fracture process zone width and length for quasi-brittle fracture of rock, concrete and ceramics. Eng. Fract. Mech. 259, 108158. doi:10.1016/j.engfracmech.2021.108158
Li, T., Ma, Y. J., Liu, B., Sheng, H. L., and He, P. (2018). Strength characteristics and elastic modulus evolution of frozen gray sandstone under cyclic loading. J. China. Coal. Soc. 43, 2438–2443. doi:10.13225/j.cnki.jccs.2018.0482
Li, X. B., Chen, Z. H., Weng, L., and Li, C. J. (2019). Unloading responses of pre-flawed rock specimens under different unloading rates. T. nonferr. Metal. Soc. 29, 1516–1526. doi:10.1016/s1003-6326(19)65059-4
Liu, J., Lyu, X., Liu, Y., and Zhang, P. (2023). Energy evolution and macro-micro failure mechanisms of frozen weakly cemented sandstone under uniaxial cyclic loading and unloading. Cold Reg. Sci. Technol. 214, 103947. doi:10.1016/j.coldregions.2023.103947
Liu, J. S., Jing, H. W., Meng, B., Wang, L. G., Yang, J. J., and Zhang, X. F. (2020). A four-element fractional creep model of weakly cemented soft rock. Bull. Eng. Geol. Environ. 79, 5569–5584. doi:10.1007/s10064-020-01869-w
Liu, S. (2020). Experimental study on mechanical properties of Cretaceous frozen sandstone under lateral unloading. Xi'an: Xi'an university of science and technology.
Liu, S., Yang, G. S., Dong, X. H., Shen, Y. J., and Liu, H. (2021). Mechanical characteristics of frozen sandstone under lateral unloading: an experimental study. Adv. Civ. Eng. 2021, 6653294. doi:10.1155/2021/6653294
Liu, S., Zhu, Q. Z., and Shao, J. F. (2020). Deformation and mechanical properties of rock: effect of hydromechanical coupling under unloading conditions. Bull. Eng. Geol. Environ. 79, 5517–5534. doi:10.1007/s10064-020-01824-9
Lu, W. B., Zhu, Z. D., He, Y. X., and Que, X. C. (2021). Strength characteristics and failure mechanism of a columnar jointed rock mass under uniaxial, triaxial, and true triaxial confinement. Rock. Mech. Rock. Eng. 54, 2425–2439. doi:10.1007/s00603-021-02400-7
Lyu, X., Du, J., Fu, H., Lyu, D., and Wang, W. (2024). Macro-micro behaviors and failure mechanism of frozen weakly cemented mudstone. J. Rock. Mech. Geotech. Eng. 16 (4), 1337–1347. doi:10.1016/j.jrmge.2023.06.024
Lyu, X. Z., Zhao, Z. G., Wang, X. J., and Wang, W. M. (2019). Study on the permeability of weakly cemented sandstones. Geofluids 2019, 1–14. doi:10.1155/2019/8310128
Niu, C. Y., Zhu, Z. M., Zhou, L., Li, X. H., Ying, P., Dong, Y. Q., et al. (2021). Study on the microscopic damage evolution and dynamic fracture properties of sandstone under freeze-thaw cycles. Cold. Reg. Sci. Technol. 191, 103328. doi:10.1016/j.coldregions.2021.103328
Qu, Y., Yang, G., Xi, J., Ni, W., Ding, X., and Wu, B. (2023). Mechanical properties and energydissipation mechanism of frozen coarse-grained and medium-grained sandstones. J. Cent. South Univ. 30 (6), 2018–2034. doi:10.1007/s11771-023-5344-2
Shan, R. L., Yang, H., Zhang, J. X., Guo, Z. M., and Zhao, D. H. (2016). Mechanical properties of saturated red sandstone of Meilinmiao mine under loading and unloading at negative temperatures. J. Min. Saf. Eng. 33, 924–931.
Shi, X. C., Cai, W. Q., Meng, Y. F., Li, G., and Li, J. X. (2015). Wellbore stability analysis based on a new strength criterion. J. Nat. Gas. Sci. Eng. 27, 1005–1015. doi:10.1016/j.jngse.2015.09.050
Vazaios, I., Vlachopoulos, N., and Diederichs, M. S. (2019). Assessing fracturing mechanisms and evolution of excavation damaged zone of tunnels in interlocked rock masses at high stresses using a finite-discrete element approach. J. Rock. Mech. Geotech. 11, 701–722. doi:10.1016/j.jrmge.2019.02.004
Wang, B., Zhu, J. B., Wu, A. Q., and Liu, X. H. (2010). Experimental validation of nonlinear strength property of rock under high geostress. Chin. J. Rock Mech. Eng. 29, 542–548.
Wang, L., Su, H. M., Chen, S. G., and Qin, Y. (2020). Nonlinear dynamic constitutive model of frozen sandstone based on weibull distribution. Adv. Civ. Eng. 2020, 6439207. doi:10.1155/2020/6439207
Wang, S., Xu, W., Yan, L., Feng, X.-T., Xie, W.-C., and Chen, H. (2020). Experimental investigation and failure mechanism analysis for dacite under true triaxial unloading conditions. Eng. Geol. 264, 105407. doi:10.1016/j.enggeo.2019.105407
Wang, Z. K., Li, W. P., and Hu, Y. B. (2021). Experimental study on mechanical behavior, permeability, and damage characteristics of Jurassic sandstone under varying stress paths. Bull. Eng. Geol. Environ. 80, 4423–4439. doi:10.1007/s10064-021-02214-5
Wu, Z. J., Ji, X. K., Liu, Q. S., and Fan, L. F. (2020). Study of microstructure effect on the nonlinear mechanical behavior and failure process of rock using an image-based-FDEM model. Comput. Geotech. 121, 103480. doi:10.1016/j.compgeo.2020.103480
Yang, G. S., Wei, Y., Shen, Y. J., Wang, L., Liu, H., Dong, X. H., et al. (2019). Mechanical behavior and strength forecast model of frozen saturated sandstone under triaxial compression. Chin. J. Rock Mech. Eng. 38, 683–694. doi:10.13722/j.cnki.jrme.2018.1417
You, S., Ji, H. G., Wang, T., and Song, Z. Y. (2018). Thermal and mechanical coupling effects on permeability of weakly cemented sandstone. Emerg. Mate. Res. 7, 100–108. doi:10.1680/jemmr.16.00082
Zeng, B. (2018). Study on mechanical characteristics and constitutive model of red sandstone during axial unloading-tensile under confining pressure. Chongqing: Chongqing University.
Zhang, J., and Yu, J. H. (2020). Parameter resolution of estimation method for linear regression models. Acta. Math. Sci. 40, 1381–1392.
Zhao, G. Y., Dai, B., Dong, L. J., and Yang, C. (2015). Experimental research on mechanical characteristics and strength criterion of rock under triaxial unloading tests under different stress paths. Rock. Soil. Mech. 36, 3121–3127+3149. doi:10.16285/j.rsm.2015.11.011
Zhao, Y. C., Yang, T. H., Xiao, F. K., Wang, H., Liu, G., Zheng, X., et al. (2015). The variation law of plastic strain energy of weak cemented sandstone under cyclic loading in western China. J. China. Coal. Soc. 40, 1813–1819. doi:10.13225/j.cnki.jccs.2014.1192
Zhao, Z., Liu, H., Gao, X., and Feng, Y. (2023). Meso-macro damage deterioration of weakly cemented red sandstone under the coupling effect of high-humidity and uniaxial loading. Eng. Fail. Anal. 143, 106911. doi:10.1016/j.engfailanal.2022.106911
Keywords: frozen weakly cemented sandstone, loading-unloading, confining pressure unloading, failure mechanism, strength criterion
Citation: Deng Q, Fu H, Wang J, An X and Lyu X (2025) Macro-meso failure mechanism and strength criterion of frozen weakly cemented sandstone under triaxial unloading. Front. Earth Sci. 12:1518849. doi: 10.3389/feart.2024.1518849
Received: 29 October 2024; Accepted: 09 December 2024;
Published: 06 January 2025.
Edited by:
Huiming Tan, Hohai University, ChinaReviewed by:
Geng Jiabo, Jiangxi University of Science and Technology, ChinaZhiwei Ye, Nanchang University, China
Copyright © 2025 Deng, Fu, Wang, An and Lyu. This is an open-access article distributed under the terms of the Creative Commons Attribution License (CC BY). The use, distribution or reproduction in other forums is permitted, provided the original author(s) and the copyright owner(s) are credited and that the original publication in this journal is cited, in accordance with accepted academic practice. No use, distribution or reproduction is permitted which does not comply with these terms.
*Correspondence: Xianzhou Lyu, bHl1eGlhbnpob3UwNjA4QHNkdXN0LmVkdS5jbg==
 Qinghai Deng
 Hao Fu1
 Xianzhou Lyu