 Senhu Lin
 Xia Luo1*
 Lianhua Hou
 Hui Li
94% of researchers rate our articles as excellent or good
Learn more about the work of our research integrity team to safeguard the quality of each article we publish.
Find out more
ORIGINAL RESEARCH article
Front. Earth Sci., 22 January 2025
Sec. Geochemistry
Volume 12 - 2024 | https://doi.org/10.3389/feart.2024.1518236
In-situ conversion technology is a sustainable and effective method of recovering medium-low maturity shale, which can be produced with oil resources expected to exceed global total proven oil reserves. Nevertheless, criteria and procedures for grading such shale oil resources are lacking. We present a combination of distinct faceis and theoretical economic index (Ie) to grade the in-situ conversion shale oil resources of Chang 7 Member in the Ordos Basin and Nenjiang Formation in the Songliao Basin. This shale oil resource was categorized into four classes: invalid, valid, sweet-spot and core resource. For the shale dominated by type II kerogen (Chang 7), total organic carbon (TOC) values at 6%, 9%, and 12%, hydrocarbon generation potential (S1+S2) values at 15 mg/g, 30 mg/g, and 50 mg/g, and Ie at 2, 3, and 4, respectively, represent the boundary of the four resource grades. For the shale dominated by type Ⅰ kerogen (Nenjiang), TOC values at 4%, 6%, and 8%, S1+S2 values at 19 mg/g, 32 mg/g, 48 mg/g, and Ie at 2, 3, and 4, respectively, represent the boundary of the four resource grades. Our research provides a feasible practical strategy for evaluating and predicting in-situ conversion shale oil resources in lacustrine basins.
Shale in medium-low maturity contains kerogen and some retained hydrocarbons. Kerogen cannot be exploited using current fracturing technique and liquid hydrocarbons cannot be extracted economically because of the poor reservoir drive. As a result, it is challenging to exploit medium-low maturity shale oil resources at present. By placing heaters in the target formation, in-situ shale oil conversion is achieved through heating the shale, which facilitates thermal cracking, heavy oil upgrading, desulfurization, and hydrogenation. This process converts kerogen and heavy hydrocarbons into hydrogen, hydrogen sulfide, natural gas, liquefied petroleum gas (LPG), and light oil—comprising primarily fractions such as gasoline, aviation kerosene, and diesel. Furthermore, the products are extracted to the surface via wells (Sun et al., 2023). The benefits of this technology are modest surface area coverage, low cost, negligible environmental impact, and viability for deep shale oil resource exploitation (Sun et al., 2023).
Incomplete estimates place the global medium-low maturity shale oil resources at 689 billion tons (Kang et al., 2020). The United States has the world’s largest medium-low maturity shale oil resources, accounting for about 77% of potentially recoverable shale oil (Dyni, 2003). China’s medium-low maturity shale oil resources are estimated as 47.6 billion tons (Liu et al., 2017), ranking second in the globe (Liu et al., 2006). Based on most recent experimental simulation data, the estimated total shale oil reserves developed by in-situ heating conversion technology are 49.4 billion tons for the Chang 7 Member in the Ordos Basin and 37.7 billion tons for the Nenjiang Formation in the Songliao Basin (Zhao et al., 2023a). These two fields, which represent type Ⅱ and type Ⅰ kerogen lacustrine shales in China, have significant potential for in-situ conversion shale oil exploitation.
In comparison, the global risk geological reserves of shale oil of medium-high maturity are about 248.8 billion tons, and the risk recoverable reserves are about 13 billion tons (EIA, 2013). Estimates of China’s medium-high maturity shale oil resources vary widely. U.S. Energy Information Administration (EIA) estimated 4.5 billion tons of technically recoverable medium-high maturity shale oil in China (EIA, 2013). Sinopec estimated 7.4 to 37.2 billion tons of technically recoverable medium-high maturity shale oil in the major lacustrine basins in China (Jin et al., 2019). PetroChina estimated that China has 10 billion tons of medium-high maturity shale oil in place. According to the statistical results, shale oil resources in medium-low maturity are approximately three times larger than those in medium-high maturity (Zhao et al., 2020).
Shell, ExxonMobil, Total, and other major oil firms have committed to conducting in-situ conversion technology research and field tests (Wang et al., 2013). Shell’s In-situ Conversion Process (ICP) technology is now the most advanced, having completed many field testing in the United States and Jordan that are ready for industrial deployment (Alpak et al., 2013). However, the utilization of in-situ conversion shale oil remains in its early stages. One reason is the high price. If technological and economic constraints can be overcome, this field will have a significant influence on global fossil energy supply patterns.
Research on the resource grading of in-situ conversion shale oil is still scarce. A preliminary resource assessment of China was conducted by certain experts, who also proposed a lower limit for in-situ conversion shale oil (Hu et al., 2020; Zhao et al., 2018). Guo et al. (2022) specified the core and sweet-spot area but did not define them or explain the division principles. It also provided a set of evaluation methodologies for in-situ conversion shale oil resource and evaluated the total quantity of in-situ conversion shale oil resources in the Ordos Basin, China. Guo et al. (2023) used the hydrocarbon generation quantity approach based on hydrogen index fluctuation to compute the resource amount of in-situ conversion shale oil in China, which is up to 46.03 billion tons. They did not, however, create evaluation standards for resource grading (Guo et al., 2023).
The objective of this study is to provide a feasible standard for the grading evaluation of in-situ conversion shale oil resource, so as to guide the exploration and development of this resource. In-situ conversion of shale oil involves a large amount of heat input, so resource grading should consider the hydrocarbon generation potential and the economics of development. Hydrocarbon generation potential is the material basis and the premise of in-situ conversion shale oil. It is regarded as the first factor of resource grading evaluation. The economics of development is related to technology, investment, oil price (Cui et al., 2018), etc., and multiple variables exist in different situations, making it difficult to analyze using a single criterion. The theoretical economics of the in-situ conversion of shale oil was investigated through the utilization of the calorific value of the hydrocarbons generated by in-situ conversion and the energy needed to achieve kerogen conversion. Findings and interpretations from this research contribute to longer range efforts being made to: 1) understanding the role of facies in in-situ conversion shale oil resource abundance; 2) recognize implications of thermal evolution and organic matter types in shale reservoirs; 3) Grade shale oil resources according to various development modes in terms of energy and value substitution.
This study uses core data to: 1) identify facies and 2) give an in-depth analysis of organic geochemical characteristics. 806 core samples were taken from 72 wells in the Southern Ordos Basin. Additionally, 201 core samples’ geochemical data were gathered from 11 wells in the Songliao Basin. The following analytical data were used in this study: 6 activation energy analysis samples, 1,007 source rock analysis samples, 992 TOC core-based measurements, and 6 sets of thermal simulation experiment findings. The shale samples of this study are all in the low-to-medium maturity stage.
TOC analyses and source rock pyrolysis were provided for the 72 wells in this study. The TOC was measured on the LECOCS230 instrument. The free hydrocarbons (S1) and pyrolyzed hydrocarbons (S2) was measured on the Rock-Eval 6 pyrolyzer by VINCI, France. Activation energy analysis was carried out on shale samples from 6 wells. The experiment was performed using the activation energy analysis module of Rock-Eval Ⅱ pyrolyzer in the State Key Laboratory of Petroleum Resources and Exploration, China University of Petroleum (Beijing). The calculation of hydrocarbon generation kinetics is based on the method of chemical reaction velocity and Arrhenius’ empirical formula (Arrhenius, 1889). In terms of the time-temperature compensation relationship (Connan, 1974), based on the laboratory data of high temperature and rapid shale cracking simulation, with American Lawrence Livemore national LABS KINETICS 2015-Code Version 6.110 dynamics software version, we used parallel first order kinetics reaction model to calculate the activation energy.
In this study, TOC isoline map (Guo et al., 2020), vitrinite reflectance (Ro) isogram (Zhao et al., 2018), shale isopach map (Lin et al., 2019) and hydrocarbon generation potential (S1+S2) isoline map (Guo et al., 2022) of Chang 7 shale in the Ordos Basin were collected from published literatures. The TOC and S1+S2 isoline maps were partially corrected according to our experimental results data.
Facies are rocks or combinations of rocks formed in a certain sedimentary environment. In this study, a facies represents the shale samples that are mainly similar in geological and geochemical characteristics and may originate analogously (Lin et al., 2019). Geostatistical decision tree method is used to classify shale facies. The method consists of the following main steps: 1) Build a geostatistical decision tree based on the experimental results (training data) of some samples. 2) Rapidly evaluated genetic relationships among these shale samples with hierarchical cluster analyses. 3) Identify several distinct shale facies according to the cluster distance of the clustering result. 4) Based on the cause-related data, apply the multitiered decision tree to classify additional shale samples those may be data incomplete (only partial experimental analysis has been completed). 5) Calculate the confidence coefficient.
With respect to training data, it is beneficial to have more parameters in more samples. The principles of parameter selection include: 1) It should have a clear indication meaning; 2) It should be generally considered to represent the main characteristics; 3) It should have sensitive response and no multi-solution. In this study, a geostatistical decision tree with 22 parameters established by Lin et al. (2019) for Chang 7 shale in the Ordos Basin is used. These parameters enable us to differentiate the samples, including sedimentology, rock geochemistry, fluid geochemistry and organic petrology, on behalf of the most significant visual characteristics, formation environment, OM types, and content and type of recoverable hydrocarbon.
Compared to medium-high maturity shale oil, in-situ conversion shale oil is easier to exploit, with a recovery rate of up to 70% (Zhao et al., 2018). The key constraint on the development of in-situ conversion shale oil is economic viability, which includes three major factors (Yu et al., 2023). The first factor is the investment cost, including drilling, surface engineering, oil recovery engineering, and heating equipment costs. Operating costs can be considered to be the second factor, and they include energy consumption for heating such as electricity costs. The last factor is oil prices. The parameters for economic evaluation are uncertain due to a number of factors, including the differences in the development level of various shale oil areas, variations in energy consumption due to different development methods, and fluctuations in oil prices. As a result, in this study, we started from the mechanism of in-situ conversion, and we only considered the required thermal energy for completing the conversion of the organic matter as the input and the total heat of hydrocarbon production as the output. The ratio of the input to the output of these two energies was used to evaluate the theoretical economic viability of in-situ conversion shale oil.
where Ie is the theoretical economic index; Q is the total heat content released by complete combustion of the in-situ conversion hydrocarbon products (J); r is the recovery rate of in-situ converted shale oil; mi is the mass of component i produced per unit mass of shale (kg); qi is the heat value of component i (J/kg); E is the total input thermal energy for the in-situ conversion of shale per unit mass (J); Erock is the total input thermal energy for heating one unit mass of rock to a specified temperature (J); and Ekero is the total input thermal energy for the complete conversion of one unit mass of kerogen (J).
In Equation 1, r is determined by the basin geology and the specific development process. In Equation 2, the yields of the various components are determined via thermal simulation experiment. In Equation 3, the specified temperature is determined by the activation energy of kerogen (Zhang et al., 1983; Deng et al., 2020). Ie is equal to 1, indicating that the heat of the extracted hydrocarbon is equal to the input thermal energy. This suggests that a higher Ie value indicates better economic viability. All of the above quantitative values, the temperature of the complete conversion, and the recovery rate are used for economic evaluation and are derived from the latest thermal simulation experiments conducted by the In-situ Conversion Laboratory of the Research Institute of Petroleum Exploration and Development.
Many parameters can be used for resource evaluation of shale oil developed by in-situ heating conversion technology, such as TOC, chloroform bitumen “A,” porosity, oil saturation, etc. The pyrolysis hydrocarbon generation potential (S1+S2) can be considered as a geochemical indicator that directly reflects the in-situ conversion shale oil yield; however, due to differences in the cause of the formations, different shale facies have significantly different kerogen types, total organic carbon (TOC) contents, and hydrocarbon generation potentials. Therefore, in this study, the facies, TOC, and S1+S2 are combined to establish a quick grading evaluation standard for in-situ conversion shale oil by using as few parameters as possible.
According to the experimental findings, there are three facies that may be distinguished in the Chang 7 Member shale (Lin et al., 2019). Facies Ay shale has extremely rich organic laminae, with laminae spacing typically ranging from 0.1 to 1 mm (Figure 1A). The majority of this shale facies may have been deposited in deep water. Facies By shale has an organic lamina density that is roughly three to five times higher than that of facies Cy shale. It is frequently semi-continuous or fuzzy, with a lamina spacing of between 0.5 and 2 mm (Figure 1B). Its structure is deformed in ways including bending, rolling, and folding. This shale facies may be formed in semi-deep lakes and is subject to frequent gravity flow. Facies Cy shale has highly flat, but uncommon, organic laminae with a large laminae spacing of typically 1–10 mm (Figure 1C). With inadequate particle sorting, the sediment between the organic laminae is primarily composed of silt and mud (Figure 1C). The density of organic lamina indicates that the organic carbon abundance of facies Cy shale is the lowest, and that of facies Ay shale is the largest. Furthermore, entire algal remains—which could be diatom shells with a great resistance to degradation—are frequently retained in facies Ay shales.
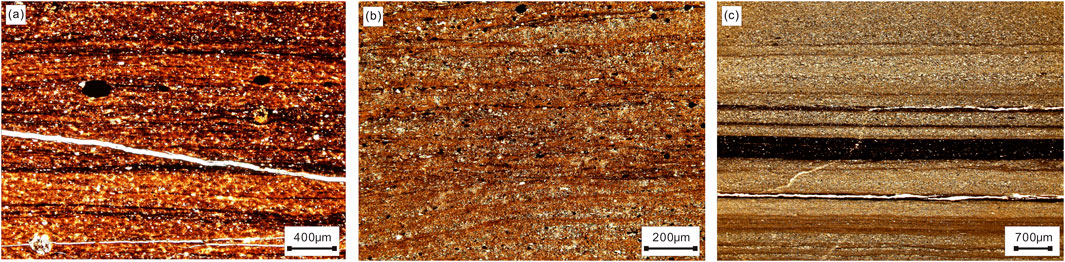
Figure 1. Typical microscope images of thin sections of shale facies in Chang 7 Member, the Ordos Basin. (A) Facies Ay shale, clear and dense lamina. (B) Facies By shale, weak deformation structure. (C) Facies Cy shale, flat and sparse lamina.
The three shale facies have average TOC content s of 14.6%, 3.8%, and 1.3%, respectively (Table 1). The maximum TOC, free hydrocarbon (average S1 of 4.82 mg/g), and pyrolysis hydrocarbon (average S2 of 59.11 mg/g) levels are found in the facies Ay shale. Type Ⅱ1 kerogen, which has a relatively high potential for hydrocarbon generation, predominates in the facies Ay shale. The type Ⅱ2 kerogen predominates in the facies By shale, and all of its geochemical parameter values—aside from the hydrogen index—are lower than those of the facies Ay shale. Furthermore, type Ⅲ kerogen predominates in the facies Cy shale, which has the lowest geochemical parameter values (Table 1).
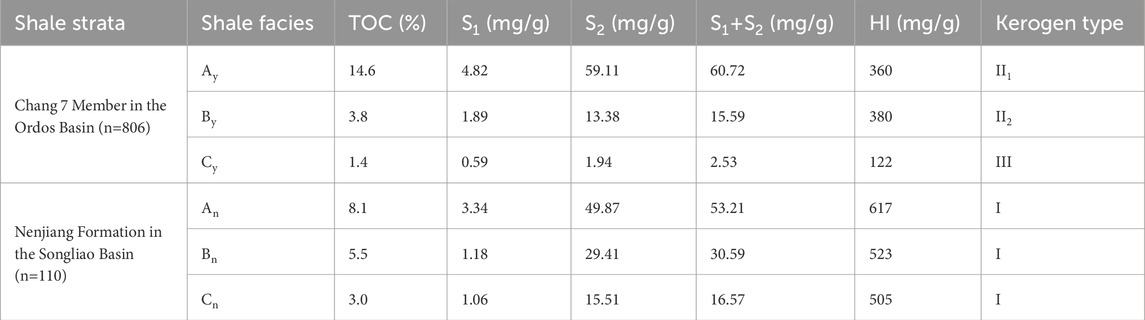
Table 1. Classification and geochemical parameters value of shale facies in the Ordos and Songliao basin.
The shale of the Nenjiang Formation in the Songliao Basin was also divided into three facies. The maximum TOC content (8.1%) and S1+S2 value (53.21 mg/g) were identified in the facies An shale, whereas the medium TOC content (5.5%) and S1+S2 value (30.59 mg/g) were found in the facies Bn shale. With a TOC content of 3.0% and an S1+S2 value of 16.57 mg/g, the facies Cn shale has the lowest values. Furthermore, the hydrogen index of shales from three facies show a sequential decrease, but remain above 500 mg/g, indicating that Type Ⅰ kerogen predominates in the Nenjiang Formation shale.
Due to facies heterogeneity, the relationship between S1 + S2 and TOC exhibits distinct zonal features (Figure 2A). Thus, the resource grading boundary can be tentatively determined as the border of the (S1+S2) zones. This approach has a theoretical foundation in addition to being simple to use in real-world situations. As can be seen, the facies Cy shale mainly has TOC values of <6.2% and S1+S2 values of <15 mg/g; the facies By shale mainly has TOC values of <9.1% and S1+S2 values of <30 mg/g; and the facies Ay shale mainly has TOC values of >9.1% and S1+S2 values of >30 mg/g. Therefore, the relationship between the TOC and S1+S2 reflects the facies heterogeneity. At the border between facies Cy and By, the TOC is 6.2% and S1+S2 is 15 mg/g (Table 2); at the border between facies By and Ay, the TOC is 9.1% and S1+S2 is 30 mg/g (Table 2). Similar different zonal features are shown in the connection between S1+S2 and TOC of shales in the Nenjiang Formation (Figure 2B). They both had TOC boundary values that were less than that of the Chang 7 shale, at 3.7% and 6.0%, respectively (Table 2). The values of their S1+S2 boundary were 19 mg/g and 32 mg/g, respectively, which were higher than the values of Chang 7 shale. (Table 2). The variations in kerogen types between the two sets of shale formations need to be connected to this feature.
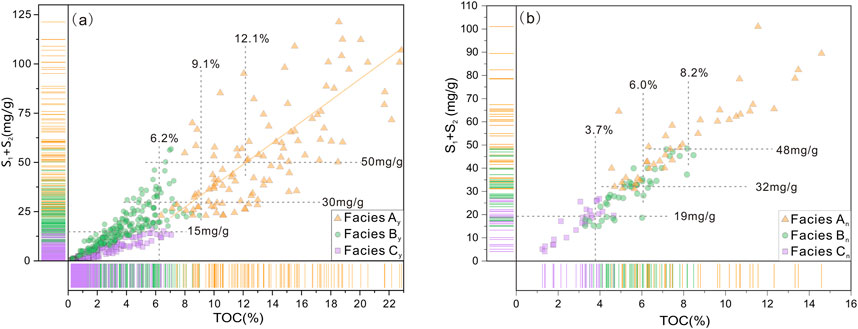
Figure 2. Plot of S1+S2 versus TOC for the shale facies in Chang 7 Member, the Ordos Basin (A) and in Nenjiang Formaion, the Songliao Basin (B).
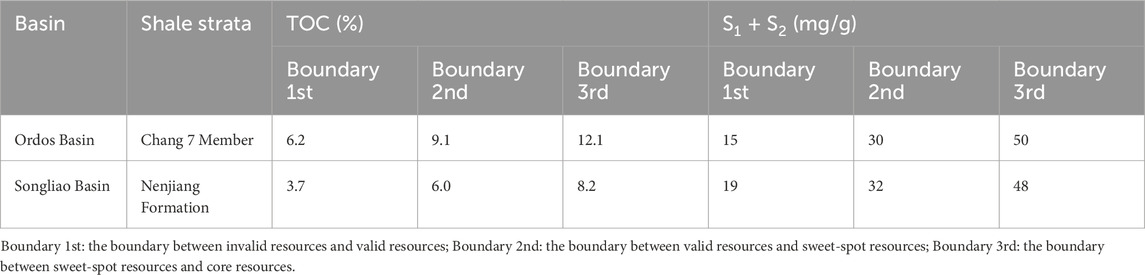
Table 2. Grading boundary value for the in-situ conversion shale oil resources in the Ordos and Songliao basin.
The facies By shale has a medium potential to convert in-situ shale oil resources, so it can be classified as containing valid resources for future exploration and development. It is suggested that the facies Cy shale was classified as containing invalid resources because it has a relatively poor hydrocarbon generation potential and its resources are difficult to develop economically. Since the facies Ay shale has the greatest potential to produce hydrocarbons, it can be categorized as having sweet-spot resources for appraisal and development in the near future. Additionally, at the S1+S2 value of 50 mg/g, the trend line of scatter plot of facies Ay (Figure 1A) intersects the upper limit of S1+S2 of facies By shale, and the associated TOC is equal to 12.1%. Based on this, we determined that the shales with TOC >12.1% and S1+S2 > 50 mg/g contain the core resource, which merits priority exploration and development (Table 2). Likewise, the facies An shale in Nenjiang Formation is further divided into two sub-regions, and within those, shales possessing core resources are defined as having TOC >8.2% and S1+S2 > 48 mg/g (Table 2).
Thermal maturity of the organic matter places a major constraint on the abundance of in-situ conversion shale oil resources. Even though a high maturity shale is rich in organic matter, it could not have a good potential to yield hydrocarbons (Pang and Chen, 1997). Thermal maturity should thus be one of the parameters used to properly identify the grading of in-situ conversion shale oil.
When it comes to in-situ conversion of shale oil, type Ⅲ kerogen—even in extremely high abundance—has less development potential than type Ⅰ and Ⅱ kerogen. There are two causes for this. Firstly, type Ⅲ kerogen has the least capacity to generate oil. Plankton makes up the majority of the hydrocarbon-forming organisms in type Ⅰ kerogen (Peters et al., 2005), and the overall oil conversion ratio can reach 75% of the total organic carbon (Michels et al., 1995; Behar et al., 1997) (Figure 3A). The majority of type Ⅱ kerogen’s hydrocarbon-forming organisms are benthos (Liang et al., 2015), and their overall oil conversion ratio can surpass 35% of all organic carbon (Figure 3A). When type Ⅱ kerogen reaches maturity, its total oil production is roughly 50% that of type Ⅰ kerogen, and its hydrocarbon gas yield is roughly 40% that of type Ⅰ kerogen (Liu S. et al., 2023; Li et al., 2024) (Figure 3B). The majority hydrocarbon-forming organisms of type-III kerogen are higher species (Chen and Peng, 2017), and relatively little oil is produced during the mature stage. Its total oil conversion ratio is less than 4.5% of total carbon. This ratio of type-III kerogen is roughly 13% of that of type Ⅱ kerogen and 6% of that of type Ⅰ kerogen (Farouji et al., 2023; Han et al., 2001) (Figure 3A).
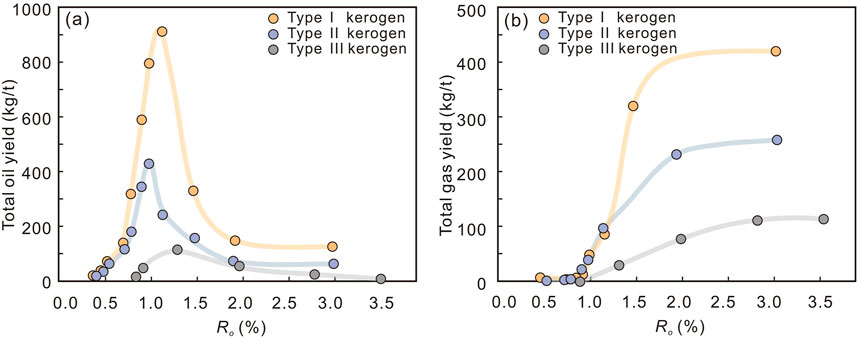
Figure 3. Total oil (A) and gas (B) yield from various types of kerogen pyrolysis in the lacustrine basin (modified from He et al., 2014; Liu X. et al., 2023). The maximum total oil and gas output is seen in type I kerogen. The total oil yield of type II kerogen is about 50% of type I kerogen, and the total hydrocarbon gas yield is about 40% of type I kerogen. Type III kerogen has the lowest overall oil and gas yield, which is comparable to around 6% and 15% of type I kerogen, respectively.
Second, compared to types Ⅰ and Ⅱ kerogen, type Ⅲ kerogen had a far lower hydrocarbon production rate. Each form of kerogen has a distinct activation energy for the production of hydrocarbons due to differences in their structures (Hou et al., 2020; Guo et al., 2024; Su et al., 2024). In type Ⅰ kerogen, the aliphatic chain makes up the vast bulk. The dissociation energy of the C-C bond in both normal and isomeric alkanes is a significant chemical bond energy. The primary constituent of type Ⅲ kerogen is the polycyclic aromatic structure, whose overall dissociation bond energy is significantly greater than that of C-C bonds of long-chain alkanes. The overall dissociation bond energy of type Ⅱ kerogen is between that of type Ⅰ and type Ⅲ, as does its structure. The activation energy of hydrocarbon formation steadily increases from type Ⅰ to type Ⅲ kerogen, and the activation energy distribution gradually shifts from narrow to wide range and from asymmetric type to normal distribution (Figure 4). As a result, the type Ⅰ kerogen has the ability to quickly break the chain once it reaches the primary stage of hydrocarbon formation. The effective hydrocarbon generation energy span is the narrowest (Figure 4A), indicating a quick hydrocarbon generation process in a restricted temperature range. The fraction of hydrocarbon generation between main and secondary frequency reached 80.9%. In the case of type Ⅲ kerogen, the effective hydrocarbon generation energy span is the largest (Figure 4C) and the fraction of primary and secondary frequency hydrocarbon generation is only 30.5%, indicating a very slow hydrocarbon generation process and a protracted hydrocarbon generation period. The type Ⅲ kerogen has the slowest rate of hydrocarbon production. The hydrocarbon generation process of type Ⅱ kerogen is slower than that of type Ⅰ kerogen, but faster than that of type Ⅲ kerogen, as shown in Figure 4B.
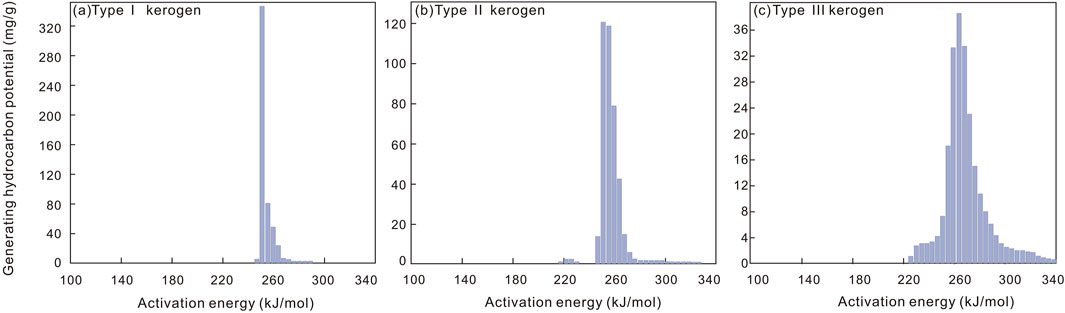
Figure 4. Activation energy distribution histogram for type I (A), II (B) and III (C) kerogen in the lacustrine basin (modified from Ma et al., 2019; Behar et al., 1997). The effective hydrocarbon generation energy span of type I, II and III kerogen is approximately 13 kJ/mol, 25 kJ/mol, and 42 kJ/mol, respectively. A lower temperature range and a faster hydrocarbon production process are indicated by a narrower activation energy.
Therefore, regardless of its high TOC concentration, the shale oil production from complete thermal conversion for shale dominated by type Ⅲ kerogen cannot meet the requirements for valid resource grade, making it commercially unviable for development. Only the shale dominated by types Ⅱ and Ⅰ kerogen is examined in this paper. The kerogen in the shale eventually transforms into hydrocarbons with thermal evolution: 1) When Ro<0.6%, and the amount of unconverted organic matter that remains is greater than 90% (Hu et al., 2020); 2) When Ro=0.6%∼0.9%, kerogen and liquid hydrocarbon that is retained coexist; 40%–90% of the kerogen is unconverted, and the remaining liquid hydrocarbon in the shale makes up 5%–60% (Hu et al., 2020); 3) When Ro>1.0%, the amount of unconverted kerogen is less than 40% (Hu et al., 2020) (Figure 5).
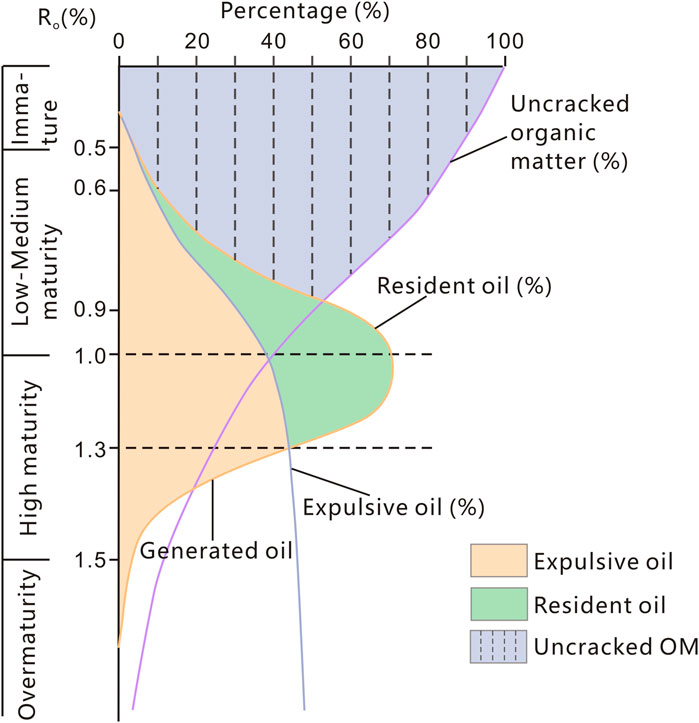
Figure 5. Diagram of hydrocarbon generation transformation of kerogen with thermal maturity evolution. The emphasis is on unconverted organic matters (modified from Lu et al., 2012; Zhao et al., 2018; 2023b).
Under the circumstance that the TOC content hits the lower bound for valid resources, the main constraint limiting the economic development potential of in-situ convertion shale oil is the thermal maturity. In situations when the Ro is less than 0.6%, most hydrocarbons have not formed spontaneously, and the in-situ conversion process can be utilized to maximize the yield of shale oil. The shale reaches its peak hydrocarbon generation when Ro is close to 0.9%, with at least half of the hydrocarbons not being generated. Because of the greater TOC content, in-situ conversion technology can still be utilized to produce a sizable amount of shale oil. When Ro is more than 1.0%, the hydrocarbon generation peak has been surpassed by the thermal evolution. Even with a reasonably high TOC, the in-situ conversion shale oil output falls short of the acceptable resources grade level (Figure 5).
Since the empirical recoverable coefficient for in-situ conversion shale oil is 65%, the recovery rate in this study is fixed to a constant value of 0.65 for comparative analysis (Guo et al., 2022; Huang et al., 2018). When heated to 330°C and held there for an extended period of time (Hou et al., 2022; Kibodeaux, 2014), the majority of the kerogen in the Chang 7 Member shale in the Ordos Basin can be converted into hydrocarbons. The heat energy needed to pyrolyze type Ⅱ koregen is typically 405 MJ/t, while the rock framework has a heat capacity of 2.35 MJ/m3•°C. For instance, 23 kg of kerogen are present in 1 ton of shale. In order to fully convert the kerogen, 10.125 MJ of heat energy is needed, and 305.499 MJ are needed to raise the temperature of the rock framework from 44°C to 330°C. This results in a total energy of 315.124 MJ. Natural gas and light oil, with respective calorific values of 36 MJ/m3 and 44 MJ/kg, are the main products of the in-situ conversion. According to the results of a thermal simulation experiment, a ton of shale containing 23 kg of kerogen may produce about 26 m3 of natural gas and 52 kg of light oil, of which 65% are extracted. After full combustion, these hydrocarbons have a total calorific value of 2088.67 MJ. Thus, the theoretical economic index of the in-situ conversion shale with a TOC of 23% is approximately 6.6 (2088.67 MJ/315.124 MJ).
Because the kerogen in the Nenjiang Formation of the Songliao Basin has a lower active energy than other kerogens, most organic matter can be converted into hydrocarbons if the shales are heated to 325°C and maintained there for an extended period of time. The main products are also light oil and natural gas. The results of thermal simulation experiments were used to calculate the theoretical economic indices for the two sets of shale (Table 3). As seen in Figure 6, there is a strong positive linear association between TOC and theoretical economic index (Ie) based on the experimental data and the Ie computation results of many shale samples.
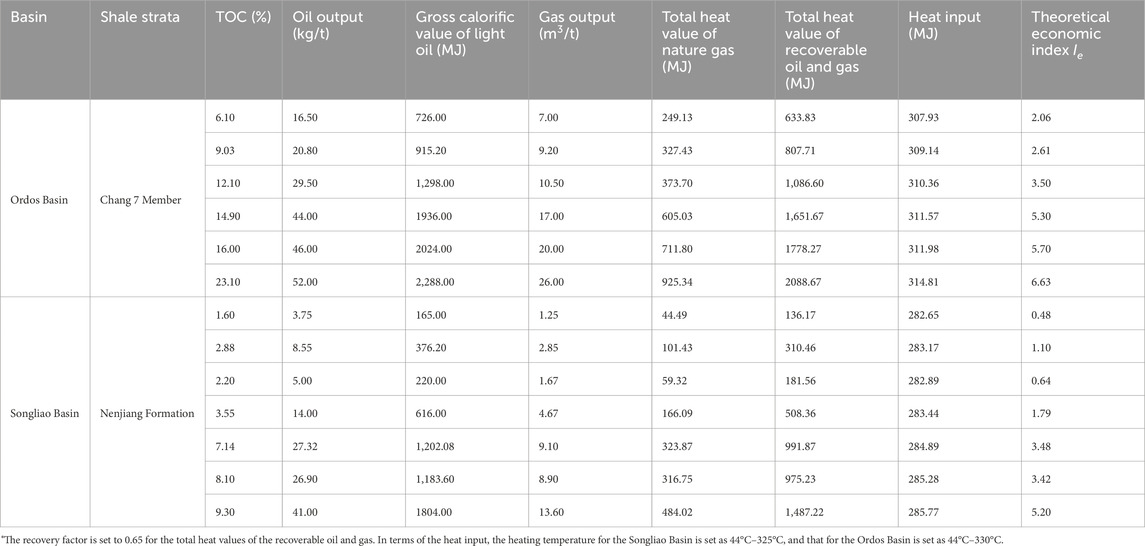
Table 3. Calculation results of theoretical economic index*.
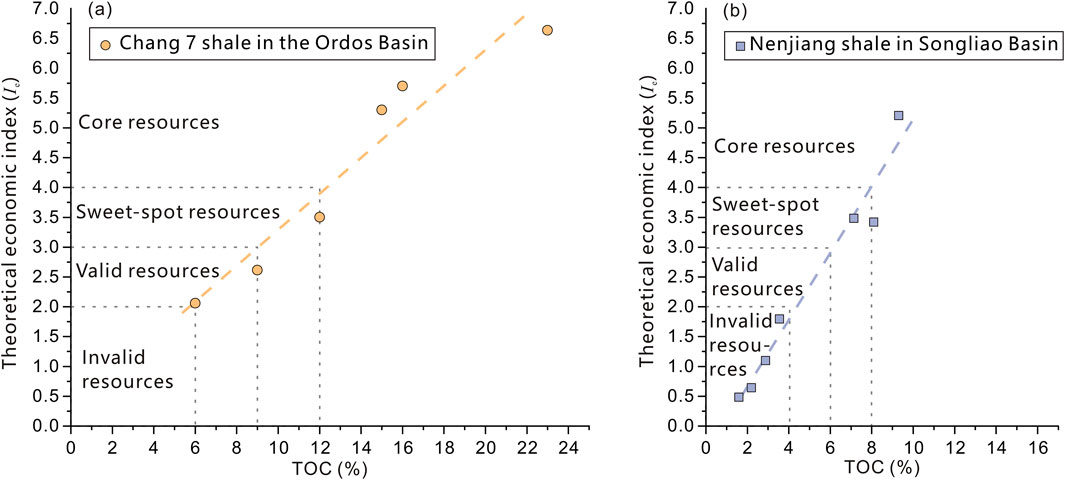
Figure 6. Relationship between theoretical economic index and TOC of in-situ conversion shale oil resources. (A) Chang 7 Member in the Ordos Basin. (B) Nenjiang Formation in the Songliao Basin.
Only when the theoretical economic index (Ie) satisfies the condition of being more than or equal to 2 can the development of commercially viable resources be possible, provided that the investment and operating expenses are simplified. In relation to the Chang 7 shale, the corresponding TOC needs to be precisely larger than or equal to 6% (Figure 6), which is in close proximity to the value at the first boundary (Table 2). When the theoretical economic index (Ie) is more than or equal to 3, these shales can yield shale oil resources above sweet-spot grade by in-situ conversion technology. The TOC corresponding to this index is 9%, which is close to the value at second boundary (Table 2). Similarly, these shales can produce shale oil resources above core grade when the theoretical economic index (Ie) is more than or equal to 4. The TOC corresponding to this index is 12%, which is near to the value at the third boundary (Table 2). When the indices for the shales in Nenjiang Formation in the Songliao Basin are 2, 3, and 4, respectively, the corresponding TOC values are 4%, 6%, and 8% (Figure 6). These values are quite near the boundaries of the four resource grades (Table 2). As a result, we discover a strong correlation between the resource grading and the theoretical economic index. It is evident that the theoretical economic index can be used to further enhance the grading evaluation criteria for in-situ conversion shale oil resources. The updated resource grading evaluation criteria, which fully incorporates thermal maturity and the theoretical economic index, are displayed in Table 4. To make generalization easier, the value of TOC has been revised to an integer.
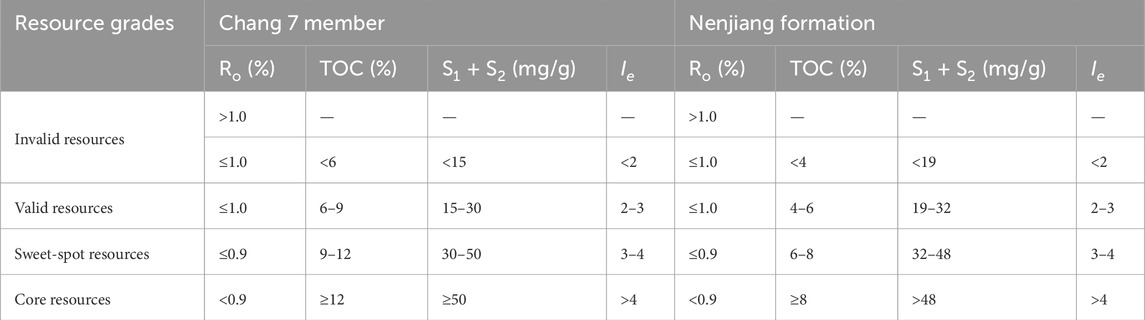
Table 4. Grading evaluation criteria for in-situ conversion shale oil resource.
In contrast to medium-high maturity shale oil, the approach used in this study solely takes the mass of the rock into account, ignoring its thickness. It is important to note that organic-rich shale in medium-low maturity can be converted into valuable resources regardless of thickness based on the principles of in-situ conversion technology. An increase in thickness may result in a proportional rise in energy usage. However, very thin shale can cause development challenges or not be economically feasible given the state of technology currently. Thus, based on a variety of field test results (Sun et al., 2021), it is advised to set the lower limit for the thickness of in-situ conversion shale at 5 m.
Based on core sampling, well logging data and isoline maps, in this study, we graded the in-situ conversion shale oil resources of the Chang 7 Member. By overlaying the TOC isoline map, vitrinite reflectance (Ro) isogram, shale isopach map and hydrocarbon generation potential (S1+S2) isoline map, according to the grading evaluation criteria described above, the area that is rich in in-situ conversion shale oil resources can be delineated.
The first step was delineating the areas where the shale thickness is greater than or equal to 5 m, and then, the areas with Ro ≤ 1.0% and Ro ≤ 0.9% were delineated. Then the area that meets the criteria Ro ≤ 0.9%, TOC ≥12%, and S1+S2 ≥ 50 mg/g was classified as core resources; the area meets the criteria Ro ≤ 0.9%, 12% ≥ TOC ≥9%, and 50 mg/g ≥ S1+S2 ≥ 30 mg/g was classified as sweet-spot resources; the area that meets the criteria Ro ≤ 0.9%, 9% ≥ TOC ≥6%, and 30 mg/g ≥ S1+S2 ≥ 15 mg/g was classified as valid resources; and the that meets the criteria that Ro > 1.0%, TOC <6%, and S1+S2 < 15 mg/g was classified as invalid resources. The areas and amount of the four grades of resources are summarized in Table 5.
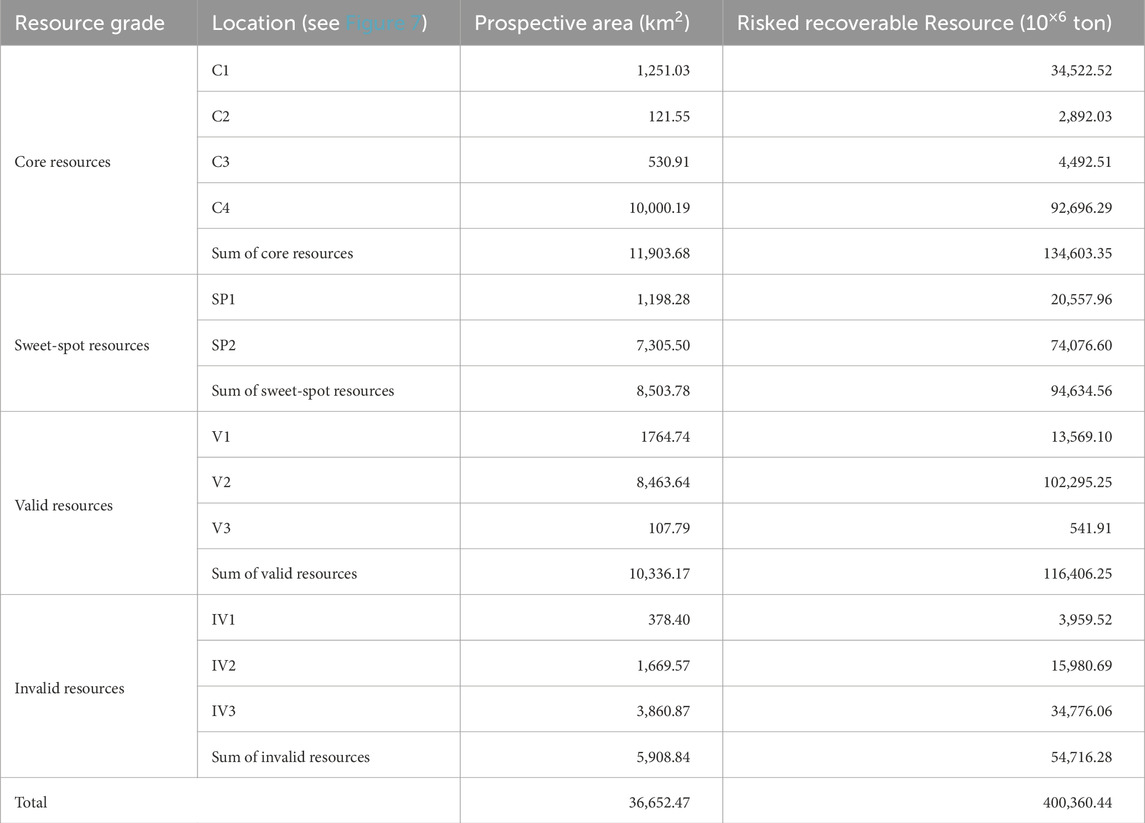
Table 5. Area and amount of graded in-situ conversion shale oil resources in the Chang7 Member, the Ordos Basin.
For the Chang 7 Member in the Ordos Basin, the shale is distributed widely and continuously, and the thermal maturity is generally low. The area containing core resources of in-situ conversion shale oil is mainly located in the Jiyuan area (C1 in Figure 7), eastern part of the Yanwu area (C2 and C3 in Figure 7), and southern part of the basin (C4 in Figure 7), with a risked recoverable resource of 13.46 billion tons (Table 5). The area containing sweet-spot resources (8,503 km2) is mainly located in Jiyuan area (SP1 in Figure 7), Huanxian-Qingyang-Zhengning area (SP2 in Figure 7), with a risked recoverable resource of 9.46 billion tons (Table 5). The area containing valid resources is 10,336 km2 and is broadly distributed in areas such as Majiapu-Dingbian (V1 in Figure 7) and Gengwan-Huachi-Yijun (V2 in Figure 7), with a risked recoverable resource of 11.64 billion tons (Table 5). In addition, the area containing invalid resources is concentrated in the regions with high maturity, including the western Dingbian area (IV1 in Figure 7), Gengwan-Baibao area (IV2 in Figure 7), and Chenghao-Nanliang-Ta’erwan area (IV3 in Figure 7), with an area of approximately 5,909 km2 (Table 5).
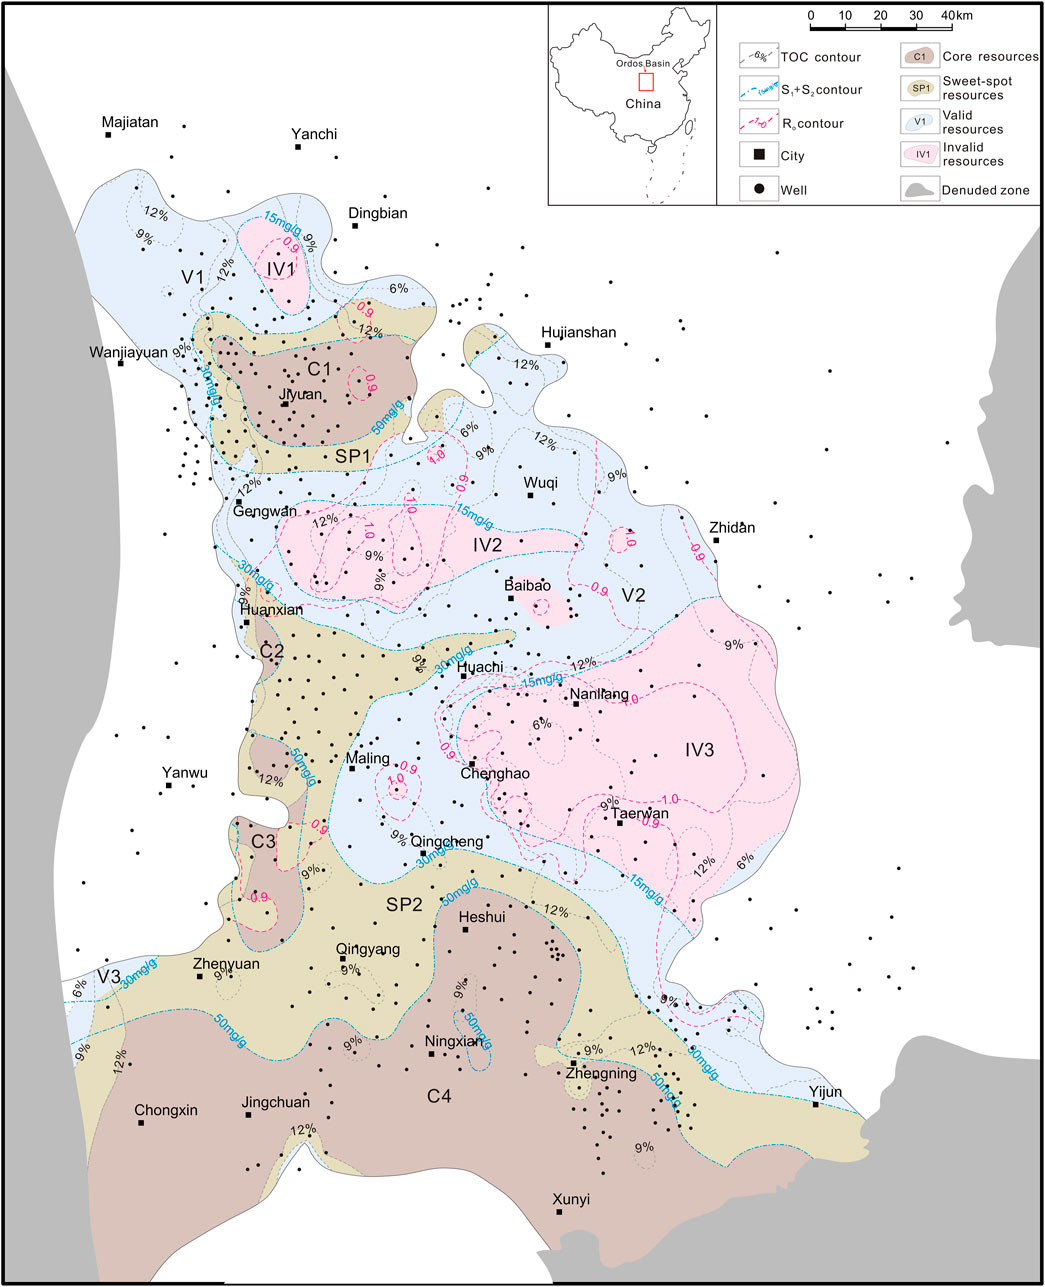
Figure 7. Composite evaluation map of in-situ conversion shale oil resource in Chang7 Member, the Ordos Basin. There are four core resource areas (orange color, C1, C2, C3 and C4), with the largest core resource located in the southern part of the basin. There are mainly two sweet-spot resource areas (yellow color, SP1 and SP2), SP2 occupies most of the sweet-spot resources and is located in the west and southeast of the basin. With SP1 as the boundary, the valid resource area (green color) is mainly composed of the northern part (V1) and the central-eastern part (V2) of the basin. Three major (gray color, V1, V2, and V3) and a few sporadic invalid resource areas are located within the valid resource area.
This initial assessment shows how the various resource grades are distributed. However, more investigation is required to ascertain which area is best suited for development; which area has an excessive burial depth that might make drilling more expensive and challenging; which area has naturally occurring fractures that might result in heat loss during heating; and which area might contain active water that might result in a large rise in energy consumption.
Based on the statistical analysis of petrological and geochemical data, we conclude as follows:
(1) Shale’s facies classification is a crucial factor in resource grading assessments. Using the lacustrine shale of the Chang 7 Member in the Ordos Basin and the Nenjiang Formation in the Songliao Basin as examples, facies C shale represents the invalid resources and facies B shale represents the valid resources. Furthermore, the portion of facies A shale with a relatively low potential for producing hydrocarbons is represented by the sweet-spot resources, whilst the portion with a relatively high potential for producing hydrocarbons is represented by the core resources.
(2) The theoretical economic index (Ie) represents the energy input-output ratio of shale oil production by in-situ conversion technology, and can be used as an important parameter for resource grading evaluation. Ie= 2 is the lower limit of valid resources for in-situ conversion shale oil. Ie= 3 is the lower limit of sweet-spot resources and Ie= 4 is the lower limit of core resources.
(3) Although the invalid resource represents an inefficient energy replacement from the perspective of energy input and output, these shale oil resources may still be economical to exploit under the conditions of increasingly cheap renewable energy supply (such as wind and photovoltaic power). Considering oil and gas as a strategic energy source, it is necessary to explore and develop the invalid resource of in-situ conversion shale oil as a prospective petroleum resource in future.
(4) Thermal simulation experiments in the laboratory cannot completely restore the actual underground heating process, especially the nonlinearity and heterogeneity of heat conduction. Therefore, the thermochemical result parameters may be biased. The calculation of the theoretical economic index (Ie) only considers the input of energy consumption and the total calorific value of the products, which is obviously oversimplified. In order to obtain a more accurate evaluation, it may be necessary in the future to include more indicators—such as the anisotropy of thermal conductivity, energy loss of various heating models, total heating time, etc.,—into the theoretical economic index (Ie) calculation and resource evaluation system.
The datasets used and/or analysed during the current study available from the corresponding author on reasonable request.
SeL: Conceptualization, Methodology, Writing–original draft, Writing–review and editing. XL: Project administration, Writing–original draft. ZZ: Investigation, Resources, Writing–review and editing. LH: Investigation, Writing–original draft. ShL: Formal Analysis, Investigation, Writing–review and editing. HL: Resources, Validation, Writing–review and editing. ZP: Investigation, Writing–review and editing. LZ: Formal Analysis, Writing–review and editing.
The author(s) declare that financial support was received for the research, authorship, and/or publication of this article. This research is supported by China National Petroleum Corporation Scientific research and technology development project [No. 2021DJ5202]. The funder was not involved in the study design, collection, analysis, interpretation of data, the writing of this article, or the decision to submit it for publication.
The authors sincerely appreciate the financial support from the China National Petroleum Corporation. The authors would like to thank the Editor, the Associate Editor, and the reviewers for their constructive comments that improved this paper.
Authors SeL, XL, ZZ, LH, ZP, and LZ were employed by PetroChina. Author ShL was employed by CNPC Shenzhen New Energy Research Institute Co., Ltd.
The remaining author declares that the research was conducted in the absence of any commercial or financial relationships that could be construed as a potential conflict of interest.
The author(s) declare that no Generative AI was used in the creation of this manuscript.
All claims expressed in this article are solely those of the authors and do not necessarily represent those of their affiliated organizations, or those of the publisher, the editors and the reviewers. Any product that may be evaluated in this article, or claim that may be made by its manufacturer, is not guaranteed or endorsed by the publisher.
Alpak, F. O., Vink, J. C., Gao, G., and Mo, W. (2013). Techniques for effective simulation, optimization, and uncertainty quantification of the in-situ upgrading process. J. Unconv. Oil and Gas Resour. 3-4 (S3/S4), 1–14. doi:10.1016/j.juogr.2013.09.001
Arrhenius, S. (1889). Über die Reaktionsgeschwindigkeit bei der Inversion von Rohrzucker durch Säuren. Z. für Phys. Chem. 4 (1), 226–248. doi:10.1515/zpch-1889-0416
Behar, H., Vandenbroucke, M., Tang, Y., Marquis, F., and Espitalie, J. (1997). Thermal cracking of kerogen in open and closed systems: determination of kinetic parameters and stoichiometric coefficients for oil and gas generation. Org. Geochem. 26, 321–339. doi:10.1016/S0146-6380(97)00014-4
Chen, J., and Peng, P. (2017). A comparative study of free and bound bitumens from different mature source rocks with Type III kerogens. Org. Geochem. 112, 1–15. doi:10.1016/j.orggeochem.2017.06.014
Connan, J. (1974). Time-temperature relation in oil genesis: geologic notes. AAPG Bull. 58 (12), 2516–2521. doi:10.1306/83D91BEB-16C7-11D7-8645000102C1865D
Cui, J., Zhu, R., Hou, L., Wu, S., Mao, Z., and Li, S. (2018). Shale in-situ mining technology status quo of challenges and opportunities. Unconvent. Oil and Gas 5 (6), 103–114. doi:10.3969/j.issn.2095-8471.2018.06.017
Deng, M., Duan, X., Zhai, C., Long, S., Yang, Z., Deng, L., et al. (2020). Variation in liquid hydrocarbon content during thermal simulation and its influence on physical property of shale. Oil and Gas Geol. 41 (6), 1310–1320. doi:10.11743/ogg20200619
Dyni, J. R. (2003). Geology and resources of some world oil-shale deposits. Oil Shale 20 (3), 193–252. doi:10.3176/oil.2003.3.02
EIA (2013). Technically recoverable shale oil and shale gas resources: an assessment of 137 shale Formation in 41 countries outside the United States. Washington.
Farouji, M. S., Liu, B., Gentzis, T., Wen, Z., Ma, Z., Bai, L., et al. (2023). Geochemical evolution of kerogen type III during hydrous pyrolysis: a case study from the Damoguaihe Formation, Hailar Basin, China. Geoenergy Sci. Eng. 228, 211947. doi:10.1016/j.geoen.2023.211947
Guo, C., Li, M., Liu, X., Xiao, H., Luo, Q., Han, Q., et al. (2024). Construction of multidimensional structure model of the Mesoproterozoic Xiamaling shale kerogen, northern North China. Fuel 367, 131572. doi:10.1016/j.fuel.2024.131572
Guo, Q., Chen, X., Liuzhuang, X., Yang, Z., Zheng, M., Chen, N., et al. (2020). Evaluation method for resource potential of shale oil in the triassic yanchang Formation of the Ordos Basin, China. Energy Explor. and Exploitation 38 (4), 841–866. doi:10.1177/0144598720903394
Guo, Q., Hou, L., Wang, J., Liuzhuang, X., Luo, X., and Chen, N. (2022). An evaluation method of resource potential of in-situ converted shale oil and its application. Acta Pet. Sin. 43 (12), 1750–1757. doi:10.7623/syxb202212006
Guo, Q., Mi, Y., Zhang, Q., and Wang, J. (2023). Assessment methods and potential of shale oil resources in China. Petroleum Geol. and Exp. 45 (3), 402–412. doi:10.11781/sysydz202303402
Han, Z., Yang, Q., and Pang, Z. (2001). Artificial maturation study of a humic coal and a torbanite. Int. J. Coal Geol. 46, 133–143. doi:10.1016/S0166-5162(01)00018-0
He, K., Zhang, S., Wang, X., Mi, J., and Mao, R. (2014). Hydrocarbon generation kinetics of type-Ⅰ organic matters in the Cretaceous lacustrine sequences, Songliao Basin. Oil gas Geol. 35 (1), 42–49. doi:10.11743/ogg20140106
Hou, L., He, K., Zhai, J., Mi, J., and Weng, N. (2022). Compositional kinetics for hydrocarbon evolution in the pyrolysis of the Chang 7 organic matter: implications for in-situ conversion of oil shale. J. Anal. Appl. Pyrolysis 162, 105434. doi:10.1016/j.jaap.2022.105434
Hou, L., Ma, W., Luo, X., Tao, S., Guan, P., and Liu, J. (2020). Chemical structure changes of lacustrine Type-II kerogen under semi-open pyrolysis as investigated by solid-state 13C NMR and FT-IR spectroscopy. Mar. Petroleum Geol. 116, 104348. doi:10.1016/j.marpetgeo.2020.104348
Hu, S., Zhao, W., Hou, L., Yang, Z., Zhu, R., Wu, S., et al. (2020). Development potential and technical strategy of continental shale oil in China. Petroleum Explor. Dev. 47 (4), 877–887. doi:10.1016/S1876-3804(20)60103-3
Huang, Z., Liu, Q., Li, M., Chen, J., Li, P., and Zhang, R. (2018). Hydrocarbon expulsion efficiency and oil-bearing property of the shale system in Chang 7 Member, Ordos Basin. Oil and Gas Geol. 39 (3), 513–521 + 600. doi:10.11743/ogg20180308
Jin, Z., Bai, Z., Gao, B., and Li, M. (2019). Has China ushered in the shale oil and gas revolution? Oil Gas. Geol. 40 (3), 451–458. doi:10.11743/ogg20190301
Kang, Z., Zhao, Y., and Yang, D. (2020). Review of oil shale in-situ conversion technology. Appl. Energy 269, 115121. doi:10.1016/j.apenergy.2020.115121
Kibodeaux, K. R. (2014). Evolution of porosity, permeability, and fluid saturations during thermal conversion of oil shale. SPE 170733-MS. doi:10.2118/170733-MS
Li, C., Jin, Z., Zhang, L., and Liang, X. (2024). Thermodynamic and microstructural properties of the lacustrine Chang-7 shale kerogen: implications for in-situ conversion of shale. Int. J. Coal Geol. 283, 104447. doi:10.1016/j.coal.2024.104447
Liang, M., Wang, Z., Zheng, J., Li, X., Wang, X., Gao, Z., et al. (2015). Hydrous pyrolysis of different kerogen types of source rock at high temperature - bulk results and biomarkers. J. Petroleum Sci. Eng. 125, 209–217. doi:10.1016/j.petrol.2014.11.021
Lin, S., Yang, Z., Hou, L., Luo, X., and Liu, Q. (2019). Geostatistic recognition of genetically distinct shale facies in upper Triassic Chang 7 section, the Ordos Basin, North China. Mar. Petroleum Geol. 102, 176–186. doi:10.1016/j.marpetgeo.2018.11.050
Liu, S., Gao, G., Jin, J., Zhang, L., Gang, W., Xiang, B., et al. (2023). Significance of hydrocarbon generation characteristics of source rock samples dominated by telalginite and lamalginite in saline lacustrine sediments. Acta Geol. Sin. 97 (3), 879–887. doi:10.19762/j.cnki.dizhixuebao.2022015
Liu, X., Wang, Q., Jia, W., Song, J., and Peng, P. (2023). Pyrolysis of an organic-rich shale containing type II kerogen before and after oil generation and expulsion: implications for the generation of late hydrocarbon and hydrogen gases. J. Anal. Appl. Pyrolysis 173, 106105. doi:10.1016/j.jaap.2023.106105
Liu, Z., Dong, Q., Ye, S., Zhu, J., Guo, W., Li, D., et al. (2006). The situation of oil shale resources in China. J. Jilin Univ. (Earth Sci Ed) 36, 869–876. doi:10.3969/j.issn.1671-5888.2006.06.002
Liu, Z., Meng, Q., Dong, Q., Zhu, J., Guo, W., Ye, S., et al. (2017). Characteristics and resource potential of oil shale in China. Oil Shale 34, 15–41. doi:10.3176/oil.2017.1.02
Lu, S., Huang, W., Chen, F., Li, J., Wang, M., Xue, H., et al. (2012). Classification and evaluation criteria of shale oil and gas resources: discussion and application. Petroleum Explor. Dev. 39 (2), 268–276. doi:10.1016/S1876-3804(12)60042-1
Ma, X., Li, M., Jiang, Q., Qian, M., Li, Z., and Pang, X. (2019). Chemical kinetic model for quantitative evaluation on oil-bearing property of lacustrine shale. Petroleum Geol. Recovery Effic. 26 (1), 137–151. doi:10.13673/j.cnki.cn37-1359/te.2019.01.015
Michels, R., Landais, P., Torkelson, B. E., and Philip, R. P. (1995). Effects of effluents and water pressure on oil generation during confined pyrolysis and high-pressure hydrous pyrolysis. Geochimica Cosmochimica Acta 59, 1589–1604. doi:10.1016/0016-7037(95)00065-8
Pang, X., and Chen, Z. (1997). Basic concept of hydrocarbon expulsion threshold and its research significance and application. Geoscience 11 (4), 510–521.
Peters, K. E., Walters, C. C., and Moldowan, J. M. (2005). The biomarker guide: interpreting molecular fossils in petroleum and ancient sediments. second edn. UK: Cambridge University Press.
Su, C., Liu, Y., Yang, Y., Gao, T., Qi, T., and Wang, Y. (2024). Evolution of aromatic structure and nanopores in shale kerogen by using in-situ HRTEM and in-situ FT-IR experiment. Fuel 359, 130479. doi:10.1016/j.fuel.2023.130479
Sun, Y., Guo, W., and Deng, S. (2021). The status and development trend of in-situ conversion and drilling exploitation technology for oil shale. Drill. Eng. 48 (1), 57–67. doi:10.12143/j.ztgc.2021.01.008
Sun, Y., Guo, W., Li, Q., Bai, F., and Deng, S. (2023). Current status and prospects of oil shale in-situ conversion technology in China. Petroleum Sci. Bull. 4, 475–490. doi:10.3969/j.issn.2096-1693.2023.04.036
Wang, Y., Wang, Y., Meng, X., Su, J., Li, F., and Li, Z. (2013). Enlightenment of American’s oil shale in-situ retorting technology. Oil Drill. and Prod. Technol. 35 (6), 55–59.
Yu, Y., Wang, H., Liu, D., Zhao, Q., Li, X., Wu, J., et al. (2023). Development status and feasibility evaluation index system of continental shale oil demonstration area in China. Earth Sci. 48 (1), 191–205. doi:10.3799/dqkx.2022.422
Zhang, D., Huang, D., Li, J., and Zhang, Y. (1983). Kinetic features of thermo-degradation of kerogens in oil shales and their geochemical significances. Oil and Gas Geol. 4 (4), 383–393.
Zhao, W., Bian, C., Li, Y., Liu, W., Dong, J., Wang, K., et al. (2023b). Organic matter transformation ratio, hydrocarbon expulsion efficiency and shale oil enrichment type in Chang 73 shale of Upper Triassic Yanchang Formation in Ordos Basin, NW China. Petroleum Explor. Dev. 50 (1), 14–26. doi:10.1016/S1876-3804(22)60366-5
Zhao, W., Hu, S., and Hou, L. (2018). Connotation and strategic role of in-situ conversion processing of shale oil underground in the onshore China. Petroleum Explor. Dev. 45 (4), 563–572. doi:10.1016/S1876-3804(18)30063-6
Zhao, W., Hu, S., Hou, L., Yang, T., Li, X., Guo, B., et al. (2020). Types and resource potential of continental shale oil in China and its boundary with tight oil. Pet. Explor. Dev. 47 (1), 1–11. doi:10.1016/S1876-3804(20)60001-5
Keywords: shale oil, in-situ conversion, resource grading, theoretical economic index, the Ordos Basin
Citation: Lin S, Luo X, Zhao Z, Hou L, Li S, Li H, Pang Z and Zhang L (2025) Grading evaluation methods for lacustrine shale oil resources developed by in-situ heating conversion technology. Front. Earth Sci. 12:1518236. doi: 10.3389/feart.2024.1518236
Received: 28 October 2024; Accepted: 23 December 2024;
Published: 22 January 2025.
Edited by:
Sen Wang, China University of Petroleum (East China), ChinaReviewed by:
Wenxue Han, Shandong University of Science and Technology, ChinaCopyright © 2025 Lin, Luo, Zhao, Hou, Li, Li, Pang and Zhang. This is an open-access article distributed under the terms of the Creative Commons Attribution License (CC BY). The use, distribution or reproduction in other forums is permitted, provided the original author(s) and the copyright owner(s) are credited and that the original publication in this journal is cited, in accordance with accepted academic practice. No use, distribution or reproduction is permitted which does not comply with these terms.
*Correspondence: Senhu Lin, bHNoMjAxMkBwZXRyb2NoaW5hLmNvbS5jbg==; Xia Luo, bHVveGlhNjlAcGV0cm9jaGluYS5jb20uY24=; Zhongying Zhao, emhhb3pob25neWluZ0BwZXRyb2NoaW5hLmNvbS5jbg==
Disclaimer: All claims expressed in this article are solely those of the authors and do not necessarily represent those of their affiliated organizations, or those of the publisher, the editors and the reviewers. Any product that may be evaluated in this article or claim that may be made by its manufacturer is not guaranteed or endorsed by the publisher.
Research integrity at Frontiers
Learn more about the work of our research integrity team to safeguard the quality of each article we publish.