 Furqan Aftab
 Mohammad Zafar
 Muhammad Iqbal Hajana
 John H. Shaw
95% of researchers rate our articles as excellent or good
Learn more about the work of our research integrity team to safeguard the quality of each article we publish.
Find out more
ORIGINAL RESEARCH article
Front. Earth Sci. , 05 February 2025
Sec. Economic Geology
Volume 12 - 2024 | https://doi.org/10.3389/feart.2024.1516420
Accurate prediction of reservoir properties through linear transformation and regression methods are successful in limited cases but are often geologically unrealistic and have no concrete theoretical foundation. Artificial Neural Network’s (ANN’s) have emerged as an effective tool for deriving nonlinear mathematical relationships between seismic attributes and well logs that are theoretically plausible and may prove geologically realistic. In this paper, we devise a methodology to integrate rock physics analysis, seismic inversion, multi-attribute transformation, and Feedforward Neural Network (FNN) modeling for accurate inter-well reservoir property predictions. We test this methodology on well logs and seismic data from the Cretaceous sandstones of the Sembar Formation, Southern Indus Basin, Pakistan. Viable productive gas zones are identified through rock physics and Model Based Inversion (MBI) analyses. Five volume-based seismic attributes are sequentially calculated through forward stepwise regression and cross-validated for inter-well porosity prediction. When a Probabilistic Neural Network (PNN) is trained in a non-linear mode integrated with multi-attribute transformation, correlation (r2) is improved from 72% to 88% between seismic attributes and porosity derived from logs. The PNN-derived porosity distribution is geologically more realistic than linear transformation and regression methods, supporting our model’s validity. We suggest that it is theoretically possible for the ANN to make predictions about any attribute of the reservoir via bridging target logs and seismic data within a short computation time.
Clastic reservoirs have supplied ever more reserves to the oil and gas sector because of recent scientific and technological developments (Ginting et al., 2011; Yasin et al., 2018). Several researchers have made use of cutting-edge machine learning (ML) methods to examine the full potential of such clastic reservoirs. Backpropagation (BP) networks, which have a single hidden layer and are trained by inverse propagation of errors, are among the most popular types of traditional neural networks (Della’versana, 2019; Qiang et al., 2020). Artificial Intelligence (AI) is a relatively new area of study within the field of geoscience. So far it has been applied to address many geophysical issues. Using Neural networks (NNs), it has been possible to statistically anticipate and establish the link that exists between reservoir properties and seismic data (Ding et al., 2022). A Feedforward neural network, often known as FNN, is a kind of artificial neural network that does not include connections that create a cycle or loop between its nodes. It starts at the input nodes and makes its way to the output nodes after passing through any hidden nodes. The classical example of FNN is Probabilistic Neural Network (PNN). The flow of information in FNN is unidirectional only, i.e., forward (Zell, 1994).
Characterization of reservoir properties in deeply buried sandstones in a manner that is accurate and trustworthy is, however, one of the most significant unresolved challenges. From a petrophysical viewpoint, there is no one-to-one analytical link between seismic characteristics and reservoir properties including porosity. Any attempt to calculate the true economic potential of an exploration area requires a foundation that is provided by improved reservoir characterization integrating numerous datasets (Shakir et al., 2022). This process helps decrease the level of uncertainty involved in establishing new drilling sites (Torres-Verdín and Sen, 2004; Karbalaali et al., 2013; Ali et al., 2018). To forecast rock and fluid characteristics from seismic amplitude data, many seismic inversion approaches have been developed for reservoir characterization. Various seismic inversion approaches like Amplitude Versus Offset (AVO) analysis, Amplitude Variation with incident Angle and Azimuth inversion (AVA/AVAZ), seismic scattering inversion, Simultaneous Inversion (SI), Extended Elastic Impedance (EEI) inversion, and Bayesian Inversion (BI) were extensively reviewed by Hampson et al. (2001), Zhang and Brown (2001), Rüger, (2002), Hampson et al. (2005), Gharaee (2013), Russell, (2014), and Chen and Zong, 2022, Chen et al. (2024a), Chen et al. (2024b). There are many pros and cons associated with each of these approaches, but the most common problem is that these approaches work only on pre-stack seismic data.
NNs provide an additional method for the prediction of the spatial distribution of reservoir rock properties derived from post-stack seismic inversion (Hosseini et al., 2019). NNs do not need prior mathematical equation descriptions to learn and retain a wide variety of input-output mapping connections (Du et al., 2019). Therefore, the use of seismic inversion, which combines the two types of data coupled with NNs, is a new approach used in modern reservoir characterization. Among others, one of the most challenging tasks is the accurate prediction of petrophysical properties across the entire seismic extent beyond well control. The reason behind this difficulty is the lack of any direct correlation between petrophysical properties and seismic amplitude data (Othman et al., 2021). To tackle this problem, we employed a machine learning (ML) technique, known as ANN. The ability of ANN inversion to generate nonlinear correlations between the target and the input attribute has led to its rise in prominence in the last decade. This approach can be successfully applied to predict any reservoir property using target logs and seismic data. The NNs learn the connections and correlations between the target log and the seismic properties at each well site. Then, it uses that information to make predictions about the desired attribute in a spatially explicit 2D and 3D seismic data environment (Othman et al., 2021).
Our test study area to implement this methodology is situated in the Khewari block using seismic data and well logs (Aradin-01 and Suleman-01 wells) of the Lower Indus Basin that geologically lies on Jacobabad High in Pakistan (Figure 1). The Sembar Formation is widely recognized as a primary petroleum source rock of the Lower Indus Basin of Pakistan suggested by oil-to-source correlation studies (Wandrey et al., 2004; Ali et al., 2022). The Sembar Formation is mostly composed of shale, with sandstones intercalated throughout (Shah, 1977). There has been a great deal of studies carried out and published in the past on the shale intervals of the Sembar Formation, but there has been no substantial research work published on the sandstone intervals of the Sembar Formation. Aftab et al. (2022) delineated a comprehensive reservoir properties estimation of the Sembar sandstones via petrophysical analysis, seismic structural interpretation, and developed a spatial correlation using well logs and seismic data. Many vertical and side-tracked wells have been drilled in the Lower Indus Basin but none of them has yet attempted to produce primarily from the sandstone intervals of the Sembar Formation. One reason is the complexity driven by diagenesis at such a great depth and variability of the underlying rock due to changes in lithology. Therefore, it is significantly more difficult to estimate critical reservoir features including petrophysical properties. The expected output of this study is to develop an approach for more accurately determined reservoir properties (effective porosity as a test case in this study) away from well control that may assist with the delineation of prospect fairways of sandstone packages of the Sembar Formation. By accurately estimating these reservoir properties, one may better comprehend the spatial distribution of the productive section of the reservoir and suggest a future field development plan, both of which are crucial to effective reservoir management.
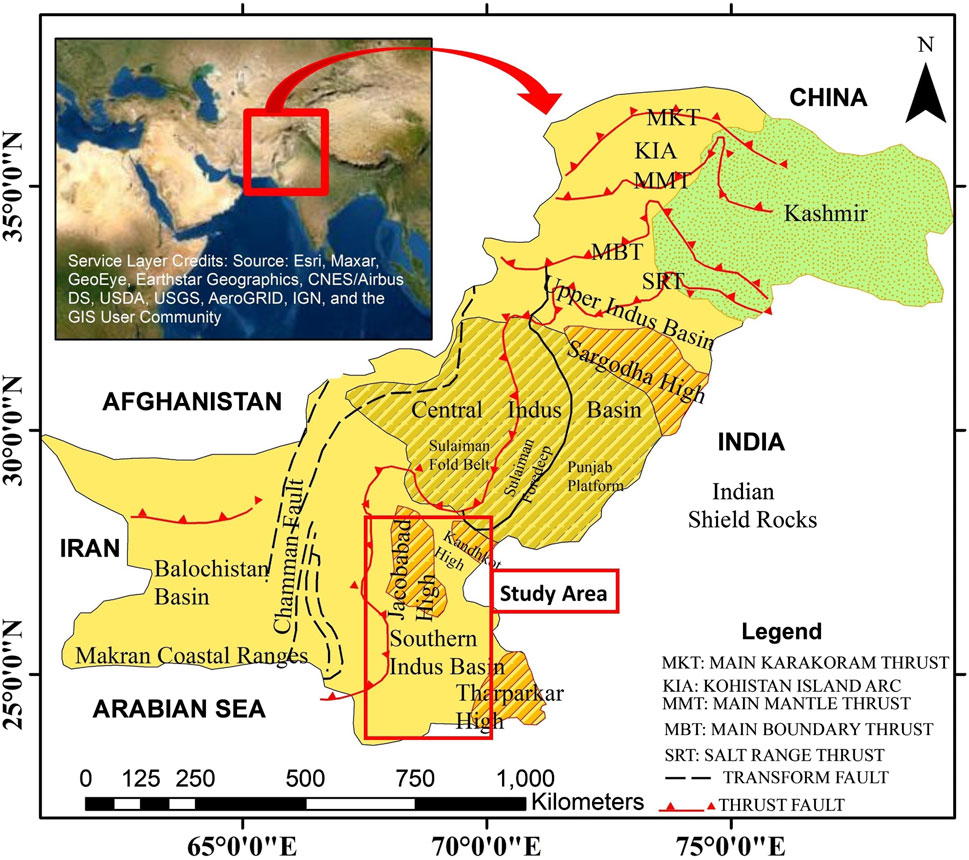
Figure 1. Geological map of Pakistan with a red rectangle representing the boundaries of the study area, modified after (Kadri, 1995; Aftab et al., 2022).
The Khewari and Gambat blocks, which are the primary focus of this research study, span over 1625.36 square kilometers and are in the Khairpur and Nawabshah districts of the Sindh Province of Pakistan. The region is situated near the boundary of the Central and Southern Indus Basins. To be more specific, it is located on Jacobabad-Khairpur High (Figure 1). The width of the Southern Indus Basin is about 250 km and is surrounded on the east by the Thar desert and on the west by fold and thrust belts. The Southern Indus Basin remained tectonically stable throughout the Mesozoic time. The intensity of folding increases westward and is most prominent in the heavily folded and faulted portions of the axial fold and thrust belt (Zaigham and Mallick, 2000). Multiple structural highs are present in the southern part of the Indus Basin. These highs may be seen in Jacobabad, Mari-Kandhkot, Hyderabad, Khairpur, and Sibi districts. Previous researchers including Wadia (1953), Krishnan (1960), Gansser (1979), Kazmi and Rana, (1982), and Kazmi and Jan, (1997) believe that these highs are surface fingerlike expansions of the Indian shield.
The Sembar Formation is the most important conventional clastic source rock in the Southern Indus Basin. The unit has shale as a major lithology and sandstone and siltstone as the minor lithologies (Iqbal and Shah, 1980; Kadri, 1995; Abid et al., 2021) (Figure 2). Sandstone, which most likely originated from the Indian Shield, is found in greater abundance towards the eastern boundaries of the basin with a thickness ranging between 760 and 1000 m. On the other hand, siltstone and shale are more prevalent on the western side and decrease proportionally towards the eastern side (Zaigham and Mallick, 2000). Belemnites, Foraminifera, Ammonoids, and even nano-fossils may all be found in the Sembar Formation (Sheikh and Giao, 2017). The age of the Sembar Formation extends over the whole of the Neocomian period, which occurred during the early Cretaceous with open sea to shallow marine environment of deposition (Bender et al., 1995; Ahmad et al., 2019). The Sembar Formation is deposited under the influence of wave and tidal regimes with a net pay higher than 300 m in the delta front and pro-delta environment of deposition (Quadri and Shuaib, 1986). Both the lower and upper contacts with the Chiltan and Goru Formations are unconformable and gradational, respectively (Bender et al., 1995). The initiation of extensional tectonics during the Cretaceous period affected the construction of structures in the area that were favorable for the accumulation of oil and gas (Milan and Rodgers, 1993; Ali et al., 2022). Oil production from the Sembar Formation is estimated to be in the range of 65–155 million barrels per square kilometer (Quadri and Shuaib, 1986).
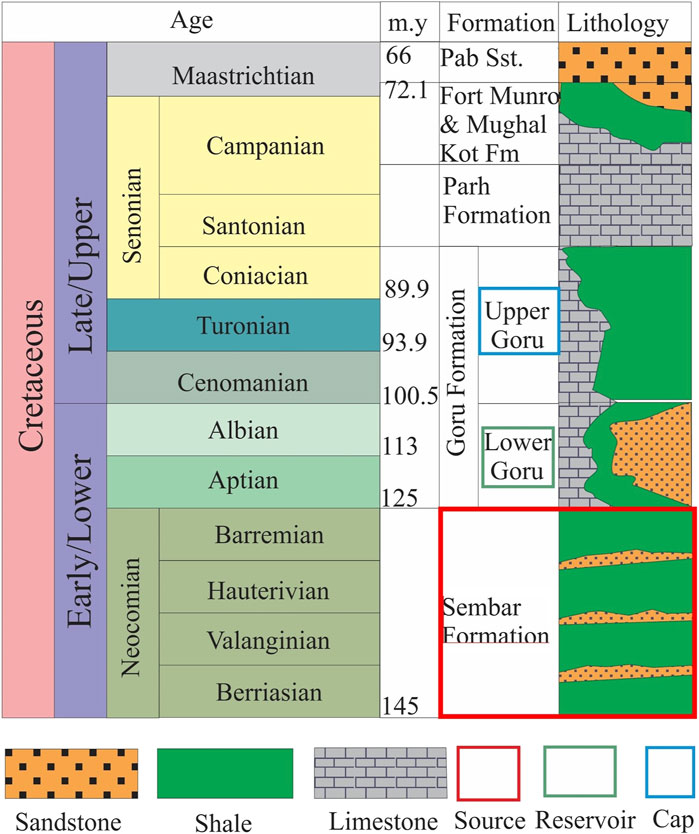
Figure 2. Generalized stratigraphic chart of the Lower Indus Basin of Pakistan modified from (Yousaf, 2020; Aftab et al., 2022). Shale and sandstone are shown as major and minor lithologies of the Sembar Formation, respectively.
This research makes use of a data set that consists of well logs, post-stack seismic data, and root mean square (RMS) stacking velocities. Every well was drilled to such a depth that it had significant penetrations of the Sembar Formation. Log ASCII Standard (LAS) file format of study wells contained a full suite of log curves, which included but were not limited to caliper, gamma ray, spontaneous potential, computed gamma ray, micro spherically focused log, latero log deep, latero log shallow, neutron, bulk density, and sonic log curves. This study consists of four separate stages of execution. During the initial stage of this project, a thick (∼200 m) sandstone interval in the Sembar Formation was marked in each well by estimating the amount of shale present using the gamma-ray log curve. After marking hydrocarbon and water profiles using fluid indicators and porosity logs, sandier zones with good hydrocarbon potential were marked. Then petrophysical reservoir properties such as average porosity, permeability, effective porosity, volume of shale, hydrocarbon, and water saturation were estimated to begin the process of identifying potentially prospective sandstone intervals within the Sembar Formation. In the second stage of this study, a rock physics analysis was conducted during which several petrophysical and elastic parameters were plotted to examine the nature of reservoir properties and elastic parameters of rock including the influence of fluid content.
In the third stage of this study, seismic interpretation was carried out to define the structural geometry of sandstones of the Sembar Formation. Following the establishment of a time-to-depth link with the assistance of well-log data, the horizons were located and mapped out. To carry out any kind of seismic inversion procedure, it is essential to have inputs such as interpreted seismic boundaries and elastic logs (both acoustic and density). Post-stack seismic inversion provided an external attribute for the extraction of reservoir properties using inverted seismic data. Two types of seismic inversion, namely, Colored Seismic Inversion (SCI) and MBI are incorporated in this study. Post-stack seismic data with zero offset assumption is utilized for the application of SCI and MBI. In the MBI workflow, following the extraction of a statistical wavelet from the seismic data, a seismic-to-well tie was established. In a later step, a well-based wavelet was used for a seismic-to-well tie to maximize the correlation to the highest possible degree of confidence. To make up for the absence of missing low frequencies, a low-frequency acoustic-impedance model (referred to as the LFM or initial model) was constructed and incorporated using interpreted seismic data. The seismic data passing through each well location was used to make a correlation, and then seismic inversion analyses at well locations were carried out to calculate the seismic inversion parameters and bring the amount of error down to an acceptable level. In the end, an inverted acoustic impedance seismic section is obtained by applying MBI to the entire amplitude-based post-stack seismic data.
The fourth and last stage was the integration of multi-attribute transformation and AI-based neural network approach known as FNN, more specifically, a non-linear PNN technique to establish an optimum relationship between target logs and reservoir properties using extracted seismic attributes. Using this method, the petrophysical properties calculated from all the study wells were trained by using post-stack seismic attributes as internal attributes and inverted seismic p-impedance was taken as an external attribute. Porosity was determined by extrapolating the results of a non-linear empirical relationship that existed between the actual porosities at well sites and expected porosities away from the well site throughout the seismic data. A detailed workflow chart of the methodology adopted in this study is shown in Figure 3.
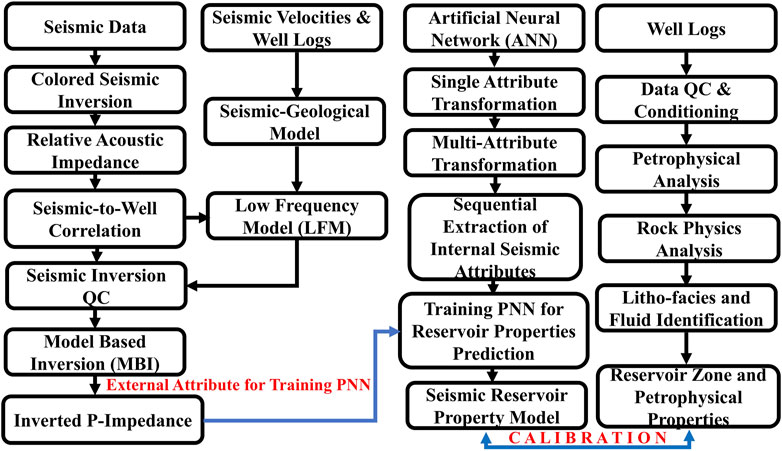
Figure 3. Detailed workflow chart of the methodology adopted in this study.
Well-log conditioning, especially sonic and density log curves editing (using log editing techniques) is the first and foremost important step for accurate and reliable petrophysical properties modeling, well-to-seismic tie, inverted impedance model building, and rock physics analysis. Durrani et al. (2020) described the well and seismic data conditioning workflow in detail. We performed a thorough well and seismic data QC to get optimal results and successfully achieve the objectives of this study. The input study data (seismic and well data) lies in Ultimate Transverse Mercator Zone 42 North (66 E − 72 E longitude), and all the map coordinates are georeferenced using the World Geodetic System 1984. Before commencing this study, the well data quality was thoroughly checked. The inventory of well log curve sets and the log headers confirm the availability of well log curves and associate them with their correct names. The standardization of all well log curves was accomplished using curve-aliasing and curve mnemonics techniques. With the use of seismic headers and parameter testing techniques, seismic data was checked in terms of X and Y coordinates, line length, CMP, number of shot points, and related shot number.
The accuracy of petrophysical modeling is vital for the accurate prediction of reservoir properties through seismic inversion and the subsequent ANN analysis. The detailed workflow and methodology for petrophysical analysis performed in this study are adopted from the criteria given by Aftab et al. (2022). The detailed petrophysical analysis of sandstones of the Sembar Formation encountered in the Aradin-01 well is shown in Figure 4. A zone of about 195 m thick zone of reservoir gas sands is encountered in Aradin-01 well at a depth of 4065–4260 m. This zone is characterized by 13.63% average volume of shale (86.37% average volume of sands) and 17% and 14% average and effective porosities, respectively. The average permeability of this sand unit is 5.76 millidarcy, whereas the average water saturation is 29.83% (70.17% average hydrocarbon saturation). This thick reservoir gas sandstone unit is confirmed by the presence of bulk density-neutron porosity crossover that exists in more than 95% zone and net pay marked in more than 85% of this sandstone unit. The quantitative modeled properties derived from the petrophysical analysis of the marked reservoir zone in the Aradin-01 well are shown in Table 1.
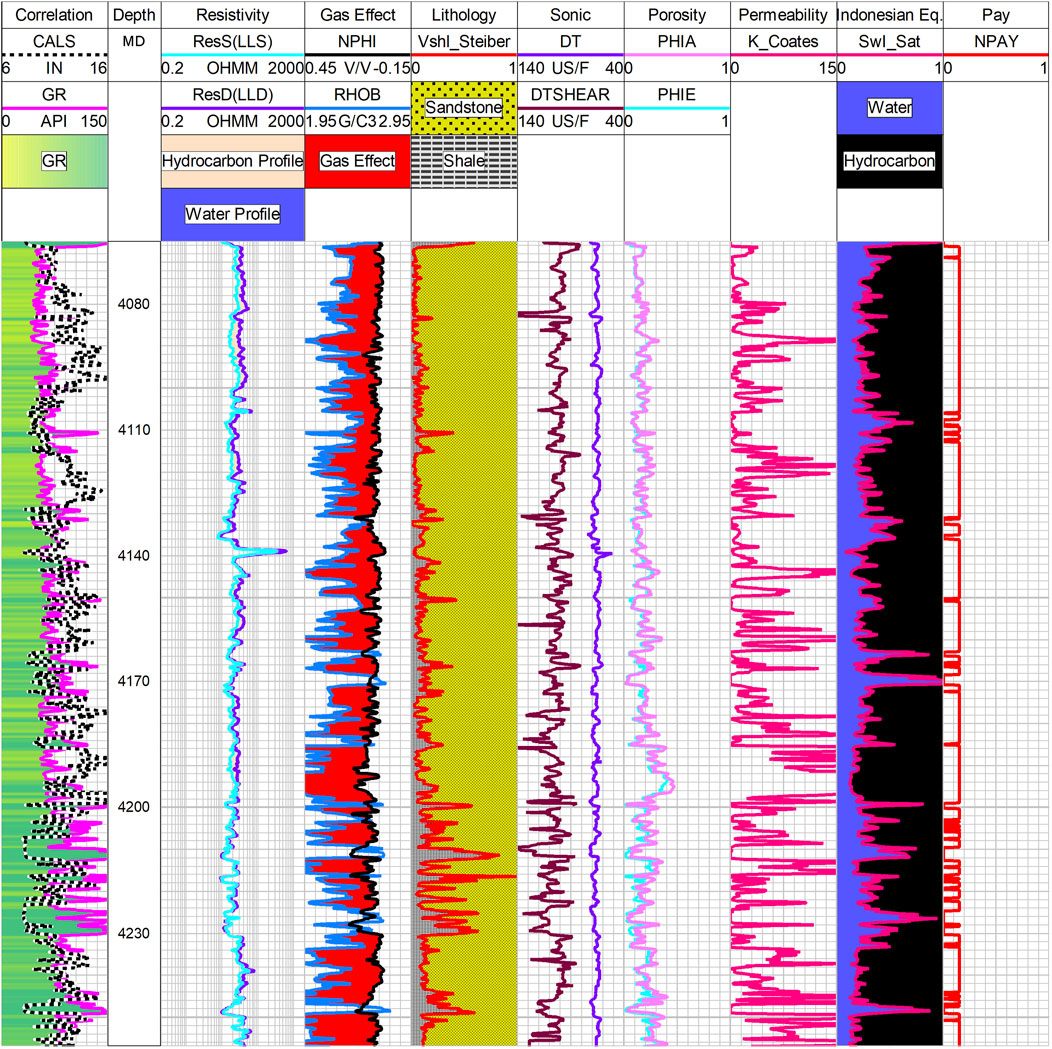
Figure 4. Detailed petrophysical analysis of 195 m thick sandstone unit encountered in Aradin-01 well. The gas effect (marked in the third track) is present in more than 95% of this reservoir zone. The yellow color represents sandstone in the lithology track (fourth track). Hydrocarbon saturation is depicted with black color and water saturation with blue color computed through Indonesian equation is shown in the second last track.
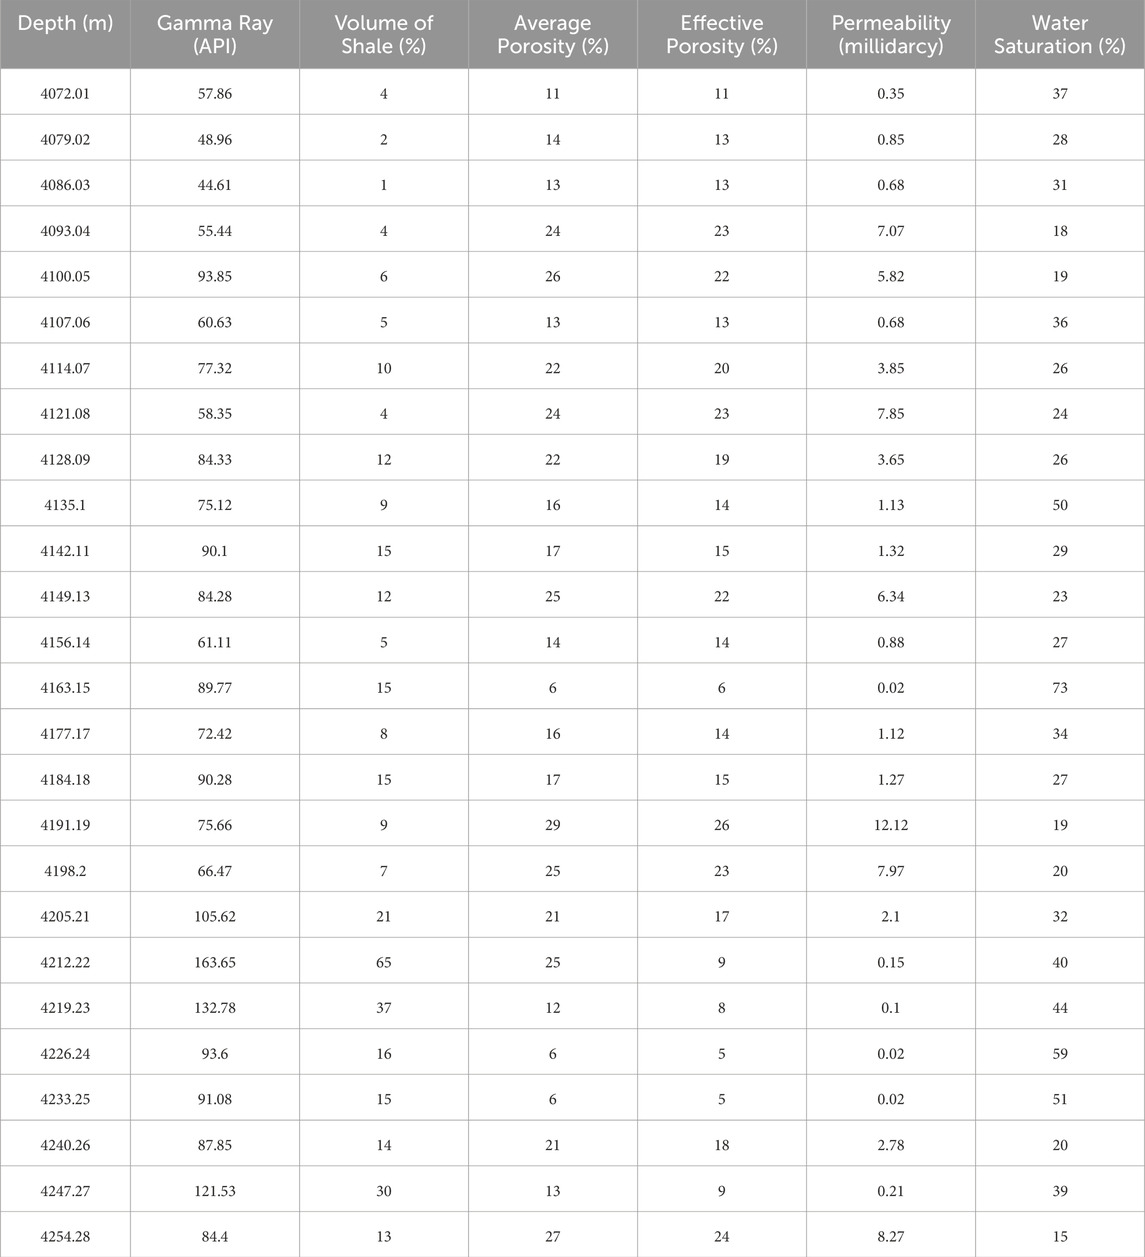
Table 1. The quantitative modeled properties derived from the petrophysical analysis of sandstones of the Sembar Formation encountered in Aradin-01 well.
Rock physics acts as a bridge between reservoir properties derived from petrophysics (like, volume of shale and water saturation, etc.) and reservoir elastic properties (like, P-impedance, S-impedance, Vp/Vs ratio, etc.) (Avseth, 2000). Cross-plot analysis is a very powerful visualization tool that not only allows us to differentiate between various lithofacies but also provides an interface to mark data clusters in the zone of interest (Mavko et al., 2020). According to Azeem et al. (2017), quantitative classification of petrophysical and elastic properties of sandstone and shale lithofacies suggests that the gas-bearing sand zone should contain Gamma Ray <80 API (volume of shale less than or equal to 20%), water saturation <55%, P-impedance less than 10,200 (m/s)*(g/cc), S-impedance less than 6200 (m/s)*(g/cc) and Vp/Vs ratio less than or equal to 1.65. The gas sands will convert into shaly sand and shale if the elastic and reservoir properties exceed the aforementioned ranges. The cross-plot analysis in the reservoir zone of sandstone of the Sembar Formation between P-impedance (x-axis) and Vp/Vs ratio (y-axis), with data points color-coded with the volume of shale and water saturation (computed from petrophysical analysis), are shown in Figs. (A) and (B), respectively. The low values of P-impedance, Vp/Vs ratio, and volume of shale represent clean sands. The first cross-plot separates lithofacies with red color data point circles which represent clean sands (volume of shale less than or equal to 20% with low P-impedance and Vp/Vs ratio), yellow circles represent shaly sand and blue-green circles represent shale as shown in Figure 5A. The low values of P-impedance, Vp/Vs ratio, and water saturation represent gas-sands. The reason behind this is the presence of gas which decreases both the acoustic impedance and Vp/Vs ratio (Azeem et al., 2017). Figure 5B separates the hydrocarbon-bearing zone from a non-hydrocarbon-bearing zone. This plot shows gas sands with red and yellow data point circles (where water saturation is less than or equal to 50% with low P-impedance and Vp/Vs ratio) and predominant water-saturated sediments with blue-green color data point circles. The low values of P-impedance, S-impedance, and water saturation represent highly saturated gas sands. Whereas high values of P-impedance, S-impedance, and water saturation represent shale without any gas saturation (Castagna et al., 1993). Figure 5C shows a cross plot between P-impedance (x-axis) and S-impedance (y-axis), color-coded with water saturation (z-axis). Figure 5C shows red data point circles as gas-saturated sands (data cluster with low P- and S-impedances along with very low water saturation), whereas yellow and green color circles represent the water-saturated zone. The rock physics cross-plot analysis in this study has successfully separated productive payable hydrocarbon sandstone zone (gas-bearing sands with P-impedance <10,200 (m/s)*(g/cc), S-impedance <6200 (m/s)*(g/cc) and Vp/Vs ratio <1.65) from non-hydrocarbon zone via bridging reservoir and elastic properties in the reservoir zone of sandstone of the Sembar Formation.
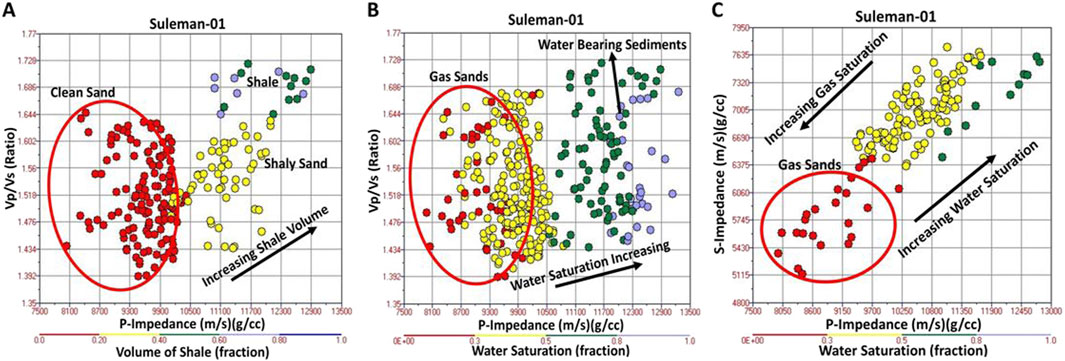
Figure 5. (A) Cross-plot analysis of P-impedance versus Vp/Vs ratio, color-coded with the volume of shale in the reservoir zone of interest in Suleman-01 well. Clean sand is marked (red circle) and separated from shaly sand and shale; (B) Cross-plot analysis of P-impedance versus Vp/Vs ratio, color-coded with water saturation in reservoir zone of interest in Suleman-01 well. Gas sands are marked (red and yellow circles) and separated from water-bearing sediments; (C) Cross-plot analysis of P-impedance versus S-impedance, color-coded with water saturation in reservoir zone of interest in Suleman-01 well. Gas sands are marked (red circle) and separated from water-bearing sediments.
Seismic reflection data imaging and analysis are established as one of the best ways to constrain subsurface structural and stratigraphic geometries. The reliability and precision of the inverse seismic-geological model chiefly depend on the interpretation of the observed seismic-geological model (Ali et al., 2018). In other words, the degree of misinterpretation of processed seismic data will incorporate a proportional error into the inverted seismic model. The marked horizon at the top of the sandstone of the Sembar Formation on seismic data varies in thickness from 170 to 200 milliseconds (Aftab et al., 2022). The study area is governed by trans-tensional tectonics (having both normal and strike-slip components) with northwest-southeast trending faults having a little vertical throw. These faults are mainly present in the Cretaceous strata and extend downward to the Jurassic sequence forming a horst and graben structures in the study area (Aftab et al., 2022).
The relative acoustic impedance model generated through SCI based on an un-constrained sparse spike inversion algorithm is the preliminary model generated in this study for qualitative interpretation. Simplicity and short computation time make SCI a good preliminary inversion model (Naseer, 2021). This robust and non-exhaustive seismic inversion technique provides a good initial model for qualitative interpretation of reservoir properties with positive and negative acoustic impedance values. SCI requires a color operator depicting the information of frequency and time versus amplitude. We initialized SCI with one data pair with a processing sample interval of 2 ms, operator length of 200 samples, and taper length of 50 samples. The spectrum threshold for SCI is set at 20% (Figure 6). Figure 7 shows the result of SCI applied to the interpreted seismic data along with well locations and GR log curves displayed on it. The acoustic impedance observed at the level of sandstone of the Sembar Formation is relatively low (mainly with negative values) suggesting an onset of the potential porous formation. Whereas relatively high acoustic impedance (mainly with positive values) can be qualitatively observed in lithological units above and below the sandstone of the Sembar Formation. Although SCI gives us a piece of valuable impedance information and does not require an initial model, its main limitation is the fact that it reveals information in terms of relative acoustic impedances, as opposed to absolute acoustic impedances (with positive and negative values). Therefore, we have further applied MBI for the development of a more accurate and reliable absolute acoustic impedance model (discussed in Sections 4.6–4.9).
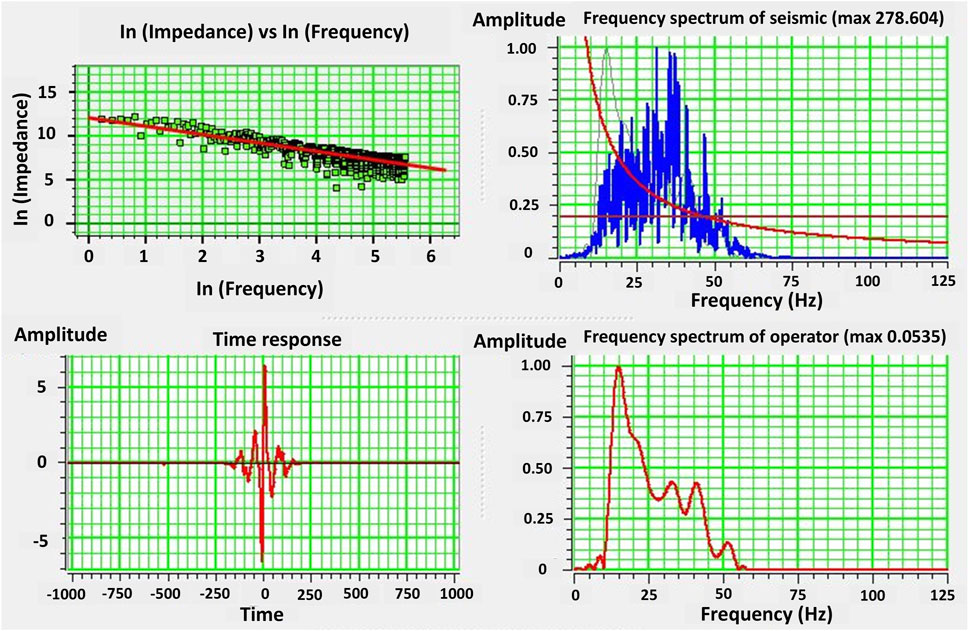
Figure 6. A Color operator is required to perform SCI successfully. The frequency spectrum of the color operator and seismic data is manifested by plotting frequency and time versus amplitude while setting a sample interval of 2 ms, operator length of 200 samples, and taper length of 50 samples with SCI spectrum threshold of 20%.
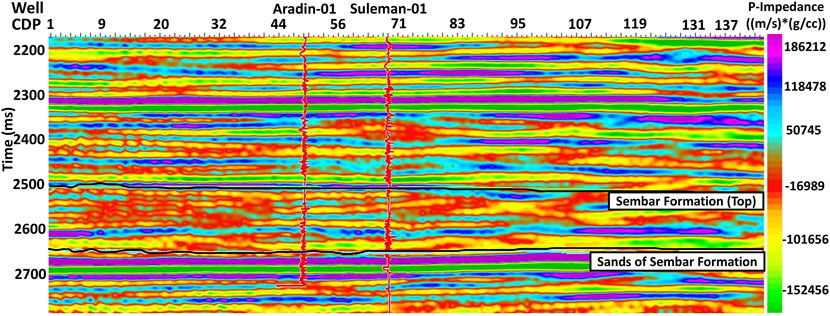
Figure 7. SCI model depicting relative P-impedances using seismic data. Sands of the Sembar Formation are predominantly delineating negative P-impedance layers along with only a couple of positive P-impedance layers. These negative P-impedance layers are qualitative indicators of a good reservoir sand unit (since acoustic impedance is inversely relational to reservoir properties like porosity, etc.).
MBI is the most accurate and reliable among all the available post-stack seismic inversion techniques. However, a few steps are necessary to perform after seismic and well data loading, conditioning, and QC before the application of MBI. Correlation of seismic times to well depths is the first step and critical for accurate quantitative seismic reservoir characterization through MBI. Among other factors (like seismic and well data quality), the reliability of this correlation is highly dependent upon the accurate wavelet estimation (Durrani et al., 2020). A well-to-seismic correlation for all study wells was individually established before the estimation of an average single well wavelet. The comprehensive workflow that was employed includes: 1) Development of a time-depth relationship between seismic and well data using sonic and density logs for the estimation of reflectivity series, 2) Extraction of zero-phase statistical wavelet since utilized seismic data is zero-phase (Figure 8), 3) Correlation of each well, that will be used for the building of seismic inversion model with seismic data, 4) Extraction of an average well wavelet using all the wells, and 5) Fine adjustment of each well correlation via giving shift to synthetic traces to match with the seismic data.
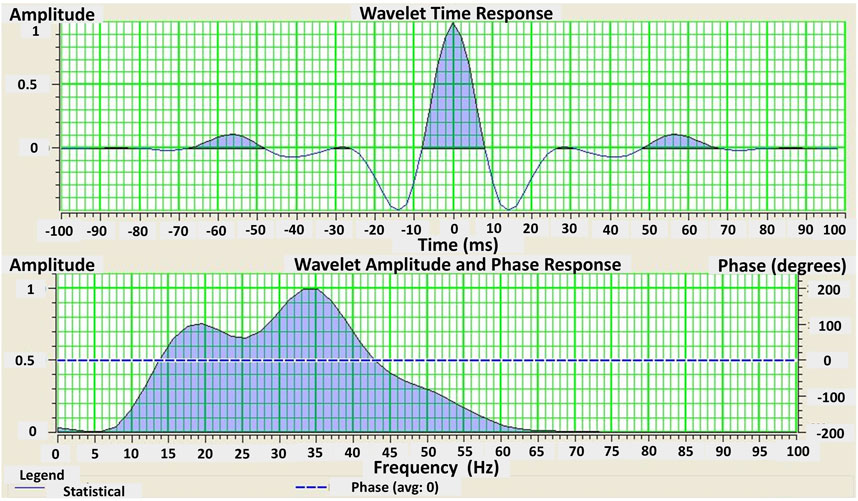
Figure 8. Extracted zero phase statistical wavelet with frequency and amplitude spectrum. The wavelength is 200 m which is normally kept to one-third of the seismic inversion analysis window. The Blue dotted line represents the phase which is zero in this case with the average amplitude of the frequency spectrum. The frequency spectrum is kept broad to build an accurate geological model with detailed information of the subsurface.
Input sonic and density logs were calibrated with accurate well velocities obtained from borehole seismic data. Synthetic trace in the zone of interest is the direct output of one-dimensional forward modeling. A synthetic trace was developed by convolving a zero-phase statistical wavelet with a reflectivity series derived from sonic and density logs. Hence, a time-depth relationship is established between seismic and well data. The maximum correlation coefficient achieved with this procedure is 74.4%. The reliability of this time-depth correlation between seismic and well data is dependent upon multiple factors such as a suitable time window for wavelet estimation. To improve the correlation coefficient for more confidence in time-depth correlation, a well wavelet was extracted in a 350 ms time window (from 2400 to 2750 ms) which is the common representative of all the study wells. This well wavelet is finalized after an iterative approach based on multiple quality checks, including phase, spectral analysis, and wavelet shape. Hence, the correlation coefficient is improved to 80.7% and the mismatch between synthetic and seismic traces is further reduced. In other words, more confidence in the well-to-seismic tie is achieved (Figure 9). All study wells are tied with excellent correlation between well and seismic data. Good agreement and match between major seismic events (based on picked horizons) and well data (synthetic trace) represents that the extracted wavelet and reflectivity data are accurate, which is the true representation of subsurface geology, consistent with seismic data.
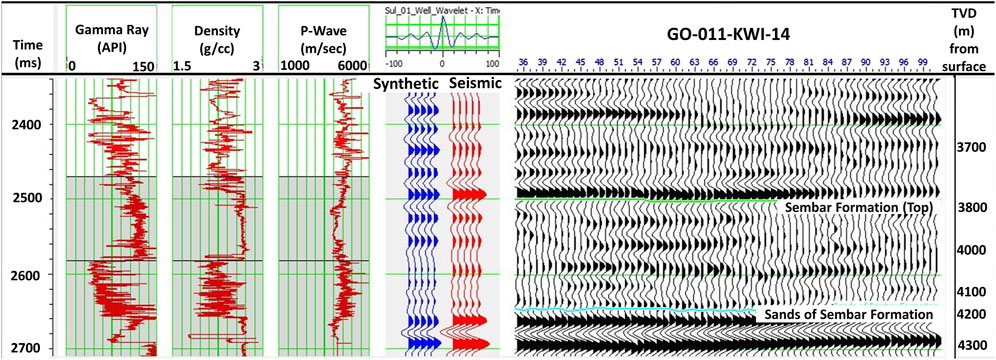
Figure 9. Well-to-seismic tie established with the help of synthetic seismogram (blue color trace shown in fourth track) using sonic and density logs of Suleman-01 well. The red color trace is a composite seismic trace. Both synthetic and seismic traces are in excellent correlation with each other. The fifth track represents seismic data with seismic peaks and troughs tied and matched excellently with synthetic seismogram.
Seismic reflection data generally does not contain low frequencies (0–10 Hz) for several reasons including, but not limited to: 1) the non-capability of the recording geophones to record such a low frequency, 2) non-recording of the low-frequency seismic data due to the problem of ground rolls and, 3) the removal of low frequencies during seismic data processing to enhance the signal to noise ratio (Sams and Carter, 2017). The lack of low frequencies in the final seismic inverted model will result in pseudo impedance layers. Therefore, building an LFM and its incorporation in seismic inversion workflow is inevitable to recover the absolute acoustic impedance of the subsurface. Well logs and seismic velocity data are the two primary sources that may be utilized to aid in the development of LFM (Sams and Carter, 2017). Other types of data like electromagnetic data are also potentially viable to build LFM (Mukerji et al., 2009). Well logs (related to required elastic properties) contain frequencies that range far above and below the frequency spectrum of seismic data. Seismic velocity data contain compressional velocity information with 0–3 Hz of reliable frequencies. Therefore, we utilized the integrated well logs and seismic data in building LFM to incorporate the entire range of low frequencies. The most typical approach to constructing an LFM is the interpolation of horizons and well data using various interpolation methods (Pedersen-Tatalovic et al., 2008). Three horizons, namely, the top of the Sembar Formation, the sands of the Sembar Formation, and the Chiltan limestone were utilized via stretching and squeezing the acoustic impedances for interpolation between the wells using inverse distance interpolation algorithm within a structural and stratigraphic framework. After the interpolation of well data, a low-pass frequency filter was designed which passes all the frequencies from 0 to 10 Hz, interpolates all the frequencies between 10 and 15 Hz, and blocks the frequencies that lie above 15 Hz. This initial model is LFM which is shown in Figure 10 along with well locations and GR log curves displayed on it.
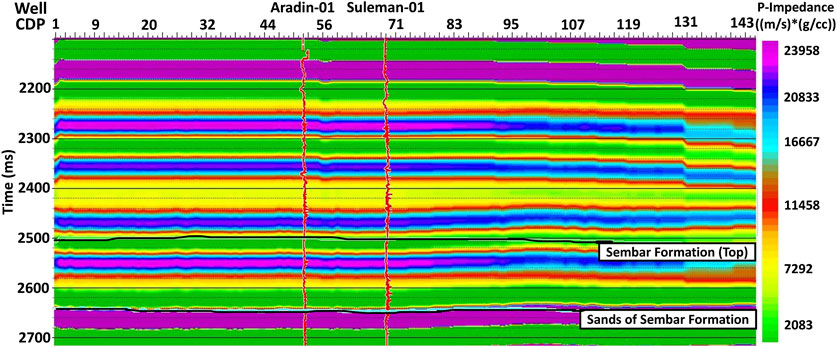
Figure 10. Seismic data showing LFM used for MBI with Aradin-01, and Suleman-01 wells overlain on it. Vertical variation in lithology is depicted by vertically changing colors whereas the horizontal extent of a particular lithology and change in facie is represented by colors changing horizontally.
Quality control (QC) and parameter testing are crucial before the application of any seismic inversion on the entire seismic dataset. This can be accomplished by the selection of optimum parameters and the application of the required seismic inversion algorithm at the well location only. Simultaneously, scalars are computed so that the seismic data may be scaled to the same amplitude range as the synthetic seismogram. Figure 11 shows the results of MBI analysis with multiple tracks from left to right starting with the display of the seismic inversion result (inverted seismic acoustic impedance) which is shown as a superimposed curve in red color over the well’s initial impedance log in blue color. Both curves mainly overlap with each other and show a good agreement between the two in the zone of interest of the seismic inversion analysis window. In the next three tracks, a wavelet is extracted as shown by blue color, then a synthetic trace in red color (derived from the application of seismic inversion) and the actual composite seismic trace in black color, respectively. The last track shows the error trace in the seismic inversion analysis at the well location, which is the difference between the synthetic trace derived from seismic inversion and the actual composite seismic trace. This error is only 8% with a correlation coefficient of around 99%. These statistics show that: 1) the applied seismic inversion is mathematically accurate, and 2) there is a good agreement in the correlation between seismic inversion derived synthetic trace and actual composite seismic trace. This gives us confidence to proceed towards the application of post-stack model-based seismic inversion on entire seismic data.
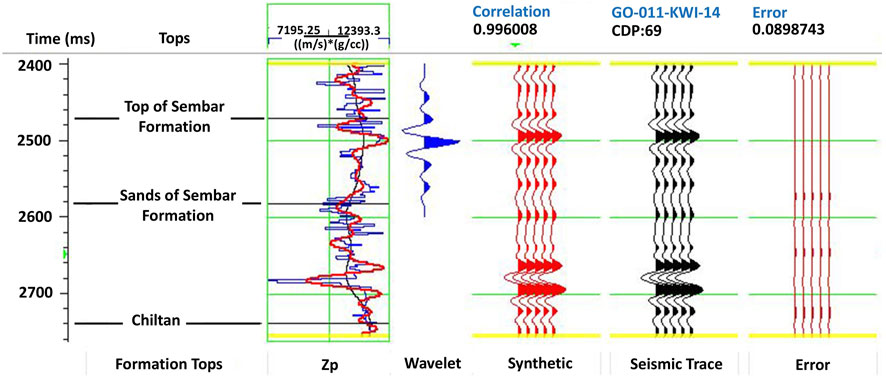
Figure 11. Post-stack MBI error analysis at Suleman-01 well. MBI error analysis window is set in between 2400 and 2740 m represented by two yellow lines. Track-1 represents an inverted p-impedance curve shown in red color superimposed over the well’s initial impedance log curve shown in blue color. The next three tracks show extracted wavelet, synthetic trace, and composite seismic trace, respectively. The final track shows the difference between synthetic and composite seismic trace in terms of inversion error which is negligible in this case.
Low frequencies remained partially recorded during seismic data acquisition and fully removed during seismic data processing due to associated ground rolls incorporating a thin bed tuning effect. Thus, the Sparse-spike inversion (SSI) algorithm requires the addition of LFM separately (Cooke and Schneider, 1983). Absolute acoustic impedance is the manifestation of an exhaustive and time-consuming seismic inversion technique with low-frequency components (0–10 Hz) being a part of the MBI workflow (Cooke and Cant, 2010). In this study, we applied MBI to seismic data because it is stable and can identify geological boundaries and structural trends with few wells and restricted seismic data quality. The convolution model serves as the foundation for MBI, and it is a well-established principle that a synthetic trace can be developed from the convolution of a chosen wavelet and the earth’s reflectivity series (Barclay et al., 2008), proposed by an Equation 1 as follows:
Where S is the seismic trace, W is the extracted seismic wavelet, R is the reflectivity series (for which we solve this equation) and N is random noise (which is uncorrelated with the signal).
MBI is based on the Generalized Linear Inversion (GLI) algorithm to guess an accurate reflection coefficient (RC) series, hence an accurate impedance model with the assumption that the seismic trace S and extracted wavelet W are already known. Therefore, MBI works on the principle that the sonic and density logs generate blocked acoustic impedance logs at well locations. The convolution of this blocked acoustic impedance log and extracted wavelet results in the development of synthetic trace. This synthetic seismogram is our calculated geophysical data, whereas acquired and processed seismic data (real seismic data) are our observed geophysical data. The mismatch between observed and calculated geophysical data is an objective function. The main approach of the inversion operator is to minimize the objective function or in other words, misfit between observed and calculated geophysical data (Lee et al., 2013). The first blocked acoustic impedance trace model with low frequencies incorporated in this study is LFM. We updated the blocked acoustic impedance model by adopting an iterative approach to reduce a mismatch between seismic and synthetic traces to as low as possible by running 10 iterations. The error decreases with every iteration which is the average difference between acoustic impedance results and well logs. The maximum acoustic impedance change was defined by setting hard constraints to 100% for upper and lower limits to keep our model output in this set range of values. The average block size and pre-whitening are set to 2 ms and 1%, respectively. This iterative approach is mathematically alluded to by Hampson et al. (2001) in Equation 2:
Where the objective function is denoted by J and RC series by R, H is the integration operator to produce the final impedance after convolution with final reflectivity, M is the initial impedance model, S is the actual seismic trace and W is the extracted wavelet.
We improved the prediction of reservoir rock properties through the integration of two methods: a) multi-attribute transformation and b) utilization of an ANN via training of PNN. This approach is applied to the sandstone of the Sembar Formation using seismic and well data of the study area to test the validity of our devised methodology and output model. Firstly, a statistical relationship (linear regression) was developed between target logs like effective porosity, etc., and seismic data at the well locations (using all study wells). Then a non-linear relationship was derived between the target log and seismic attributes via training PNN to improve the correlation coefficient of the reservoir property model. Lastly, this computed relationship was utilized over the entire seismic volume to predict reservoir properties beyond well control. The workflow adopted for ANN-predicted reservoir properties is shown in Figure 12.
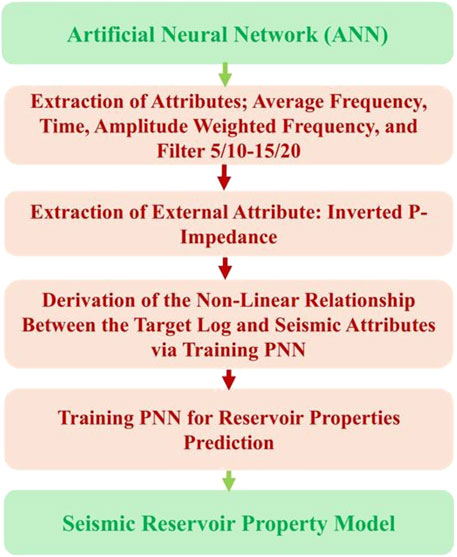
Figure 12. Workflow adopted in this study for ANN-predicted reservoir properties.
The porosity logs were converted into a time domain from a depth domain using a time-depth relationship established through a corrected sonic log along with a 2 ms processing sample rate to integrate well and seismic data. Two types of attributes were utilized for the prediction of reservoir properties through the target log: a) internal attribute and b) external attribute. The internal attributes are those sets of volume attributes that are derived from the input seismic data. These attributes are calculated sample-by-sample from seismic data. The external attributes are a bit more complex and require deriving them mathematically from seismic data, for example, inverting p-impedance from a seismic inversion (Dorrington and Link, 2004). In this study, an inverted p-impedance was derived from MBI as an external attribute from input seismic data. One average composite trace was extracted which is representative of both wells from the nearest seismic line. The analysis window is set in between 2470 and 2740 ms with target log(effective porosity) in red color, seismic trace in black color, and external attribute (MBI inverted p-impedance) in blue color as shown in Figure 13A. The correlation coefficient is a measure of how useful and reliable an attribute is for the prediction of a certain target log. Therefore, a series of linear and non-linear transformations were utilized to calculate and test the correlation coefficient of internal and external attributes for the prediction of the target log.
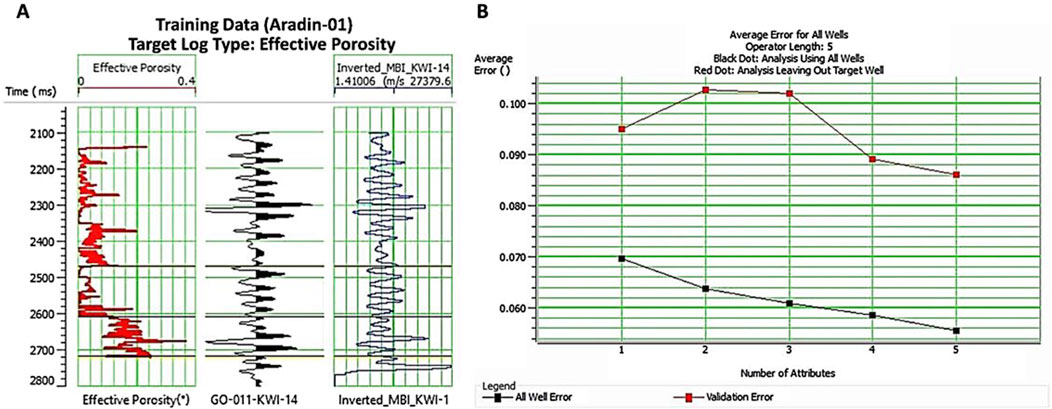
Figure 13. (A) Target log(effective porosity), composite seismic trace, and inverted P-impedance (external seismic attribute) utilized to predict effective porosity in analysis window set in between 2470 and 2740 m; (B) Five seismic attributes utilized in this study are numbered on the x-axis and their associated average prediction error is plotted on the y-axis. The lower black curve represents all wells’ errors whereas the upper red curve represents validation error which ultimately decreases with the increase in the number of seismic attributes.
Firstly, a single attribute analysis/transformation was performed to generate a single attribute list having a target or transformed target logs paired with an attribute or transformed attributes. Subsequently, a statistical error and correlation between each target-attribute pair were calculated. The analysis shows a minimum statistical error of around 7% and the highest correlation of around 39% between effective porosity and time attribute. This low correlation is because of the inability of a single attribute to predict subtle features of the target log. This average error of 7% is the root-mean-square difference between the predicted values and target logs. Since the correlation coefficient between the target log and predicted values is quite low, multiple attributes were simultaneously incorporated to predict and resolve subtle features of the target log to enhance the correlation coefficient and reliability of predicted values. This process is known as multi-attribute analysis/transformation. Multiple attributes were analyzed by creating a list of transformations at a time using forward stepwise regression. The first best attribute-target log pair is one with minimum error and the highest correlation. Using the trial-and-error method five best attributes were recognized to predict target log values. The criteria for choosing these five attributes are the sequential selection of those attributes having minimum RMS error and the highest correlation coefficient. Four of these attributes are internal and one is external as shown in Table 2. As the target value is a log property and the attribute is a seismic property, a convolution operator is required to establish a relationship between one-dimensional and two-dimensional property modeling, respectively. Therefore, an operator length of five was chosen (which determines the length of the convolution operator) with a pre-whitening of 0.10%. The operator length should be set following the number of attributes utilized for the prediction of the target log. Large operators will be more reliable in the prediction of target log as compared to short operators but the risk of predicting noise will be directly proportional to the operator length. The Equation 3 that expresses the relationship between the target log and attributes (Russell et al., 1997; Hampson et al., 2001) is given in the following:
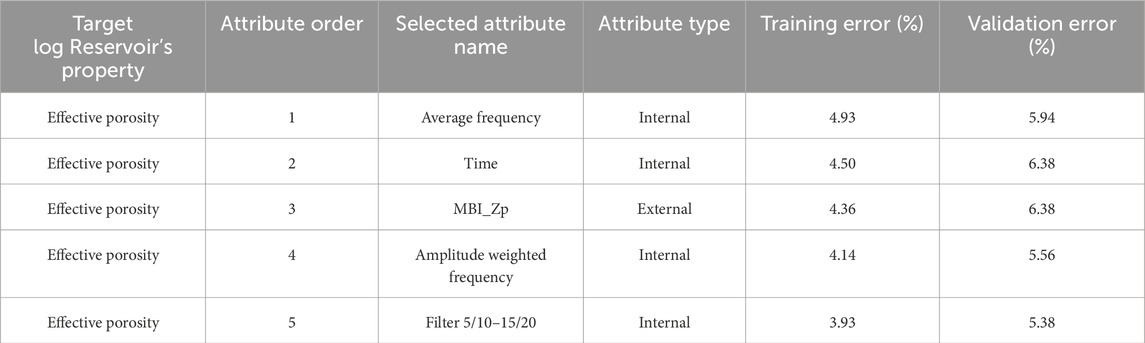
Table 2. The best set of sequentially derived internal and external seismic attributes (with computed training and validation error) was selected through forward stepwise regression to train the PNN for the prediction of effective porosity.
Where T is target values, A is attribute values, constant is calculated from least square regression, * is the convolution operator, and weight is calculated through least square regression.
Figure 13B shows the number of attributes on the x-axis and the average prediction error on the y-axis. The lower black curve represents all wells error whereas the red curve represents validation error. The validation error should mathematically decrease with the increase in the number of attributes. In this study, the validation error is minimal with the incorporation of the fifth attribute. Therefore, only five attributes were utilized for this study. Increasing the number of attributes will otherwise increase noise in the prediction of target log values. The multi-attribute transformation/regression was applied using five attributes simultaneously. As compared to single attribute transformation, the correlation coefficient is now increased from 39% to 72% with average statistical error decreased from 7% to 5%, as shown in Figure 14A.
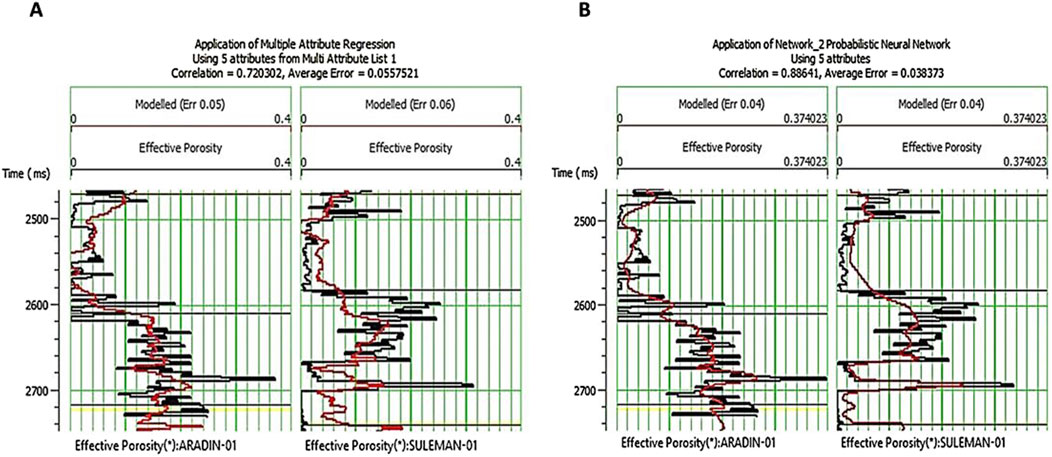
Figure 14. (A) Application of multi-attribute transformation using five seismic attributes simultaneously with a correlation of 72% and average error of 5% to predict effective porosity in Aradin-01 and Suleman-01 wells; (B) Application of PNN using five seismic attributes at a time with a correlation of 88% and average error of 3% to predict effective porosity in Aradin-01 and Suleman-01 wells.
To address more complicated problems without having previous knowledge of the process, nonlinear models that are based on data-driven methodologies such as ANN are used (Herrera et al., 2006; Durrani et al., 2020). Therefore, in this study, the predictive power of reservoir property modeling was enhanced via training of FNN-derived PNN integrated with multi-attribute transformation. Therefore, a neural network was developed with the same five attributes that have already been utilized for muti-attribute transformation. This is because these attributes are found best in terms of reliability and correlation in predicting the target log. PNN is trained with study wells in a 2470–2740 ms analysis window for predicting effective porosity using the attributes; MBI inverted p-impedance as an external attribute, average frequency, time, amplitude weighted frequency, and filter 5/10–15/20 as internal attributes. The parameters used in training PNN for this study include operator length of 5, operator lag measured from the center is 0, and pre-whitening of 0.1%. The number of sigmas for training PNN is set to 25 with sigmas ranging from 0.1 to 3 and the number of conjugate-gradient iterations is 20. Then PNN was applied in mapping mode, cascading with the trend from the multi-attribute transformation for predicting both high and low-frequency components of logs and hence accurately predicting the numerical values of the target log. As compared to multi-attribute transformation, the correlation coefficient has now increased from 72% to 88% with average statistical error further decreased from 5% to 3%, as shown in Figure 14B. This is an accurately determined neural network relationship with maximum correlation between target log and seismic data upon which we can rely. This neural network relationship was applied to the seismic data to predict target log(effective porosity) values away from the well control with high confidence as shown in Figure 15 (effective porosity: ∼7–18%).
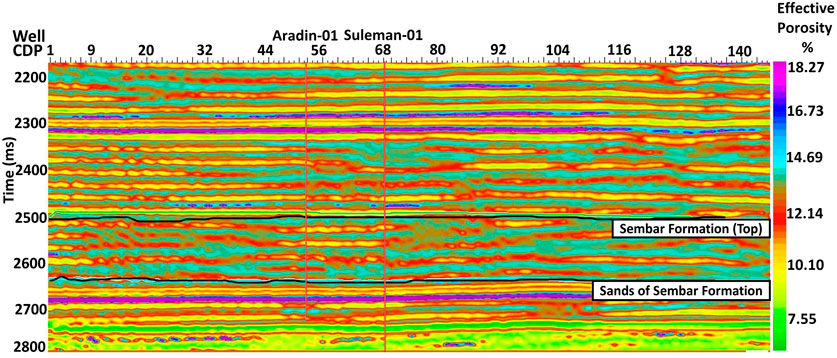
Figure 15. Seismic inverted effective porosity section via application of FNN derived PNN.
In the absence of core plugs/well cuttings data, reservoir properties estimation using petrophysical analysis is the key to calibrating the ANN lead seismic reservoir characterization (Leiphart and Hart, 2001). Well logs and seismic data were analyzed to model the hydrocarbon reservoir potential of sandstone of the Sembar Formation both vertically and horizontally. Petrophysical modelling in the study wells has shown up to a maximum of ∼200 m continuous thick packages of gas sandstone. The overall reservoir quality is good for the study area which reveals the sandstone of the Sembar Formation as a highly prospective gas-bearing formation in the study area (Figure 4; Table 1). Vp/Vs ratio is a very effective elastic attribute in separating different lithofacies and for the demarcation of hydrocarbon pay zones and non-pay zones (Hughes et al., 2008). The cross-plot between Vp/Vs ratio and P-impedance, color-coded with petrophysical properties not only predicts lithology but also predicts the nature and saturation of fluid in the reservoir rock (Avseth and Odegaard, 2004; Avseth and Bachrac, 2005). Rock physics analysis effectively separated productive gas sands from non-productive sands in the study area (shale, shaly sand, clean sands, gas sands, and water-bearing sediments) (Figures 5A–C). There is excessive variability in composition, texture, and porosity in sand grains because of the effect of diagenesis. This resulted in the incorporation of mixed impedance layers (overlapping ranges of high and low impedance among different facies) in the Sembar sandstone mainly because of the presence of gas and clays filled in the pore spaces (Figure 7).
Low frequencies are typically not part of processed seismic data. Such bandlimited data alone is not satisfactory to model many elements of subsurface geology and make accurate predictions of reservoir properties (Yilmaz, 2001; Torres-Verdín and Sen, 2004; Prskalo, 2005; Karbalaali et al., 2013; Nawaz, 2013; Karim et al., 2016). Integrating many sets of data, such as those collected from wells and seismic stations, is one way to increase accuracy (Robinson and Silvia, 1978; Hampson et al., 2001; Swisi, 2009). Seismic inversion acts as a bridge in modern reservoir characterization which combines these two types of data (Azeem et al., 2017; Sams and Carter, 2017). Today, a variety of post-stack seismic inversion methods are used, and their selection relies on the available data set and the problem that is currently being considered (Russell and Hampson, 1991; Delépine et al., 2009). To avoid a pseudo-inverted model, MBI workflow incorporates a built-in low-frequency model for more accurate absolute acoustic impedance model generation (Lindseth, 1979). Higher resolution modelling and better handling of noise and multiples give MBI an edge over SSI. This motivates the choice of MBI for this study. Post-stack MBI operates at zero offset assumption with final output as acoustic impedance (Zp) seismic volume (Eidsvik et al., 2004). The ultimate objective of MBI is to provide an interface to NNs to extract reservoir properties from the entire seismic volume using Zp as an external attribute through developing a statistical relationship between petrophysical and elastic properties (Doyen et al., 1989). Therefore, P-impedance is extracted as an external seismic attribute from MBI to utilize in the PNN workflow.
Seismic attributes act as a bridge between seismic images and well-log data in successfully predicting the reservoir properties (Russell et al., 1997). Linear transformation and regression methods can be utilized for the prediction of reservoir properties with risks of higher uncertainties in the output model. Since there is no direct correlation between reservoir properties and seismic amplitude data, it is necessary to make many underlying assumptions in these linear transformations that are suspect (Leiphart and Hart, 2001). The capacity to establish nonlinear correlations between seismic data and petrophysical logs is the primary benefit of ANN over other seismic reservoir characterization approaches (Hampson et al., 2001; Leiphart and Hart, 2001; Miguez et al., 2010; Durrani et al., 2020; Durrani et al., 2021). Therefore, it is a new approach to use ANN for forecasting reservoir properties.
To get around the problems with traditional reservoir characterization techniques an integrated approach is adopted in this study to link MBI with FNN-like PNN to quantitatively characterize the reservoir properties of thick packages of sandstone encountered in deeper levels of the Cretaceous Sembar Formation. This integrated approach includes seismic multi-attribute transformation and FNN-derived PNN modelling to seismic and well log data for the prediction of reservoir properties (like effective porosity), away from well control. The suggested approach predicts reservoir properties concisely and efficiently. This methodology may be regarded as an extension of traditional seismic inversion methods. The PNN is trained to derive the best non-linear mathematical relationship that provides the highest correlation and minimum error between the seismic attributes and target log(effective porosity log). The effective porosity predicted by PNN on seismic data at well locations at the level of sandstone of the Sembar Formation is in a range of 7%–18% (Figure 15). This is consistent with the computed range of effective porosity as proposed by petrophysical analysis. This agreement calibrates and confirms the validity of ANN constructed model for reservoir property prediction. This accurate prediction of reservoir properties is extremely important for future field development and production of the Khewari block. The findings of this study have implications that extend beyond the scope of the current investigation. The methodology employed in this study could be applied regionally to assess the untapped hydrocarbon potential of sandstones of the Sembar Formation because of formation’s extension toward the Zagros Fold-and-Thrust Belt in Iran in the western part of the study area and toward the Rajasthan Basin in India in the eastern part (Aftab et al., 2022). This approach would also help assess the undeveloped hydrocarbon potential of reservoir sandstones of similar formations in South Asia and worldwide.
The following conclusions are drawn from this study:
• Reservoir properties estimation through petrophysical analysis has modeled considerably thick (∼200 m) gas-bearing sandstone in study wells. Rock physics analysis is employed which successfully separated productive payable gas sands from non-productive sands of the Sembar Formation.
• P-impedance is extracted as an external seismic attribute from MBI. To get around the problems with traditional reservoir characterization techniques, we applied an integrated seismic multi-attribute transformation and FNN-derived PNN modeling to seismic and well log data to extract reservoir properties like effective porosity, away from well control. We sequentially extracted five seismic attributes (inverted p-impedance, average frequency, time, amplitude weighted frequency, and filters) through forward stepwise regression to predict effective porosity values.
• The PNN provides the highest correlation and minimum error between the target log and seismic attributes. This inter-well prediction of reservoir properties is extremely important for field development and production of any hydrocarbon field. This integrated approach predicted the reservoir property model which is geologically more realistic, and pragmatic compared with linear regression approaches.
• The projected effective porosity demonstrates an excellent fit to the actual log-derived effective porosity at well locations which cross-validates the accuracy of the PNN-derived reservoir property. ANN predicted the effective porosity via bridging target logs and seismic data within a short computation time. These results suggest that FNN-derived PNNs, when used appropriately, have the potential to provide a method for enhanced resolution and prediction of subsurface reservoir properties that may be used to redesign, reassess, and reevaluate already built reservoir and hydrocarbon reserves models. The methodology adopted in this study is also valid and equally applicable to similar sandstone reservoirs across the globe.
The original contributions presented in the study are included in the article/supplementary material, further inquiries can be directed to the corresponding author.
FA: Conceptualization, Data curation, Formal Analysis, Funding acquisition, Investigation, Methodology, Software, Validation, Visualization, Writing–original draft. MZ: Project administration, Resources, Supervision, Validation, Writing–review and editing. MH: Resources, Supervision, Validation, Writing–review and editing. JS: Funding acquisition, Project administration, Resources, Supervision, Validation, Writing–review and editing.
The author(s) declare that financial support was received for the research, authorship, and/or publication of this article. The Directorate General of Petroleum Concession granted well logs and seismic data for research. For data interpretation and analysis, LMKR and GeoSoftware LLC provided free software licenses to Bahria University under their University Grant Programs. LMKR also provided a free software license to Harvard University under its University Grant Program. APC was funded by the University of Vienna, Vienna, Austria.
The authors would like to thank the DGPC Pakistan for allowing the use of well logs and seismic data for research and publication purposes. We are extremely grateful to LMKR Pakistan and GeoSoftware LLC for providing the academic licenses of GVERSE GeoGraphix and Hampson Russell suite software to Bahria University, respectively. Furqan Aftab would like to thank the HEC Pakistan for the award of an IRSIP scholarship to conduct research in the United States. Special thanks to the Department of Earth and Planetary Sciences, Harvard University, United States, and the Department of Earth and Climate Sciences, Tufts University, United States for providing the office space, technical assistance, and lab facility. Special thanks to Prof. Dr. Grant Garven from Tufts University, United States, for technical input and meticulous review that improved this manuscript. Thanks to the Federal Ministry of Education, Science and Research (BMBWF) and OeAD-GmbH–Austria´s Agency for Education and Internationalisation, Mobility Programmes and Cooperation for the award of Ernst Mach Grant, to perform research in the Department of Geology, University of Vienna, Austria. The authors are also thankful to the editor and reviewers for their suggestions to improve this manuscript.
The authors declare that the research was conducted in the absence of any commercial or financial relationships that could be construed as a potential conflict of interest.
The author(s) declare that no Generative AI was used in the creation of this manuscript.
All claims expressed in this article are solely those of the authors and do not necessarily represent those of their affiliated organizations, or those of the publisher, the editors and the reviewers. Any product that may be evaluated in this article, or claim that may be made by its manufacturer, is not guaranteed or endorsed by the publisher.
Abid, M., Niu, L., Ma, J., and Geng, J. (2021). Unconventional reservoir characterization and sensitive attributes determination: a case study of the Eastern Sembar Formation, Lower Indus Basin, Pakistan. Geophysics 86 (1), B1–B14. doi:10.1190/geo2018-0761.1
Aftab, F., Zafar, M., Hajana, M. I., and Ahmad, W. (2022). A novel gas sands characterization and improved depositional modeling of the Cretaceous Sembar Formation, Lower Indus Basin, Pakistan. Front. Earth Sci. 10. doi:10.3389/feart.2022.1039605
Ahmad, S., Ahmad, F., Ullah, A., Eisa, M., Ullah, F., Kaif, K., et al. (2019). Integration of the outcrop and subsurface geochemical data: implications for the hydrocarbon source rock evaluation in the Lower Indus Basin, Pakistan. J. Petroleum Explor. Prod. Technol. 9 (2), 937–951. doi:10.1007/s13202-018-0569-6
Ali, A., Alves, T. M., and Amin, Y. (2022). Integrated geophysical analysis of the Sembar Formation, central Indus Basin, as an unconventional resource. J. Nat. Gas Sci. Eng. 101, 104507. doi:10.1016/j.jngse.2022.104507
Ali, A., Alves, T. M., Saad, F. A., Ullah, M., Toqeer, M., and Hussain, M. (2018). Resource potential of gas reservoirs in South Pakistan and adjacent Indian subcontinent revealed by post-stack inversion techniques. J. Nat. Gas Sci. Eng. 49, 41–55. doi:10.1016/j.jngse.2017.10.010
Avseth, P., and Bachrac, R. (2005). “Seismic properties of unconsolidated sands: tangential stiffness, Vp/Vs ratios and diagenesis,” in 2005 SEG annual meeting (Houston: OnePetro). doi:10.1190/1.2147968
Avseth, P., and Odegaard, E. (2004). Well log and seismic data analysis using rock physics templates. First break 22 (10). doi:10.3997/1365-2397.2004017
Avseth, P. A. (2000). Combining rock physics and sedimentology for seismic reservoir characterization of North Sea turbidite systems. Stanford University.
Azeem, T., Chun, W. Y., Khalid, P., Qing, L. X., Ehsan, M. I., Munawar, M. J., et al. (2017). An integrated petrophysical and rock physics analysis to improve reservoir characterization of Cretaceous sand intervals in Middle Indus Basin, Pakistan. J. Geophys. Eng. 14 (2), 212–225. doi:10.1088/1742-2140/14/2/212
Barclay, F., Bruun, A., Rasmussen, K. B., Alfaro, J. C., Cooke, A., and Cooke, D. (2008). Seismic inversion: reading between the lines. Oilfield Rev. 20 (1), 42–63.
Bender, F., Raza, H., and Bannert, D. (1995). Geology of Pakistan: gebruder borntraeger. Berlin. Stuttgart.
Castagna, J., Batzle, M., Kan, T., and Backus, M. (1993) Rock physics—the link between rock properties and AVO response, 8. Offset-dependent reflectivity—Theory and practice of AVO analysis: SEG, 135–171. doi:10.1190/1.9781560802624
Chen, F., and Zong, Z. (2022). PP-wave reflection coefficient in stress-induced anisotropic media and amplitude variation with incident angle and azimuth inversion. Geophysics 87 (6), C155–C172. doi:10.1190/geo2021-0706.1
Chen, F., Zong, Z., Lang, K., Li, J., Yin, X., Miao, Z., et al. (2024a). Geofluid discrimination in stress-induced anisotropic porous reservoirs using seismic AVAZ inversion. IEEE Trans. Geoscience Remote Sens. 62, 1–14. doi:10.1109/TGRS.2024.3477943
Chen, F., Zong, Z., and Yin, X. (2024b). Seismic scattering inversion for multiple parameters of overburden-stressed isotropic media. Geophysics 89 (6), T319–T336. doi:10.1190/geo2023-0636.1
Cooke, D., and Cant, J. (2010). Model-based seismic inversion: comparing deterministic and probabilistic approaches. CSEG Rec. 35 (4), 29–39.
Cooke, D., and Schneider, W. (1983). Generalized linear inversion of reflection seismic data. Geophysics 48, 665–676. doi:10.1190/1.1441497
Delépine, N., Clochard, V., Labat, K., Ricarte, P., and Le Bras, C. (2009). “Stratigraphic inversion for CO2 monitoring purposes–A case study for the saline aquifer of sleipner field,” in 71st EAGE conference and exhibition incorporating SPE EUROPEC 2009 (Amsterdam, Netherlands: European Association of Geoscientists and Engineers), 127–00249.
Della’versana, P. (2019). Comparison of different Machine Learning algorithms for lithofacies classification from well logs. Boll. Geofis. Teor. Appl. 60 (1). doi:10.4430/bgta0256
Ding, Y., Cui, M., Zhao, F., Shi, X., Huang, K., and Yasin, Q. (2022). A novel neural network for seismic anisotropy and fracture porosity measurements in carbonate reservoirs. Arabian J. Sci. Eng. 47 (6), 7219–7241. doi:10.1007/s13369-021-05970-4
Dorrington, K. P., and Link, C. A. (2004). Genetic algorithm/neural-network approach to seismic attribute selection for well-log prediction. Geophysics 69 (1), 212–221. doi:10.1190/1.1649389
Doyen, P. M., De Buyl, M., and Guidish, T. (1989). Porosity from seismic data, a geostatistical approach. Explor. Geophys. 20 (2), 245. doi:10.1071/eg989245a
Du, Q., Yasin, Q., Ismail, A., and Sohail, G. M. (2019). Combining classification and regression for improving shear wave velocity estimation from well logs data. J. Petroleum Sci. Eng. 182, 106260. doi:10.1016/j.petrol.2019.106260
Durrani, M. Z., Talib, M., Ali, A., Sarosh, B., and Rahman, S. A. (2021). Characterization of carbonate reservoir using post-stack global geostatistical acoustic inversion approach: a case study from a mature gas field, onshore Pakistan. J. Appl. Geophys. 188, 104313. doi:10.1016/j.jappgeo.2021.104313
Durrani, M. Z. A., Talib, M., Ali, A., Sarosh, B., and Naseem, N. (2020). Characterization and probabilistic estimation of tight carbonate reservoir properties using quantitative geophysical approach: a case study from a mature gas field in the Middle Indus Basin of Pakistan. J. Petroleum Explor. Prod. Technol. 10 (7), 2785–2804. doi:10.1007/s13202-020-00942-0
Eidsvik, J., Avseth, P., Omre, H., Mukerji, T., and Mavko, G. (2004). Stochastic reservoir characterization using prestack seismic data. Geophysics 69 (4), 978–993. doi:10.1190/1.1778241
Gansser, A. (1979). Reconnaissance visit to the ophiolites in baluchistan and the himalaya. Geodyn. Pak., 193–213.
Gharaee Shahri, S. A. (2013). “Application of extended elastic impedance (EEI) to improve reservoir characterization,” in Institutt for petroleumsteknologi og anvendt geofysikk.
Ginting, V., Pereira, F., Presho, M., and Wo, S. (2011). Application of the two-stage Markov chain Monte Carlo method for characterization of fractured reservoirs using a surrogate flow model. Comput. Geosci. 15 (4), 691–707. doi:10.1007/s10596-011-9236-4
Hampson, D. P., Russell, B. H., and Bankhead, B. (2005). “Simultaneous inversion of pre-stack seismic data,” in SEG technical Program expanded abstracts 2005 (Society of Exploration Geophysicists), 1633–1637. doi:10.1190/1.2148008
Hampson, D. P., Schuelke, J. S., and Quirein, J. A. (2001). Use of multiattribute transforms to predict log properties from seismic data. Geophysics 66 (1), 220–236. doi:10.1190/1.1444899
Herrera, V. M., Russell, B., and Flores, A. (2006). Neural networks in reservoir characterization. Lead. Edge 25 (4), 402–411. doi:10.1190/1.2193208
Hosseini, M., Riahi, M., and Mohebian, R. (2019). A Meta attribute for reservoir permeability classification using well logs and 3D seismic data with probabilistic neural network. Boll. Geofis. Teor. Appl. 60 (1). doi:10.4430/bgta0257
Hughes, P., Eykenhof, V., and Mesdag, P. (2008). Estimation of Hydrocarbons in-place by simultaneous (AVO) inversion, constrained by iteratively derived low frequency models. Fugro-Jason AS, PO Box. 8034, 4068.
Karbalaali, H., Shadizadeh, S. R., and Riahi, M. A. (2013). Delineating hydrocarbon bearing zones using elastic impedance inversion: a Persian Gulf example. Iran. J. Oil Gas Sci. Technol. 2(2), 8–19. doi:10.22050/ijogst.2013.3534
Karim, S. U., Islam, M. S., Hossain, M. M., and Islam, M. A. (2016). Seismic reservoir characterization using model based post-stack seismic inversion: in case of Fenchuganj Gas Field, Bangladesh. J. Jpn. Petroleum Inst. 59 (6), 283–292. doi:10.1627/jpi.59.283
Kazmi, A. H., and Jan, M. Q. (1997). Geology and tectonics of Pakistan. Karachi, Pakistan: Graphic publishers.
Kazmi, A. H., and Rana, R. A. (1982). Tectonic map of Pakistan 1: 2 000 000: map showing structural features and tectonic stages in Pakistan. of Pakistan: Geological survey.
Lee, G. H., Bo, Y. Y., Yoo, D. G., Ryu, B. J., and Kim, H. J. (2013). Estimation of the gas-hydrate resource volume in a small area of the Ulleung Basin, East Sea using seismic inversion and multi-attribute transform techniques. Mar. petroleum Geol. 47, 291–302. doi:10.1016/j.marpetgeo.2013.04.001
Leiphart, D. J., and Hart, B. S. (2001). Comparison of linear regression and a probabilistic neural network to predict porosity from 3-D seismic attributes in Lower Brushy Canyon channeled sandstones, southeast New Mexico. Geophysics. 66(5), 1349–1358. doi:10.1190/1.1487080
Lindseth, R. O. (1979). Synthetic sonic logs—a process for stratigraphic interpretation. Geophysics 44 (1), 3–26. doi:10.1190/1.1440922
Mavko, G., Mukerji, T., and Dvorkin, J. (2020). The rock physics handbook. Cambridge University Press.
Miguez, R., Georgiopoulos, M., and Kaylani, A. (2010). G-PNN: a genetically engineered probabilistic neural network. Nonlinear Analysis Theory, Methods and Appl. 73 (6), 1783–1791. doi:10.1016/j.na.2010.04.080
Milan, G., and Rodgers, M. (1993). “Stratigraphic evolution and play possibilities in the Middle Indus area, Pakistan,” in SPE Pakistan seminar, islamabad.
Mukerji, T., Mavko, G., and Gomez, C. (2009). Cross-property rock physics relations for estimating low-frequency seismic impedance trends from electromagnetic resistivity data. Lead. Edge 28 (1), 94–97. doi:10.1190/1.3064153
Naseer, M. T. (2021). Delineating the shallow-marine stratigraphic traps of Lower-Cretaceous incised valley sedimentation, Pakistan using post-stack seismic colour inversion. Geol. J. 56 (6), 3322–3341. doi:10.1002/gj.4110
Nawaz, U. S. (2013). “Acoustic and elastic impedance models of gullfaks field by post-stack seismic inversion,” in Institutt for petroleumsteknologi og anvendt geofysikk.
Othman, A., Fathy, M., and Mohamed, I. A. (2021). Application of artificial neural network in seismic reservoir characterization: a case study from offshore nile delta. Earth Sci. Inf. 14 (2), 669–676. doi:10.1007/s12145-021-00573-x
Pedersen-Tatalovic, R., Uldall, A., Jacobsen, N. L., Hansen, T. M., and Mosegaard, K. (2008). Event-based low-frequency impedance modelling using well logs and seismic attributes. Lead. Edge 27 (5), 592–603. doi:10.1190/1.2919576
Prskalo, S. (2005). Application of relations between seismic amplitude, velocity and lithology in geological interpretation of seismic data. J. Hung. Geomathematics. 2, 51–68.
Qiang, Z., Yasin, Q., Golsanami, N., and Du, Q. (2020). Prediction of reservoir quality from log-core and seismic inversion analysis with an artificial neural network: a case study from the Sawan Gas Field, Pakistan. Energies 13 (2), 486. doi:10.3390/en13020486
Quadri, V.-u.-N., and Shuaib, S. (1986). Hydrocarbon prospects of southern Indus basin, Pakistan. AAPG Bull. 70 (6), 730–747. doi:10.1306/94886344-1704-11D7-8645000102C1865D
Robinson, E. A., and Silvia, M. T. (1978). Digital signal processing and time series analysis. Holden: University of California.
Rüger, A. (2002). Reflection coefficients and azimuthal AVO analysis in anisotropic media. United States: Society of Exploration Geophysicists.
Russell, B., and Hampson, D. (1991). “Comparison of poststack seismic inversion methods,” in SEG technical Program expanded abstracts 1991 (Society of Exploration Geophysicists), 876–878. doi:10.1190/1.1888870
Russell, B., Hampson, D., Schuelke, J., and Quirein, J. (1997). Multiattribute seismic analysis. Lead. edge 16 (10), 1439–1444. doi:10.1190/1.1437486
Russell, B. H. (2014). Prestack seismic amplitude analysis: an integrated overview. Interpretation 2 (2), SC19–SC36. doi:10.1190/int-2013-0122.1
Sams, M., and Carter, D. (2017). Stuck between a rock and a reflection: a tutorial on low-frequency models for seismic inversion. Interpretation 5 (2), B17–B27. doi:10.1190/INT-2016-0150.1
Shakir, U., Ali, A., Hussain, M., Azeem, T., and Bashir, L. (2022). Selection of sensitive post-stack and pre-stack seismic inversion attributes for improved characterization of thin gas-bearing sands. Pure Appl. Geophys. 179 (1), 169–196. doi:10.1007/s00024-021-02900-1
Sheikh, N., and Giao, P. H. (2017). Evaluation of shale gas potential in the lower cretaceous Sembar Formation, the southern Indus Basin, Pakistan. J. Nat. Gas. Sci. Eng. 44, 162–176. doi:10.1016/j.jngse.2017.04.014
Swisi, A. A. (2009). Post-and Pre-stack attribute analysis and inversion of Blackfoot 3D seismic dataset. Canada: University of Saskatchewan.
Torres-Verdín, C., and Sen, M. K. (2004). Integrated approach for the petrophysical interpretation of post-and pre-stack 3-D seismic data, well-log data, core data, geological data, geological information and reservoir production data via Bayesian stochastic inversion. Tulsa, OK (United States): National Energy Technology Laboratory NETL.
Wandrey, C. J., Law, B., and Shah, H. A. (2004). Sembar Goru/Ghazij composite total petroleum system, Indus and Sulaiman-Kirthar geologic provinces, Pakistan and India. Reston, VA, USA: US Department of the Interior, US Geological Survey.
Yasin, Q., Du, Q., Ismail, A., and Ding, Y. (2018). “Identification and characterization of natural fractures in gas shale reservoir using conventional and specialized logging tools,” in SEG international exposition and annual meeting. OnePetro. doi:10.1190/segam2018-2997626.1
Yilmaz, Ö. (2001). Seismic data analysis: processing, inversion, and interpretation of seismic data. Society of exploration geophysicists.
Yousaf, H. (2020). Depositional settings of cretaceous rocks in central Indus Basin of Pakistan - a review. Geoconvention.
Zaigham, N. A., and Mallick, K. A. (2000). Prospect of hydrocarbon associated with fossil-rift structures of the southern Indus basin, Pakistan. AAPG Bull. 84 (11), 1833–1848. doi:10.1306/8626C3A7-173B-11D7-8645000102C1865D
Keywords: artificial neural network, feedforward neural network, probabilistic neural network, multi-attribute transformation, volume-based seismic attributes, Sembar Formation, sandstones
Citation: Aftab F, Zafar M, Hajana MI and Shaw JH (2025) Correlation of artificial neural network and multi-attribute transformation: a test case to predict the effective porosity of Cretaceous sandstones of the Sembar Formation, southeast Pakistan. Front. Earth Sci. 12:1516420. doi: 10.3389/feart.2024.1516420
Received: 24 October 2024; Accepted: 18 December 2024;
Published: 05 February 2025.
Edited by:
Ebrahim Fathi, West Virginia University, United StatesReviewed by:
Zhaoyun Zong, China University of Petroleum (East China), ChinaCopyright © 2025 Aftab, Zafar, Hajana and Shaw. This is an open-access article distributed under the terms of the Creative Commons Attribution License (CC BY). The use, distribution or reproduction in other forums is permitted, provided the original author(s) and the copyright owner(s) are credited and that the original publication in this journal is cited, in accordance with accepted academic practice. No use, distribution or reproduction is permitted which does not comply with these terms.
*Correspondence: Furqan Aftab, ZnVycWFuOTAwQHlhaG9vLmNvbQ==, ZnVycWFuYTkxQHVuaXZpZS5hYy5hdA==
Disclaimer: All claims expressed in this article are solely those of the authors and do not necessarily represent those of their affiliated organizations, or those of the publisher, the editors and the reviewers. Any product that may be evaluated in this article or claim that may be made by its manufacturer is not guaranteed or endorsed by the publisher.
Research integrity at Frontiers
Learn more about the work of our research integrity team to safeguard the quality of each article we publish.