 Guozhu Rao
 Yunzhang Rao3,4*
 Jiyong Zhang
- 1School of Emergency Management and Safety Engineering, Jiangxi University of Science and Technology, Ganzhou, China
- 2Jiangxi Province Key Laboratory of Safe and Efficient Mining of Rare Metal Resources, Jiangxi University of Science and Technology, Ganzhou, China
- 3School of Resources and Environmental Engineering, Jiangxi University of Science and Technology, Ganzhou, China
- 4Jiangxi Provincial Key Laboratory of Low-Carbon Processing and Utilization of Strategic Metal Mineral Resources, Jiangxi University of Science and Technology, Ganzhou, China
The occurrence of class-imbalanced datasets is a frequent observation in natural science research, emphasizing the paramount importance of effectively harnessing them to construct highly accurate models for rockburst prediction. Initially, genuine rockburst incidents within a burial depth of 500 m were sourced from literature, revealing a small dataset imbalance issue. Utilizing various mainstream oversampling techniques, the dataset was expanded to generate six new datasets, subsequently subjected to 12 classifiers across 84 classification processes. The model incorporating the highest-scoring model from the original dataset and the top two models from the expanded dataset, yielded a high-performance model. Findings indicate that the KMeansSMOTE oversampling technique exhibits the most substantial enhancement across the combined 12 classifiers, whereas individual classifiers favor ET+SVMSMOTE and RF+SMOTENC. Following multiple rounds of hyper parameter adjustment via random cross-validation, the ET+SVMSMOTE combination attained the highest accuracy rate of 93.75%, surpassing mainstream models for rockburst prediction. Moreover, the SVMSMOTE technique, augmenting samples with fewer categories, demonstrated notable benefits in mitigating overfitting, enhancing generalization, and improving Recall and F1 score within RF classifiers. Validated for its high generalization performance, accuracy, and reliability. This process also provides an efficient framework for model development.
1 Introduction
As humanity explores the natural world, encountering geological hazards (Ma and Mei, 2021) like earthquakes (Kanamori and Brodsky, 2004), volcanic eruptions (Milford et al., 2023), and extreme weather is common (Newman and Noy, 2023). Despite their destructive potential, advancements in artificial intelligence enable their prediction (Varsha et al., 2024; Abid et al., 2021). Rockburst, a significant hazard in underground engineering, stem from factors such as excavation-induced stress and rock properties like elasticity and brittleness (Zhou et al., 2018). Extensive literature review and field research reveal (Dong et al., 2016) that rockburst occur not only in deep but also shallow underground projects, underscoring the need for accurate prediction to safeguard lives, health, and sustainable development. Furthermore, in the era of big data, diverse datasets abound (Borgman, 2017), yet often exhibit uneven distributions, termed class imbalance (Longadge and Dongre, 2013). This phenomenon is prevalent in research, posing a challenge to data-driven modeling. Maximizing the utility of such datasets presents a key hurdle in academia’s pursuit of effective modeling. In the field of sample imbalance dataset research, it can be broadly categorized into three categories, one is the undersampling technique, the second is the oversampling technique, and the third is a mixture of the two techniques (Luo et al., 2023). Due to the small number of shallow rock burst data cases, in order to fully utilize the data used, so the general use of oversampling techniques. In the field of oversampling technology, the most researched is the SMOTE oversampling technology, from which a number of oversampling methods have been derived. This paper focuses on the impact of mainstream oversampling techniques on rock burst data sets in the study of oversampling techniques.
In recent years, the field of rockburst prediction had witnessed a surge in research leveraging machine learning algorithms (Yin et al., 2024a; Yin et al., 2024b; Yin et al., 2021; Yin et al., 2022; Yin et al., 2023; Rao et al., 2024). This trend was fueled by the increasing development of artificial intelligence. Moreover, amidst considerations regarding the class imbalance of rockburst case data, these studies underscore the growing interest in employing machine learning for rockburst engineering prediction. Liu Q. et al. (2023) used KMeansSMOTE oversampling method and SMOTE(Synthetic Minority Oversampling Technique, SMOTE) oversampling method to put into the machine learning field for detection found that ultimately 25% accuracy improvement can be realized. Sun et al. (2022) improved the model prediction accuracy up to 0.3636 based on algorithms such as KMeansSMOTE oversampling method, the stacking technical. Li et al. (2023) utilized the FS+t-SNE+GMM method for the reselection of feature labels, which ultimately achieved an accuracy of about 90% in the voting integration model.
According to the above literature review and the real stress situation, this study considers that the depth of burial of 500 m as the boundary with other types of rock bursts is scientific and reasonable. There are three reasons: First, the buried depth of 500 m within the horizontal stress and vertical stress gap is huge, the maximum horizontal principal stress and the minimum horizontal principal stress and vertical stress ratio can reach up to 7 and 5 (Feng et al., 2007); Second, the buried depth of 500 m within the rockburst occurrence mechanism is more or less the same, mainly in the hard rock tectonic stress damage is dominant; Third, it is conducive to the revelation of different buried depth caused by the occurrence of the rock burst law, facilitating further refinement prediction and improve the accuracy of the prediction model.
To enhance the efficiency of tackling complex rockburst problems, integrating novel technical modeling approaches is essential. There are few comparative analytical studies on oversampling techniques in mainstream rockburst prediction models. While oversampling techniques and integrated models have gained traction in various fields, their application in shallow rockburst prediction remains limited. Overall, this study mainly realizes the following innovations: (1) Analyzing and evaluating multiple mainstream oversampling techniques, and deriving the best-performing oversampling technique in unbalanced small rockburst datasets from the data quantity and quality levels. (2) Propose a model with high accuracy and generalization ability, which performs best compared with mainstream rockburst prediction models. (3) Distinguish between shallow and deep rockburst based on depth of burial, and for the first time model rockburst from this perspective, and the resulting model accuracy exceeds that of some mainstream full-depth rockburst case models. Based on the above issues, the framework study and model development in this study considered six oversampling techniques (SMOTE (Fernández et al., 2018); ADASYN (He et al., 2008); KMeansSMOTE (Douzas et al., 2018); SMOTENC (Fonseca and Bacao, 2023); BordenlineSMOTE (Han et al., 2005); SVMSMOTE (Wang et al., 2021),12 classifiers (Decision Tree, DT (Song and Ying, 2015); Extra Trees, ET (Geurts et al., 2006); Gradient Boosting, GBD (Natekin and Knoll, 2013); Gaussian Process Regression, GPR (Schulz et al., 2018); K-Nearest Neighbor, KNN (Peterson, 2009); Light Gradient Boosting Machine, LGB (Fan et al., 2019); Multilayer Perceptron, MLP (Tang et al., 2015); Naive Bayes model, NBM (Murphy, 2006); Quadratic Discriminant Analysis Algorithm, QDA (Kim et al., 2011); Random Forest, RF (Biau and Scornet, 2016); Support Vector Classification, SVC (Hsu et al., 2003); EXtreme Gradient Boosting, XGB (Chen et al., 2015)). Eighty-four algorithm combinations were systematically evaluated, leading to the selection of the top-performing two. Stochastic cross-validation (Xu et al., 2018) optimized hyper parameter to enhance model performance. The RF+SMOTENC hybrid model emerged as the best, showcasing excellent predictive metrics (Accuracy = 0.9375, Precision = 0.9531, Recall = 0.9375, F1 score = 0.9375) after comprehensive evaluation. Notably, ET+SVMSMOTE demonstrated notable generalization and reduced overfitting compared to other models.
2 Materials and methods
2.1 Construction of a representative shallow rockburst dataset
Accurate data collection is fundamental in machine learning algorithms. Besides diversity, data quality and representativeness are crucial considerations. Hence, constructing a high-quality dataset is paramount. This study manually collected and compiled diverse rock burst data from published sources, aiming to develop a highly accurate and reliable model. Various oversampling techniques were employed to enhance dataset quality.
To ensure dataset representativeness, various actual engineering rock burst cases were collected (Wang et al., 1998; Zhangjun et al., 2008; Afraei et al., 2019; Liu G. et al., 2023; Yu et al., 2013; Zhou et al., 2022; SUN, 2019; Feng and Wang, 1994; Mengguo et al., 2008; Xue-pei, 2005; Lai Feng, 2008; Zhang et al., 2011; Yu Xuezhen, 2009; Zhou et al., 2016), detailed in Supplementary Table S1. With a burial depth of 500 m as the delineation, the dataset comprised 69 rock burst cases, spanning hydroelectric power station construction, tunneling, and underground mining. Data collection mirrored the original approach (Yunzhang and Xuezhen, 2015). The input features included maximum tangential stress (
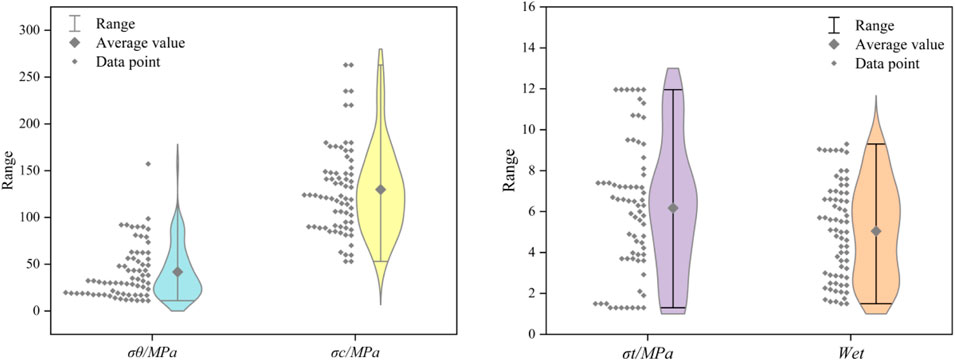
Figure 1. Rockburst data display violin diagram.
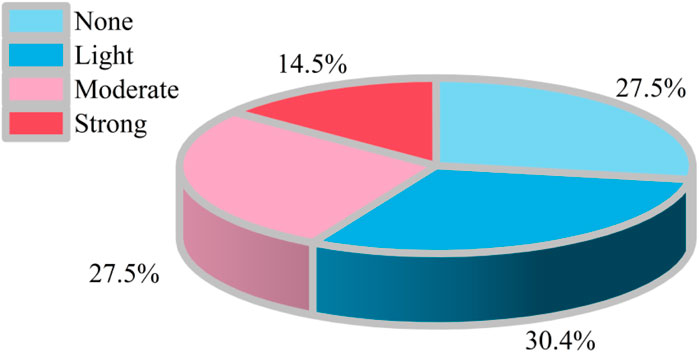
Figure 2. Percentage of the number of categories of rock burst datasets.
2.2 Overview of oversampling techniques
In real-world data scenarios, imbalances often arise where certain sample categories are underrepresented compared to others. This imbalance can cause some classifiers to favor results with more samples, thus exaggerating the accuracy of the model. But this may not accurately reflect reality. Correctly addressing sample imbalance is therefore crucial for improving model accuracy. Two main approaches are commonly employed: adjusting or integrating algorithmic models and reducing the sample number gap between classifications through sampling techniques.
The former approach involves analyzing the model and application cases comprehensively to make informed choices, albeit sometimes without satisfactory outcomes. The latter approach, favored by scholars for its simplicity and applicability at the dataset preprocessing stage, aims to bridge the sample number gap and enhance the realism of simulated data. Prior to this study, several popular oversampling techniques were outlined, providing the foundation for comparative analysis. See Supplementary Table S2 for details. These techniques provide diverse approaches to addressing sample imbalance and enhancing the realism and effectiveness of predictive models.
2.3 Overview of the classifiers
Suitable classifiers are the basis for building models with excellent performance. In this study, 12 mainstream classifiers were used. They are described in Supplementary Table S3.
2.4 Framework developed
The framework’s development process, depicted in Figure 3, entails several key steps.
(1) Initially, rockburst case data were collected from literature sources, revealing a deficiency in Strong class data.
(2) The significant impact of class imbalance on classifier performance prompted the exploration of six new datasets formed through various sampling techniques. Twelve machine learning algorithms were combined with hierarchical 5-fold cross-validation for evaluation. Notably, data normalization enhanced efficiency and reduced dimensionality interference.
(3) The best oversampling techniques and classifier combinations were identified based on evaluation scores, with comparison to top-performing classifiers in the original dataset. Key parameters of each classifier were identified through literature review. Data were randomly split into 8:2 ratios, and the three classifiers were optimized using 5-fold random cross-validation.
(4) Extensive performance comparisons were conducted, highlighting the contribution of oversampling techniques in addressing underclassification based on model learning outcomes.
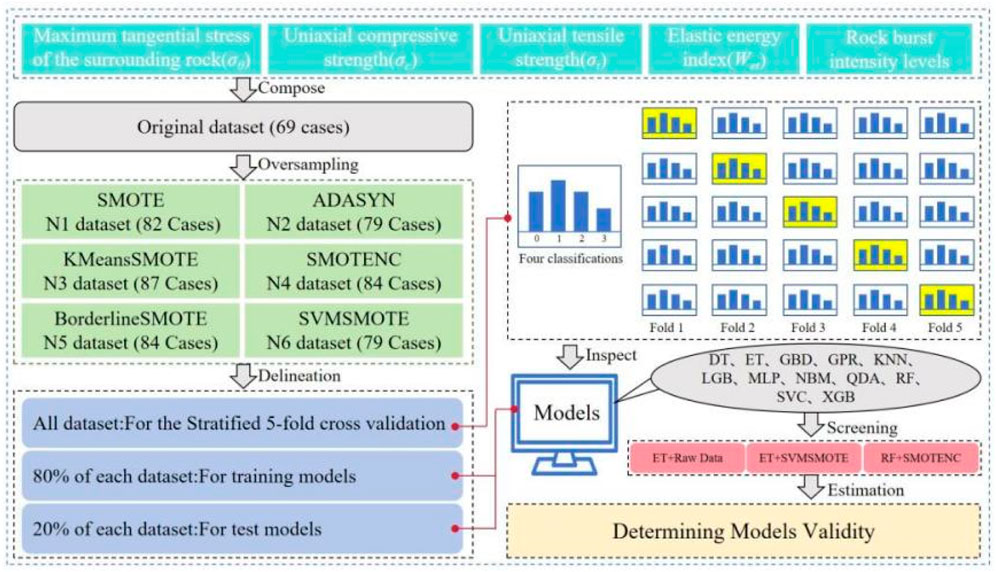
Figure 3. Framework flowchart.
2.5 Indicators for the evaluation of oversampling techniques
To accurately gauge the performance of the six oversampling techniques across specific datasets and models, it is essential to employ appropriate evaluation metrics. In this context, the cross-validation method emerges as a suitable choice. Given the class-imbalanced nature of the collected dataset, the stratified 5-fold cross-validation score method is selected for evaluation. This approach involves dividing the entire dataset into five equally-sized subsets, ensuring that each subset includes representative data from all classes in the same proportion as the entire dataset. Moreover, random sampling of the data further enhances the model’s generalization ability. Figure 4 illustrates the specific process involved in implementing this approach. This methodology facilitates robust assessment of oversampling technique performance while accounting for dataset characteristics, contributing to more reliable model evaluation in real-world scenarios.
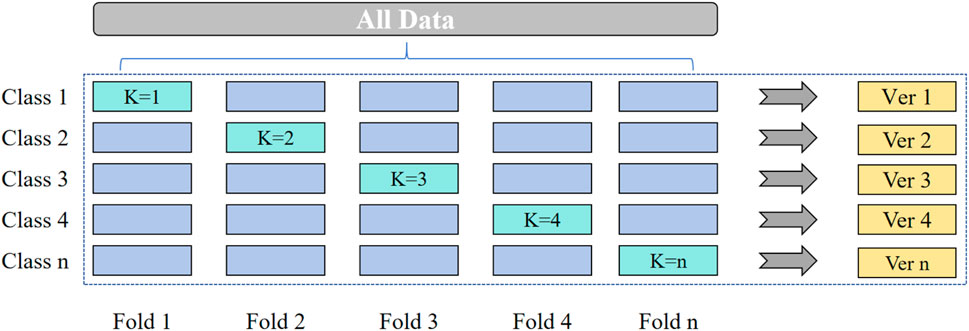
Figure 4. Layered cross-validation process.
2.6 Model evaluation indicators
Once the rockburst prediction model was established, selecting appropriate metrics becomes crucial for assessing its performance. In classification models, accuracy serves as a key indicator, reflecting the model’s overall error rate. During model training, errors manifest in two forms: training error within the training set and testing error within the test set. While higher accuracy was desirable, it was imperative to prevent overfitting during training, ensuring robust performance on unseen data.
However, generalization error, occurring during testing on unseen data, was inherently unpredictable. To evaluate the model’s generalization performance, additional metrics were essential. Precision and recall emerge as complementary metrics, focusing on the model’s ability to correctly identify true positive instances. Precision quantifies the proportion of true positives among all predicted positives, while recall measures the proportion of true positives among all actual positives. These metrics assume particular significance in rockburst damage scale prediction, where accurately identifying hazardous conditions was paramount.
The F1 score, a harmonized average of precision and recall, offers a balanced assessment, capturing the trade-off between these two metrics. This score provides a unified metric that accounts for the model’s capacity to accurately predict positive instances while minimizing false positives. Utilizing these metrics, as depicted in Figure 5, ensures a comprehensive evaluation of model performance in this study, facilitating more reliable and accurate predictions.

Figure 5. Calculation process.
3 Results and discussion
3.1 Comparative study of oversampling techniques
The dataset analysis reveals a class imbalance, particularly in the Strong class. To address this, the dataset was expanded using six sampling methods: SMOTE, ADASYN, KMeansSMOTE, SMOTENC, BordenlineSMOTE, and SVMSMOTE, resulting in seven datasets including the original. These datasets are labeled as N1 to N6, respectively, with the original dataset labeled as OD (Table 1). SMOTENC and BordenlineSMOTE emerged as effective techniques for achieving balanced class distributions at the sample level, ensuring consistency across all four classifications. KMeansSMOTE notably increased sample numbers the most, while ADASYN and SVMSMOTE exhibited the smallest increases.
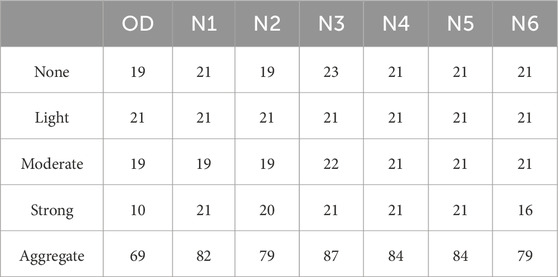
Table 1. Comparison of the number of sample increases.
In addition to quantitative comparisons, Principal Component Analysis (PCA) (Abdi and Williams, 2010) is utilized as a dimensionality reduction technique. PCA aims to map N-dimensional features to K-dimensions while retaining the original high-dimensional features. Figure 6 illustrates this process, with the blue ball representing the original data and the red ball depicting the synthesized data.
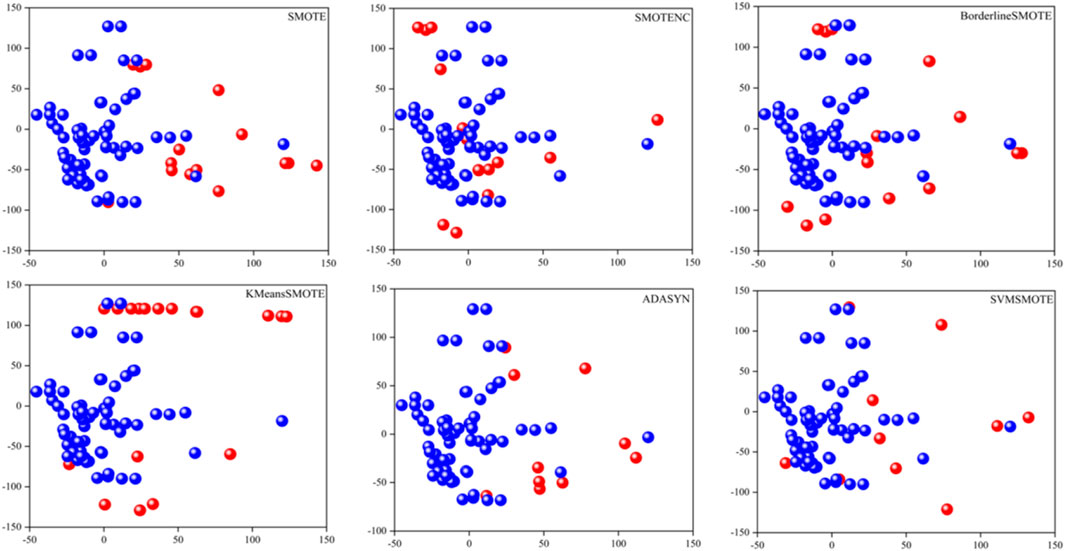
Figure 6. Two-dimensional map after PCA transformation.
Downsizing 5-dimensional data to two dimensions enables visualization of both the data distribution and the distribution of synthesized data.
To comprehensively assess oversampling techniques’ performance on seven datasets (OD, N1-N6), twelve machine learning algorithms (DT, ET, GBD, GPR, KNN, LGB, MLP, NBM, QDA, RF, SVC, XGB) were employed. The evaluation metric utilized was the 5-fold hierarchical cross-validation score, with default hyper parameter. Figure 7 presents the obtained data, revealing that among horizontal comparisons, the ET classifier + SVMSMOTE oversampling technique achieved the highest score, while the NBM classifier + original dataset attained the lowest, with a notable difference of 0.291. This underscores the significance of classifier selection. In longitudinal comparisons, varied sampling techniques exhibited distinct effects on classifiers. Notably, the GPR classifier displayed the highest discrepancy, with a potential difference of 0.1958 between selected sampling techniques.
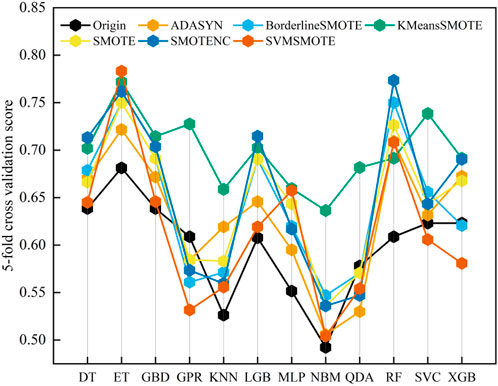
Figure 7. Scores of different sampling techniques in different models.
To elucidate the impact of oversampling techniques across multiple models, Figure 8 presents the average scores of each technique. Notably, KMeansSMOTE demonstrates the highest average improvement across models, with a notable enhancement of 0.0998. This underscores the efficacy of KMeansSMOTE across diverse model architectures. Conversely, SVMSMOTE exhibits the lowest average improvement at 0.0178. Nonetheless, it is evident that employing oversampling techniques generally enhances model performance across various scenarios.
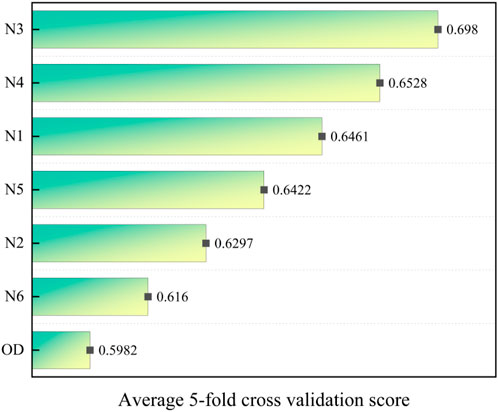
Figure 8. Average scores for different sampling techniques.
3.2 Models performance comparison
While various oversampling techniques were explored, the primary aim of the comparison study was to attain a highly accurate and reliable model. Consequently, the top-performing combinations—ET+SVMSMOTE and RF+SMOTENC—were selected for comparison. Additionally, the best-performing ET model from the original dataset was included for training and optimization.
Each dataset was randomly split in an 8:2 ratio, with 80% allocated to training and 20% to testing, ensuring models did not overfit (Zhang et al., 2024). Hyper parameter optimization was conducted using randomized 5-fold cross-validation, targeting key parameters—Estimators, Min samples split, Min samples leaf, Max features, Max depth, and Bootstrap. These parameters, being part of ensemble models built on decision trees, exhibited consistency across models. Subsequently, the training set was divided into five folds, with four utilized for model fitting and one for validation. Hyper parameter values were selected based on average accuracy across the five folds, as detailed in Table 2. These parameters were then used to evaluate overall classifier performance metrics—Accuracy, Precision, Recall, and F1 score—while other hyper parameter remained at default values.
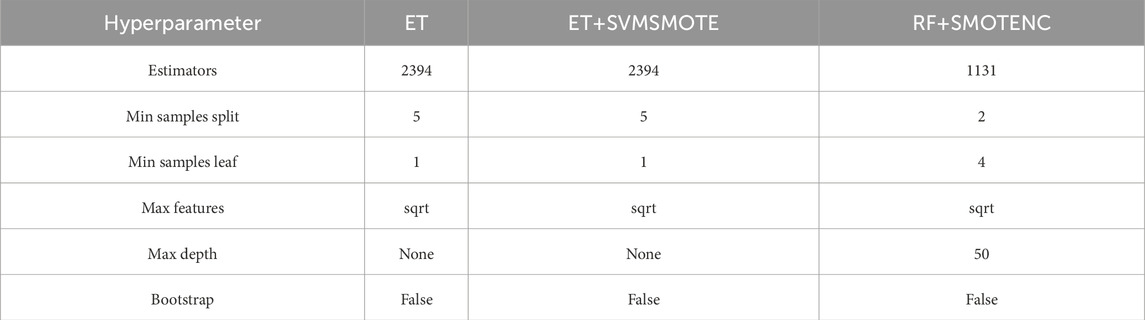
Table 2. Hyperparameter values.
The F1 score (Chicco and Jurman, 2020) is effective in incarnating the impact of class imbalance and serves as a key performance metric for classifiers. Comparison of the three classifiers with the test set prior to optimization, as depicted in Figure 9, reveals the significant impact of hyper parameter adjustments. Specifically, the combination of ET with the original dataset exhibits a notable improvement of 7.5 percentage points, while the pairing of ET with SVMSOTE demonstrates a substantial enhancement to 0.9375, compared to the original. Similarly, the combination of RF with SMOTENC notably improves by 18.4 percentage points. Notably, the ET with SVMSOTE combination attains the highest F1 score of 0.9375. Overall, hyper parameter tuning is crucial for achieving highly accurate modeling, underscoring its essential role in the process.
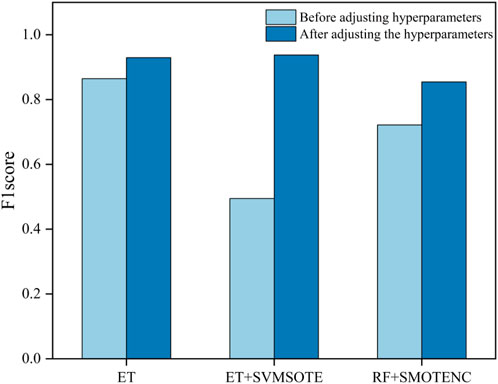
Figure 9. Comparison of classifiers before and after adjustment of parameters.
After hyper parameter adjustment, detailed evaluation of classifiers for overfitting or insufficient generalization ability is essential. The ideal model should exhibit high accuracy with minimal discrepancy between training and test sets. Figures 10, 11 provide visualizations for such assessments, with detailed data in Table 3. Overall, all three classifiers demonstrate sufficient accuracy post-hyper parameter tuning (Liu et al., 2024).
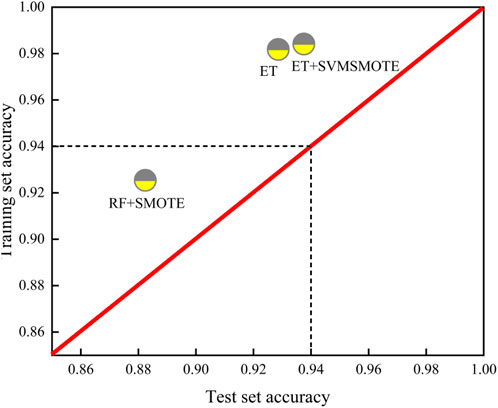
Figure 10. Analysis of model performance on training and test sets.
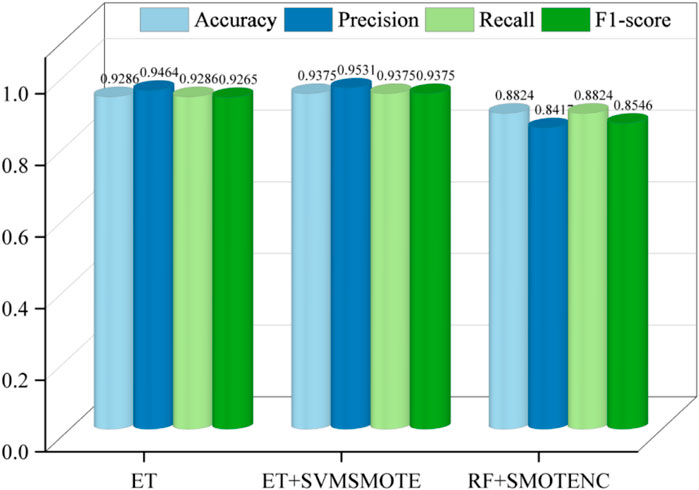
Figure 11. Test set performance.
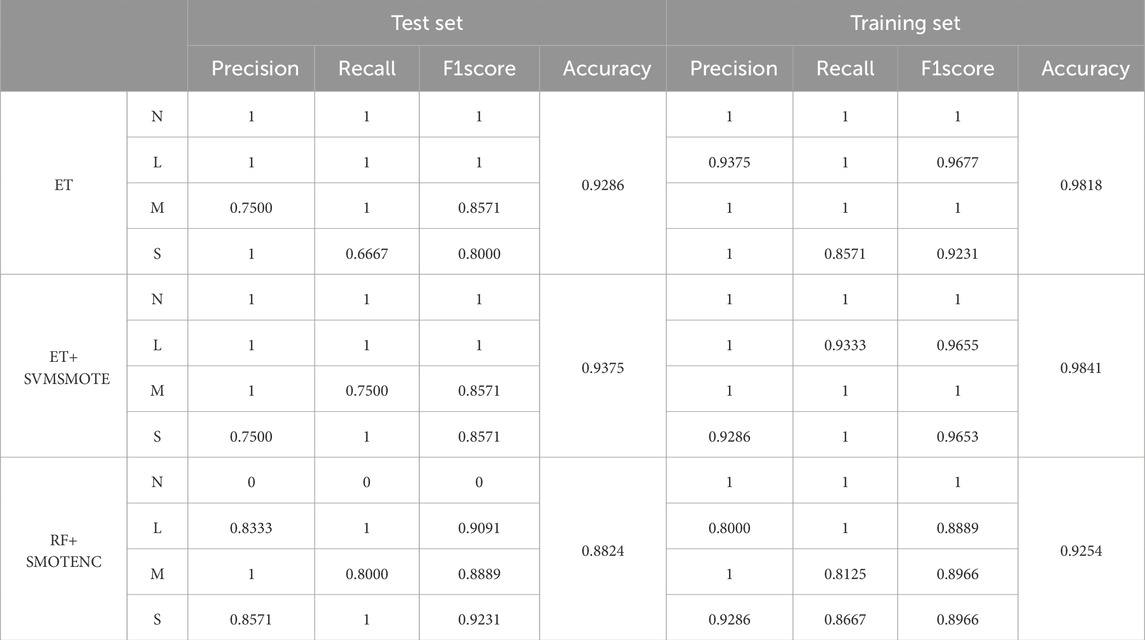
Table 3. Evaluation results.
From the two-dimensional visualization in Figure 10, the ET and SVMSMOTE combination surpasses others in terms of generalization ability and test set accuracy, underscoring its superior performance.
Generalization ability is one of the main evaluation indexes for assessing the applicability of models. Good generalization ability can fully reflect the model’s ability to predict new data sets, and can greatly avoid the model overfitting, underfitting and non-convergence and other problems. In order to intuitively assess and compare the generalization ability of different models, Figure 10 is plotted. In this study, three combinations of models are evaluated together for their generalization ability, with the X-axis as the accuracy of the test set and the Y-axis as the accuracy of the training set, and the graph of the generalization ability of the three models evaluated is shown in the figure. Ideally, the model should show high accuracy both on the training set and the test set, with a small gap between the two. In this study, with this visualization, it can be clearly observed that the ET+SVMSMOTE model exhibits good generalization ability, highlighting the superiority of the data enhancement strategy.
Further analysis in Figure 11 reveals that the ET and SVMSMOTE combination outperforms in Accuracy, Precision, Recall, and F1 score. Notably, Accuracy improves to 0.9375, Precision to 0.9537, Recall to 0.9375, and F1 score to 0.9375.
In-depth exploration through Table 3 elucidates the superior performance of the ET and SVMSMOTE combination. Analysis by category reveals that SVMSMOTE effectively balances the number of Strong categories, thereby enhancing model performance in this category. Specifically, in the test set evaluation metrics, Strong category Recall improves from 0.6667 to 1, and F1 score from 0.8 to 0.8751. In the validation set, Strong category Recall improves from 0.8571 to 1, and F1 score from 0.9231 to 0.9653. This highlights the efficacy of oversampling techniques in achieving balanced datasets and subsequently improving model performance.
3.3 Comparison with state-of-the-art studies
In contrast to prior studies, this research aims to develop an efficient modeling framework focusing on validating the resulting model’s performance. This model integrates the SVMSMOTE oversampling technique, Extra Trees integration method, and stochastic cross-validation of optimized hyper parameter to enhance reliability and accuracy in shallow rockburst prediction. Emphasis is placed not only on prediction accuracy but also on the oversampling technique’s significance in deeply analyzing various assessment indicators to ensure high reliability, accuracy, and generalization capabilities of the model. This contributes to safer, more reliable, and efficient underground engineering construction operations.
Furthermore, comparative analysis of different oversampling techniques across classifiers reveals their effectiveness in improving model performance by adjusting category numbers. Notably, KMeansSMOTE exhibits the most comprehensive improvement, increasing by 9.98 percentage points. However, at the individual model level, the ET+SVMSMOTE combination demonstrates the best performance, achieving a five-fold hierarchical cross-validation score as high as 0.7833. Additionally, this study conducts an in-depth analysis of the impact of SVMSMOTE oversampling on the ET classifier, validated through the analysis of category composition and evaluation metrics.
Table 4 presents a comparative analysis between the novel model proposed in this study and previous rockburst prediction models. Previous research indicates that while achieving high accuracy in modeling all rockburst is feasible, it remains challenging to further enhance accuracy to accommodate diverse stress state variations. Segmenting the rockburst dataset based on burial depth emerges as a crucial method for enhancing prediction accuracy. Remarkably, the ET+SVMSMOTE combination methods obtained through this approach consistently outperform mainstream model predictions in terms of accuracy.
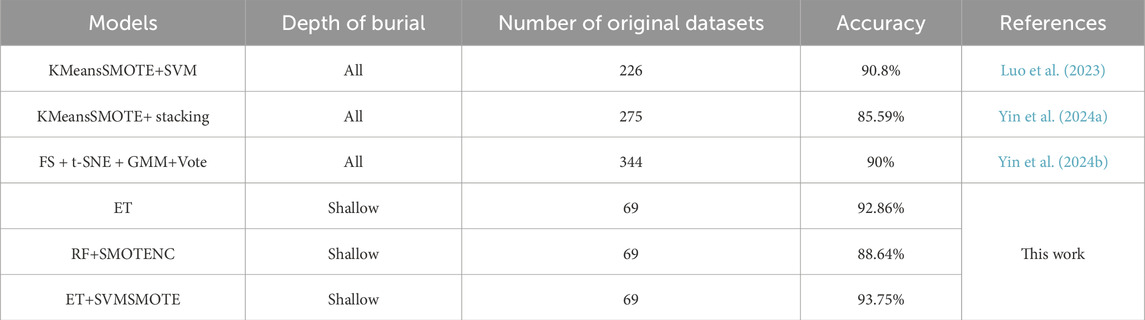
Table 4. Comparison of the proposed model with previously reported models.
3.4 Limitations of the study
A current limitation of this study is the inability to discern the interactions between oversampling techniques, hyper parameter tuning, and model performance. Future research endeavors should prioritize analyzing the significance of both factors on model interpretability, thereby enhancing overall model understanding. In addition, modeling all depths of rockburst occurrence based on previous studies could improve accuracy. However, it is critical to address the complex environmental factors associated with the occurrence of rockbursts at different depths. Future investigations should therefore distinguish between shallow, medium, and deep depths’ influences on rockburst prediction models and develop corresponding models to enhance accuracy and applicability.
4 Conclusion
Rockburst pose a significant threat to various underground projects, including open-pit and underground ore mining, water conservancy and hydropower ventures, as well as tunnelling activities, thereby jeopardizing the safety of workers. Accurate assessment of rockburst intensity is paramount for mitigating these hazards. In this study, this study propose a novel hybrid model with superior generalization performance, accuracy, and reliability, achieved through the integration of multiple sampling techniques and classifiers.
This model, ET+SVMSMOTE, was developed using a dataset comprising 69 shallow rockburst samples. This study considered six oversampling techniques (SMOTE, ADASYN, KMeansSMOTE, SMOTENC, BordenlineSMOTE, and SVMSMOTE) and 12 classifiers (DT, ET, GBD, GPR, KNN, LGB, MLP, NBM, QDA, RF, SVC, and XGB), resulting in 84 algorithm combinations that were meticulously evaluated. Through this rigorous process, this study identified the top-performing combinations, employing stochastic cross-validation to fine-tune hyperparameters and mitigate overfitting.
The RF+SMOTENC hybrid model emerged as the most promising, boasting exceptional predictive performance with an accuracy of 0.9375, precision of 0.9531, recall of 0.9375, and F1 score of 0.9375. Notably, this model exhibited superior generalization performance compared to others, demonstrating a marked reduction in overfitting.
Furthermore, its analysis revealed that oversampling techniques significantly enhance model performance by altering category distributions. Particularly, KMeansSMOTE demonstrated the most substantial improvement, enhancing performance by 9.98 percentage points across all combinations. However, individual model evaluation identified ET+SVMSMOTE as the top performer, achieving a five-fold hierarchical cross-validation score of 0.7833.
Moreover, this conducted an in-depth examination of the impact of SVMSMOTE oversampling on the ET classifier, corroborated by analysis of category compositions and evaluation metrics. Despite the notable achievements of this study which acknowledge the limitation concerning the intricate interplay between oversampling techniques, hyper parameter tuning, and model performance. Future research should prioritize elucidating the synergistic effects of these factors to further enhance model efficacy.
Data availability statement
The original contributions presented in the study are included in the article/Supplementary Material, further inquiries can be directed to the corresponding author.
Author contributions
GR: Conceptualization, Data curation, Formal Analysis, Methodology, Project administration, Software, Supervision, Validation, Visualization, Writing–original draft, Writing–review and editing. YR: Conceptualization, Data curation, Funding acquisition, Project administration, Resources, Supervision, Validation, Writing–review and editing. YX: Conceptualization, Data curation, Investigation, Project administration, Writing–review and editing. QH: Formal Analysis, Investigation, Supervision, Validation, Visualization, Writing–review and editing. JW: Conceptualization, Investigation, Methodology, Validation, Writing–review and editing. JZ: Formal Analysis, Investigation, Software, Supervision, Writing–review and editing.
Funding
The author(s) declare that financial support was received for the research, authorship, and/or publication of this article. This work was supported by the 2023 Jiangxi Province “Science and Technology + Emergency Response” Joint Program Project (2023KYG01002).
Conflict of interest
The authors declare that the research was conducted in the absence of any commercial or financial relationships that could be construed as a potential conflict of interest.
The reviewer GJ declared a shared affiliation with the authors to the handling editor at time of review.
Generative AI statement
The author(s) declare that no Generative AI was used in the creation of this manuscript.
Publisher’s note
All claims expressed in this article are solely those of the authors and do not necessarily represent those of their affiliated organizations, or those of the publisher, the editors and the reviewers. Any product that may be evaluated in this article, or claim that may be made by its manufacturer, is not guaranteed or endorsed by the publisher.
Supplementary material
The Supplementary Material for this article can be found online at: https://www.frontiersin.org/articles/10.3389/feart.2024.1514591/full#supplementary-material
References
Abdi, H., and Williams, L. J. (2010). Principal component analysis. Wiley Interdiscip. Rev. Comput. Stat. 2 (4), 433–459. doi:10.1002/wics.101
Abid, S. K., Sulaiman, N., Chan, S. W., Nazir, U., Abid, M., Han, H., et al. (2021). Toward an integrated disaster management approach: how artificial intelligence can boost disaster management. Sustainability 13 (22), 12560. doi:10.3390/SU132212560
Afraei, S., Shahriar, K., and Madani, S. H. (2019). Developing intelligent classification models for rock burst prediction after recognizing significant predictor variables, Section 1: literature review and data preprocessing procedure. Tunn. Undergr. Space Technol. 83, 324–353. doi:10.1016/j.tust.2018.09.022
Biau, G., and Scornet, E. (2016). A random forest guided tour. Test 25, 197–227. doi:10.1007/s11749-016-0481-7
Borgman, C. L. (2017). Big Data, Little Data, No Data: Scholarship in the Networked World. Cambridge, MA: MIT press. doi:10.1080/1369118x.2017.1344286
Chen, T., He, T., Benesty, M., Khotilovich, V., Tang, Y., Cho, H., et al. (2015). Xgboost: extreme gradient boosting. R. package version 0.4-2 1 (4), 1–4.
Chicco, D., and Jurman, G. (2020). The advantages of the Matthews correlation coefficient (MCC) over F1 score and accuracy in binary classification evaluation. BMC genomics 21, 6–13. doi:10.1186/s12864-019-6413-7
Dong, L. I. U., Xi-bing, L. I., Zhi-xiang, L. I. U., Yan-ning, J. I. N., Zhi-ming, H. O. U., and Xin-qiao, WANG (2016). The induced mechanism for shallow rock burst below group goafs. Min. Metallurgical Eng. 36 (02), 23–27. doi:10.1016/j.tust.2020.103327
Douzas, G., Bacao, F., and Last, F. (2018). Improving imbalanced learning through a heuristic oversampling method based on k-means and SMOTE. Inf. Sci. 465, 1–20. doi:10.1016/j.ins.2018.06.056
Fan, J., Ma, X., Wu, L., Zhang, F., Yu, X., and Zeng, W. (2019). Light Gradient Boosting Machine: an efficient soft computing model for estimating daily reference evapotranspiration with local and external meteorological data. Agric. water Manag. 225, 105758. doi:10.1016/j.agwat.2019.105758
Feng, J., Qian, S., Zhang, Y., Luo, C., and Liu, Y. (2007). Research on distribution rule of shallow crustalgeostress in China mainland. Chin. J. Rock Mech. Eng. 10, 2056–2062.
Feng, X. T., and Wang, L. N. (1994). Rockburst prediction based on neural networks. Trans. Nonferrous Met. Soc. China 4 (1), 7–14.
Fernández, A., Garcia, S., Herrera, F., and Chawla, N. V. (2018). SMOTE for learning from imbalanced data: progress and challenges, marking the 15-year anniversary. J. Artif. Intell. Res. 61, 863–905. doi:10.1613/jair.1.11192
Fonseca, J., and Bacao, F. (2023). Geometric SMOTE for imbalanced datasets with nominal and continuous features. Expert Syst. Appl. 234, 121053. doi:10.1016/j.eswa.2023.121053
Geurts, P., Ernst, D., and Wehenkel, L. (2006). Extremely randomized trees. Mach. Learn. 63, 3–42. doi:10.1007/s10994-006-6226-1
Han, H., Wang, W. Y., and Mao, B. H. (2005). “Borderline-SMOTE: a new over-sampling method in imbalanced data sets learning,” in In International conference on intelligent computing (Berlin, Heidelberg: Springer Berlin Heidelberg), 878–887. doi:10.1007/11538059_91
He, H., Bai, Y., Garcia, E. A., and Li, S. (2008). “ADASYN: adaptive synthetic sampling approach for imbalanced learning,” in 2008 IEEE international joint conference on neural networks (IEEE world congress on computational intelligence), 1322–1328. doi:10.1109/ijcnn.2008.4633969
Hearst, M. A., Dumais, S. T., and Osuna, E. (1998). Support vector machines. IEEE Intell. Syst. Their Appl. 13 (4), 18–28. doi:10.1109/5254.708428
Kanamori, H., and Brodsky, E. E. (2004). The physics of earthquakes. Rep. Prog. Phys. 67 (8), 1429–1496. doi:10.1088/0034-4885/67/8/r03
Kim, K. S., Choi, H. H., Moon, C. S., and Mun, C. W. (2011). Comparison of k-nearest neighbor, quadratic discriminant and linear discriminant analysis in classification of electromyogram signals based on the wrist-motion directions. Curr. Appl. Phys. 11 (3), 740–745. doi:10.1016/j.cap.2010.11.051
Lai Feng, J. (2008). Study on prediction and prevention of rockburst in Anlu tunnel. Chengdu: Southwest Jiaotong University.
Li, J., Fu, H., Hu, K., and Chen, W. (2023). Data preprocessing and machine learning modeling for rockburst assessment. Sustainability 15 (18), 13282. doi:10.3390/SU151813282
Liu, G., Du, C., and Guangliang, F. (2023). Causative characteristics and prediction model of rockburst based on large and incomplete data set. Earth Sci. 48 (05), 1755–1768. doi:10.3799/dqkx.2022.491
Liu, L., Song, Z., Zhou, P., He, X., and Zhao, L. (2024). AI-based rock strength assessment from tunnel face images using hybrid neural networks. Sci. Rep. 14 (1), 17512. doi:10.1038/s41598-024-68704-0
Liu, Q., Xue, Y., Li, G., Qiu, D., Zhang, W., Guo, Z., et al. (2023). Application of KM-SMOTE for rockburst intelligent prediction. Tunn. Undergr. Space Technol. 138, 105180. doi:10.1016/J.TUST.2023.105180
Longadge, R., and Dongre, S. (2013). Class imbalance problem in data mining review. Arxiv preprint arxiv, 1305-1707.
Luo, H., Fang, Y., Wang, J., Wang, Y., Liao, H., Yu, T., et al. (2023). Combined prediction of rockburst based on multiple factors and stacking ensemble algorithm. Undergr. Space 13, 241–261. doi:10.1016/j.undsp.2023.05.003
Ma, Z., and Mei, G. (2021). Deep learning for geological hazards analysis: data, models, applications, and opportunities. Earth-Science Rev. 223, 103858. doi:10.1016/J.EARSCIREV.2021.103858
Mengguo, X. U., Zijian, D. U., and Gaohui, Y. A. O. (2008). Rockburst prediction of Chengchao iron mine during deep minng. Chin. J. Rock Mech. Eng. 27 (S1), 2921–2928.
Milford, C., Torres, C., Vilches, J., Gossman, A. K., Weis, F., Suárez-Molina, D., et al. (2023). Impact of the 2021 La Palma volcanic eruption on air quality: insights from a multidisciplinary approach. Sci. Total Environ. 869, 161652. doi:10.1016/J.SCITOTENV.2023.161652
Natekin, A., and Knoll, A. (2013). Gradient boosting machines, a tutorial. Front. neurorobotics 7, 21. doi:10.3389/fnbot.2013.00021
Newman, R., and Noy, I. (2023). The global costs of extreme weather that are attributable to climate change. Nat. Commun. 14 (1), 6103. doi:10.1038/S41467-023-41888-1
Rao, G., Rao, Y., Wan, J., Huang, Q., Xie, Y., Lai, Q., et al. (2024). Long-term prediction modeling of shallow rockburst with small dataset based on machine learning. Sci. Rep. 14 (1), 16131. doi:10.1038/s41598-024-64107-3
Schulz, E., Speekenbrink, M., and Krause, A. (2018). A tutorial on Gaussian process regression: modelling, exploring, and exploiting functions. J. Math. Psychol. 85, 1–16. doi:10.1016/j.jmp.2018.03.001
Song, Y. Y., and Ying, L. U. (2015). Decision tree methods: applications for classification and prediction. Shanghai archives psychiatry 27 (2), 130–135. doi:10.11919/j.issn.1002-0829.215044
Sun, L., Hu, N., Ye, Y., Tan, W., Wu, M., Wang, X., et al. (2022). Ensemble stacking rockburst prediction model based on Yeo–Johnson, K-means SMOTE, and optimal rockburst feature dimension determination. Sci. Rep. 12 (1), 15352. doi:10.1038/S41598-022-19669-5
Sun, C. (2019). A prediction model of rock burst in tunnel based on the improved MATLAB-BP neural network. J. Chongqing Jiaot. Univ. Sci. 38 (10), 41–49. doi:10.3969/j.issn.1674-0696.2019.10.07
Tang, J., Deng, C., and Huang, G. B. (2015). Extreme learning machine for multilayer perceptron. IEEE Trans. neural Netw. Learn. Syst. 27 (4), 809–821. doi:10.1109/TNNLS.2015.2424995
Varsha, V. R., Naganandini, S., and Hariharan, C. (2024). “Utilizing AI and machine learning for natural disaster management: predicting natural disasters with AI and machine learning,” in In internet of things and AI for natural disaster management and prediction (IGI Global), 279–304. doi:10.4018/979-8-3693-4284-8.ch013
Wang, J. B., Zou, C. A., and Fu, G. H. (2021). AWSMOTE: an SVM-based adaptive weighted SMOTE for class-imbalance learning. Sci. Program. 2021, 1–18. doi:10.1155/2021/9947621
Wang, Y., Wodong, L., and Lee, P. K. K. (1998). Method of fuzzy comprehensive evaluations for rockburst prediction. Chin. J. Rock Mech. Eng. 05, 15–23.
Xu, Lu, Fu, H.-Y., Goodarzi, M., Cai, C.-B., Yin, Q.-B., Wu, Y., et al. (2018). Stochastic cross validation. Chemom. Intelligent Laboratory Syst. 175, 74–81. doi:10.1016/j.chemolab.2018.02.008
Xue-pei, X. (2005). A Study on the prediction and prevention of rockburst in the traffic tunnel of Jinping II hydropower station. Chengdu: Chengdu University of Technology.
Yin, X., Cheng, S., Yu, H., Pan, Y., Liu, Q., Huang, X., et al. (2024a). Probabilistic assessment of rockburst risk in TBM-excavated tunnels with multi-source data fusion. Tunn. Undergr. Space Technol. 152, 105915. doi:10.1016/j.tust.2024.105915
Yin, X., Huang, X., Pan, Y., and Liu, Q. (2023). Point and interval estimation of rock mass boreability for tunnel boring machine using an improved attribute-weighted deep belief network. Acta Geotech. 18 (4), 1769–1791. doi:10.1007/s11440-022-01651-0
Yin, X., Liu, Q., Huang, X., and Pan, Y. (2022). Perception model of surrounding rock geological conditions based on TBM operational big data and combined unsupervised-supervised learning. Tunn. Undergr. Space Technol. 120, 104285. doi:10.1016/j.tust.2021.104285
Yin, X., Liu, Q., Lei, J., Pan, Y., Huang, X., and Lei, Y. (2024b). Hybrid deep learning-based identification of microseismic events in TBM tunnelling. Measurement 238, 115381. doi:10.1016/j.measurement.2024.115381
Yin, X., Liu, Q., Pan, Y., and Huang, X. (2021). A novel tree-based algorithm for real-time prediction of rockburst risk using field microseismic monitoring. Environ. Earth Sci. 80, 504–519. doi:10.1007/s12665-021-09802-4
Yu, W., Qiang, X., and Hejun, C. (2013). Rock burst prediction in deep shaft based on RBF-AR model. J. Jilin Univ. Earth Sci. Ed. 43 (06), 1943–1949+1965. doi:10.13278/j.cnki.jjuese.2013.06.019
Yunzhang, R. A. O., and Xuezhen, L. I. (2015). Research on rock burst prediction technology based on the actual impact energy index(W). Gold Sci. Technol. 23 (04), 63–67. doi:10.11872/j.issn.1005-2518.2015.04.063
Yu Xuezhen (2009). Highway tunnel geological disaster prediction and the development of treatment measures database management system. Chongqing: Chongqing University.
Zhang, C. Q., Zhou, H., and Feng, X. T. (2011). An index for estimating the stability of brittle surrounding rock mass: FAI and its engineering application. Rock Mech. Rock Eng. 44, 401–414. doi:10.1007/s00603-011-0150-9
Zhang, Y., Liu, L., Song, Z., Zhao, Y., and He, S. (2024). Enhancing tunnel boring machine penetration rate predictions through particle swarm optimization and elman neural networks. J. Constr. Eng. Manag. 150 (9), 04024116. doi:10.1061/JCEMD4.COENG-14788
Zhangjun, L. I. U., Yuan, Q., and Jianlin, L. I. (2008). Application of fuzzy probability model to prediction of classification of rockburst intensity. Chin. J. Rock Mech. Eng. S1, 3095–3103.
Zhou, H., Liao, X., Chen, S., Feng, T., and Wang, Z. (2022). Rockburst risk assessment of deep lying tunnels based on combination weight and unascertained measure theory: a case study of sangzhuling tunnel on sichuan-tibet traffic corridor. Earth Sci. 47 (06), 2130–2148. doi:10.3799/dqkx.2021.170
Zhou, J., Li, X., and Mitri, H. S. (2016). Classification of rockburst in underground projects: comparison of ten supervised learning methods. J. Comput. Civ. Eng. 30 (5), 04016003. doi:10.1061/(ASCE)CP.1943-5487.0000553
Keywords: oversampling techniques, machine learning, shallow rockburst intensity prediction, assessment, generalization capability
Citation: Rao G, Rao Y, Xie Y, Huang Q, Wan J and Zhang J (2025) Impact of a multiple oversampling technique-based assessment framework on shallow rockburst prediction models. Front. Earth Sci. 12:1514591. doi: 10.3389/feart.2024.1514591
Received: 21 October 2024; Accepted: 31 December 2024;
Published: 20 January 2025.
Edited by:
Faming Huang, Nanchang University, ChinaReviewed by:
Zhanping Song, Xi’an University of Architecture and Technology, ChinaGeng Jiabo, Jiangxi University of Science and Technology, China
Changshuo Wang, Ningbo University, China
Xiaorui Wang, Anhui University of Science and Technology, China
Shuo Yang, Xuzhou University of Technology, China
Copyright © 2025 Rao, Rao, Xie, Huang, Wan and Zhang. This is an open-access article distributed under the terms of the Creative Commons Attribution License (CC BY). The use, distribution or reproduction in other forums is permitted, provided the original author(s) and the copyright owner(s) are credited and that the original publication in this journal is cited, in accordance with accepted academic practice. No use, distribution or reproduction is permitted which does not comply with these terms.
*Correspondence: Yunzhang Rao, cmFveXVuemhhbmdAanh1c3QuZWR1LmNu