 Zequn Hong
 Shuoren Fu
 Yuanhao Wu2
- 1State Key Laboratory for Geomechanics and Deep Underground Engineering, School of Mechanics and Civil Engineering, China University of Mining and Technology, Xuzhou, China
- 2China Construction Eighth Engineering Division Co., Ltd., Shanghai, China
The freezing construction of the end of the new shield tunnel has a mechanical impact on the surrounding structures. Few studies exist on the reasonable range of soil reinforcement near the shield tunnel and the influence of frost heave on the existing structure during the freezing process. To explore the influence of horizontal freezing of a proposed tunnel on existing underground structures, a three-dimensional numerical model of ‘thermal-mechanical’ coupling was established based on the horizontal freezing reinforcement project applied in a shield receiving end, and the temperature field distribution characteristics of different freezing stages were obtained. After confirming that the frozen wall had reached the design thickness based on the temperature field, the mechanical effects of frost heave on the existing structures were investigated, including the side tunnel, the upper subway tunnel, and the end diaphragm wall. The results showed that the frost heave pressure was mainly distributed in the structure near the freezing zone, while the structure far away from the freezing zone was relatively less affected by frost heave. By defining the strong and weak influence sections, we introduced the influence coefficient η to quantify the frost heave effect on the side tunnel. Under the condition that the thickness of the frozen wall was constant, the strong influence range of the side tunnel reached 1.4 times the freezing length of the proposed tunnel at a distance of 3.6 times the frozen wall thickness. The farther the clearance between the side tunnel and the proposed tunnel was, the smaller the influence coefficient η was, and the shorter the strong influence section was. The frost-heaving effect generated by freezing at the shield tunnel receiving end was more pronounced along the diameter of the freezing pipes, while axial release strength was comparatively weaker. This research can provide a reference for evaluating the influence of freezing construction on adjacent underground structures.
1 Introduction
With urban underground space development in recent years, the shield method has been increasingly utilized in subway tunnels and various other projects where the soil has high water content and low bearing capacity in water-rich soft soil areas (Zhang et al., 2024; Zhang and Huang, 2014; Koyama, 2003; Russo et al., 2015). In shield tunneling projects, inadequate handling of shield launching and receiving portals can lead to water leakage and soil collapse (Alzoubi et al., 2020; Hu et al., 2019). Due to the strong adaptability of the artificial ground freezing (AGF) method and its remarkable water-sealing effect, this method is often used to reinforce or repair shield tunnels to ensure construction safety (Yang et al., 2019; Kleinlugtenbelt et al., 2013; Levin et al., 2021).
The ground reinforcement method based on freezing technique has been extensively investigated by numerous scholars. Nishioka used artificial freezing methods to strengthen the stratum of the receiving shaft to prevent the collapse of the working shaft during shield reception and reduce the risk of water leakage incidents and achieved a good effect (Nishioka et al., 2004). In addition, the AGF method was applied in the restoration project of shield tunnel near Nakdong River, which was adopted as an auxiliary construction method to connect the box structures inside the excavated zones to the intact tunnel sections (Park et al., 2023). Based on the horizontal annular freezing project at the receiving end of the shield machine, Gao et al. (2021) analyzed the influence of soil quality, water content, and groundwater flow rate on freezing. Liu et al. (2022) strengthened the shield launching portal project of Wuxi Metro Line 4 Civic Center Station by the “cup-shaped” horizontal freezing method and pointed out that the horizontal freezing method has a good reinforcement effect under weak stratum conditions.
As temperatures approach the freezing point of liquid water, the soil undergoes expansion and deformation. EVERETT (1961) first proposed the capillary theory, namely, the first frost heave theory. However, this theory underestimates the frost heave pressure in fine-grained soil. After realizing the shortcomings of capillary theory, Miller (1972) proposed the frozen edge theory (the second frost heave theory), which indicated the existence of low water content, low moisture conductivity and a strip with no frost heave on the freezing front and the freezing lens. After that, frost heave has been studied by many researchers. Padilla et al. (1997) studied the frost heave of grain fillings during ground freezing through experiments and the finite element method (FEM). Yang et al. (2006) presented a numerical simulation method of frost heave, the method was applied to a cross passage construction using the AGF technique in China. The coupling model can predict significant frost heave under conditions of sufficient water supply and effectively captures the frost heave characteristics under various temperature and stress boundary conditions. Zhelnin et al. (2022) established the relationship between temperature, pore water, and ice pressure using the Clausius-Clapeyron equation and proposed a thermo-hydro-mechanical (THM) model to study the effects of frost heave and water migration on the formation of frozen walls and subsequent shaft sinking in water-saturated soils during artificial freezing. Yang et al. (2024) proposed a coupling model that can predict significant frost heave under conditions of sufficient water supply and effectively capture the frost heave characteristics under various temperature and stress boundary conditions. During tunnel construction using the AGF method, frost heave could have adverse effects on surrounding areas, even leading to the fracture of the freezing pipes (Wang et al., 2023). Li (2009) and Zhou et al. (2009) utilized stochastic medium theory to predict the heaving displacement of ground surface due to soil frost heave in tunnel construction that uses AGF method. However, the formation process of a frozen wall was not considered in the aforementioned studies. Cai et al. established a model test system that can simulate the frost heaving process and the horizontal displacements of the ground surface were obtained, which agree well with the field-measured data. Moreover, the effectiveness and practicality of the improved analytical prediction were also verified (Cai et al., 2019a; Cai et al., 2019b). These results provide an important theoretical basis and measured data reference for studying the influence of horizontal freezing at the shield end of the subway tunnel.
As underground construction progresses, the impact of freezing construction at the end of a new shield tunnel on surrounding existing structures becomes increasingly significant, particularly when tunnels pass through complex and interlaced strata of underground pipelines. Currently, there is limited research on the optimal extent of soil near shield entrances and exits using the freezing method, as well as the effects of frost heave on surrounding existing structures during the freezing process.
In this paper, a three-dimensional numerical model of horizontal freezing is established based on a horizontal freezing reinforcement project at the receiving end of a proposed tunnel, which aims to address two critical issues, i.e., the temperature field distribution characteristics in the reinforcement area during the freezing period and the mechanical effects of the frozen wall on existing structures, such as the side tunnel, the upper tunnel, and the end diaphragm wall. These analyses provide insights to guide frost heave control in practical construction processes.
2 Engineering overview
2.1 Surrounding architectural environment
The proposed tunnel spans a total length of 17.01 km with an outer diameter of 13.1 m, situated at a depth of approximately 29.7 m below the rail surface. It utilizes configurations of both single-hole double-line and double-hole single-line designs. The surrounding area is characterized by densely distributed buildings, intricate road networks, heavy traffic, and diverse environmental conditions. The distance between the axis of the upper subway tunnel and the plane of the proposed tunnel’s working shaft is approximately 36 m, with the rail surface elevation at about −5.97 m. The vertical clearance between the two main structures measures 11.89 m. The freezing reinforcement area forms a rectangular zone with a length of 20.1 m and a depth of 16 m. The proposed tunnel runs approximately parallel to the side tunnel, positioned between its left and right-side tunnels, slightly closer to the left side tunnel. It is approximately 8.84 m from the left side tunnel and about 9.15 m from the right-side tunnel. The elevation of the proposed tunnel center is slightly lower than that of the side tunnel. The positional relationship of each tunnel is shown in Figures 1A, B.

Figure 1. Tunnels position diagrams. (A) Plan diagram. (B) Sectional diagram.
2.2 Geological and hydrological conditions
The strata that the shield receiving shaft of the tunnel passes through are (1) 0 Plain fill, (2) 0 Silt, (3) 2-2 Silty sand, (3) 5-1 Coarse sand, (7) 1-1 Fully weathered shaly sand, (7) 1-2 Strongly weathered shaly sand and (7) 1-3 Moderately weathered shaly sand (as shown in Figure 2). The engineering geological conditions are poor, particularly due to the strongly weathered argillaceous sandstone which exhibits characteristics of softening and disintegration in water. Improper reinforcement can easily lead to water gushing, sand gushing, uneven settlement, and other disasters (Zhou and Cai, 2015). For the reasons mentioned above, it is essential to conduct pretreatment before excavation to prevent disturbance and prolonged exposure to water. Based on the field test report, the physical and mechanical parameters of each soil layer in the receiving shaft are detailed in Table 1.
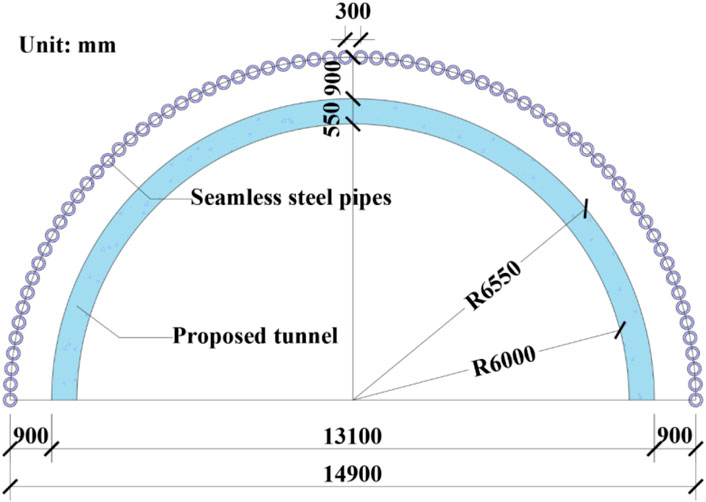
Figure 2. Layout diagram of long pipe shed.

Table 1. Physical and mechanical parameters of soil layer.
Based on the detailed geological survey report, the groundwater aquifer at the site primarily consists of: Artificial fill layer (1)0, Silty sand layer (3)2-2, Medium sand layer (3)4-1 and Coarse sand layer (3)5-1. The fill soil is extensively distributed with substantial local thickness, predominantly above the groundwater level. The upper layers typically contain stagnant water, primarily accumulated from atmospheric precipitation, with increased water content during the rainy season. The cohesive soil layer in the local section is covered with a sand layer, and the groundwater is pressure-bearing. The bedrock fissure water is mainly confined water, and the main aquifer is in the strongly weathered rock zone and the moderately weathered rock zone with developed joints and fissures, with medium permeability and water abundance.
2.3 Freezing plan
Due to the complexity of the hydrogeological conditions within the receiving range of the shield at the end of the proposed tunnel, there may be risks such as water gushing, sand gushing, and uneven settlement during the shield receiving process. To ensure the safe operation of the shield machine, the artificial freezing method is used to reinforce the shield end. Given the dense buildings and heavy traffic on the ground, there is no condition for ground freezing, and considering the dense distribution of underground pipelines, the design adopts the scheme of “horizontal grouting in the working shaft and local freezing reinforcement + steel sleeve” for shield receiving. To minimize the impact of the shield construction of the proposed tunnel on the operation of the subway line tunnel, the original grouting reinforcement scheme was applied to a 60 m long Φ159 mm long pipe shed at the receiving end of the shield. The circumferential spacing of the pipe shed is 400 mm, and its orientation aligns with the longitudinal slope of the proposed tunnel line. During the construction of the shield receiving shaft, the steel pipes with an outer diameter of 194 mm were embedded in the sidewall as pipe shed guide pipes. The length of the guide pipes was consistent with the thickness of the side wall of the main structure of the station. The construction of the pipe shed adopts the form of drilling with the pipe, whose process needs to strictly control the construction accuracy of the long pipe shed to ensure that the long pipe shed does not enter the shield tunneling range. The layout diagram of the long pipe shed is shown in Figure 2.
Based on the actual project freezing design scheme, horizontal freezing employs a double-ring pipe layout scheme to facilitate smooth entry of the shield into the tunnel. The inner and outer ring freezing pipes are spaced 0.8 m apart circumferentially, with a ring spacing of 1 m. These freezing pipes are constructed from 89 mm seamless low-carbon steel, each measuring 16 m in length and interconnected via screw threads. The freezing range primarily covers the upper half section of the proposed tunnel. In the period of active freezing, the design brine temperature does not exceed −32°C. Throughout the maintenance freezing period, the brine temperature remains below −28°C. The designed frozen wall thickness is no less than 2.5 m, with a single-hole freezing radius of at least 0.75 m, the single-hole freezing radius is not less than 0.75 m, and the average temperature of the frozen soil curtain needs to be lower than −10°C. The average temperature of the interface between the frozen soil curtain and the diaphragm wall is maintained below −5°C. The corresponding design criteria for frozen soil strength are as follows: the uniaxial compressive strength is a minimum of 5.4 MPa, and the flexural tensile strength should be greater than 2.7 MPa. The pipe arrangement near the top of the tunnel is changed from circular to horizontal, with freezing pipes spaced at 0.8 m intervals. The layout diagram of the freezing pipe is shown in Figure 3.

Figure 3. Layout diagram of freezing holes in tunnel cross section.
3 Horizontal freezing numerical calculation
3.1 Model establishment
During the construction of the artificial freezing method, the temperature field in the soil is unsteady. According to the theory of heat conduction, the differential equation of unsteady temperature field considering the freezing phase change process of soil is as follows:
where:
k is thermal conductivity, W/m·°C;
T is the soil temperature, °C;qv is the material released or absorbed per unit volume during the phase transition process, J/m3;
ρ is soil density, kg/m3;
c is the specific heat of soil, J/(kg·°C).
In the non-phase transition region, qv = 0 in Equation 1.
The initial condition is:
The temperature boundary condition at infinity is:
The heat conduction boundary condition of the soil around the freezing pipe is:
where:
k is thermal conductivity, W/m·°C;
n is the outer normal direction of the outer surface of the freezing pipe;
q is the heat flux density on the surface of the freezing pipe, W/m2.
The differential equation of unsteady temperature field considering the freezing phase change process of soil Equation 1 and boundary conditions Equations 2–4 together constitute the temperature well-posed problem of the model.
The modification of the temperature field substantially affects the thermophysical properties (thermal parameters) of soil. Conversely, alterations in the physical properties of soil also impact the distribution of the temperature field (Xiang et al., 2023). The thermoelastic analysis of the soil mass shows that in the elastic region, the total strain increment can be expressed as:
where:
d{ε}e refers to the elastic strain increment related to the force;
d{ε}T represents the increase in strain resulting from a change in temperature.
In Equation 5, d{ε}e = [E]−1d{σ}+ ∂[E]−1/∂T·{σ}dT, and the d{ε}T ={α}dT. In the formulas [E] is an elastic matrix; {σ} represents stress; the symbol d represents taking the increment of physical quantity; {α} is the thermal expansion coefficient vector of soil. Combined with the Equation 5, the constitutive relation of the incremental form in the elastic zone can be obtained as:
In Equation 6,
Based on the spatial positioning of the proposed tunnel relative to the upper subway tunnel and the left and right-side tunnel, a three-dimensional numerical model employing “thermal-mechanical” coupling was established using finite element software (as depicted in Figure 4).
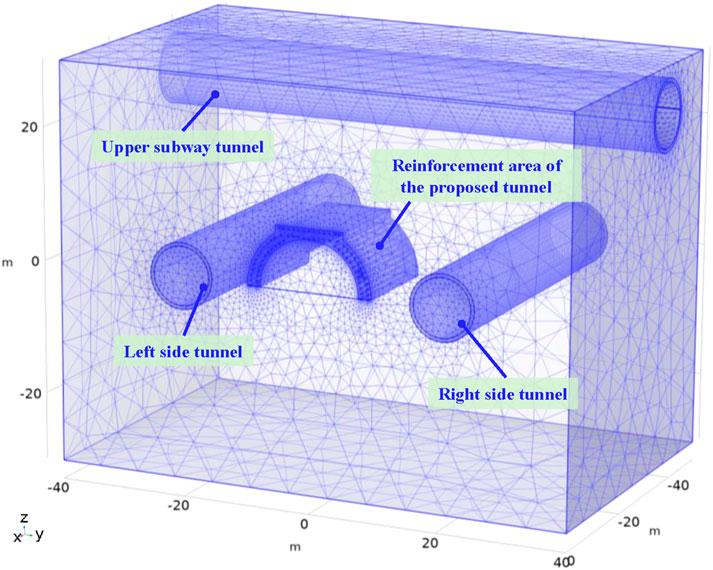
Figure 4. Numerical computational geometry model.
This model was utilized to analyze the impact of horizontal freezing at the tunnel’s terminus on the existing structures. The temperature field induces thermal deformation (thermal stress and thermal strain), thereby coupling with the stress field.
The soil constitutive relation adopts the Mohr-Coulomb yield criterion, while the building structure is modeled with an elastic constitutive relation. Considering that it is difficult to quantify the complexity of the boundary conditions of the surface, and in order to more realistically reflect the response of the surface during the freezing process, the upper boundary of the geometric model is set as a free boundary. The normal constraints are applied to the lower boundary and the surrounding boundary, limiting the vertical and horizontal displacement of the soil. Since the location of the pipe shed inside the frozen wall, the internal pipe shed of the frozen wall is set as a fixed constraint when assessing the impact of frost heave on the adjacent tunnel outside. Based on trial calculations, the dimensions of the model area −80 m in length, 50 m in width, and 60 m in height—satisfactorily meet the requirements for determining the boundary conditions of the model. In the model, the vertical clearance between the proposed tunnel and the upper subway tunnel is 11.89 m, the horizontal clearance between the proposed tunnel and the left side tunnel is 8.84 m, and the horizontal clearance between the proposed tunnel and the right-side tunnel is 9.15 m. The freezing pipes are horizontally inserted into the soil layer at the receiving end from the side wall of the working shaft. A total of 72 freezing pipes were installed, including 24 pipes in the inner ring, 24 pipes in the outer ring, and an additional 24 pipes arranged horizontally in double rows at the top of the proposed tunnel. The design parameters, encompassing the shape, size, and spacing arrangement of the freezing pipes, adhere to the design specifications.
3.2 Parameter selection
Given the lack of thermophysical parameters of the geological conditions around the subway station in the geological survey report, the thermodynamic parameters related to the cooling process of the stratum are selected according to the similar soil layers in other literature reports (Cai et al., 2019b; Zhou and Cai, 2015) in the numerical calculation. The COMSOL finite element software is used to perform a sequential thermo-mechanical coupling simulation. In the first step, the temperature field is solved, which is then imported as a predefined field to solve for displacement and stress. The free tetrahedral mesh is used, and the complete mesh contains “732,964”domain elements, 102,988 boundary elements, and 15,352 edge elements. Freezing is a heat transfer process from the freezing pipe to the soil. There is a phase change of ice water in the soil. When the liquid becomes solid, the latent heat of phase change will be released. Based on the field measurement report, the phase change temperature of pore water is set to be −0.65°C and the latent heat of phase change is 333.5 kJ/kg. The unfrozen soil exhibits a specific heat capacity of 1650 J/(kgK) and a thermal conductivity of 1.42 W/(m·K). Conversely, the frozen soil demonstrates a specific heat capacity of 1560 J/(kg·K) and a thermal conductivity of 1.74 W/(m·K). The freezing temperature of the soil is −0.65°C. Assuming a uniform soil temperature field before freezing, the initial soil temperature considered for calculations is 20°C, consistent with field monitoring data. The temperature of the refrigerant is determined from measurements in the brine main pipe, and its cooling curve is depicted in Figure 5.
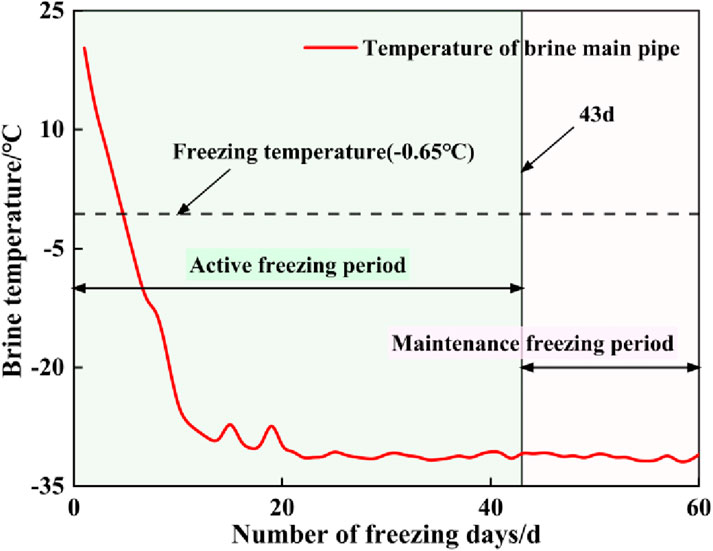
Figure 5. Salt water cooling curve.
4 Numerical calculation of temperature field
4.1 Selection of characteristic section
The characteristic section perpendicular to the horizontal freezing pipe is selected to analyze the development process of the freezing temperature field, and whether the thickness of the freezing wall reaches the designed freezing wall thickness of 2.5 m is judged. A characteristic cross-section is selected at the middle section of the horizontal freezing zone from 0 to 16 m, with a specific example taken at a 10 m distance from the working shaft, as illustrated in Figure 6.
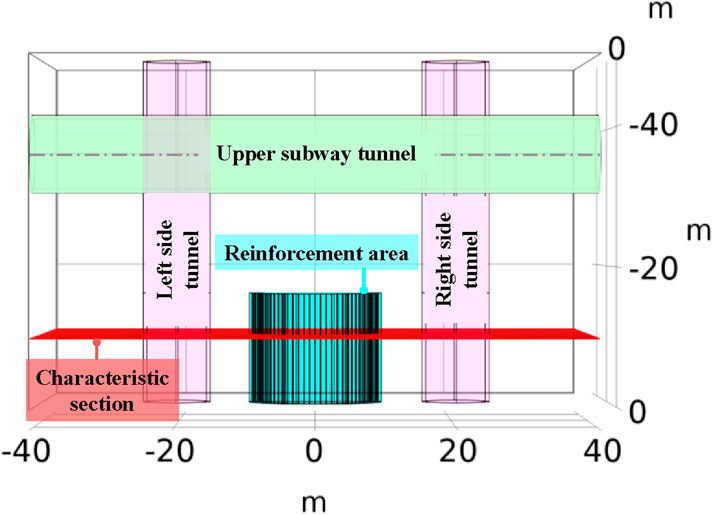
Figure 6. Position diagram of characteristic section.
4.2 Development process of temperature field
Based on the selected characteristic section, the relative position relationship between the development range of frozen soil and the contour line of freezing design thickness in different freezing stages is drawn (as shown in Figure 7) to analyze the development process of the freezing temperature field. The dark blue curve in the figure is the location of the freezing front.
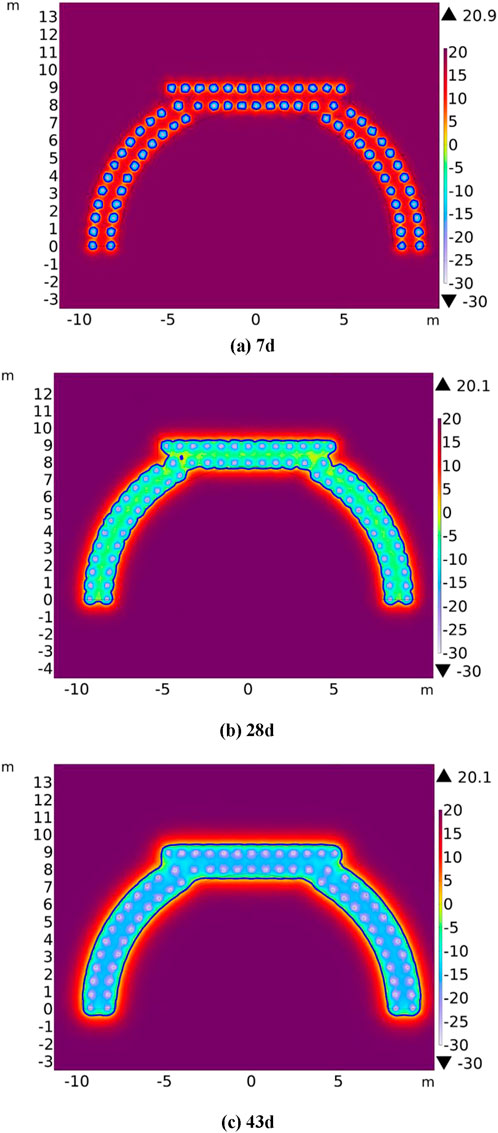
Figure 7. Distribution of temperature field of characteristic section in different freezing periods. (A) 7d. (B) 28d. (C) 43d.
In the rapid cooling stage, significant temperature disparity between the initial temperature of the stratum and the temperature of the brine results in severe heat exchange of the contact surface. During this stage, soil temperature adjacent to the freezing pipes drops swiftly, while the heat exchange between the soil and the freezing pipes at a distance is weak. The temperature is little affected by the temperature of the brine, and the cooling is slow. Illustrated in Figure 7A, delineated by dotted blue areas, frozen soil predominantly forms around the freezing pipes.
Figure 7B shows the temperature field distribution after the freezing wall closure. After the release of latent heat of water phase change in the soil, the surface temperature of the adjacent frozen soil column drops below 0°C and further decreases. As the freezing duration increases, the frozen wall gradually forms and thickens continuously. Subsequently, the frozen soil boundary extends outward and gradually develops toward the designed frozen soil contour line. At 43 days of freezing (Figure 7C), the freezing front moves to the designed frozen soil contour line, and the thickness of the frozen wall reaches the design requirement of 2.5 m. At this node, the numerical calculation of the subsequent frost heave effect is performed. After the frozen wall reaches the design thickness, the freezing project still needs to be carried out to ensure the safe construction of the excavation process. To further control the harm of frost heave, in the subsequent freezing project, by adjusting the flow rate of salt water and appropriately increasing the temperature of salt water, the thickness of the frozen wall is maintained within a certain controllable range, which meets the engineering requirements.
5 Calculation of mechanical influence on existing tunnels
5.1 The impact on the side tunnel
During the freezing process, the phase change of liquid water to solid ice induces volume expansion, leading to deformation in the surrounding soil. Upon reaching the designed frozen soil contour line, the thickness of the frozen wall achieves the design requirement of 2.5 m. Based on the development status of the frozen soil curtain, numerical calculations for the frost heave effect are carried out. The Mises stress distribution of the edge waistlines of the left and right side tunnel is shown in Figures 8, 9.
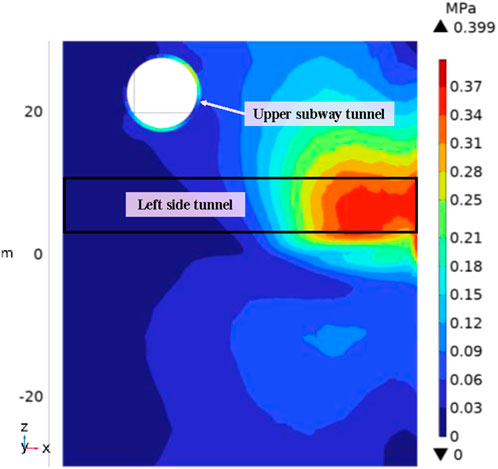
Figure 8. Mises stress distribution of the left side tunnel edge waistline.
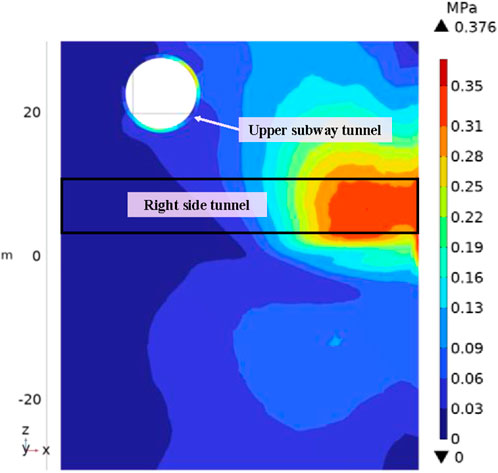
Figure 9. Mises stress distribution of the right side tunnel edge waistline.
In Figures 8, 9, the transition from blue to red indicates a gradual increase in Mises stress, with deeper red shades indicating higher equivalent stress levels. It is evident that the red areas are primarily concentrated on the right side of the side tunnel and symmetrically distributed along the tunnel axis. The maximum Mises stress on the left side tunnel edge waistline measures 0.399 MPa, slightly higher than the 0.376 MPa observed on the right side tunnel edge waistline. This disparity arises from the slightly smaller horizontal clearance between the proposed tunnel and the left side tunnel, leading to a greater influence on the left side tunnel’s stress levels.
The left side tunnel waistline, which is by the frozen side, is denoted as the side edge waistline L1, while the waistline of the right side tunnel is taken as the side edge waistline L2. The stress and deformation profiles of side edge waistlines L1 and L2 depicted in Figure 10. In Figure 10A, the positive direction of the abscissa x is the direction of the shield entering the tunnel, and the value of the ordinate compressive stress represents the frost heave force on the side edge waistline. In Figure 10B, the ordinate is the deformation value |d| of each point on the side edge waistline, whose positive direction is the left side that is orthogonal to the direction of the shield tunnel and points to the direction of the shield tunnel.
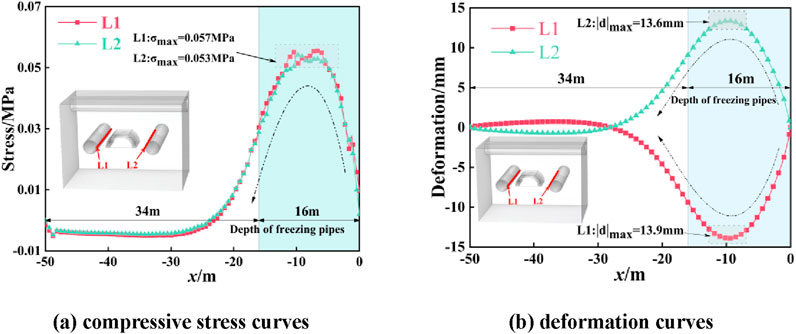
Figure 10. The stress and deformation curves of side edge waistline L1 and L2. (A) Compressive stress curves. (B) Deformation curves.
The response of the left and right-side tunnel edge waistlines to soil frost heave is depicted in Figure 10. In Figure 10A, as points alongside edge waistlines L1 and L2 progressively move away from the section adjacent to the receiving portal (0 m), compressive stress steadily increases until reaching peak values, followed by a gradual decrease. The maximum compressive stresses for L1 and L2 occur between 7 and 10 m from the portal section, with the L1 curve peaking first. These peak stresses measure 0.057 MPa for L1 and 0.053 MPa for L2. Both force curves exhibit similar shapes, indicating that the frost heave force exerted by the frozen wall is symmetrically distributed to both sides. The horizontal clearance between the proposed tunnel and the left and right tunnel differs by −0.31 m, while the peak stress difference between the tunnels is 0.004 MPa. Specifically, as the side edge waistline L1 approaches 0.31 m to the proposed tunnel, the peak stress gradually increases.
Figure 10B illustrates that as the abscissa (x) decreases, the deformation curve of the side edge waistline L1 shows an initial rapid decline. At the position that x = −9.6 m, the curve reaches its nadir, signifying the maximum deformation of the side edge waistline L1, which measures 13.9 mm. Following this minimum point, the curve begins to ascend, with an accelerated rate of increase in deformation. When the abscissa (x) decreases to −22.1 m, the deformation of L1 reaches 2.78 mm, constituting 20% of the maximum deformation. In the preceding section, the side edge waistline experiences substantial effects from frost heave, with deformations consistently exceeding 20% of the maximum. Conversely, in subsequent sections, the influence of frost heave diminishes, resulting in deformations less than 20% of the maximum. The deformation curves of L1 and L2 are approximately symmetrical about the straight-line y = 0, and the maximum deformation of the L2 deformation curve is 13.6 mm at x = −9.6 m. Beyond this point, the deformation gradually decreases. When the abscissa x decreases to −22.1 m, the deformation of L2 is 2.72 mm. It can be seen that the larger the clearance between the side tunnel and the proposed tunnel, the smaller the effect of frost heave and the smaller the deformation.
To assess the impact of frost heave induced by the frozen wall on the side tunnel, we define the strong influence section (m) as the segment where deformation exceeds 20% of the maximum deformation, and the weak influence section (n) where deformation is below this threshold. The freezing length of the end is l, and h represents the clearance from the side tunnel to the proposed tunnel. The influence coefficient η is defined as η = m/L. Details of the influence coefficient parameters are depicted in Figure 11.
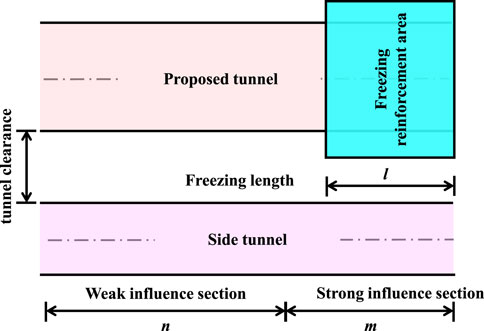
Figure 11. Influence coefficient related parameters schematic diagram.
In the case of the left side tunnel, the strong influence section (m) spans 22.1 m, with a freezing length of the end at 16 m. The clearance (h) from the left side tunnel to the proposed tunnel measures 8.84 m. Consequently, the influence coefficient η of frost heave on the left side tunnel edge waistline is determined as 1.38.
Given a defined clearance (h) from the side tunnel to the proposed tunnel, the influence range of the side tunnel can be inferred using the influence coefficient and the freezing length of the end. As h increases from 8.84 m (clearance from the left side tunnel to the proposed tunnel) to 9.15 m (clearance from the right-side tunnel to the proposed tunnel), the length of the strong influence section (m) decreases marginally from 22.1 m to 22.0 m. Consequently, the influence coefficient (η) adjusts to 1.375. The results show that under the condition that the freezing length of the end and the thickness of the frozen wall are constant, the farther the side edge waistline is from the frozen wall, the smaller the value of the influence coefficient η and the shorter the strong influence section m. The influence coefficient η reflects that the influence strength of frost heave on the existing pipeline depends on the parameters such as the freezing length of the end and the distance between the frozen wall and the existing pipeline. Combined with the tunnel segment’s stiffness, the side tunnel’s affected area should be regarded, and the strongly affected area needs to be reinforced in the project.
5.2 The impact on the upper subway tunnel
The distribution of Mises stress along the subway tunnel side edge line is illustrated in Figure 12. The side edge waistline L3, located near the working shaft, represents the waistline, while side edge line L4 corresponds to the centerline of the subway tunnel floor. Detailed stress and deformation characteristics of side edge lines L3 and L4 are presented in Figure 13.
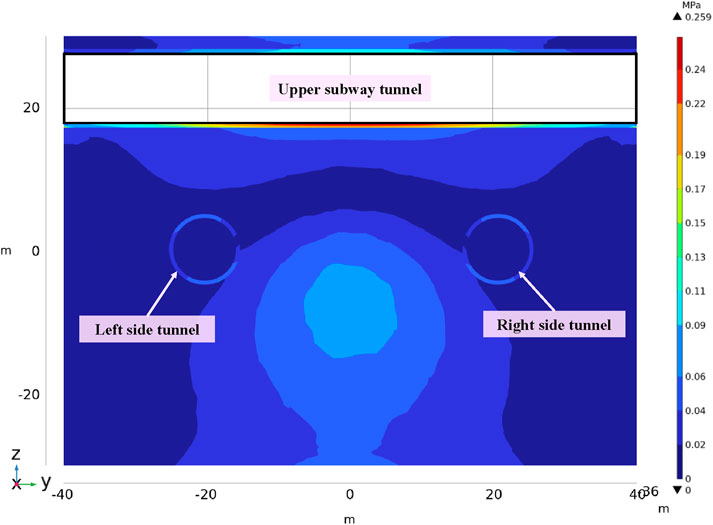
Figure 12. Mises stress distribution along the upper subway tunnel side edge lines.
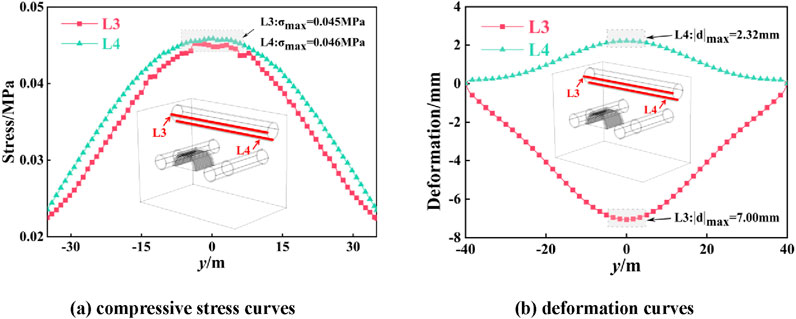
Figure 13. The stress and deformation curves of side edge lines L3 and L4. (A) Compressive stress curves. (B) Deformation curves.
From Figure 13A, it is evident that both side edge lines L3 and L4 exhibit signs of frost heave, as evidenced by similar patterns in their compressive stress curves. Maximum compressive stresses occur at y = 0 for both lines. Specifically, the maximum compressive stresses for side edge lines L3 and L4 are 0.045 and 0.046 MPa, respectively. As the distance from the side edge line increases, compressive stress gradually diminishes on both sides. Notably, at equivalent abscissa positions, the compressive stress on L3 consistently registers slightly lower than that on L4.
The proximity of side edge lines L3 and L4 to the freezing area results in stress differences that are independent of this distance. Analysis from Figure 13B reveals that side edge line L3 undergoes primarily vertical deformation, peaking at 7.00 mm at y = 0. In contrast, side edge line L4 experiences predominantly horizontal deformation, with a maximum of 2.32 mm, also at y = 0. This observation underscores the stronger frost heave effect along the diameter of the frozen pipes induced by freezing at tunnel end, with relatively weaker stress released along the axial direction.
5.3 The impact on the end diaphragm wall
During the active freezing period, the frost heave effect of the end diaphragm wall adjacent to the freezing zone intensifies as the freezing front advances. To ensure the stability and safety of the end diaphragm wall, an analysis of its stress state during freezing is crucial. Figure 14 illustrates the distribution of Mises stress on the inner surface of the end diaphragm wall.
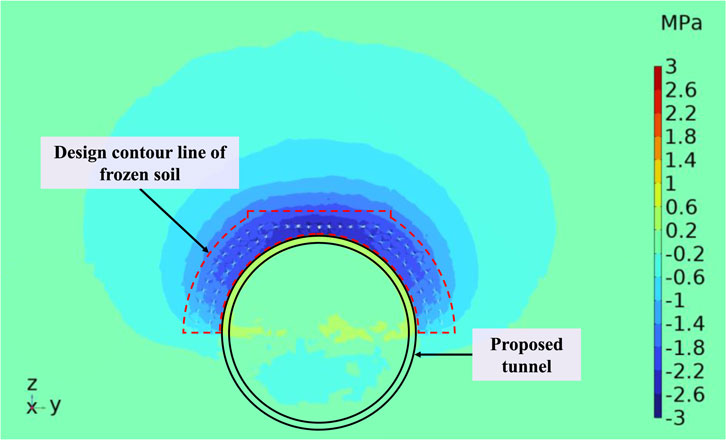
Figure 14. Mises stress distribution on the inner surface of the end diaphragm wall.
Affected by the horizontal freezing at the end, the equivalent stress on the inner surface of the end diaphragm wall is mainly concentrated near the frozen wall. The maximum equivalent stress reaches 0.99 MPa at the waistline of the proposed tunnel. Monitoring line L5, defined as the intersection between the inner surface of the end diaphragm wall and the proposed tunnel, whose deformation is illustrated in Figure 15.
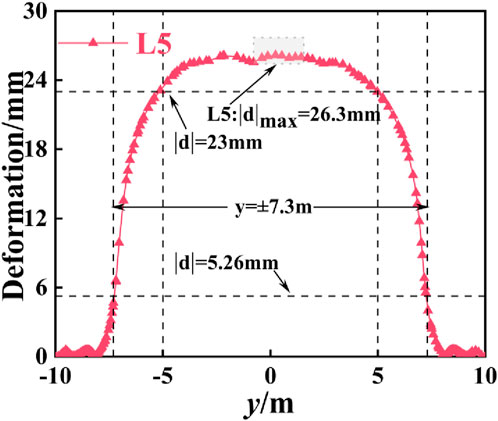
Figure 15. Monitoring line L5 deformation curve.
Figure 15 indicates that the deformation curve of monitoring line L5 is symmetrically distributed around the straight line y = 0. Within the range of y = −5 to 5, points on L5 exhibit deformations exceeding 23 mm, with a maximum deformation reaching 26.3 mm. As the point on monitoring line L5 moves beyond y = ± 5 in both directions, the deformation curve enters a rapid decline phase. At the position that y = ± 7.3 m, the deformation measures 5.26 mm, representing about 20% of the maximum deformation observed. Further movement shows that deformation along monitoring line L5 decreases to less than 5.26 mm. This underscores that the primary deformation occurs within the frozen wall area of the semicircular arch, with the remaining sections experiencing minor deformation effects.
6 Conclusion
Based on the horizontal freezing reinforcement project for a proposed tunnel shield receiving end, a comprehensive three-dimensional numerical model employing “thermal-mechanical” coupling has been developed. Upon the model described above, the temperature variations within the reinforcement range during different freezing stages were analyzed. Furthermore, the mechanical effects of frost heave on the existing structures, specifically the side tunnel, the upper subway tunnel, and the end diaphragm wall were investigated. The principal findings are as follows:
(1) Initially, frozen soil predominantly accumulates around the freezing pipes. As freezing progresses over subsequent days, the frozen wall gradually forms and thickens, causing the boundary of frozen soil to extend towards the contour line defined by the designed freezing thickness. In the later stages of freezing (43 days), the development of the frozen soil exceeds the contour line specified for the 2.5 m frozen wall according to design requirements, thereby accurately simulating the evolution of the engineering temperature field.
(2) Compressive stress distribution in the side tunnel, the upper subway tunnel, and the end diaphragm wall predominantly affects the tunnels adjacent to the freezing zone, with those farther removed experiencing negligible frost heave effects. It has been determined that under conditions of constant the length of the freezing pipes and frozen wall thickness, the distance of approximately 9 m from the side tunnel to the proposed tunnel results in a highly influenced range of approximately 1.4 times the freezing length of the end. As the distance from the side edge waistline to the frozen wall increases, the influence coefficient η decreases, thereby reducing the length of the strong influence section.
(3) The primary deformation of the upper subway tunnel occurs vertically, with a maximum displacement of 7.00 mm, whereas the maximum horizontal deformation is only 33% of the vertical displacement. These findings indicate that the frost-heaving effect generated by freezing at the tunnel end is more pronounced along the diameter of the freezing pipes, while axial release strength is comparatively weaker.
(4) Since the model is only for this engineering condition, the research considers the freezing condition under hydrostatic conditions. Further research is needed in the future to address the impact of dynamic water on the development of frost heave in practical engineering.
Data availability statement
The original contributions presented in the study are included in the article/supplementary material, further inquiries can be directed to the corresponding author.
Author contributions
ZH: Conceptualization, Funding acquisition, Methodology, Software, Writing–review and editing, Writing–original draft. SF: Data curation, Methodology, Visualization, Writing–original draft. YW: Data curation, Methodology, Writing–original draft. YZ: Validation, Writing–review and editing. LL: Validation, Writing–review and editing.
Funding
The author(s) declare that financial support was received for the research, authorship, and/or publication of this article. This research was supported by National Natural Science Foundation of China (No. 52108386). The authors are deeply indebted to the financial support.
Conflict of interest
Author YW was employed by China Construction Eighth Engineering Division Co., Ltd.
The remaining authors declare that the research was conducted in the absence of any commercial or financial relationships that could be construed as a potential conflict of interest.
Generative AI statement
The author(s) declare that no Generative AI was used in the creation of this manuscript.
Publisher’s note
All claims expressed in this article are solely those of the authors and do not necessarily represent those of their affiliated organizations, or those of the publisher, the editors and the reviewers. Any product that may be evaluated in this article, or claim that may be made by its manufacturer, is not guaranteed or endorsed by the publisher.
References
Alzoubi, M. A., Xu, M., Hassani, F. P., Poncet, S., and Sasmito, A. P. (2020). Artificial ground freezing: a review of thermal and hydraulic aspects. Tunn. Undergr. Space Technol. 104, 103534. doi:10.1016/j.tust.2020.103534
Cai, H., Hong, R., Xu, L., Wang, C., and Rong, C. (2022). Frost heave and thawing settlement of the ground after using a freeze-sealing pipe-roof method in the construction of the Gongbei Tunnel. Tunn. Undergr. Space Technol. 125, 104503. doi:10.1016/j.tust.2022.104503
Cai, H., Li, S., Liang, Y., Yao, Z., and Cheng, H. (2019b). Model test and numerical simulation of frost heave during twin-tunnel construction using artificial ground-freezing technique. Comput. Geotech. 115, 103155. doi:10.1016/j.compgeo.2019.103155
Cai, H., Liu, Z., Li, S., and Zheng, T. (2019a). Improved analytical prediction of ground frost heave during tunnel construction using artificial ground freezing technique. Tunn. Undergr. Space Technol. 92, 103050. doi:10.1016/j.tust.2019.103050
Everett, D. H. (1961). The thermodynamics of frost damage to porous solids. Trans. Faraday Soc. 57, 1541–1551. doi:10.1039/tf9615701541
Gao, X., Li, M., and Zhang, J. (2021). Field test of shield horizontal freezing method in complex site. J. Shenyang Jianzhu Univ. Nat. Sci. 37 (04), 659. (in Chinese). doi:10.11717/j.issn:2095-1922.2021.04.11
Hong, Z., Hu, X., and Fang, T. (2020). Analytical solution to steady-state temperature field of Freeze-Sealing Pipe Roof applied to Gongbei tunnel considering operation of limiting tubes. Tunn. Undergr. Space Technol. 105, 103571. doi:10.1016/j.tust.2020.103571
Hu, X., Wu, Y., and Guo, W. (2019). Forensic investigation of a water inrush accident during ground freezing recovery work. J. Perform. Constr. Facil. 33. doi:10.1061/(asce)cf.1943-5509.0001290
Kleinlugtenbelt, R. E., Drijver, R. N., Haring, F. P. H., Schulze, C., and Friedemann, W. (2013). Applying the lost shield method by freezing to connect bored tunnels to Rokin station on the North/South metro line, Amsterdam. Undergr. - WAY FUTURE, 1559–1566. doi:10.1201/b14769-214
Koyama, Y. (2003). Present status and technology of shield tunneling method in Japan. Tunn. Undergr. Space Technol. 18, 145–159. doi:10.1016/s0886-7798(03)00040-3
Levin, L., Golovatyi, I., Zaitsev, A., Pugin, A., and Semin, M. (2021). Thermal monitoring of frozen wall thawing after artificial ground freezing: case study of Petrikov Potash Mine. Tunn. Undergr. Space Technol. 107, 103685. doi:10.1016/j.tust.2020.103685
Li, F. (2009). Research on superposition method of interaction between soil frost heave and beams on foundation. Rock Soil Mech. 30 (1), 79–85. (in Chinese). doi:10.3969/j.issn.1000-7598.2009.01.012
Liu, X., Zhao, Y., and Xie, W. (2022). Application of horizontal freezing method in the reinforcement of shield launching and receiving portals in Wuxi Metro Station. China Metro 25 (1), 75. (in Chinese). doi:10.16037/j.1007-869x.2022.01.015
Miller, R. D. (1972). Freezing and heaving of saturated and unsaturated soils. Highw. Res. Rec. 393, 1–11.
Nishioka, I., Kawase, O., Namikawa, K., Endo, K., Broch, E., Rogers, C., et al. (2004). Excavation of Japan's largest shield tunnels in the heart of Tokyo Metropolitan area; the Nishi-Shinjuku Tunnel. Tunn. Undergr. Space Technol. 19, 346. doi:10.1016/j.tust.2004.01.040
Padilla, F., Villeneuve, J., and Stein, J. (1997). Simulation and analysis of frost heaving in subsoils and granular fills of roads. Cold Reg. Sci. Tech. 25, 89–99. doi:10.1016/s0165-232x(96)00018-3
Park, S., Hwang, C., Yang, S., Choi, H., Ko, T. Y., and Son, Y. (2023). Investigation of the effect of ground freezing on shield tunnel restoration. United Kingdom: CRC Press, 2154–2160.
Russo, G., Corbo, A., Cavuoto, F., and Autuori, S. (2015). Artificial Ground Freezing to excavate a tunnel in sandy soil. Measurements and back analysis. Tunn. Undergr. Space Technol. 50, 226–238. doi:10.1016/j.tust.2015.07.008
Wang, T., Ye, W., and Liu, L. (2023). Study on the mechanical properties and acoustic emission signal characteristics of freezing pipe. Front. Earth Sci. 11. doi:10.3389/feart.2023.1298025
Xiang, H., Zhang, G., Cheng, P., Hu, J., Wang, Z., and Zeng, D. (2023). Analyses of the ground surface displacement under reinforcement construction in the shield tunnel end using the artificial ground freezing method. Appl. Sci. 13, 8508. doi:10.3390/app13148508
Yang, N., Zheng, H., Cai, H., Liu, Y., and Nishimura, S. (2024). Study on multidimensional frost heave characteristics and thermal-hydro-mechanical predictive model. Cold Reg. Sci. Tech. 224, 104227. doi:10.1016/j.coldregions.2024.104227
Yang, P., Ke, J., Wang, J. G., Chow, Y. K., and Zhu, F. (2006). Numerical simulation of frost heave with coupled water freezing, temperature and stress fields in tunnel excavation. Comput. Geotech. 33, 330–340. doi:10.1016/j.compgeo.2006.07.006
Yang, Z., Peng, F., Qiao, Y., and Hu, Y. (2019). A new cryogenic sealing process for the launch and reception of a tunnel shield. Tunn. Undergr. Space Technol. 85, 406–417. doi:10.1016/j.tust.2019.01.007
Zhang, R., Xiong, H., Su, D., Han, W., Li, Q., and Chen, X. (2024). Micromechanical investigation into the mechanism of slurry fracturing and the effect of covering depth concerning shield tunneling in a sandy stratum. Tunn. Undergr. Space Technol. 144, 105538. doi:10.1016/j.tust.2023.105538
Zhang, Z., and Huang, M. (2014). Geotechnical influence on existing subway tunnels induced by multiline tunneling in Shanghai soft soil. Comput. Geotech. 56, 121–132. doi:10.1016/j.compgeo.2013.11.008
Zhelnin, M., Kostina, A., Prokhorov, A., Plekhov, O., Semin, M., and Levin, L. (2022). Coupled thermo-hydro-mechanical modeling of frost heave and water migration during artificial freezing of soils for mineshaft sinking. J. Rock Mech. Geotech. Eng. 14, 537–559. doi:10.1016/j.jrmge.2021.07.015
Zhou, T., Hua, Y., and Lv, B. (2009). Stochastic prediction for frost heave effect of a subway tunnel. J. Glaciol. Geocryol. 31 (1), 119–123. (in Chinese).
Keywords: horizontal freezing, shield tunnel, existing structure, frost heave, numerical simulation
Citation: Hong Z, Fu S, Wu Y, Zhang Y and Lu L (2025) Numerical research on the impact of horizontal freezing on existing underground structures in shield reception. Front. Earth Sci. 12:1511744. doi: 10.3389/feart.2024.1511744
Received: 15 October 2024; Accepted: 31 December 2024;
Published: 23 January 2025.
Edited by:
Giovanni Martinelli, National Institute of Geophysics and Volcanology, ItalyReviewed by:
Junhao Chen, Fujian University of Technology, ChinaHaibing Cai, Anhui University of Science and Technology, China
Copyright © 2025 Hong, Fu, Wu, Zhang and Lu. This is an open-access article distributed under the terms of the Creative Commons Attribution License (CC BY). The use, distribution or reproduction in other forums is permitted, provided the original author(s) and the copyright owner(s) are credited and that the original publication in this journal is cited, in accordance with accepted academic practice. No use, distribution or reproduction is permitted which does not comply with these terms.
*Correspondence: Zequn Hong, enFob25nQGN1bXQuZWR1LmNu