- 1School of Geography, Earth and Atmospheric Sciences, University of Melbourne, Melbourne, VIC, Australia
- 2Peter Cook Centre for Carbon Capture and Storage Research, University of Melbourne, Melbourne, VIC, Australia
Rock properties at cm-scale impact geological carbon storage by enhancing capillary and mineral trapping. Hence, it is important to accurately capture their distribution in geo-models which are used for numerically estimating the fate of injected CO2. However, there could be high variability in the cm-scale distribution of rock properties even close to wells which is not captured with traditional workflows. This study explores the impact of grid cell resolution, seismic inversion and placement of an additional well in proximity to CO2 injection well on improving the representation of cm-scale lithological heterogeneity in the near well bore region in geological models. We utilize wireline and seismic data from Parasequence-2 of the Paaratte Formation, Otway Basin, Australia, which is a shallow to coastal marine deltaic deposition comprising a high degree of lithological heterogeneity and a prospective unit for pilot scale geological carbon storage operations. The data was used to prepare a suite of reservoir models capturing the impact of above factors on the plausible distributions of facies, porosity and permeability in the formation. The analysis suggests that smaller grid cell size (1 m × 1 m × 0.3 m) compared to the typical industry standard (10 m × 10 m × 2 m) significantly improves the representation of cm-scale rock properties. Additionally, stochastic seismic inversion could play an important role in capturing rock property distribution even for smaller CO2 storage sites used for pilot scale injection operations. Further, we show that the placement of an additional well only 116-m away from the CO2 injection well can drastically improve the probability in the distribution of cm-scale rock properties in reservoir models.
1 Introduction
Geological carbon storage is a promising technology aimed at mitigating the rising CO2 concentration in the atmosphere (Metz et al., 2005). It involves injecting CO2 in the sub-surface, typically deeper than 800 m, where the gas is stored via structural, capillary, dissolution and mineral trapping mechanisms (Benson and Orr, 2008; Metz et al., 2005). The presence of cm-scale fluid flow barriers, also known as intraformational baffles (Gibson-Poole et al., 2009; Yu et al., 2017), enhance capillarity (Boon and Benson, 2021; Boon et al., 2022) and fluid-rock reactions (Hermanson and Kirste, 2013; Higgs et al., 2015; Mishra et al., 2023), further improving CO2 trapping capacities. Hence, it is important to accurately represent cm-scale variations in rock properties in geological models, which are used as the basis for running numerical simulations for estimating CO2 storage capacities (Pyrcz and White, 2015). The neglection of intraformational baffles in geological models might manifest as erroneous prediction of fluid flow at the site of interest (Dasheng, 2010; Qi and Zhang, 2009; Preux, 2016).
Conventionally, rock property representation in geological models is based on the integration of multi-scale information including seismic, wireline and core data which allows capturing geological features from kilometre to centi-metre scale (Cannon, 2018; American Petroleum Institute, 1988). However, the resolution of geological models is typically limited to a few 10s of metres horizontally and a few metres vertically to keep numerical simulations computationally feasible (Christie, 1996; Ringrose et al., 2008). Such coarse grid cell sizes essentially result in an under-representation of intraformational baffles in geological models (Branets et al., 2009). However, recent success in the development of reduced physics methods presents an opportunity for using high-resolution geological models in simulations (Gupta and Li, 2022; Kim et al., 2017; Mishra et al., 2024; Ni et al., 2021; Thanh and Lee, 2022; Wen et al., 2021).
Apart from grid cell size, the distance between the wells used to model the reservoir can also significantly impact the distribution of cm-scale rock properties. Usually, the wells could be placed several hundreds of metres apart in large operation fields to manage high costs of drilling. This could lead to a large uncertainty in the distribution of intraformational baffles in the inter-well region where seismic data is the only source of information (Ani et al., 2016; Bentley and Woodhead, 1998; Demyanov et al., 2019; Pyrcz and White, 2015). However, seismic data can at best capture large scale geological bodies due to its coarser resolution (Ringrose et al., 2008).
This study explores the impact of grid cell resolution and the importance of drilling wells in close proximity on the distribution of cm-scale rock properties in geological models. The analysis is based on the data from Parasequence-2 of the Paaratte Formation which is located within the Otway Basin, Australia (Dance, 2013). The parasequence comprises a high proportion of intraformational baffles (Dance, 2013) and is a prospective site for pilot scale CO2 storage operation as part of the GeoCquest Field Validation project. The project aims at using advanced reservoir modelling and numerical simulation approaches to blindly predict the migration and trapping of CO2 in the lithologically heterogeneous parts of the Parasequence and validate plume migration against real-time post-injection data. The project would involve an injection of about 10,000 tons of CO2¬ at a rate of approximately 150 tons/day and monitoring CO2 plume migration and saturation variation using seismic and pulsed neutron logging techniques. The site has been characterised in detail using seismic and wireline log data from 8 wells prior to the project. The project also involved the drilling of a new monitoring well located only 116 m away from the injection well.
This paper presents the geo-modelling component of the project focusing on appropriately capturing the variations in the distribution of cm-scale rock properties between the injection and the monitoring wells. We employ different approaches for building geo-models ranging from industry standard approach to advanced geo-modelling method where smaller grid cell sizes and stochastic seismic inversion is utilized to obtain a more confident distribution of intraformational baffles. The additional value of having another well and respective core and wireline log data in close proximity to the injection well is also analysed.
2 Study area
2.1 Overview
The study is based on data from CO2CRC Limited’s Otway International Test Centre, which hosts a sub-surface CO2 injection facility for pilot scale projects. The site is located about 300 km southwest of Melbourne (Australia) and is part of the Otway Basin (Figure 1). In the sub-surface, the injection interval lies within the Parasequence-2 of the Paaratte Formation.
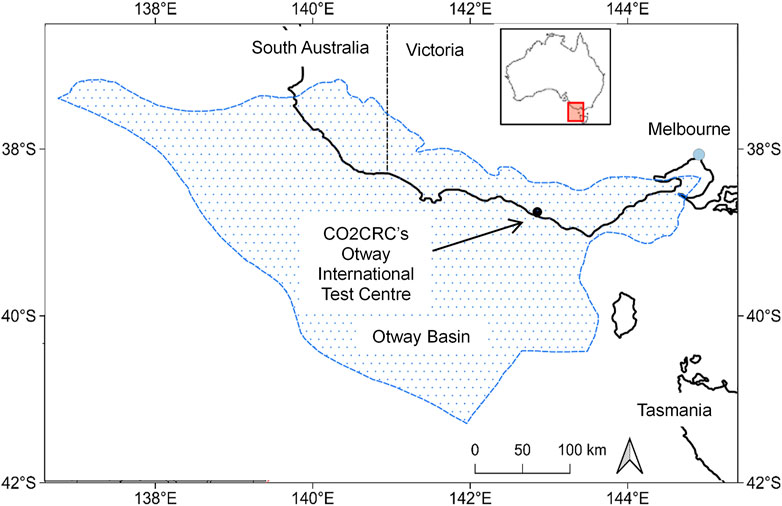
Figure 1. Location of the CO2CRC Limited’s Otway international test centre within the Otway basin (modified after Mishra et al., 2023).
2.2 Basin evolution
Otway Basin lies along the south-eastern margin of the continent of Australia and occupies an area of 150,000 km2 with a maximum thickness of 8 km (Dance, 2013). The basin originated in Tithonian-Barremian in a rift-to-passive margin setting coinciding with the separation of Australia and Antarctica (Dance, 2013; Holford et al., 2011; Willcox and Stagg, 1990). The rifting resulted in thermal and passive margin subsidence (Cande and Mutter, 1982; Dance, 2013). This was followed by six major cycles of sea level change between Late Cretaceous and Quaternary which led to the formation of five groups (oldest to youngest): Otway, Sherbrook, Wangerrip, Nirranda and Heytesbury. The Otway Group formed by tectonic activity where sediments ranged from volcaniclastic at the base to fluvial and shallow lacustrine at the top and comprised interbedded carbonaceous shale, basalts with interbedded volcaniclastic sandstone, mudstone and coal (Woollands and Wong, 2001). The Sherbrook Group was deposited under marginal marine conditions within a low stand system tract at the base to upper deltaic plain environment within a high stand system tract at the top (Boyd and Gallagher, 2001; Woollands and Wong, 2001). In terms of sediment composition, the group comprises shale, black pyritic mudstone, siltstone, interbedded calcareous sandstone and coarse-grained sandstone (Woollands and Wong, 2001). The Wangerrip Group consists of transgressive-regressive units deposited in a low energy marginal marine environment at the base to shallow-marine environment at the top and consists of carbonaceous claystone, mudstone and sandstone (Woollands and Wong, 2001). The Nirranda Group developed under open marine conditions and consists of mixed carbonates and siliciclastic sediments. The topmost Heytesbury Group deposited under inner shelf conditions at the base to mid-shelf conditions at the top. The group is characterised by open marine carbonate sequences (Woollands and Wong, 2001).
For the current study, the stratigraphic interval of interest is a part of the Paaratte Formation belonging to the Sherbrook Group. The formation occurs between depths of 1120–1570 m where the deposition took place under a lower delta plain environment (Boyd and Gallagher, 2001; Dance, 2013). Structurally, the Paaratte Formation is a low dipping faulted anticline with dip ranging between 2° and 5° towards the north (Dance, 2013). The formation comprises three member units, Unit A, Unit B and Unit C. Unit A (lowermost) comprises three-fourth order parasequences with Parasequence-1 at the bottom and Parasequence-3 at the top (Dance, 2013). The current study utilizes data from Parasequence-2 which is composed of coastal to shallow marine deltaic sequence (Boyd and Gallagher, 2001; Dance, 2013). In terms of lithology, the parasequence comprises sandstone, siltstone and mudstone with carbonate-cemented intervals (Woollands and Wong, 2001). The data depicts the presence of mm-to cm-scale lithological heterogeneity (Mishra et al., 2019).
3 Available data
The data utilized in this study was provided by CO2CRC Limited and included facies and wireline logs and seismic data. The logs were available from the 9 wells in the study area: CRC-1, CRC-2, CRC-3, CRC-4, CRC-5, CRC-6, CRC-7, CRC-8 and Naylor-1. Out of these, CRC-3 and CRC-8 serve as CO2 injection and monitoring wells, respectively. Additionally, information on fault surfaces was also available. The following sections provide a detail overview of the available datasets.
3.1 Facies and wireline logs
The facies logs for the 9 wells showed the presence of 4 depositional facies environments: delta front, distal mouth bar, proximal mouth bar and distributary channel. Additionally, the presence of carbonate-cement, a post-depositional facies caused by the diagenesis of sandstones (Dance, 2013), was also identified. The reservoir section comprised primarily of 3 facies: proximal mouth bar, distributary channel and carbonate-cement. The delta front facies existed as a caprock unit while distal mouth bar was proportionally insignificant. The facies logs are shown in Figure 2.
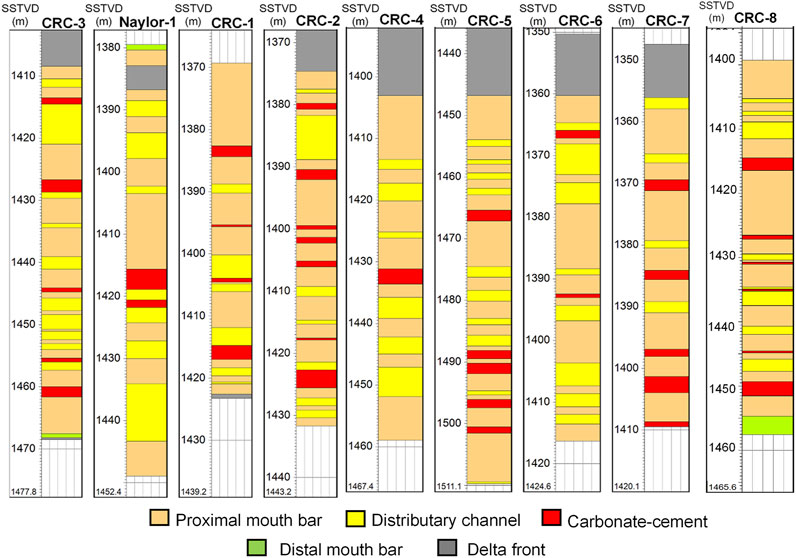
Figure 2. Available facies logs for the 9 wells in the study area for Parasequence-2. The reservoir unit comprises three facies-proximal mouth bar, distributary channel and carbonate-cemented intervals.
The wireline data included sonic, gamma ray, density, neutron porosity and total permeability logs (Figure 3). The sonic and the density logs were available for Naylor-1, CRC-1, CRC-2 and CRC-3 wells while the other logs were available for all the wells. The logs had a resolution of 10 cm for the Naylor-1 well, 15 cm for CRC-1 and CRC-2 wells and 5 cm for the other wells.
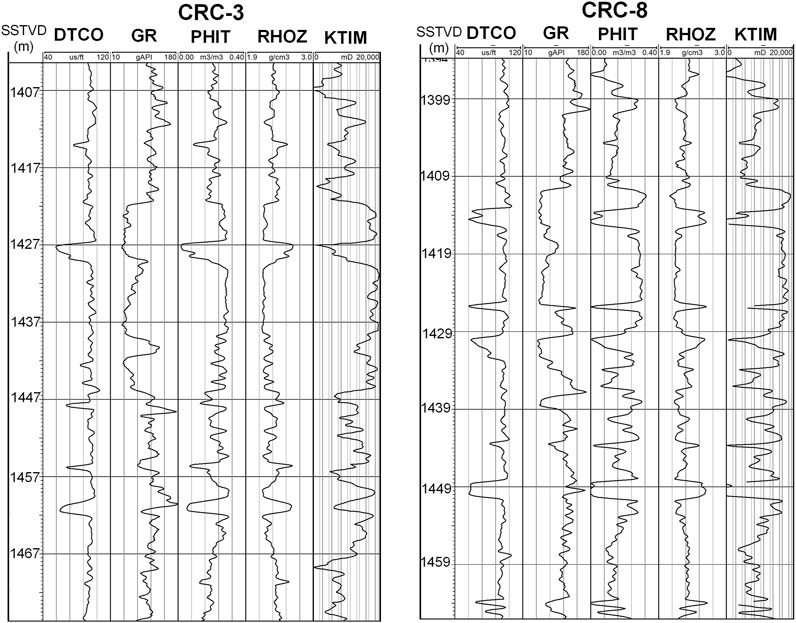
Figure 3. Available wireline logs (DTCO: compressional wave delay time, GR: gamma ray, PHIT: neutron porosity, RHOZ: density and KTIM: total permeability) for the CRC-3 and CRC-8 wells. Similar logs were available for the other wells in the study area.
3.2 Seismic data
The available 3D seismic data (Figure 4) had a lateral resolution of 7.5 m × 7.5 m and a sampling rate of 2 milli-seconds. The high-resolution data was sampled with a dominant frequency range spanning from 8 Hz to 60 Hz. The high sampling rate along with wide range of frequency allowed picking up not only regional scale structural and stratigraphic features, but also fine scale features captured by seismic waveforms.
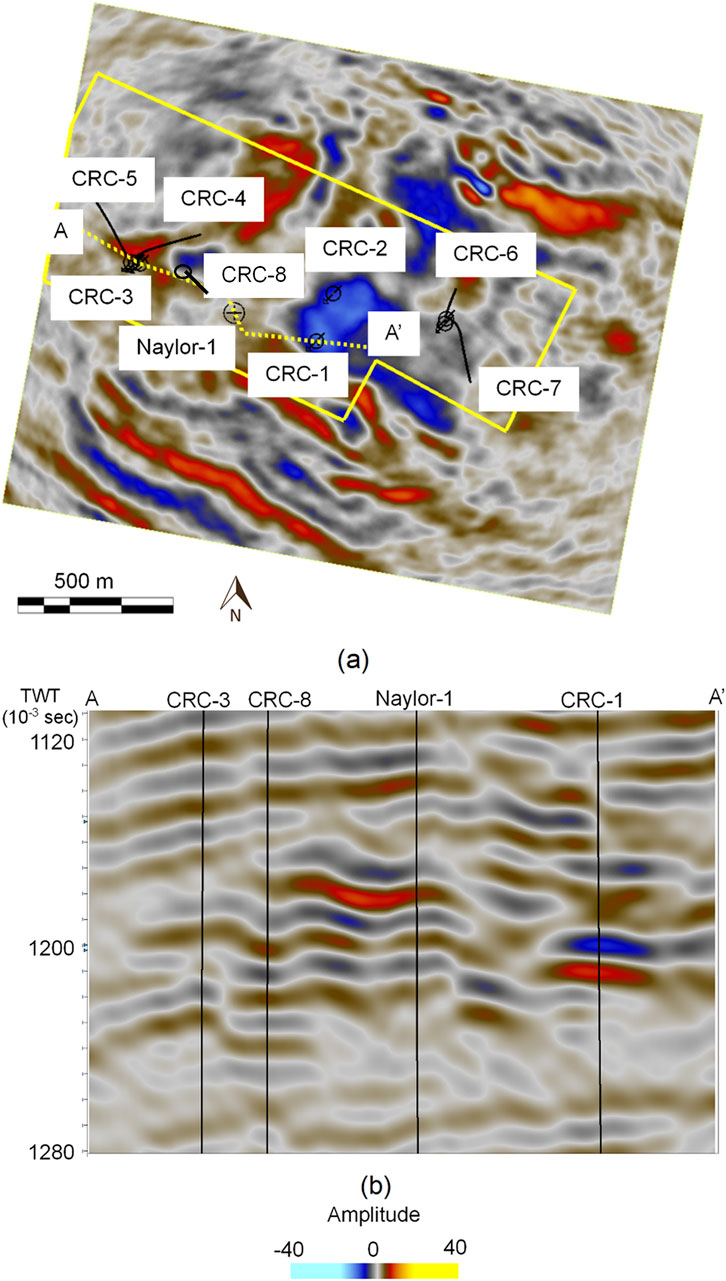
Figure 4. Available seismic data for the study area in (A) plan view; and (B) cross-sectional view. The yellow outline and circles in figure (A) show the boundaries of the modelled region and well-top locations, respectively. The cross-sectional view in figure (B) is shown for the composite line A-A′ represented in figure (A). The location of wells is superimposed. Wells CRC-6 and CRC-7 are deviated wells drilled from the same well-top.
4 Methodology
4.1 Modelled realizations and resolutions
Four different modelling approaches have been tried in this study. The first approach represents the conventional industry-standard geomodelling method where grid cell sizes are limited to 10 m laterally and 2 m horizontally. Additionally, seismic data was not used under this approach considering the argument that the coarser resolution of the seismic data might not be useful to improve rock property distribution for a pilot project site which is relatively smaller compared to a commercial scale CO2 storage site. The second approach uses the same grid resolution but includes seismic data. The third approach utilizes high-resolution grid with a cell size of 1 m laterally and 30 cm vertically and is aimed to better capture the distribution of intraformational baffles in the reservoir. However, seismic data was not included in this approach. The final approach utilizes the higher resolution grid along with seismic data. Additionally, the impact of having a monitoring well located only 116 m away from the injection well on rock property distribution is also presented for each of the approaches. Together, these approaches allow a holistic comparison of the plausible distributions of facies, porosity and permeability in the parasequence as well as an assessment of the impact of grid cell resolution, seismic inversion and the proximity of the wells. The rationale behind high-resolution scenarios was to capture the details of lithological variability while the low-resolution scenarios were aimed at achieving computational boost for subsequent dynamic simulations. The low-resolution models were developed independently to high-resolution models rather than upscaling the latter. The scenarios also allow to estimate the reduction in uncertainty of rock property distribution by including seismic data as well as the presence of monitoring well. Seismic inversion could be particularly important in detecting the distribution of carbonate-cemented intervals within sand- and siltstone units. Such cemented intervals could serve as baffles significantly affecting fluid and multiphase flow in reservoirs (Gibson-Poole et al., 2009). The total number of grid cells in the high-resolution realizations were ∼270 million while the low-resolution models comprised a total of ∼0.5 million cells. The modelling was carried out in the Petrel™ software package.
4.2 Seismic inversion
Inversion was performed on seismic data using the deterministic and the stochastic approaches. Deterministic seismic inversion strives to derive a singular, best-fit model for subsurface parameters by minimizing the disparity between observed and predicted seismic responses. This approach assumes that the subsurface is defined by unique and well-understood properties. In contrast, stochastic seismic inversion integrates well log data to generate a spectrum of plausible models instead of a single deterministic solution. This approach acknowledges the inherent uncertainties in subsurface conditions. It employs statistical methods to downscale the seismic data to address uncertainties in subsurface properties, contributing to a more thorough comprehension of subsurface heterogeneity. Both deterministic and stochastic inversion methodologies are integral to reservoir characterization and the selection between the two hinges on the geological intricacy of the region and the extent of uncertainty factored into the modelling process (Rashad et al., 2022).
Seismic inversion was undertaken using data from five vertical wells, namely CRC-1, 2, 3, 8 and Naylor-1. These wells were selected due to the availability of sonic, density, and check-shot information. The initial steps involved check-shot correction to refine the seismic data, followed by wavelet estimation and synthetic well tie processes. The deterministic and the statistical methods were both tested for wavelet estimation and the latter approach was chosen. Subsequently, a low-frequency model (LFM) was generated using a 12 Hz cut-off, setting the basis for seismic deterministic inversion. This was further used to derived 25 realizations based on a combination of geostatistical analysis and Bayesian inversion, leveraging both horizontal and vertical variograms of the acoustic impedance (AI) log. This comprehensive methodology enhances the reliability of our seismic inversion results, contributing to a more accurate representation of subsurface structures.
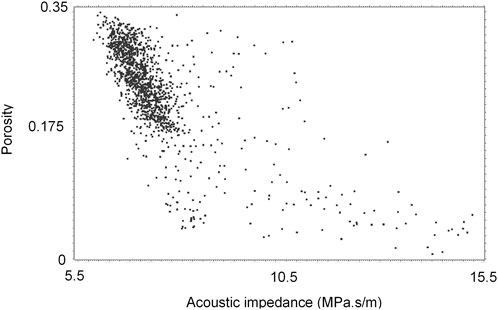
The acoustic impedance and porosity logs (Figure 5) were correlated to develop seismic porosity and facies cubes. The correlation coefficient was −0.73 indicating the existence of a strong relationship between the two variables. By leveraging this correlation, seismic inversion methodologies facilitate the estimation of subsurface porosity and ultimately seismic facies.
The stochastic inversion was implemented on the modelled domain discretised into a grid cell sizes of 1 m × 1 m × 0.3 m.
4.3 Property modelling
The distributions of three reservoir properties: facies, porosity and permeability were modelled for the domain of interest using the methods described below.
4.3.1 Facies modelling
The distribution of facies within the reservoir section of the model was derived using the Sequential Indicator Simulation (SIS) approach. The SIS method is widely utilized in reservoir characterization, specifically for the modelling of spatial distributions of categorical variables such as geological facies. The method relies on a training image that represents the spatial variability of the categorical variable, capturing intricate patterns and relationships within geological formations of interest. The categorical variable is transformed into binary representations through the use indicator variables, indicating the presence or absence of specific categories at each location. The SIS method involves simulations for each location along a random path through the model space. A crucial aspect of its effectiveness lies in the conditional simulation step, where the simulation at a given location is influenced by the observed data in its proximity, establishing a conditional probability distribution. The algorithm iteratively repeats this process for each location, gradually constructing a simulated distribution that replicates the spatial patterns observed in the training image and the conditioning data (Zhou et al., 2018). Post-processing steps may be applied subsequently to ensure the model aligns with statistical properties and the known spatial patterns. Further confidence in the accuracy and reliability of the generated facies model is gained through validation against well data.
The SIS approach relies on the implementation of variograms which were derived for each of the three facies comprising the reservoir section. A spherical variogram was fit to the facies log data for the two resolutions of interest to derive the major, minor and vertical ranges as well as azimuth were derived. Additionally, separate variograms were derived for pre- and post-drilling of the monitoring well (Supplementary Tables S1–S4). The high- and the low-resolution models had the same major and minor ranges and the azimuths. However, the vertical range had minor differences. The inclusion of the monitoring well slightly changed the variograms ranges (Supplementary Tables S1–S4).
4.3.2 Porosity modelling
Porosity distribution in the modelled domain was implemented using Gaussian Random Function Simulation (GRFS) which is a geostatistical method for simulating the spatial distribution of subsurface attributes such as porosity and permeability. GRFS is a conditional simulation method based on parallel kriging. GRFS utilizes gaussian distributions to generate spatially correlated values throughout the reservoir area. This is achieved by generating random values of porosity at each grid cell based on the average property value and a covariance function.
The distribution of porosity also requires variogram based parameters which were derived by fitting spherical variograms to the observed neutron porosity data for each of the three facies within the reservoir section. The major and minor ranges and the azimuth were same as the variogram parameters for the three facies models for both the resolutions. However, the vertical range for the porosity variograms were different (Supplementary Tables S5–S8). Again, separate variograms were derived for pre- and post-drilling of the monitoring well (Supplementary Tables S5–S5).
Additionally, porosity distribution was conditioned to facies distribution to ensure consistency across the two approaches. For the scenarios where seismic data was incorporated, the average of seismic porosity values was used as a secondary variable. This allowed integration of seismic trend and variogram parameters.
4.3.3 Permeability modelling
Variograms based on total permeability logs were derived to capture the spatial continuity of permeability within the reservoir. Similar to facies and porosity, spherical variograms were fit to the observed data with only the vertical ranges different for the two resolutions (Supplementary Tables S9–S12). The modelled porosity described in the previous section was used as a secondary variable to further constrain the distribution of permeability. This approach acknowledges the inherent correlation between porosity and permeability. Additionally, permeability modelling was conditioned to facies distribution (see section 4.3.1), ensuring that the generated permeability field honours the spatial distribution of geological facies within the reservoir. This integrated methodology provides a comprehensive representation of the permeability field, considering both the inherent correlations between porosity and permeability and the influence of facies on fluid flow properties. Separate variograms were derived for pre- and post-drilling of the monitoring well (Supplementary Tables S9–S12).
The vertical variograms for the high-resolution scenarios for the three facies and their porosity and permeability variations is shown in Supplementary Figure S1. The modelled variograms showed a close match with the observed lag distances for the 3 facies geo-bodies (Supplementary Figure S1A–C). However, there was slight mismatch between the two values for porosity (Supplementary Figure S1D–F) and permeability (Supplementary Figure S1G–I) distributions within the three facies. The mismatch was more pronounced for the carbonate-cemented facies (Supplementary Figure S1F, I) primarily due to the low sample size.
A summary of the modelling workflows and the mathematical background of different algorithms implemented in this study are provided in the Supplementary Material Section 1.
5 Results
The results are shown for one realization from each of the four approaches to present the variation in the distribution of properties.
5.1 Seismic inversion, seismic porosity and seismic facies
Deterministic seismic inversion captured large scale distribution of geological bodies and did not vary much pre- and post-drilling of the monitoring well, CRC-8 (Figures 6A, B). On the contrary, stochastic seismic inversion was able to capture high-resolution variation of geo-bodies which was sensitive to the presence of the CRC-8 well (Figures 6C, D). It must be noted that the vertical resolution of seismic amplitude and acoustic impedance derived using deterministic inversion are the same. However, the application of stochastic inversion improves the resolution of acoustic impedance as the well log data is integrated. The inclusion of the monitoring well resulted in better capturing of fine layers with high acoustic impedance, especially between CRC-3 and CRC-8 wells (Figure 6D). The acoustic impedance map was transformed to the distribution of seismic porosity (Figures 6E, F) using the relationship shown in Figure 5. This was done by averaging seismic porosity maps for 25 realizations obtained after stochastic inversion. Hence, the obtained seismic porosity maps (Figures 6E, F) seem smoothened. The values for 25 realizations were averaged in order to remove the effect of noise in the subsequent porosity modelling step. The seismic porosity distribution showed high porosity values between the depths of 1,430–1,450 m close to the CRC-3 well and between 1,400–1,420 m close to the CRC-1 well (Figures 6E, F). A major low porosity body was identified between the wells CRC-3 and Naylor-1. Additionally, two low porosity streaks were captured around the depths of 1,425 m and 1,460 m around the CRC-1 well (Figures 6E, F). Seismic porosity was quite sensitive to the presence of the monitoring well. It was observed that the inclusion of CRC-8 well resulted in better capturing of the low porosity zones between CRC-3 and CRC-8 as well as CRC-8 and Naylor-1 wells.
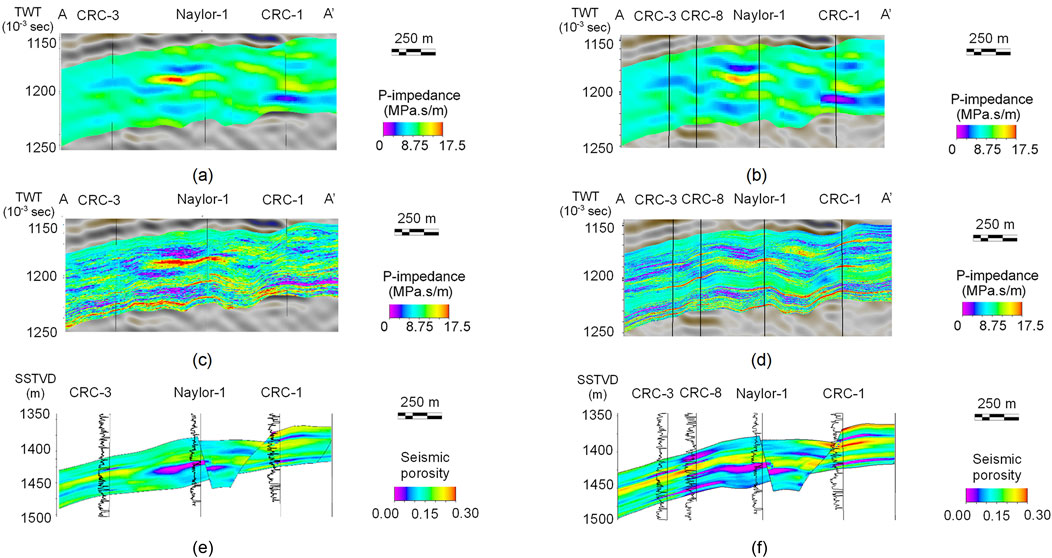
Figure 6. Deterministic seismic inversion for the scenarios (A) before; and (B) after drilling CRC-8 well. Stochastic seismic inversion for the scenarios (C) before; and (D) after drilling CRC-8 well. Seismic porosity for the scenarios (E) before; and (F) after drilling CRC-8 well. Wireline porosity logs are superimposed on figures (E) and (F) for comparison.
The seismic porosity distribution was used to derive the probabilities of the three reservoir facies with high, mid and low values representing the presence of proximal mouth bar (Figures 7A, B), distributary channel (Figures 7C, D) and carbonate cement (Figures 7E, F). The proximal mouth bar facies was dominantly present in the shallower and the deeper sections between the CRC-3 and Naylor-1 wells while a dominant carbonate cemented body was characterised between the two wells. However, the distribution of the three facies, especially carbonate-cement, was sensitive to the presence of the monitoring well. The inclusion of CRC-8 well resulted in capturing thin streaks of the carbonate-cement facies between the CRC-3 and CRC-8 wells.
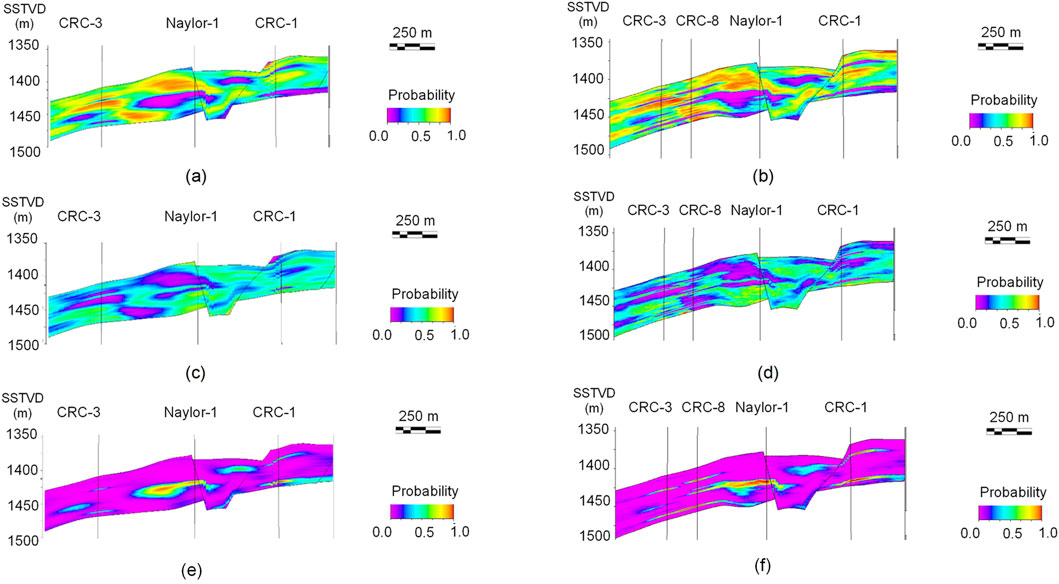
Figure 7. Probability of the proximal mouth bar facies for the scenarios (A) before; and (B) after drilling CRC-8 well. Probability of the distributary channel facies for the scenarios (C) before; and (D) after drilling CRC-8 well. Probability of the carbonate cement facies for the scenarios (E) before; and (F) after drilling CRC-8 well.
5.2 Facies and rock property distribution
The distributions of facies, porosity and permeability for one realization from each of the four approaches are presented in Figures 8–11. Overall, proximal mouth bar was the dominant facies followed by distributary channel and carbonate-cement. The first approach, which concurs with a more conventional industry standard choice of grid cell size and the exclusion of seismic data captures a very coarse scale distribution of the three geological facies (Figures 8A, B). With this approach, it was observed that the proximal mouth bar and distributary channel facies occur as continuous layers between CRC-3 and Naylor-1 wells if the monitoring well, CRC-8, did not exist. However, additional data of the newly drilled CRC-8 well altered the continuity and the thickness of these layers, especially for the distributary channel facies. The lateral continuity of the carbonate cemented facies was better captured in the scenario including the monitoring well. Consequently, the distribution of porosity (Fig, 8c,d) and permeability (Figures 8E, F) followed facies distribution in both the approaches. A high porosity-permeability layer was captured in the middle section of the reservoir for both the scenarios pre- and post-drilling of the CRC-8 well. However, the lower section of the reservoir showed lower porosity and permeability values in the realization including the monitoring well (Figures 8D, F).
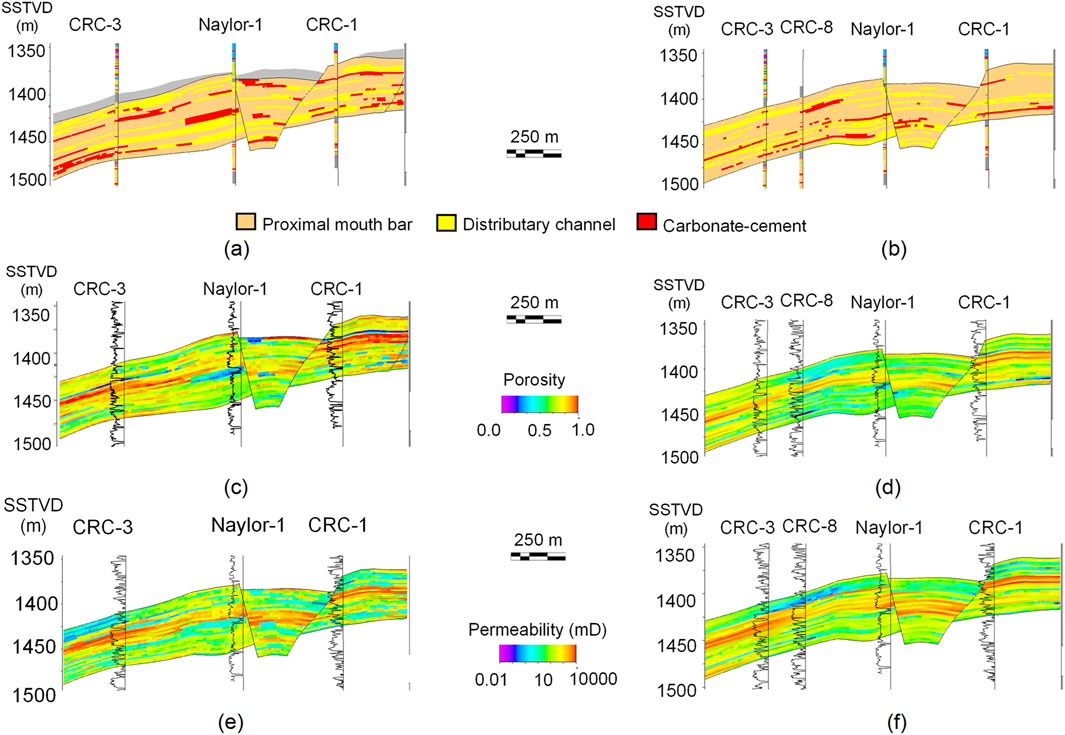
Figure 8. Distribution of geological facies (A) pre-; and (B) post-drilling of the monitoring well. Distribution of porosity (C) pre-; and (D) post-drilling of the monitoring well. Distribution of permeability (E) pre-; and (F) post-drilling of the monitoring well. These results are shown for the approach with grid cell size of 10 m × 10 m × 2 m excluding seismic data. Wireline logs of the respective properties are superimposed for comparison.
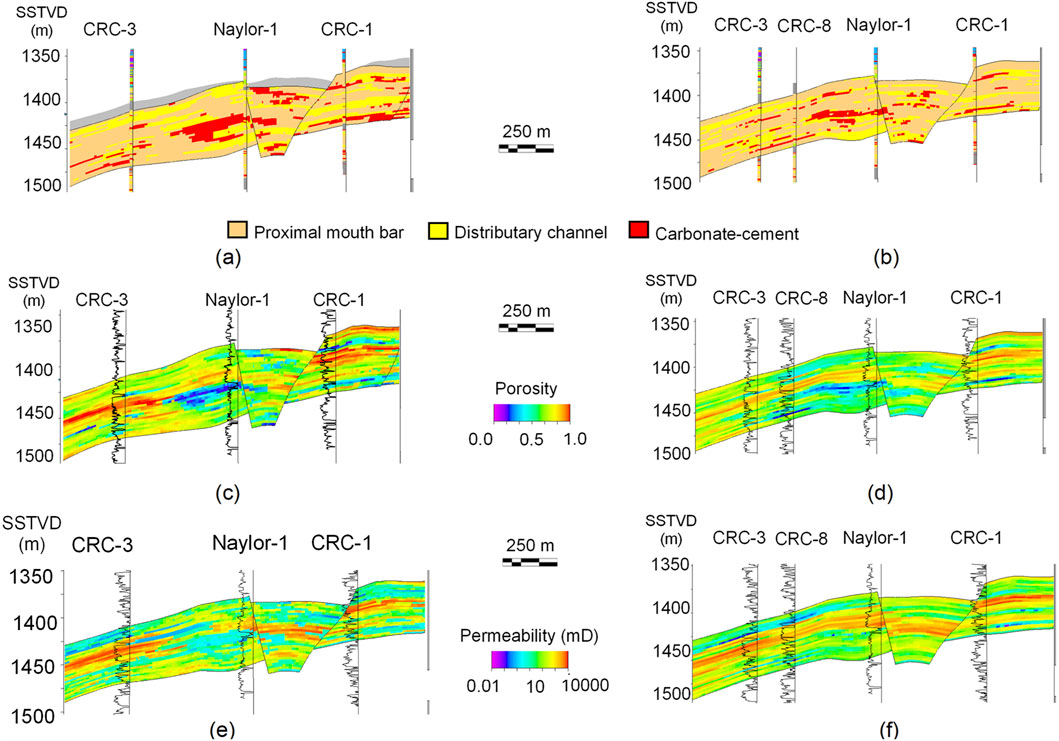
Figure 9. Distribution of geological facies (A) pre-; and (B) post-drilling of the monitoring well. Distribution of porosity (C) pre-; and (D) post-drilling of the monitoring well. Distribution of permeability (E) pre-; and (F) post-drilling of the monitoring well. These results are shown for the approach with grid cell size of 10 m × 10 m × 2 m including seismic data. Wireline logs of the respective properties are superimposed for comparison.
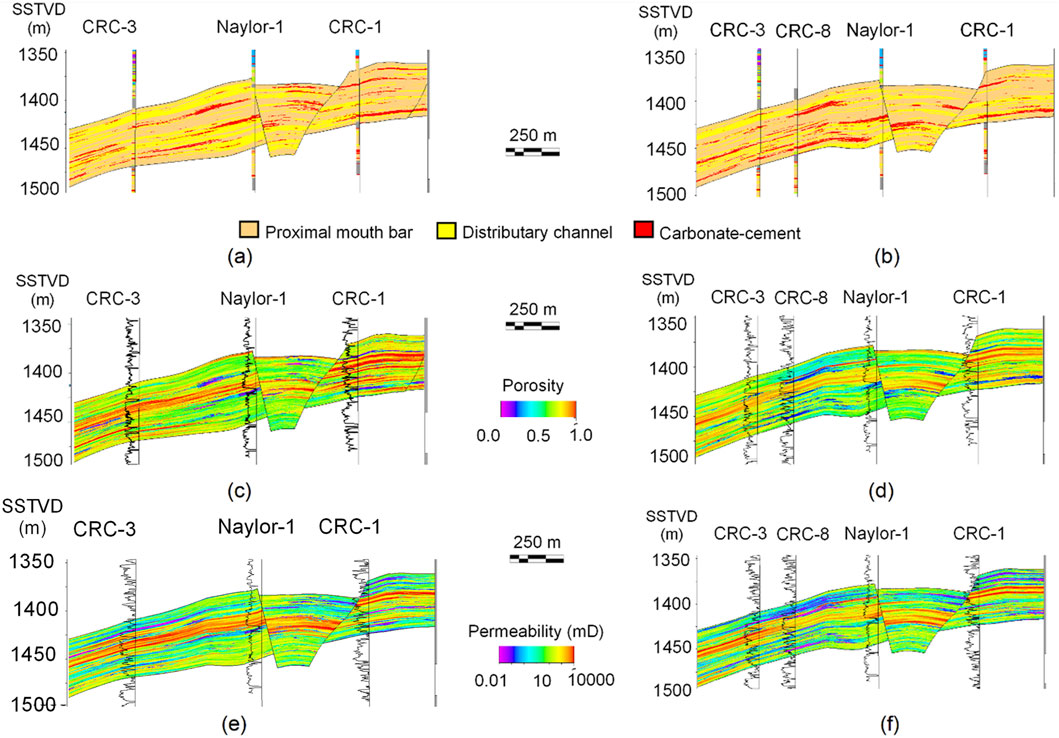
Figure 10. Distribution of geological facies (A) pre-; and (B) post-drilling of the monitoring well. Distribution of porosity (C) pre-; and (D) post-drilling of the monitoring well. Distribution of permeability (E) pre-; and (F) post-drilling of the monitoring well. These results are shown for the approach with grid cell size of 1 m × 1 m × 0.3 m excluding seismic data. Wireline logs of the respective properties are superimposed for comparison.
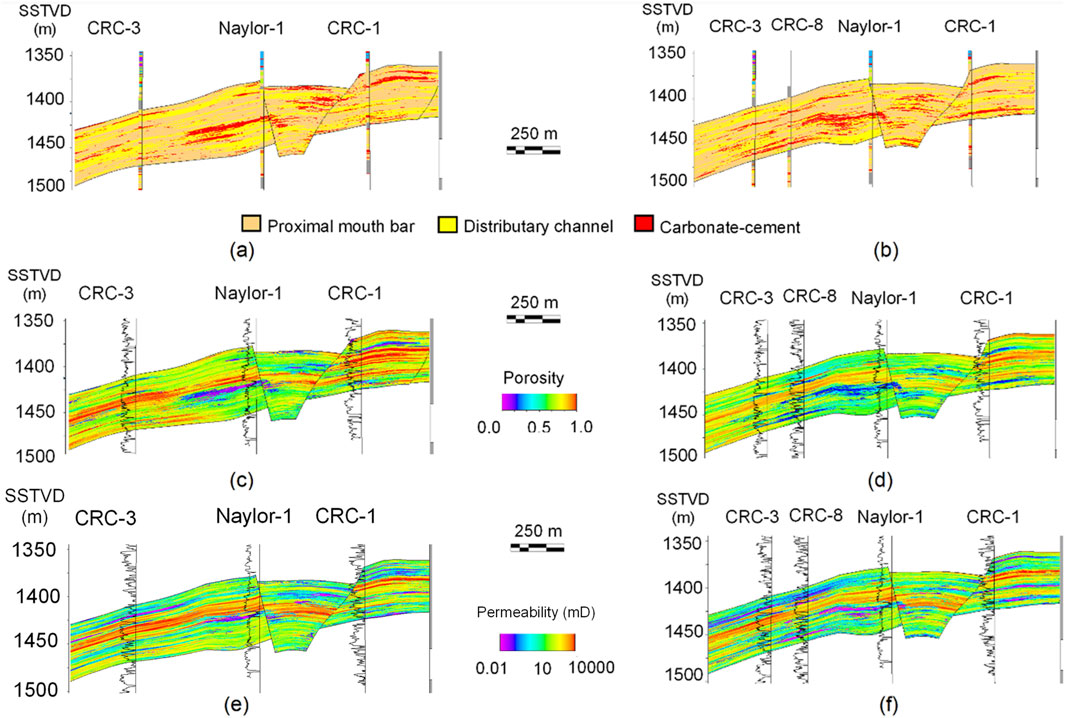
Figure 11. Distribution of geological facies (A) pre-; and (B) post-drilling of the monitoring well. Distribution of porosity (C) pre-; and (D) post-drilling of the monitoring well. Distribution of permeability (E) pre-; and (F) post-drilling of the monitoring well. These results are shown for the approach with grid cell size of 1 m × 1 m × 0.3 m including seismic data. Wireline logs of the respective properties are superimposed for comparison.
The second approach, which follows the same grid cell size but includes seismic data, showed similar distribution of the three reservoir properties, except for capturing a large cemented body between CRC-3 and Naylor-1 wells (Figure 9). As a result, the reservoir showed a large blob of low porosity and permeability material in the middle section (Figures 9C, E).
The third approach, where higher resolution grid cells were implemented but seismic data was excluded, showed an improved representation of lithological heterogeneity (Figure 10). Specifically, the distributary channel facies was observed to exist as an amalgamation of several thin streaks often inter-tonguing with the proximal mouth bar facies (Figures 10A, B). The realization including CRC-8 well was able to capture several thin streaks of carbonate cements between the injection and the monitoring wells (Figure 10B). The petrophysical property maps showed the presence of a high porosity (Figures 10C, D) and high permeability (Figures 10E, F) layer in the middle of the reservoir. Additionally, low permeability zones were identified in the shallower and deeper sections of the reservoir. However, the thickness of such low permeability zones was more pronounced in the scenario incorporating the data from the CRC-8 well. Additional low porosity and permeability streaks were observed in the lower portion of the reservoir between the injection and the monitoring wells in the realization incorporating CRC-8 data (Figures 10D, F).
The fourth approach, with high resolution grid cells and inclusion of seismic data, showed similar results as the third approach with the additional presence of a large carbonate cemented body between CRC-8 and Naylor-1 wells.
The lateral distributions of the three reservoir properties are presented in Supplementary Figures S2–S7.
6 Discussion
6.1 Impact of grid cell resolution, seismic inversion and a proximal monitoring well on improving near well bore heterogeneity distribution
The study shows that implementation of a high-resolution grid plays an important role in honoring sub-metre scale lithological heterogeneity in geological models. The low-resolution models (Figures 8A, B) presented a simplified distribution of the three facies bodies in the inter-well region, which mostly following a layer-cake geometry. On the contrary, the high-resolution realizations (Figures 10A, B) captured the details of lithological heterogeneity even at the facies level. These realizations showed intercalated facies comprising proximal mouth bar and distributary channel. Similarly, the distribution of carbonate facies followed a blocky pattern in the low resolution models while the high resolution models captured fine streaks of carbonates. The impact of resolution was more evident in the property models with the high-resolution models showing sub-metre scale variations in porosity and permeability (Figures 10C–F, 11C–F) while these variations were neglected in the models with conventional grid cell sizes (Figures 8C–F, 9C–F).
The results show the significance of including seismic data as it provides useful insights, especially in capturing the cemented body between the CRC-8 and Naylor-1 wells along with smaller carbonate cemented sandstones. This body would be missed if seismic data is excluded and facies distribution is solely constrained by wireline and facies logs. Additionally, fine scale variations in the distribution of carbonate-cement was picked up due to the implementation of stochastic inversion in contrary to deterministic inversion, which was largely unaffected by the inclusion of the monitoring well.
Furthermore, the importance of having a monitoring well only 116-m away from the injection well was highlighted. The geo-models incorporating data from the CRC-8 well better captured the presence of thin streaks of potential fluid flow barriers in the near well bore region of the injection well. The geo-models derived before drilling the monitoring well significantly under-estimated the presence of low porosity geo-bodies close to the injection well. In addition to the better representation of heterogeneity, the inclusion of CRC-8 well also helped in updating the lower boundary of the parasequence (Figure 12). It was found that the bottom reservoir boundary had a higher dip than previously though before drilling of the CRC-8 well. This could have important implications on the buoyancy driven migration of the injected CO2.
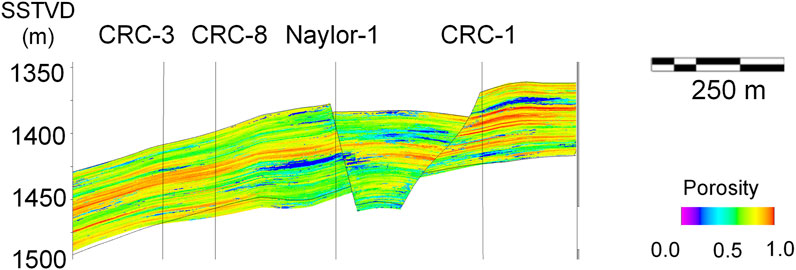
Figure 12. Porosity distribution derived before drilling of the CRC-8 well superimposed against the updated model boundaries (black outlines) defined after drilling of the CRC-8 well. Results show that the bottom reservoir boundary between CRC-3 and CRC-8 wells could have a steeper dip than previously thought.
The results presented in this study showed that it could be useful to develop reservoir models with sub-metre scale grid cell sizes as these models better capture the presence of high and low porosity and permeability streaks. Additionally, the inclusion of seismic data could be useful even if the reservoir domain is small and targeted only for pilot project scale CO2 injection operations as seismic data better incorporates the presence of inter-well geo-bodies. Finally, the drilling of the CRC-8 well showed that for reservoirs with a high degree of lithological heterogeneity, there could be a large uncertainty in the distribution of sub-metre scale rock properties even in the near well bore environment.
6.2 Uncertainty in the continuity of carbonate cements between the injection and the monitoring wells
The purpose of the pilot CO2 injection project is to assess the prediction capabilities of CO2 migration and trapping in siliciclastic reservoirs with a high degree of lithological heterogeneity. For this purpose, the lower section of the Parasequence-2 has been chosen as the CO2 injection zone as it comprises proximal mouth bar facies with cm-scale variations in the distribution of intraformational baffles (Figure 13). This interval is enveloped on top and bottom by carbonate-cements which could serve as potential barriers to the flow of CO2 and guide the gas towards the monitoring well. Hence, it is important to understand the continuity of the two cemented horizons between CRC-3 and CRC-8 wells.
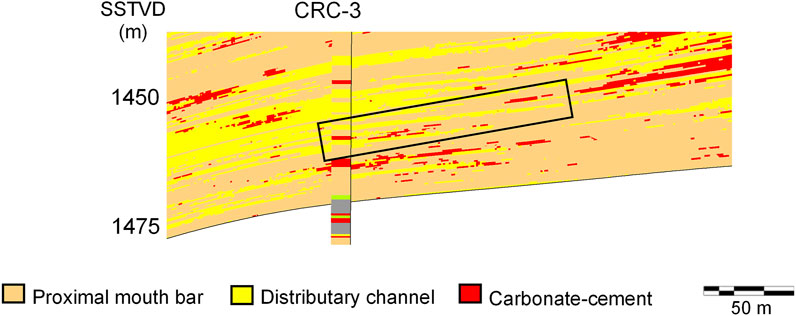
Figure 13. CO2 injection interval and the distribution of carbonate cements as its top and bottom boundaries as modelled before drilling of the CRC-8 well. The right-most edge of the black box indicates the potential location of the CRC-8 well. These realizations were prepared using high-resolution grid and seismic data.
The modelling conducted pre-drilling of the monitoring well, CRC-8, suggested that the two cement units may not be continuous between the injection and the monitoring wells (Figure 13). This implies that the injected CO2 would more likely migrate upwards from the injection interval rather than flowing laterally towards the location of the monitoring well.
However, the geo-model realizations developed post drilling of the CRC-8 well suggested that the bottom carbonate horizon could be continuous between the injection and the monitoring wells (Figure 14). But there was uncertainty on the continuity of the top carbonate cemented interval. Different realizations suggested different degrees of continuity of the top cement unit between the two wells. To further explore this, we looked into well log correlation and core images.
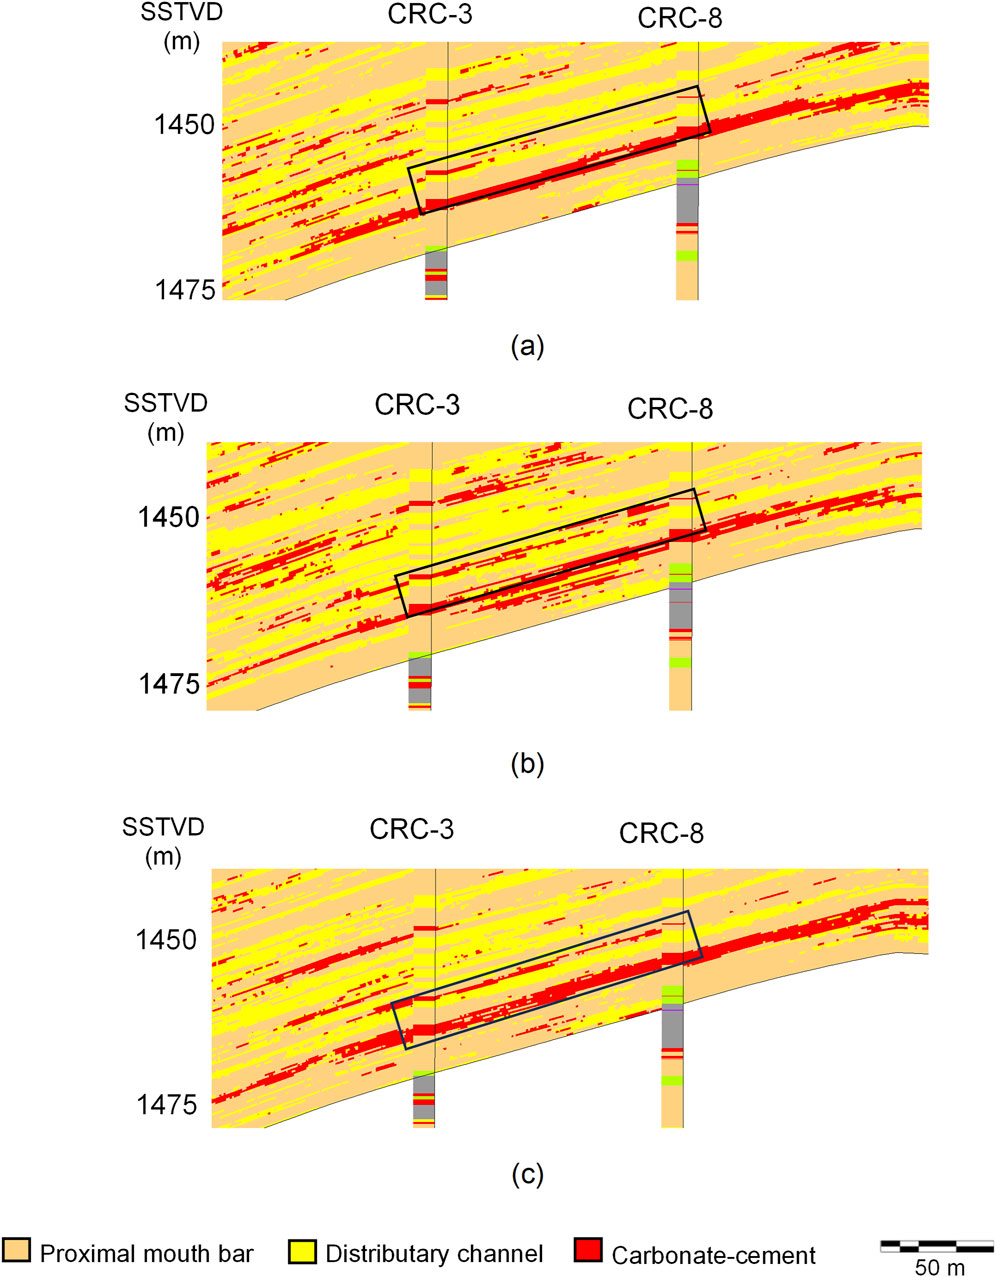
Figure 14. CO2 injection interval and the distribution of carbonate cements as its top and bottom boundaries as modelled after drilling of the CRC-8 well. Different realizations suggest that the top cement body of interest may have (A) little; (B) partial; and (C) complete continuity between the injection and the monitoring wells. These realizations were prepared using high-resolution grid and seismic data.
Core descriptions and photos show that the lower Parasequence 2 section in CRC-3 and CRC-8 intersects a similar stratigraphic section, with both wells characterised by a sequence of heterolithic sands, silts and clays interbedded with laminated sands. It has been shown that the most texturally and compositionally mature sandstones are preferentially cemented in the Paaratte Formation found within proximal mouth bar settings (Bunch, 2020). Two carbonate cemented bands are correlated across the lower injection zone (Figure 15). In CRC-3, a thick (∼2 m) carbonate cemented sandstone interval is present at ∼1,460 m (SSTVD) (Figures 2, 15). A 1.5 m thick carbonate cemented sandstone is also present at the same stratigrahic level within CRC-8 at ∼1,449 m (SSTVD) (Figures 2, 15). In both wells, this band marks the base of the preferred injection zone and is approximately 6 m above the base of Parasequence-2. The proximity of the two wells in association with the stratigraphic thickness and facies suggests that this feature forms a laterally continuous barrier at the base of the injection zone between the two wells.
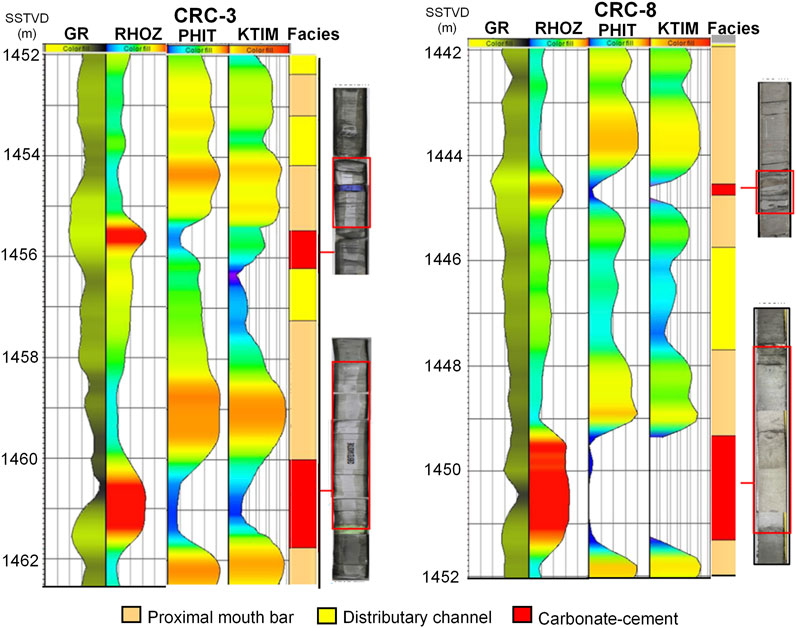
Figure 15. Well section for the proposed injection interval encountered with CRC-3 and CRC-8 wells showing gamma ray (GR), density (RHOZ), porosity (PHIT), permeability (KTIM) and facies logs. Core photos for the carbonate cemented sections at the top and the base of the injection interval are also shown.
The top carbonate cemented band is present at ∼1,456 m (SSTVD) in CRC-3 (Figures 2, 15). It is characterised by fine to medium sandstone with interbedded mudstone and is approximately 60 cm thick. In CRC-8, a 20 cm thick carbonate band of cemented fine sand along with heterolithic silts and a possible tuffaceous breccia is present at approximately the same stratigraphic height (∼1,445 m (SSTVD)). This unit is identified in cores from both wells (Figure 15). However, the variation in the lithology cemented by the carbonate and thin nature of the unit means the lateral continuity of this carbonate cemented band remains uncertain. It cannot be resolved by 3D seismic reflection survey data and are predicted as spatially sporadic (Bunch, 2020).
The analysis shows that the extent of carbonate cement, at least for the preferred injection zone, as predicted in the geo-models concurs with observations made in the core log.
6.3 Verification of the modelled properties
The modelled distributions of facies, porosity and permeability (Figures 8–11) were verified against property values quantified in logs (Supplementary Figure S8). The modelled proportions of the three facies showed a close match to their measured proportions in logs (Supplementary Figure S8A, D). A slight mismatch was observed for modelled and measured porosity (Supplementary Figure S8B, E) and permeability (Supplementary Figure S8C, F) distributions, though the discrepancy was small. This observation was consistent for the high- and the low-resolution models as well as the scenarios accounting for and neglecting seismic data derived pre- and post-drilling of the monitoring well. This provides reasonable confidence in the modelled realizations. Further, the impact of choosing a coarser vertical grid cell resolution in the models compared to wireline and facies logs was also assessed. This was done by upscaling the facies, porosity and permeability logs to 30 cm vertical resolution. A comparison of facies proportions (Supplementary Figure S8A, D) as well as the distribution of porosity (Supplementary Figure S8B, E) and permeability (Supplementary Figure S8C, F) showed a close match in the upscaled logs and the static models. This further provided confidence that the loss of information due to averaging of the properties from wireline log resolution to model grid resolution was minimal.
7 Conclusion
This study compares the distribution of facies, porosity and permeability for the Parasequence-2 of the Paaratte Formation by changing grid cell resolution, utilizing seismic inversion and including a new monitoring well located only 116-metres away from the injection well. The formation is located roughly between the depths of 1,400–1,500 m within the Otway Basin, Australia, and is a site for pilot scale geological CO2 sequestration operations. The available data included seismic, fault surfaces, facies logs, and a series of wireline logs which were used to generate static geological models of the Parasequence. These realizations principally followed four different approaches which involved inclusion and exclusion of seismic data as well as the variation of grid cell sizes implementing a low-resolution model with a cell size of 10 m x 10 m x 2 m and a high-resolution model with a cell size of 1 m x 1 m x 0.3 m. Additionally, the impact of having data from the monitoring well was considered. The results indicated that the stochastic inversion of seismic data was important as it helped in capturing a probabilistic distribution of three primary facies comprising the reservoir section: proximal mouth bar, distributary channel and carbonate-cement. The 4 scenarios revealed that the inclusion of seismic data was important as it captured the presence of relatively large carbonate-cemented zones between the wells. Additionally, the implementation of a higher resolution grid resulted in an improved representation of lithological heterogeneity in the realizations. Results also suggested that there could be a high degree of uncertainty in the distribution of rock properties and reservoir dip even within 116-metres of a given well in reservoirs with lithological heterogeneity. The modelled distributions of facies, porosity and permeability were verified against their distributions in the available and the upscaled logs. The static models developed in this study provide a robust framework for running single and multiphase fluid flow and reactive transport simulations by covering a range of possible rock property distributions. This could be especially important for the migration and trapping of CO2 which is highly susceptible to the presence of centi-metre scale lithological heterogeneities. Further uncertainty in the distribution of properties could be addressed by generating multiple realizations for each of the 4 scenarios presented in this study.
Data availability statement
The original contributions presented in the study are included in the article/Supplementary Material, further inquiries can be directed to the corresponding author.
Author contributions
SM: Conceptualization, Data curation, Formal Analysis, Methodology, Software, Validation, Visualization, Writing–review and editing. AM: Visualization, Writing–original draft, Writing–review and editing. JD: Formal Analysis, Project administration, Resources, Visualization, Writing–review and editing. RH: Funding acquisition, Project administration, Resources, Supervision, Writing–review and editing.
Funding
The author(s) declare that financial support was received for the research, authorship, and/or publication of this article. This study is a contribution to the GeoCquest Field Validation Project, a collaborative project of The University of Melbourne (Australia), Stanford University (USA) and CO2CRC Limited aimed at reconciling the differences between predicted and observed migration and trapping of injected CO2 migration via advanced geo-modelling and simulation techniques. This study received funding from the CO2CRC Ltd. and its industry members ExxonMobil, BP and BHP. Chevron provided the funding for the drilling and well completion of a new well (CRC-8) at the Otway International Test Centre operated by the CO2CRC Ltd.
Conflict of interest
The authors declare that the research was conducted in the absence of any commercial or financial relationships that could be construed as a potential conflict of interest.
The authors declare this study received funding from CO2CRC Limited, BHP, ExxonMobil and BP. The funders were not involved in the study design (apart from advising on operational constraints), data analysis and interpretation, the writing of this article, or the decision to submit it for publication.
Correction note
This article has been corrected with minor changes. These changes do not impact the scientific content of the article.
Generative AI statement
The author(s) declare that no Generative AI was used in the creation of this manuscript.
Publisher’s note
All claims expressed in this article are solely those of the authors and do not necessarily represent those of their affiliated organizations, or those of the publisher, the editors and the reviewers. Any product that may be evaluated in this article, or claim that may be made by its manufacturer, is not guaranteed or endorsed by the publisher.
Supplementary material
The Supplementary Material for this article can be found online at: https://www.frontiersin.org/articles/10.3389/feart.2024.1508031/full#supplementary-material
References
American Petroleum Institute (1988). Recommended practice RP 40 “recommended practices for core analysis”.
Ani, M., Oluyemi, G., Petrovski, A., and Rezaei-Gomari, S. (2016). “Reservoir uncertainty analysis: the trends from probability to algorithms and machine learning,” in SPE intelligent energy international conference and exhibition SPE-181049. doi:10.2118/181049-MS
Benson, S. M., and Orr, F. M. (2008). Carbon dioxide capture and storage. MRS Bull. 33 (4), 303–305. doi:10.1557/mrs2008.63
Bentley, M. R., and Woodhead, T. J. (1998). “Uncertainty handling through scenario-based reservoir modelling,” in SPE asia pacific conference on integrated modelling for asset management. SPE-39717. doi:10.2118/39717-MS
Boon, M., and Benson, S. M. (2021). A physics-based model to predict the impact of horizontal lamination on CO2 plume migration. Adv. Water Resour. 150, 103881. doi:10.1016/j.advwatres.2021.103881
Boon, M., Matthäi, S. K., Shao, Q., Youssef, A. A., Mishra, A., and Benson, S. M. (2022). Anisotropic rate-dependent saturation functions for compositional simulation of sandstone composites. J. Pet. Sci. Eng. 209, 109934. doi:10.1016/j.petrol.2021.109934
Boyd, G. A., and Gallagher, S. J. (2001). The sedimentology and palaeoenvironments of the late cretaceous Sherbrook group in the Otway Basin.
Branets, L. V., Ghai, S. S., Lyons, S. L., and Wu, X. H. (2009). Challenges and technologies in reservoir modeling. Commun. Comput. Phys. 6 (1), 1–23. doi:10.4208/cicp.2009.v6.p1
Bunch, M. A. (2020). A probability model to detect carbonate cementation in sandstones and other enigmatic wireline facies. Mar. Pet. Geol. 118, 104424. doi:10.1016/j.marpetgeo.2020.104424
Cande, S. C., and Mutter, J. C. (1982). A revised identification of the oldest sea-floor spreading anomalies between Australia and Antarctica. Earth Planet. Sci. Lett. 58 (2), 151–160. doi:10.1016/0012-821X(82)90190-X
Christie, M. A. (1996). Upscaling for reservoir simulation. J. Pet. Technol. 48 (11), 1004–1010. doi:10.2118/37324-JPT
Dance, T. (2013). Assessment and geological characterisation of the CO2CRC Otway Project CO2 storage demonstration site: from prefeasibility to injection. Mar. Pet. Geol. 46, 251–269. doi:10.1016/j.marpetgeo.2013.06.008
Dasheng, Q. (2010). Upscaling extent vs. information loss in reservoir upscaling. Pet. Sci. Technol. 28 (12), 1197–1202. doi:10.1080/10916460903057865
Demyanov, V., Arnold, D., Rojas, T., and Christie, M. (2019). Uncertainty quantification in reservoir prediction: part 2—handling uncertainty in the geological scenario. Math. Geosci. 51, 241–264. doi:10.1007/s11004-018-9755-9
Gibson-Poole, C. M., Svendsen, L., Watson, M. N., Daniel, R. F., Ennis-King, J., and Rigg, A. J. (2009). Understanding stratigraphic heterogeneity: a methodology to maximize the efficiency of the geological storage of CO2. doi:10.1306/13171248St593385
Gupta, S., and Li, L. (2022). The potential of machine learning for enhancing CO2 sequestration, storage, transportation, and utilization-based processes: a brief perspective. JOM 74 (2), 414–428. doi:10.1007/s11837-021-05079-x
Hermanson, J., and Kirste, D. (2013). Representation of geological heterogeneities and their effects on mineral trapping during CO2 storage using numerical modeling. Procedia Earth Planet. Sci. 7, 350–353. doi:10.1016/j.proeps.2013.03.127
Higgs, K. E., Haese, R. R., Golding, S. D., Schacht, U., and Watson, M. N. (2015). The Pretty Hill Formation as a natural analogue for CO2 storage: an investigation of mineralogical and isotopic changes associated with sandstones exposed to low, intermediate and high CO2 concentrations over geological time. Chem. Geol. 399, 36–64. doi:10.1016/j.chemgeo.2014.10.019
Holford, S., Hillis, R., Duddy, I., Green, P., Stoker, M., Tuitt, A., et al. (2011). Cenozoic post-breakup compressional deformation and exhumation of the southern Australian margin. APPEA J. 51 (1), 613–638. doi:10.1071/AJ10044
Kim, Y., Jang, H., Kim, J., and Lee, J. (2017). Prediction of storage efficiency on CO2 sequestration in deep saline aquifers using artificial neural network. Appl. Energy 185, 916–928. doi:10.1016/j.apenergy.2016.10.012
Metz, B., Davidson, O., and De Coninck, H. (2005). Carbon dioxide capture and storage: special report of the. Intergovernmental panel on climate change. UK: Cambridge University Press. Available at: https://www.ipcc.ch/report/carbon-dioxide-capture-and-storage/.
Mishra, A., Boon, M. M., Benson, S. M., Watson, M. N., and Haese, R. R. (2023). Reconciling predicted and observed carbon mineralization in siliciclastic formations. Chem. Geol. 619, 121324. doi:10.1016/j.chemgeo.2023.121324
Mishra, A., Ni, H., Mortazavi, S. A., and Haese, R. R. (2024). Graph theory based estimation of probable CO2 plume spreading in siliciclastic reservoirs with lithological heterogeneity. Adv. Water Resour. 189, 104717. doi:10.1016/j.advwatres.2024.104717
Mishra, A., Pajank, L., and Haese, R. R. (2019). High resolution characterization of lithological heterogeneity of the paaratte formation, Otway Basin (Australia), a coastal to shallow-marine deposit. Geosciences 9 (6), 278. doi:10.3390/geosciences9060278
Ni, H., Møyner, O., Kurtev, K. D., and Benson, S. M. (2021). Quantifying CO2 capillary heterogeneity trapping through macroscopic percolation simulation. Adv. Water Resour. 155, 103990. doi:10.1016/j.advwatres.2021.103990
Preux, C. (2016). About the use of quality indicators to reduce information loss when performing upscaling. Oil and Gas Sci. Technology–Revue d’IFP Energies nouvelles 71 (1), 7. doi:10.2516/ogst/2014023
Pyrcz, M. J., and White, C. D. (2015). Uncertainty in reservoir modeling. Interpretation 3 (2), SQ7–SQ19. doi:10.1190/INT-2014-0126.1
Qi, D., and Zhang, S. (2009). Major challenges for reservoir upscaling. Pet. Sci. Technol. 27 (17), 1985–1992. doi:10.1080/10916460802608818
Rashad, O., El-Barkooky, A. N., El-Araby, A., and El-Tonbary, M. (2022). Deterministic and stochastic seismic inversion techniques towards a better prediction for the reservoir distribution in NEAG-2 Field, north Western Desert, Egypt. Egypt. J. Pet. 31 (1), 15–23. doi:10.1016/j.ejpe.2021.12.002
Ringrose, P. S., Martinius, A. W., and Alvestad, J. (2008). Multiscale geological reservoir modelling in practice. Geol. Soc. 309 (1), 123–134. doi:10.1144/SP309.9
Thanh, H. V., and Lee, K. K. (2022). Application of machine learning to predict CO2 trapping performance in deep saline aquifers. Energy 239, 122457. doi:10.1016/j.energy.2021.122457
Wen, G., Hay, C., and Benson, S. M. (2021). CCSNet: a deep learning modeling suite for CO2 storage. Adv. Water Resour. 155, 104009. doi:10.1016/j.advwatres.2021.104009
Willcox, J. B., and Stagg, H. M. J. (1990). Australia's southern margin: a product of oblique extension. Tectonophysics 173 (1-4), 269–281. doi:10.1016/0040-1951(90)90223-U
Woollands, M. A., and Wong, D. (2001). “Petroleum atlas of victoria, Australia,” in The state of victoria (Department of Natural Resources and Environment), 208. Available at: https://gsv.vic.gov.au/SearchAssistant2/details?q=internal_id:43977.
Yu, C. W., Lei, S. C., Chiao, C. H., Hwang, L. T., Yang, W. H., and Yang, M. W. (2017). Injection risk assessment for intra-formational seal geological model in a carbon sequestration application in Taiwan. Greenh. Gases. 7 (2), 225–240. doi:10.1002/ghg.1644
Zhou, F., Shields, D., Tyson, S., and Esterle, J. (2018). Comparison of sequential indicator simulation, object modelling and multiple-point statistics in reproducing channel geometries and continuity in 2D with two different spaced conditional datasets. J. Pet. Sci. Eng. 166, 718–730. doi:10.1016/j.petrol.2018.03.043
Keywords: geological modelling, lithological heterogeneity, wireline logs, stochastic seismic inversion, geological carbon storage
Citation: Mortazavi SA, Mishra A, Dickinson J and Haese RR (2025) Reducing the uncertainty in the distribution of cm-scale rock properties in the near well-bore region. Front. Earth Sci. 12:1508031. doi: 10.3389/feart.2024.1508031
Received: 08 October 2024; Accepted: 24 December 2024;
Published: 15 January 2025; Corrected: 17 June 2025.
Edited by:
Xingye Liu, Chengdu University of Technology, ChinaReviewed by:
Jian Zhang, Southwest Jiaotong University, ChinaJiangfeng Guo, China University of Petroleum, Beijing, China
Copyright © 2025 Mortazavi, Mishra, Dickinson and Haese. This is an open-access article distributed under the terms of the Creative Commons Attribution License (CC BY). The use, distribution or reproduction in other forums is permitted, provided the original author(s) and the copyright owner(s) are credited and that the original publication in this journal is cited, in accordance with accepted academic practice. No use, distribution or reproduction is permitted which does not comply with these terms.
*Correspondence: Ralf R. Haese, cmFsZi5oYWVzZUB1bmltZWxiLmVkdS5hdQ==
†Present address: Achyut Mishra, Department of Earth Sciences, Indian Institute of Technology Gandhinagar, Gandhinagar, India
 Seyed Ahmad Mortazavi1,2
 Achyut Mishra