 Deniz Ertuncay
 Simone Francesco Fornasari
  Giovanni Costa
95% of researchers rate our articles as excellent or good
Learn more about the work of our research integrity team to safeguard the quality of each article we publish.
Find out more
ORIGINAL RESEARCH article
Front. Earth Sci. , 08 January 2025
Sec. Solid Earth Geophysics
Volume 12 - 2024 | https://doi.org/10.3389/feart.2024.1507241
Italy has been majorly affected by the COVID-19 pandemic. The government declared a full lockdown and limited human and commercial activities to keep the pandemic under control. The limited human activity reduced the spread of the virus and the cultural noise it created. The effect of the lockdown is detected by the Italian strong motion network, which covers the entire country with their stations mostly located in the settlements. To assess the effect of the lockdown, background noise information up to 1 s from 2022 is used as a comparison. It is found that the background noise levels dropped around 1.46 dB during the lockdown, with a nationwide reduction in almost all of the stations. Noise levels have dropped both in the daytime and nighttime during the lockdown, with a more significant noise drop during the nighttime, which can be linked to the ban on dining in restaurants and bars and the curfew. A similar trend is found in weekday and weekend comparisons; in both time ranges, 2022 was noisier regarding the lockdown period. Stations located in public spaces such as schools and city halls observed noise reduction of up to 7.99 dB, and this noise level reduction is visible in major cities. We analyzed the 10 most populated Italian cities and their surroundings and found noise reduction of up to 5.5 and 2.1 dB in the median.
The first coronavirus disease 2019 (COVID-19) case was confirmed on 31 January 2020 in northern Italy. Soon after the first case, Italy suffered from the disease as it became a global pandemic. As of 13th of April 2024, there are more than 26.7 million confirmed cases and around 196,500 deaths due to COVID-19 in Italy (https://ourworldindata.org/coronavirus, last access: 13th of August 2024). In the early stages of the COVID-19 pandemic, Italy introduced a full lockdown in the country, limiting the general public’s daily activity and a wide range of industrial activities. Restrictions included the travel ban between regions, the conversion of educational activities to remote teaching, the ban of dine-in service in restaurants, the limitation of the number of individuals in markets, and citizens were allowed to move away from their residencies only up to 500 m and so on. Lockdown started on the ninth of March 2020 (eighth of March in northern Italy) and ended on the fourth of May 2020.
Due to the above-mentioned limitations, non-essential human-related activities were mostly reduced. These reductions can be monitored thanks to the Italian National Accelerometric Network (RAN). RAN is owned and managed by the Italian Civil Protection Department (DPC) (Presidency of Counsil of Ministers - Civil Protection Department, 1972; Gorini et al., 2010; Zambonelli et al., 2011; Costa et al., 2022). The network is the result of combination of multiple regional networks, namely, the Friuli Venezia Giulia and Veneto Accelerometric Network (RAF, Rete Accelerometrica Friuli Venezia Giulia e Veneto in Italian, University of Trieste, 1993; Costa et al., 2010) and Irpinia Seismic Network (Weber et al., 2007) along with the national accelerometric network (Presidency of Counsil of Ministers - Civil Protection Department, 1972). Continuous data acquisition of RAN allowed us to analyze the variations in background noise in Italian territory. RAN aims to capture the effect of earthquakes in populated areas by observing the ground motions, and for this purpose, most of the stations are installed in towns, cities, etc. Hence, the background noise of the network is enriched by the cultural activities. This study aims to understand the noise level reduction that occurred in RAN by analyzing the continuous seismic traces during the lockdown and year of 2022.
Cultural noise can be seen in the short periods (0.025–1 s, Cauzzi and Clinton, 2013; D’Alessandro et al., 2021; Anthony et al., 2022) while at periods shorter than 1 s self-noise of accelerometers dominates the noise content (Cauzzi and Clinton, 2013). Cultural noise or anthropogenic noise consists of industrial activities (Kar and Mohanty, 2006), cars (Ahmad and Tsuji, 2021), trains (Brenguier et al., 2019) and subways (Green et al., 2017), aircraft (Zhang et al., 2022), human movement (Kogan et al., 2008) and so on. During the lockdown period in Italy and other countries that introduced similar restrictions, reducing the cultural noise lowered the noise levels in the shorter periods of the background noise.
Lecocq et al. (2020) show the global effect of the lockdown in many countries. Wang et al. (2021) provides a clear example of noise reduction during the lockdown in China, where the first case of COVID-19 was detected. Xiao et al. (2020) compare the noise level changes during the lockdown in China and Italy and find that different behaviours of people and different levels of restrictions play a role in noise level reductions. Noise level reduction in major cities in Italy is lower than in small towns in northern Italy (Piccinini et al., 2020). Piccinini et al. (2020) uses 78 seismic stations mostly located in northern and central Italy. On the other hand, Cannata et al. (2021) provides a high noise reduction in 18 stations in southern Italy. Poli et al. (2020) comes with a similar conclusion by observation from more than 100 for central and northern Italy high large noise reduction in periods shorter than 1 s. Similar contradicting results are also found in Tokyo, Japan, where Yabe et al. (2020) find clear noise level reduction, especially when the state of emergency was declared for the Tokyo metropolitan area, whereas Hayashida et al. (2023) find insignificant noise reduction for the city. Noise level reduction is also noticed in other major cities in the world such as Barcelona, Spain (Diaz et al., 2021), Boston, United States (Terry et al., 2021), Bucharest, Romania (Grecu et al., 2021), and Mexico City, Mexico (Pérez-Campos et al., 2021), Shillong, India (Somala, 2020), and Singapore (Zhao et al., 2022). Previous studies showed that during the COVID-19 lockdown there was decrease in noise levels due to the reduction of human-related activities, and as recorded by both broadband (Poli et al., 2020; Xiao et al., 2020; Lecocq et al., 2020; Somala, 2020; Dias et al., 2020; Roy et al., 2021; Grecu et al., 2021; Cannata et al., 2021) and strong motion (Yabe et al., 2020; Ścisło et al., 2021) stations, and fibre optic cables (Shen and Zhu, 2021).
In this study, we measure the noise level reduction for Italian territory thanks to the large urban coverage of RAN. In Section 2, the data used for the analysis is introduced, and in Section 3, the data processing is explained. Results of the study are given in Section 4, and the temporal and spatial changes of the background noise are discussed in Section 5.
In this study, 248 RAN stations continuously recorded more than 90% of both lockdown and year 2022: the instruments installed at the stations are reported in Table 1. The stations are generally located in the areas where humans are present (Table 2) because their main objective is to understand the ground motions that can potentially cause harm to humans. This comes with a high background noise in the shorter periods (
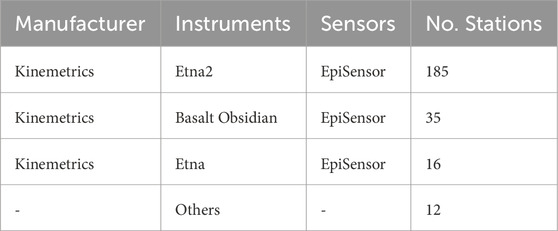
Table 1. Instruments at the integrated RAN stations used in the study.
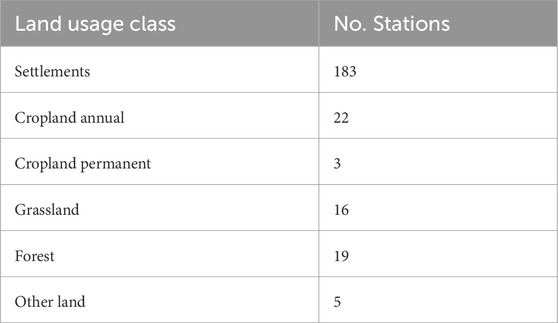
Table 2. Land usage at the station locations (Istituto Superiore per la Protezione e la Ricerca Ambientale, 2022).
Noise levels have been studied by computing the power spectral density (PSD) over the vertical component of the seismic records, which are then grouped over different time ranges to analyze specific patterns. The method adopted was originally introduced by McNamara and Buland (2004) as a station status monitoring tool and subsequently extended to scientific studies (D’Alessandro et al., 2021; Anthony et al., 2022; Fornasari et al., 2023). The PSDs are computed over daily recordings taking 90 min windows, with 50% overlap. The data have been preprocessed by applying a linear detrend and a Hann window to reduce spectral leakage (Peterson, 1993; Anthony et al., 2022). A minimal required threshold for the data completeness over each 90 min window is set at 90% with small data gaps being linearly interpolated. No selection of the signal is performed to remove transient signals: although the presence of strong transients (e.g., earthquakes) in the recordings can skew the median ambient-noise estimates for long periods (10 s–50 s), Anthony et al. (2020) showed that shorter periods, which are the main target of the study, remain unaffected. The PSD for each window is obtained by averaging the results obtained using the Welch’s method (Welch, 1967) over 15 min subwindows with 75% overlap. As shown by Anthony et al. (2020), the relevance of the window length selection decreases as shorter periods and noisier stations are considered. The instrument response is then removed from the resulting PSD, and a one-third-octave average is computed to optimize the accuracy of the broadband noise source characterization while maintaining a reasonable spectral resolution. The parameters used for the computation of the PSD mirror the ones adopted in Fornasari et al. (2023). The differences between the median values of each period have been computed to study the variations in noise levels during the COVID-19 lockdown with respect to a reference time span (e.g., 2022). Similarly, the day-night and weekday-weekend variations have been compared for the two periods considering the differences between the median values of the variations among the two periods: for this purpose, daytime has been defined between 08:00 and 18:00 CET, and nighttime as between 20:00 and 07:00 CET; weekdays and weekends are between Monday through Friday and Saturday through Sunday, respectively.
Overall background noise level of RAN stations for 2022 (Figure 1) are in between the Italian accelerometric low-noise (IALNM) and high-noise (IAHNM) models defined by Fornasari et al. (2023). Stations with high noise levels were located in Po Valley (Supplementary Figure S2), the city of Naples and its surroundings, Sicily Island, and the Puglia region.
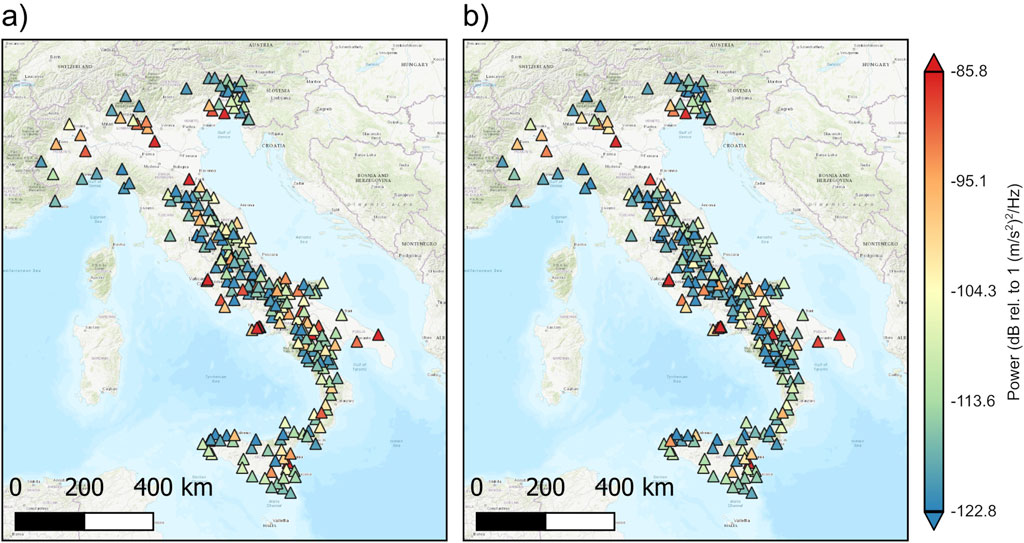
Figure 1. Median noise levels of RAN in (A) 2022 and (B) lockdown period for 0.1 s. Periods of 0.25 s, 0.5 s, and 1.0 s are given in Supplementary Figure S1 for the same set of stations. Colorbar limits are defined by the model of Fornasari et al. (2023). This and the following maps are created by using map tiles by CartoDB, under CC BY 3.0. Data by OpenStreetMap, under ODbL.
Temporal variations of arbitrarily picked stations during the COVID-19 lockdown and 2022 can be seen in Figure 2 for 0.1 s. As in Figure 2, background noise levels show clear variation between day and night. Stations also show variance between weekdays and weekends (e.g., BRB) and national holidays such as Easter (12th of April 2020 and 17th of April 2022 in this study) and mid-August day (on 15th of August), which can affect the background noise level in the following days to weeks. In Italy, the 15th of August is a national holiday when most of the Italian private sector workers take annual leave (Supplementary Figure S3).
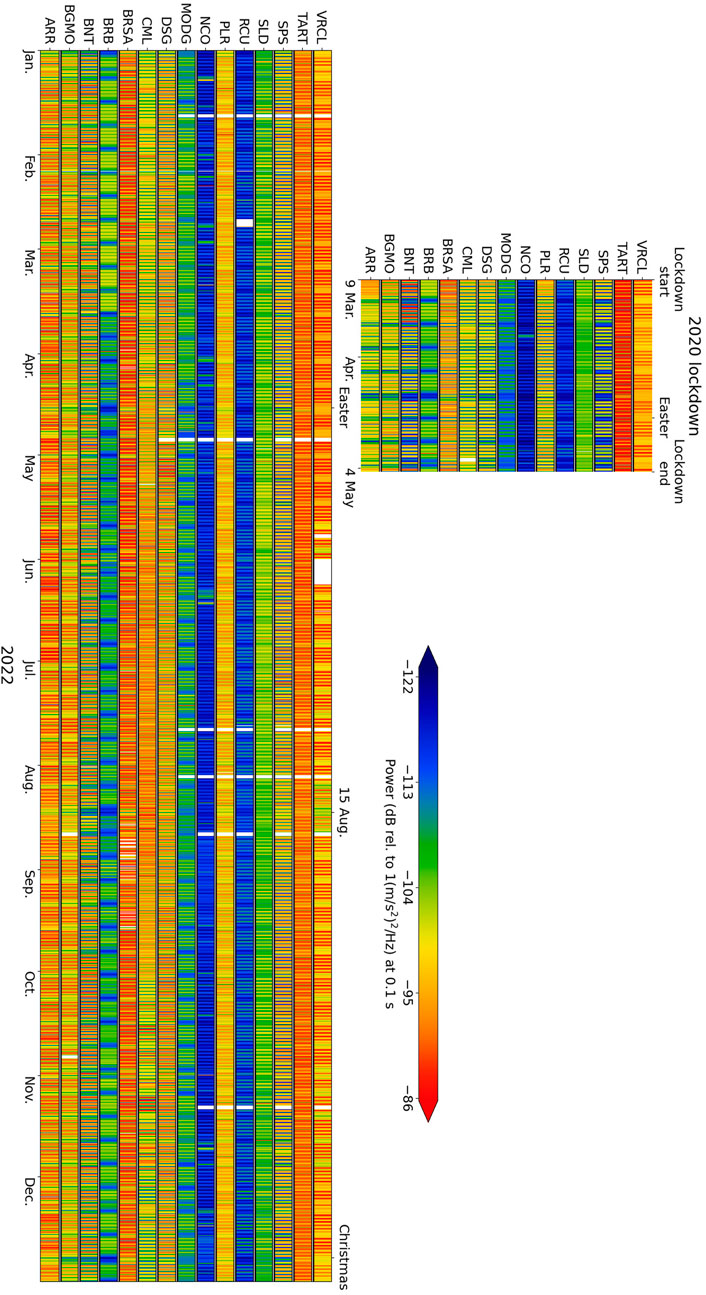
Figure 2. Temporal change of the background noise in 0.1 s for 15 stations from RAN. Periods of 0.25 , 0.5 , and 1.0 s are given in Supplementary Figure S3 for the same set of stations.
To see the effects of the COVID-19 lockdown, the general difference between the lockdown and 2022 (Figure 3) along with the day-night (Figure 4) and weekday-weekend (Figure 5) differences are calculated. Stations of RAN network are quieter, in median, 1.96, 0.56, 0.21, and 0.12 dB for 0.1, 0.25, 0.5, and 1.0 s, respectively (Figure 3). Among those periods, there are several outliers with a big difference between the COVID-19 lockdown and 2022, which are given in Table 3. In 2022, 224, 206, 194, and 171 stations were noisier in 0.1, 0.25, 0.5, and 1.0 s with respect to their lockdown noise levels, respectively.A similar trend can be seen in the daytime and nighttime differences (Figures 3, 4). Stations were quieter during the daytime in lockdown with 2.16, 0.86, 0.27, and 0.12 dB for 0.1, 0.25, 0.5, and 1.0 s, respectively, and during the night 1.28, 0.21, 0.14, and 0.13 dB for 0.1, 0.25, 0.5, and 1.0 s, respectively, were quieter. During the day 221, 217, 198, and 170 stations for 0.1 s, 0.25, 0.5, and 1.0 s, respectively, were noisier in 2022 and during night number are dropped to 208, 190, 186, and 167 stations but the similar trend is preserved.
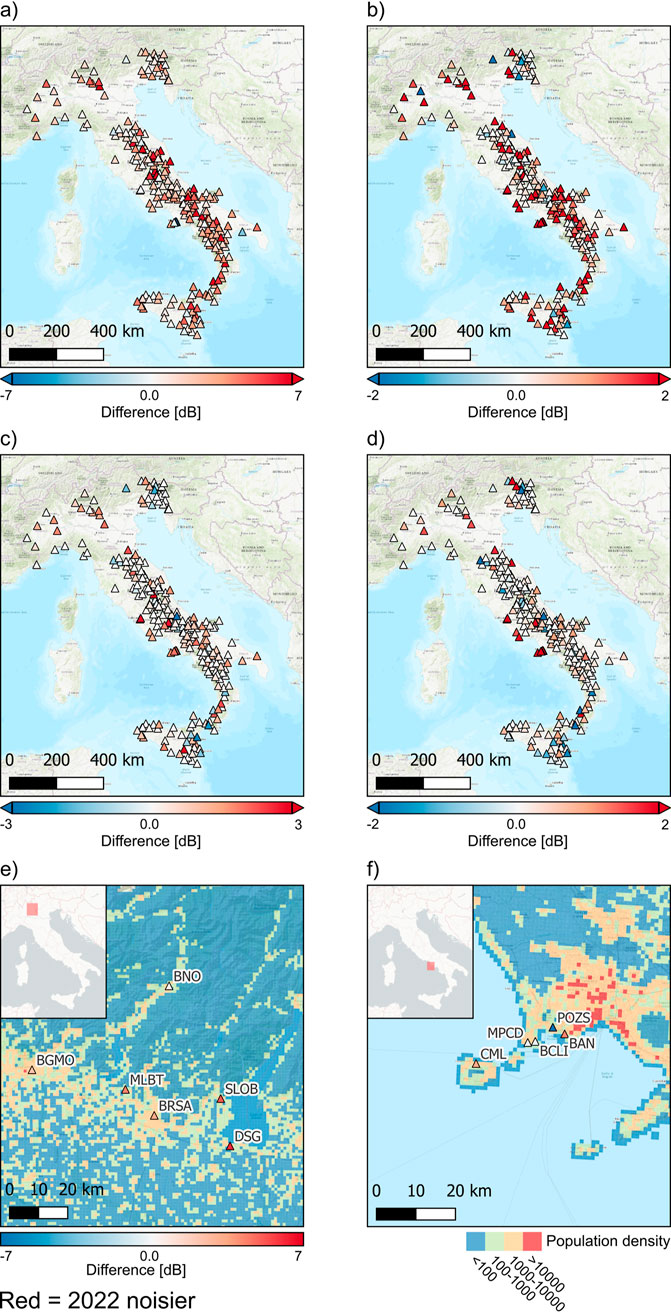
Figure 3. Noise level change between the lockdown period and 2022 for (A) 0.1 s, (B) 0.25 s, (C) 0.5 s, and (D) 1.0 s (E) and (F) present zoom-in locations near Bergamo in Northern Italy and Napoli in Southern Italy, respectively, for 0.1 s along with the population density (source: ISTAT, last access: 24/11/2023).
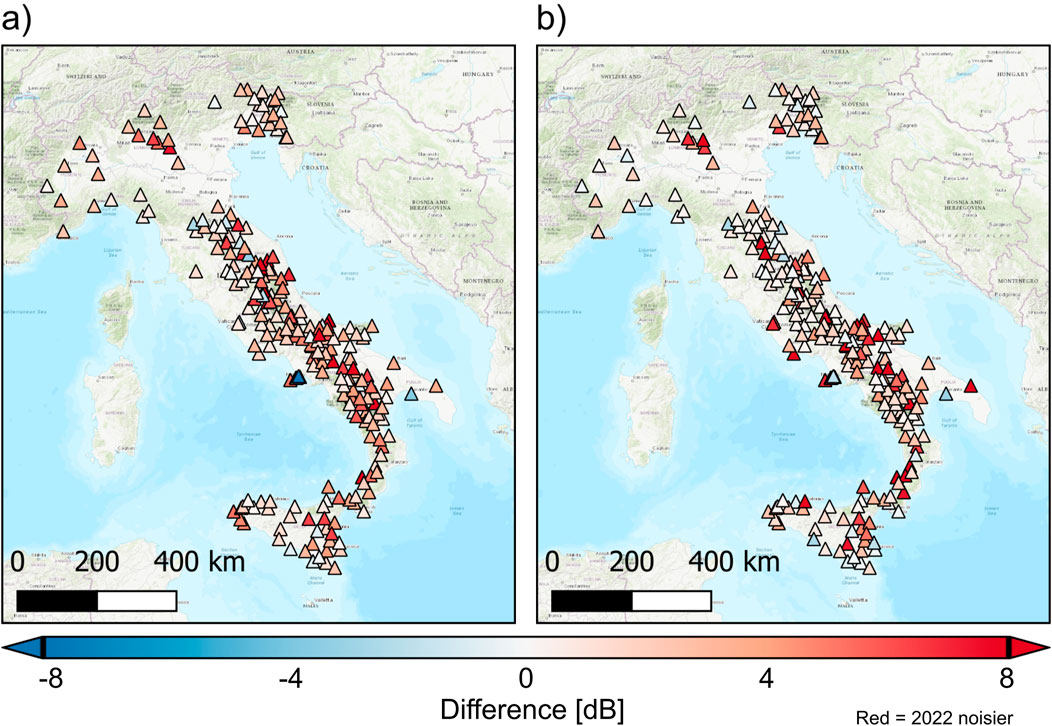
Figure 4. Noise level change between the lockdown period and 2022 during (A) daytime and (B) nighttime 0.1 s. Periods of 0.25, 0.5, and 1.0 s are given in Supplementary Figure S4.
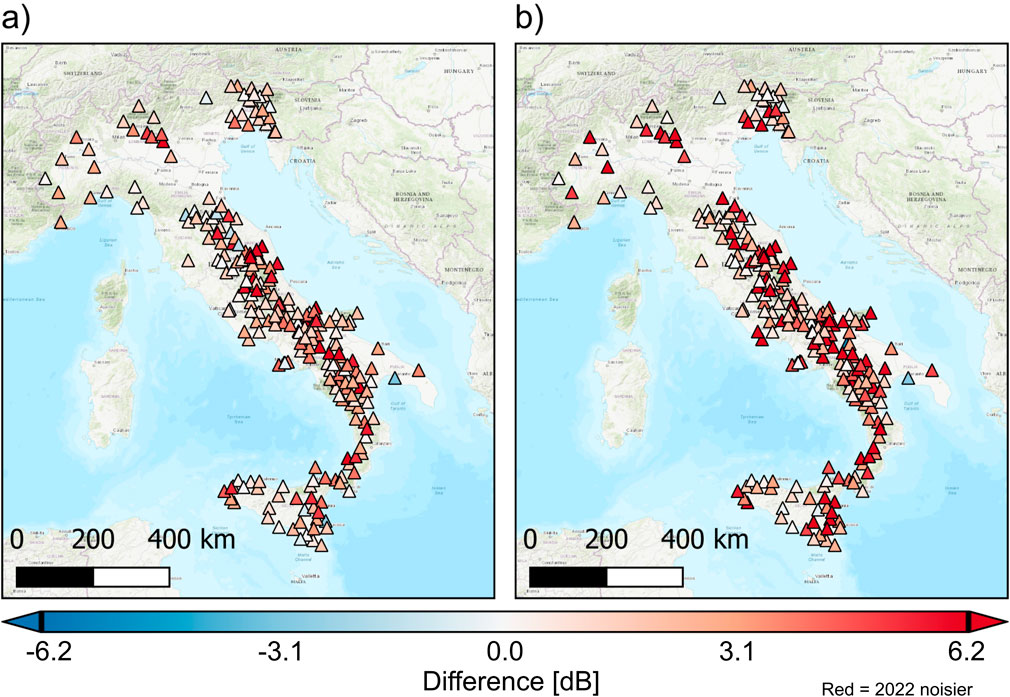
Figure 5. Noise level change between the lockdown period and 2022 during (A) weekdays and (B) weekends 0.1 s. Periods of 0.25, 0.5, and 1.0 s are given in Supplementary Figure S5.
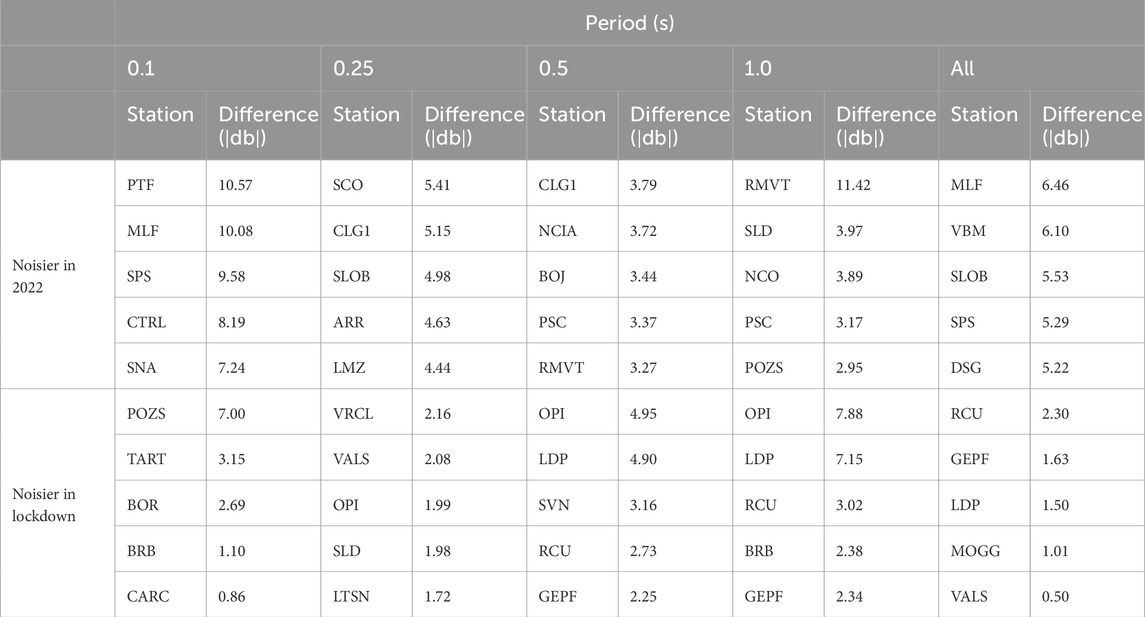
Table 3. Stations with largest power change for 0.1, 0.25, 0.5, 1.0 s, and overall periods.
In the weekday-weekend comparison, a similar trend can be seen (Figure 5; Supplementary Figure S5). Stations were quieter during the weekday in lockdown with 1.91, 0.64, 0.23, and 0.10 dB for 0.1, 0.25, 0.5, and 1.0 s, respectively, and during the weekend 2.73, 0.58, 0.23, and 0.19 dB for 0.1, 0.25, 0.5, and 1.0 s, respectively, were quieter. In 2022, 226, 215, 195, and 160 stations were noisier during the weekdays and 234, 208, 195, and 183 were noisier during the weekends in 0.1, 0.25, 0.5, and 1.0 s, respectively. In the next section, possible explanations of the results are discussed. Case studies are selected to explain the results, and previous studies are compared with our results to see similarities and differences.
Human-related activities affect RAN stations significantly since several of them are located inside or near public buildings. These activities were significantly reduced during the lockdown period of the COVID-19 pandemic since individuals were only allowed to move within 500 m from their homes, and only essential workers were exempt from the distance restrictions. Many public institutes worked remotely in most of their units, reducing human activity in public buildings. Moreover, only essential workers (e.g., healthcare sector, law enforcement, and agricultural sector) and workplaces were allowed to continue their operations. This led to the reduction in noise levels shown in Figure 3. In the 0.1 s, there is almost a 2 dB noise reduction between the median noise levels of the lockdown and no - lockdown time periods at the stations (Figure 3A) with maximum changes exceeding 6.7 dB. Furthermore, the contribution of anthropogenic noises is decreasing with increasing periods. Hence, the noise difference between 2022 and the lockdown period is relatively low (Figure 3). In the Central Apennines, there are numerous stations whose noise levels between 0.25 s and 1 s have not been affected by the lockdown (Figures 3B–D; Figure 6).
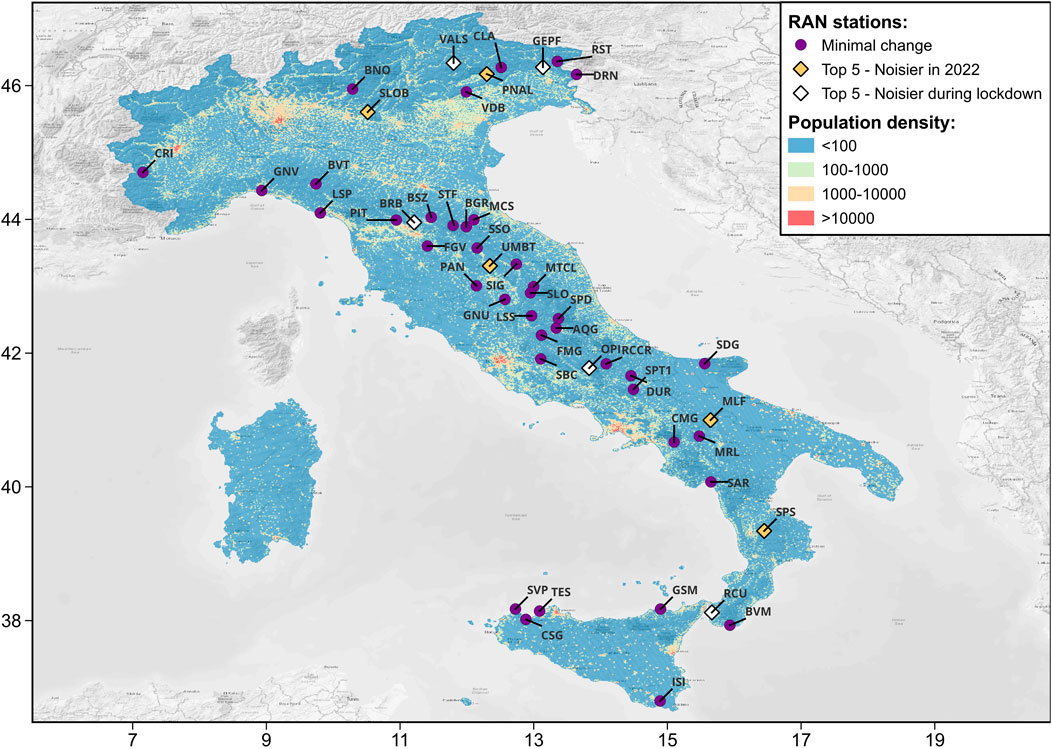
Figure 6. Stations with minimal or maximum noise level differences between the COVID-19 lockdown and the 2022 for the periods 0.1–1 s: stations with minimal differences (
The change between daytime and nighttime are visible in short periods (Figure 4). Changes in the daytime are more significant than those in the nighttime between the lockdown and no-lockdown period, which is more visible in the Apennines. All stations are noisier during both daytime and nighttime with respect to their lockdown counterparts in periods shorter than 0.5 s, whereas in periods of 0.5 s and 1.0 s, stations in the Central Apennines (Supplementary Figure S2) have similar power change in both daytime and nighttime (Supplementary Figure S4). The reduction in the daytime noise levels during the COVID-19 lockdown is compatible with the limitations imposed on movement and activities. Most of the closed commercial and public activities are held during the day, creating cultural noise from people and machinery that enriches the spectrum’s short periods. At night, cultural noise is mostly dominated by leisure-related activities (e.g., catering and social gatherings). As expected, the halt of these activities caused a drastic noise level reduction, but the median noise level change at nighttime is lower than the daytime change.
The temporal distributions of weekday and weekend differences are similar to the day and night difference distribution. However, there is a major difference; the background noise level reduction at weekends is larger for all periods of interest in various stations. This can be because during the lockdown period, essential workers and industries were still operational and created cultural noise, whereas, on weekends, everyone was at their homes due to the restrictions. The general assumption for the weekends is the absence of the cultural noise created by leisure-related activities. This leads to a larger background noise difference between the weekends of 2022 and lockdown. Supplementary FigureS6, S7 show that weekdays of 2022 and weekdays of the lockdown period are noisier than weekends, but in the lockdown period, weekday and weekend difference is larger than the 2022 weekday and weekend difference.
Some of the RAN stations experienced larger noise level reduction than the others during the COVID-19 lockdown (Table 3). At short periods (
Moreover, we consider the 10 most populated provinces to analyze the noise level change. Milan, the most populated province in Italy, has no RAN stations, but in other 9 provinces, there are 34 stations (Supplementary Figure S8). Stations in the big provinces have a common trend of decreasing background noise during the lockdown (Table 4). After the declaration of the lockdown, many people moved to their hometown town, creating a flux of people moving to southern Italy (Angela and Lorenzo, 2020). However, stations in major southern Italian provinces such as Naples, Catania, and Palermo also show a clear trend of decreasing noise levels.
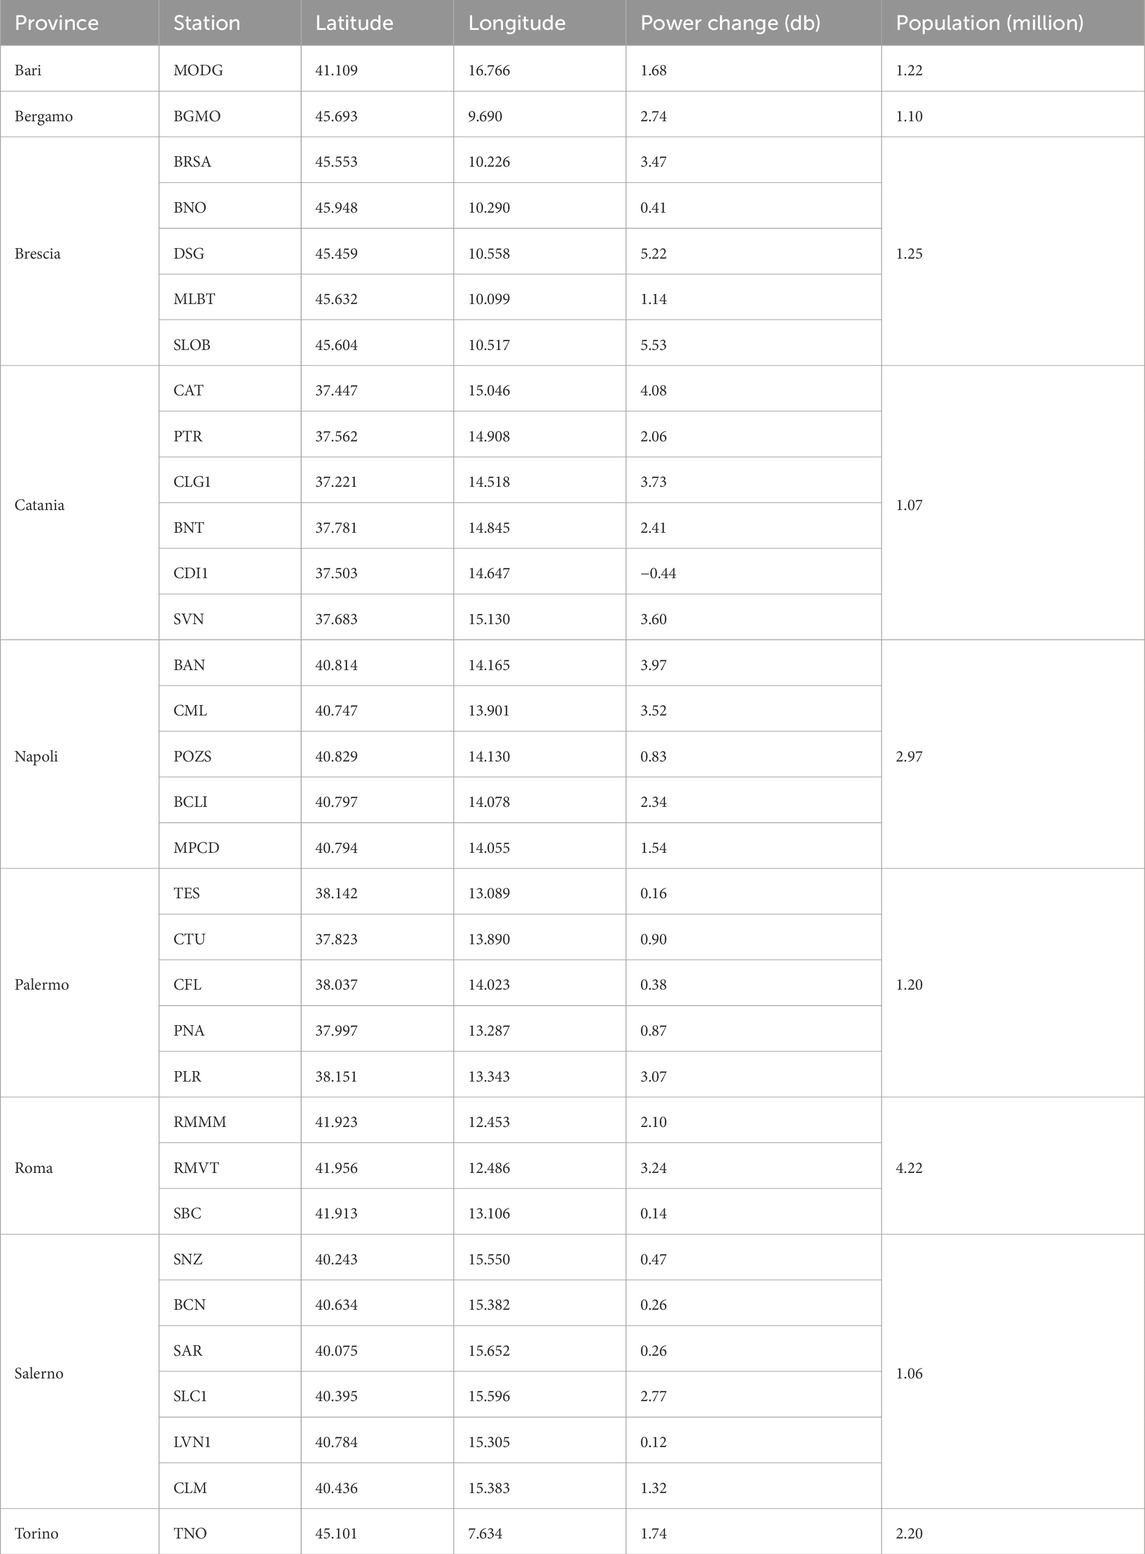
Table 4. Background noise level changes in stations located in top 9 most populated Italian provinces.
In those 9 provinces, median noise reductions are 1.68, 2.74, 3.47, 3.01, 2.93, 0.87, 2.1, 0.26, and 1.74 dB for Bari, Bergamo, Brescia, Catania, Naples, Palermo, Rome, Salerno, and Turin, respectively. Brescia, which is located in the Lombardy region (in Northern Italy), where the COVID-19 pandemic has had the biggest impact since the beginning of the pandemic, has the highest noise reduction among those provinces. This may have led to the strictest enforcement of the lockdown actions, hence reducing the noise levels. Even though other studies do not show a sharp reduction of noise levels in terms of percentage with respect to the non-lockdown period (e.g., Piccinini et al., 2020; Xiao et al., 2020), the background noise is reduced in Brescia and Torino in RAN stations. In Central and Southern Italy, provinces have different reduction trends. Naples and Salerno are neighbouring provinces in the Campania region. None of the stations in Salerno province is in the city’s centre but in nearby villages. Hence, these stations are not included in Figure 7 In Naples, on the other hand, only the CML station is located on Ischia Island, whereas all other stations are located in densely populated districts of Naples. Even though CML is located in a small town similar to stations in Salerno, Ischia Island is a very touristy place. The noise reduction in CML can be linked to the reduction of touristic activities. Other stations in Naples show the effect of the lockdown in background noise. In Southern Italy, the provinces of Palermo and Catania are located on Sicily Island. In Palermo, only the PLR station is in the city centre, whereas in Catania, all the stations except CDI1 are either in the city centre or relatively big towns. Furthermore, BNT and CAT stations are located inside industrial zones, and CAT is also close to the Catania Airport.
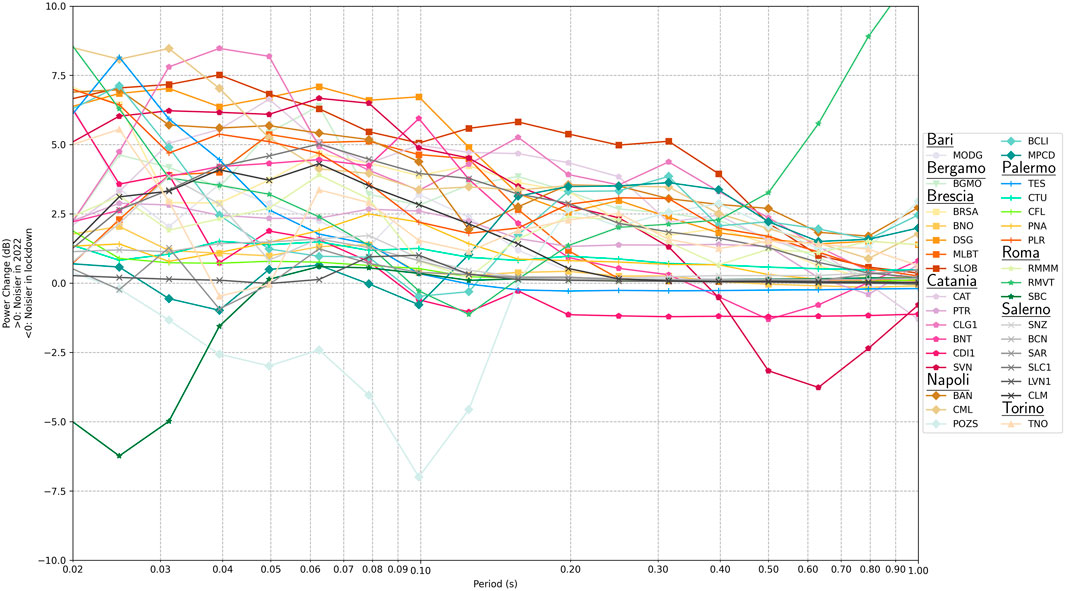
Figure 7. Noise level change between the COVID-19 lockdown and 2022 at the stations located in top 9 most populated Italian provinces.
Several assumptions have been made in the study, and the results are interpreted under those assumptions. The first assumption is that human behaviour at any given time has not changed between the lockdown and 2022. This is an important factor as we assume all the differences between the two time spans directly relate to the lockdown measures. This could be better understood with auxiliary data such as mobile phone usage on the selected time spans, but we have not got access to such data for the year of 2022. Secondly, we assume that the noise patterns around the stations are the same. For instance, if any new low-period noise source is added next to a station during 2022, it would increase the overall noise level for that year, eventually creating an unrealistically high noise level difference between the select time spans. However, to understand such new sources, a detailed spatial analysis of land usage and commercial and human establishment must be conducted station-wise. The study’s scope is to use RAN stations to provide a country-wide analysis of the noise level chances during the lockdown period. The above-mentioned individual changes may occur locally, but they should not change the overall trend.
Thanks to the drop in background noise level, the RAN network’s capability of earthquake detection may improve during the COVID-19 lockdown. For instance, the PTF station, which is located in central Italy, east of the Apennines, can hardly detect magnitudes up to 2.5 according to the corner frequency estimation developed by Brune (1970) in 2022 (Figure 8). In contrast, during the COVID-19 lockdown, it could detect earthquakes with magnitudes between 1.5 and 2.5 up to 5 km. Since the RAN network aims to determine the earthquakes that may cause harm to infrastructure and the public, such low magnitude is not really in the network’s interest. However, from a scientific point of view, during the lockdown period, the microseismicity of the Italian territory could be monitored with more precision as the accelerometric stations could also detect low-magnitude earthquakes.
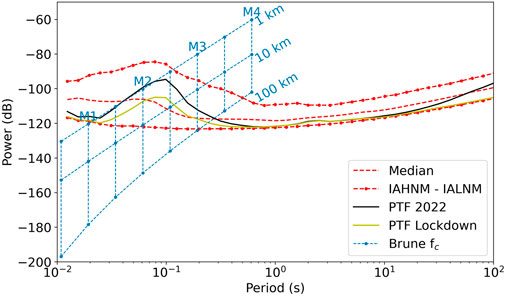
Figure 8. Noise level change at PTF station between the lockdown period and 2022. Blue dashed lines represent the corner frequencies of various earthquake magnitudes over distances calculated by Brune (1970)and red dashed lines are the Italian background noise levels for accelerometric network determined by Fornasari et al. (2023).
As mentioned in the Introduction, various studies have been conducted in Italy to understand the background noise level changes during the COVID-19 lockdown. Piccinini et al. (2020) used 78 seismic stations from Northern and Central Italy and analyzed the periods between 0.2 and 0.05 s. Their study found that noise levels dropped significantly in areas with minimal human activity, whereas in the populated cities and their surroundings, the level reduction was minimal. One of the examples in the study is the FIR station located in the city of Florence. There are 3 RAN stations located in the same city, which are FIR, FRZN, and FIE, but only the latter (i.e., FIE, latitude: 43.807, longitude: 11.294) was in continuous recording mode during the lockdown period. In agreement with Piccinini et al. (2020) noise levels are decreased only 0.56 dB, 0.05 dB, 0.09 dB, and 0.08 dB for 0.1, 0.25, 0.5, and 1.0 s, respectively. However, many other major cities in Central Italy had significant noise level changes. The study of Piccinini et al. (2020) may show some specific cities with minimal noise reduction, but our results contradict theirs. Moreover, RAN stations in Northern Italian cities such as Bergamo and Brescia have significant noise level reduction during the lockdown period. In the same study, DOSS station (latitude: 45.881, longitude: 11.188), located at the border between the Veneto and Trentino-South Tyrol regions, is given as an example of a significant noise level drop. During the lockdown, commuting between regions was only permitted for essential workers (the closest provincial road is almost 400 m away) and ski resorts were shut down, which are most likely noise sources for the DOSS station. Even though it is true in relative terms, since the station is not noisy initially, the noise level drop is insignificant. VALS station is located between the same regions, and it is close to a provincial road where noise levels were increased during the lockdown with 0.60, 2.08, 1.92, and 0.39 dB for 0.1, 0.25, 0.5, and 1.0 s, respectively. On the other hand, several stations had minimal noise level change (
Poli et al. (2020) stations located in major cities such as Milan (there is no RAN station in the city) show significant noise level reduction, whereas, at other stations, such as FIR, the noise level change is not noticeable, which is in agreement with the study of Piccinini et al. (2020). As shown in Figure 7, at most stations in the proximity of major cities a noise level reduction during the lockdown is noticeable. The decrease of the noise levels is also comparable with Poli et al. (2020) as both our and their study find noise level drops up to 10 dB during the lockdown period. Even though Poli et al. (2020) uses the data from 2019 to compare with the lockdown, noise level changes are comparable with our study, which indicates that in 2022, background noise levels may go back to the pre-lockdown level.
A study of Xiao et al. (2020) found average noise reduction in single stations located in the cities of Florence, Milan, Naples, Rome, and Turin between 1 dB and 6 dB, which is in agreement with our study. Cannata et al. (2021) focused on the eastern part of Sicily island by observing the noise level reduction in 18 seismic stations between 0.1 s and 0.025 s. They used mobility data collected by Google, Apple and Facebook to correlate the human mobility data with noise reduction. They found noise reduction up to 60% in some stations in very short periods (
In this study, we analyze the change in short-period background noise characteristics of RAN by comparing the COVID-19 lockdown period and the year of 2022.248 stations that are mostly located in populated areas are used to determine the effect of the lockdown. In this way, it is unique since the stations allow us to understand the effect of the reduction of human-related activities on the settlements in terms of seismic noise levels in Italy, where the COVID-19 pandemic had significant results with almost 200,000 casualties. It was found that restrictions regarding human activities caused a reduction of background noise during the lockdown. This effect can be seen in almost every part of the Italian territory, and the median noise level decrease is 1.46 dB, and it can reach more than 4 dB. In shorter periods, such as 0.1 s, where the cultural activities are more dominant, the noise reduction was even higher and reached more than 7 dB. Noise reduction also occurred during specific time ranges. Both daytime and nighttime during the lockdown were quieter with respect to their 2022 counterparts; the same trend can be seen on weekdays and weekends. RAN stations located in public places such as schools and city halls have large noise drops due to the conversion to remote working for many public institutes. Several stations were noisier during the lockdown, but no clear pattern was found to justify their unusual behaviour. In the most populated cities, noise level drops were also significant, except for various stations in Catania close to Mt. Etna, whose activity during the lockdown period enriched the background noise around 1 s. The reduction of background noise increased the opportunity to detect lower magnitude earthquakes: future microseismicity studies may benefit from the data collected during the lockdown by RAN stations.
The data analyzed in this study is subject to the following licenses/restrictions: Continuous recordings from RAN stations are only available within agreements between institutions. The data produced for this study is available in Github at the following link https://github.com/dertuncay/RAN-Covid-Noise.
DE: Conceptualization, Data curation, Formal Analysis, Investigation, Methodology, Resources, Software, Validation, Visualization, Writing–original draft, Writing–review and editing. SF: Conceptualization, Data curation, Formal Analysis, Investigation, Methodology, Resources, Software, Validation, Visualization, Writing–original draft, Writing–review and editing. GC: Funding acquisition, Project administration, Resources, Supervision, Validation, Writing–original draft, Writing–review and editing.
The author(s) declare that financial support was received for the research, authorship, and/or publication of this article. This research received financial support from the Italian Civil Protection Department — Presidency of the Council of Ministers (DPC) under the agreement between DPC and the University of Trieste for the accelerometric monitoring of the Friuli Venezia Giulia Region (number agreement: RAN2020-2022 CUP J91F20000110001) and RETURN Extended Partnership and received funding from the European Union Next-GenerationEU (National Recovery and Resilience Plan – NRRP, Mission 4, Component 2, Investment 1.3 – D.D. 1243 2/8/2022, PE0000005, CUP F83C22001660002)
The authors declare that the research was conducted in the absence of any commercial or financial relationships that could be construed as a potential conflict of interest.
The author(s) declare that no Generative AI was used in the creation of this manuscript.
All claims expressed in this article are solely those of the authors and do not necessarily represent those of their affiliated organizations, or those of the publisher, the editors and the reviewers. Any product that may be evaluated in this article, or claim that may be made by its manufacturer, is not guaranteed or endorsed by the publisher.
The Supplementary Material for this article can be found online at: https://www.frontiersin.org/articles/10.3389/feart.2024.1507241/full#supplementary-material
Ahmad, A. B., and Tsuji, T. (2021). Traffic monitoring system based on deep learning and seismometer data. Appl. Sci. 11, 4590. doi:10.3390/app11104590
Angela, G., and Lorenzo, T. (2020). Leaked coronavirus plan to quarantine 16m sparks chaos in Italy. Available at: https://www.theguardian.com/world/2020/mar/08/leaked-coronavirus-plan-to-quarantine-16m-sparks-chaos-in-italyl (Accessed: September 21, 2023).
Anthony, R. E., Ringler, A. T., and Wilson, D. C. (2022). Seismic background noise levels across the continental United States from usarray transportable array: the influence of geology and geography. Bull. Seismol. Soc. Am. 112, 646–668. doi:10.1785/0120210176
Anthony, R. E., Ringler, A. T., Wilson, D. C., Bahavar, M., and Koper, K. D. (2020). How processing methodologies can distort and bias power spectral density estimates of seismic background noise. Seismol. Res. Lett. 91, 1694–1706. doi:10.1785/0220190212
Brenguier, F., Boué, P., Ben-Zion, Y., Vernon, F., Johnson, C. W., Mordret, A., et al. (2019). Train traffic as a powerful noise source for monitoring active faults with seismic interferometry. Geophys. Res. Lett. 46, 9529–9536. doi:10.1029/2019GL083438
Brune, J. N. (1970). Tectonic stress and the spectra of seismic shear waves from earthquakes. J. Geophys. Res. 75, 4997–5009. doi:10.1029/JB075i026p04997
Cannata, A., Cannavò, F., Di Grazia, G., Aliotta, M., Cassisi, C., De Plaen, R. S., et al. (2021). Seismic evidence of the covid-19 lockdown measures: a case study from eastern sicily (Italy). Solid earth. 12, 299–317. doi:10.5194/se-12-299-2021
Cannata, A., Di Grazia, G., Montalto, P., Ferrari, F., Nunnari, G., Patanè, D., et al. (2010). New insights into banded tremor from the 2008–2009 mount etna eruption. J. Geophys. Res. Solid Earth 115. doi:10.1029/2009JB007120
Cauzzi, C., and Clinton, J. (2013). A high-and low-noise model for high-quality strong-motion accelerometer stations. Earthq. Spectra 29, 85–102. doi:10.1193/1.4000107
Costa, G., Brondi, P., Cataldi, L., Cirilli, S., Ertuncay, D., Falconer, P., et al. (2022). Near-real-time strong motion acquisition at national scale and automatic analysis. Sensors 22, 5699. doi:10.3390/s22155699
Costa, G., Moratto, L., and Suhadolc, P. (2010). The Friuli venezia giulia accelerometric network: RAF. Bull. Earthq. Eng. 8, 1141–1157. doi:10.1007/s10518-009-9157-y
D’Alessandro, A., Greco, L., Scudero, S., and Lauciani, V. (2021). Spectral characterization and spatiotemporal variability of the background seismic noise in Italy. Earth Space Sci. 8. doi:10.1029/2020EA001579
Dias, F. L., Assumpção, M., Peixoto, P. S., Bianchi, M. B., Collaço, B., and Calhau, J. (2020). Using seismic noise levels to monitor social isolation: an example from rio de janeiro, Brazil. Geophys. Res. Lett. 47, e2020GL088748. doi:10.1029/2020GL088748
Diaz, J., Ruiz, M., and Jara, J.-A. (2021). Seismic monitoring of urban activity in barcelona during the covid-19 lockdown. Solid earth. 12, 725–739. doi:10.5194/se-12-725-2021
Fornasari, S. F., Ertuncay, D., and Costa, G. (2023). Seismic background noise levels in the Italian strong-motion network. Nat. Hazards Earth Syst. Sci. 23, 3219–3234. doi:10.5194/nhess-23-3219-2023
Gorini, A., Nicoletti, M., Marsan, P., Bianconi, R., de Nardis, R., Filippi, L., et al. (2010). The Italian strong motion network. Bull. Earthq. Eng. 8, 1075–1090. doi:10.1007/s10518-009-9141-6
Grecu, B., Borleanu, F., Tiganescu, A., Poiata, N., Dinescu, R., and Tataru, D. (2021). The effect of 2020 covid-19 lockdown measures on seismic noise recorded in Romania. Solid earth. 12, 2351–2368. doi:10.5194/se-12-2351-2021
Green, D. N., Bastow, I. D., Dashwood, B., and Nippress, S. E. (2017). Characterizing broadband seismic noise in central london. Seismol. Res. Lett. 88, 113–124. doi:10.1785/0220160128
Hayashida, T., Yoshimi, M., Suzuki, H., Mori, S., Kagawa, T., Ichii, K., et al. (2023). Tracking the effect of human activity on MeSO-net noise using seismic data traffic—did seismic noise in Tokyo truly decrease during the COVID-19 state of emergency? Seismol. Res. Lett. 94, 2750–2764. doi:10.1785/0220230015
Istituto Superiore per la Protezione e la Ricerca Ambientale (2022). Carta nazionale di copertura del suolo
Kar, C., and Mohanty, A. (2006). Monitoring gear vibrations through motor current signature analysis and wavelet transform. Mech. Syst. signal Process. 20, 158–187. doi:10.1016/j.ymssp.2004.07.006
Kogan, M. G., Kim, W.-Y., Bock, Y., and Smyth, A. W. (2008). Load response on a large suspension bridge during the nyc marathon revealed by gps and accelerometers. Seismol. Res. Lett. 79, 12–19. doi:10.1785/gssrl.79.1.12
Lecocq, T., Hicks, S. P., Noten, K. V., van Wijk, K., Koelemeijer, P., Plaen, R. S. M. D., et al. (2020). Global quieting of high-frequency seismic noise due to covid-19 pandemic lockdown measures. Science 369, 1338–1343. doi:10.1126/science.abd2438
McNamara, D. E., and Buland, R. P. (2004). Ambient noise levels in the continental United States. Bull. Seismol. Soc. Am. 94, 1517–1527. doi:10.1785/012003001
Pérez-Campos, X., Espíndola, V. H., González-Ávila, D., Zanolli Fabila, B., Márquez-Ramírez, V. H., De Plaen, R. S., et al. (2021). The effect of confinement due to covid-19 on seismic noise in Mexico. Solid earth. 12, 1411–1419. doi:10.5194/se-12-1411-2021
Peterson, J. R. (1993). Observations and modeling of seismic background noise. Tech. Rep. doi:10.3133/ofr93322
Piccinini, D., Giunchi, C., Olivieri, M., Frattini, F., Di Giovanni, M., Prodi, G., et al. (2020). Covid-19 lockdown and its latency in northern Italy: seismic evidence and socio-economic interpretation. Sci. Rep. 10, 16487–16510. doi:10.1038/s41598-020-73102-3
Poli, P., Boaga, J., Molinari, I., Cascone, V., and Boschi, L. (2020). The 2020 coronavirus lockdown and seismic monitoring of anthropic activities in northern Italy. Sci. Rep. 10, 9404–9408. doi:10.1038/s41598-020-66368-0
Presidency of Counsil of Ministers - Civil Protection Department (1972). Italian strong motion network. Bull. Earthq. Eng. 8. 1075–1090. doi:10.7914/SN/IT
Roy, K. S., Sharma, J., Kumar, S., and Kumar, M. R. (2021). Effect of coronavirus lockdowns on the ambient seismic noise levels in Gujarat, northwest India. Sci. Rep. 11, 7148–7213. doi:10.1038/s41598-021-86557-9
Ścisło, Ł., Łacny, Ł., and Guinchard, M. (2021). Covid-19 lockdown impact on cern seismic station ambient noise levels. Open Eng. 11, 1233–1240. doi:10.1515/eng-2021-0124
Shen, J., and Zhu, T. (2021). Seismic noise recorded by telecommunication fiber optics reveals the impact of covid-19 measures on human activity. Seismic Rec. 1, 46–55. doi:10.1785/0320210008
Somala, S. N. (2020). Seismic noise changes during covid-19 pandemic: a case study of shillong, India. Nat. Hazards 103, 1623–1628. doi:10.1007/s11069-020-04045-1
Terry, C., Rothendler, M., Zipf, L., Dietze, M. C., and Primack, R. B. (2021). Effects of the covid-19 pandemic on noise pollution in three protected areas in metropolitan boston (USA). Biol. Conserv. 256, 109039. doi:10.1016/j.biocon.2021.109039
Wang, W., Cai, G., Lai, G., Chen, M., and Zhang, L. (2021). Ambient noise level in eastern north China from chinarray and its response to covid-19. Seismol. Res. Lett. 92, 3586–3601. doi:10.1785/0220200261
Weber, E., Convertito, V., Iannaccone, G., Zollo, A., Bobbio, A., Cantore, L., et al. (2007). An advanced seismic network in the Southern Apennines Italy for seismicity investigations and experimentation with earthquake early warning. Seismol. Res. Lett. 78, 622–634. doi:10.1785/gssrl.78.6.622
Welch, P. (1967). The use of fast fourier transform for the estimation of power spectra: a method based on time averaging over short, modified periodograms. IEEE Trans. audio electroacoustics 15, 70–73. doi:10.1109/TAU.1967.1161901
Xiao, H., Eilon, Z. C., Ji, C., and Tanimoto, T. (2020). Covid-19 societal response captured by seismic noise in China and Italy. Seismol. Soc. Am. 91, 2757–2768. doi:10.1785/0220200147
Yabe, S., Imanishi, K., and Nishida, K. (2020). Two-step seismic noise reduction caused by covid-19 induced reduction in social activity in metropolitan tokyo, Japan. Earth, Planets Space 72, 167–211. doi:10.1186/s40623-020-01298-9
Zambonelli, E., de Nardis, R., Filippi, L., Nicoletti, M., and Dolce, M. (2011). Performance of the Italian strong motion network during the 2009, L’Aquila seismic sequence (central Italy). Bull. Earthq. Eng. 9, 39–65. doi:10.1007/s10518-010-9218-2
Zhang, X., Arrowsmith, S., Tsongas, S., Hayward, C., Meng, H., and Ben-Zion, Y. (2022). A data-driven framework for automated detection of aircraft-generated signals in seismic array data using machine learning. Seismol. Res. Lett. 93, 226–240. doi:10.1785/0220210198
Keywords: seismic noise, COVID-19 lockdown, anthropogenic seismic noise, seismic monitoring, seismic network
Citation: Ertuncay D, Fornasari SF and Costa G (2025) Effect of the COVID-19 lockdown on background noise levels in Italian strong motion network. Front. Earth Sci. 12:1507241. doi: 10.3389/feart.2024.1507241
Received: 07 October 2024; Accepted: 13 December 2024;
Published: 08 January 2025.
Edited by:
Paolo Capuano, University of Salerno, ItalyReviewed by:
Sebastiano D'Amico, University of Malta, MaltaCopyright © 2025 Ertuncay, Fornasari and Costa . This is an open-access article distributed under the terms of the Creative Commons Attribution License (CC BY). The use, distribution or reproduction in other forums is permitted, provided the original author(s) and the copyright owner(s) are credited and that the original publication in this journal is cited, in accordance with accepted academic practice. No use, distribution or reproduction is permitted which does not comply with these terms.
*Correspondence: Simone Francesco Fornasari , c2ltb25lZnJhbmNlc2NvLmZvcm5hc2FyaUB1bml0cy5pdA==
Disclaimer: All claims expressed in this article are solely those of the authors and do not necessarily represent those of their affiliated organizations, or those of the publisher, the editors and the reviewers. Any product that may be evaluated in this article or claim that may be made by its manufacturer is not guaranteed or endorsed by the publisher.
Research integrity at Frontiers
Learn more about the work of our research integrity team to safeguard the quality of each article we publish.