 Yuning Jin1,2,3
 Tao Dai2,3*
- 1School of Earth and Resources, China University of Geosciences, Beijing, China
- 2Institute of Mineral Resources, Chinese Academy of Geological Sciences, Beijing, China
- 3Research Center for Strategy of Global Mineral Resources, Chinese Academy of Geological Sciences, Beijing, China
With the application of tin in photovoltaic power generation, new energy vehicles, and other emerging industries, the contradiction between the supply and demand of tin resources has become increasingly prominent, which further exacerbates the competition between tin resource importing and exporting countries. According to the global trade data from 2002 to 2022, this paper classifies five kinds of tin-containing products into three commodity types, namely, upstream, midstream, and downstream, and constructs the international trade network, import competition network, and export competition network. This paper selects key competitive countries and relationships, examines the characteristics of specific communities, and analyzes the network’s structural features and evolution patterns over time. The results showed that: (1) The distribution of the intensity of competition in tin products is very uneven, the trend of oligopoly in upstream product competition is obvious, and the competition in midstream and downstream products is getting more and more intense. (2) The tin industry chain has developed a tripartite pattern of import competition in Asia, Europe, and North America. Developed countries primarily compete in midstream tin products, while developing countries focus on importing upstream and downstream tin products. (3) The export competition for tin products is primarily concentrated in Asia, with Malaysia losing its centrality and Myanmar, Indonesia, and China gaining the centrality. (4) The competition communication in upstream tin products is more evident than in midstream and downstream products, and their stability is stronger. The above analysis can help countries identify their trade competitors and provide suggestions for finding new partners.
1 Introduction
Tin (Sn) is one of the earliest metals used by humanity and is a fundamental material in the advancement of industry and technology in the contemporary world (Howe and Watts, 2005). In recent years, the range of tin applications has been expanding from traditional fields such as solder, tin plates, and chemicals to new high-tech areas such as batteries, solar photovoltaics, thermoelectric materials, the generation of hydrogen, carbon capture catalysts, and water treatment (USGS, 2023).
Constrained by real-world circumstances and socioeconomic factors, the disparity between the global supply and demand for tin resources has gained significant prominence. In 2022, the total global demand for tin was 383,000 tons, with chemicals (23%), tinplate (22%), alloys (11%), solder (10%), babbitt, brass and bronze, and tinning (7%) and bar tin (2%), while the remaining 25% found use in other sectors (USGS, 2023). However, the global production, amounted to a mere 300,000 tons (USGS, 2023). Furthermore, the distribution of these resources is highly concentrated, the primary players in this market are Indonesia (17%), China (15%), Myanmar (15%), and Australia (12%) (USGS, 2023). Many countries heavily rely on international trade to access tin resources. In addition, global tin reserves were estimated at approximately 4.6 million tons in 2022. Yet, these reserves are projected to last for just 22 years (Izard and Müller, 2010) given the current extraction rates. Despite ongoing prospecting activities in recent years, they have not stimulated a significant increase in reserves.
Given the critical significance and limited availability of tin, nations across the globe are increasingly focusing their attention on this precious resource. In 2016, China included tin in its list of 24 strategic metal minerals, and the US Geological Survey (USGS) ranked tin ore as one of 50 critical minerals in 2022. In recent years, the global landscape has grown more complex, with the surge of international trade protectionism and anti-globalization sentiments directly impeding the smooth flow of mineral resources on a global scale. This trend poses a direct threat to national resource security. Consequently, it becomes vital to examine the competitive dynamics within the tin industry from the perspective of the industrial chain.
In recent years, research on tin resources has achieved rich results in aspects such as trade, supply and demand, material flow, etc. Schütte conducted a detailed analysis of the global tin ore trade in North and East Africa and noted that this trade can be stabilized if the market regulation is effective (Schutte, 2019). Zeng Tao and his team also explored the supply and demand pattern of tin resources in the countries along the “Belt and Road” (Zeng et al., 2019). They paid close attention to the extent of resource extraction, international trade, etc. Furthermore, Li and colleagues expounded on the flow of tin in various countries during the period of 1999–2018, which fills the gap in the global data on the flow of tin substances (Li et al., 2021b). Diprose and his team explores the challenges and limits of voluntary supply chain governance as it interacts with an entrenched “extractive settlement” in Indonesia’s major tin producing islands of Bangka and Belitung (Diprose et al., 2022). Bradley and his team critically assess the circularity and criticality indicator values for tin and calculate new values using material flow analysis (Bradley et al., 2024). Robertson give a wide-ranging picture of the word tin market (Robertson, 2024).
With the rise of the complex network approach, there is more and more research on the complex network of resource trade. Complex networks, often used as abstractions for various intricate real-world systems, currently stand as a focal point of interest within the international academic community (Cao et al., 2006; Watts and Strogatz, 1998). Complex network modeling has found its way into numerous international and regional research endeavors concerning resource and energy trade. Scholars have utilized the complex network method to analyze the trade structure characteristics of petroleum (An et al., 2014; Ji et al., 2014), natural gas (Geng et al., 2014), lithium mineral products (Tian et al., 2021; Shao et al., 2022), and other products, revealing the information implied by the relevant trade.
Building upon existing primary trade networks, some researchers have delved into the competitive dynamics within these networks. For example, Zhang et al. (2014) studied global oil trade competition, propagation, and evolution from the perspective of importing countries using complex network theory. Wang et al. (2019) established a global graphite import competition network and examined the factors affecting the intensity of competition. Shao et al. (2021) used the trade data from 2009 to 2018, complex network theory was adopted to analyze the global lithium import competition pattern and used a panel regression model to analyze the impact of lithium trade network characteristics on lithium import competition pattern.
In recent years, there has been a growing emphasis on industry chains, leading to an upsurge in research on trade networks within the mineral resources industry chain. For instance, Zhong et al. (2018) proposed the use of material flow analysis and complex network methods to investigate the international trade encompassing the entire iron industry chain. Additionally, Li et al. (2021a) examined the trade characteristics of the global copper industry chain and key countries, taking a comprehensive approach by constructing trade networks for various links within the copper industry chain. In a similar vein, Li X. et al. (2022) scrutinized the current state of cobalt trade from a holistic industry chain perspective. Furthermore, Zhang et al. (2022) analyzed the evolving import competition patterns in the rare earth industry, considering the intricate dynamics from an industry chain viewpoint.
In summary, previous research on tin resource trade generally concentrates on the exploration of supply and demand and material flow. In contrast, the research related to the competitive relationship of tin resources trade triggered by the contradiction between supply and demand is relatively weak. Therefore, this study applies the international trade data of tin products from 2002 to 2022 constructs the international trade network of tin products and its derived import and export competition network, and conducts a study on the import and export competition pattern of tin products, thereby shedding light on policymakers to improve the existing policy measures for tin resource management and development.
2 Data and method
2.1 Data
The trade data used in this paper were sourced from UN_COMTRADE and encompassed the period from 2002 to 2022 This dataset includes the import and export flows involving all countries and regions engaged in the international trade of tin resources, hereafter referred to as “countries.” Trade volume is quantified in kilograms.
To facilitate our analysis, we considered the full spectrum of products across the tin industry chain, categorized into upstream, midstream, and downstream segments. Specifically, we selected the following product categories: Tin ores and concentrates (HS Code: 260900), Tin, not alloyed (HS Code: 800110), Tin, alloyed (HS Code: 800120), Tin bars, rods, profiles, and wire (HS Code: 800300), and Other articles of tin (HS Code: 800700) are chosen as representative products to denote the entire tin industrial chain. The latter category, “Other articles of tin,” encompasses various products not specified elsewhere, which includes items for household, table, kitchen, or bathroom use, as well as all tin-containing products not coated or plated with precious metals.
The volume of tin trade contained within each product, identified by its HS code, is determined by multiplying the total trade volume of that specific product by the corresponding tin content factor, as outlined in Table 1. The total tin trade volume within each link of the tin industry chain is then calculated as the aggregate of the tin trade volumes associated with all HS code products included in each major category (Gu and Liu, 2022).
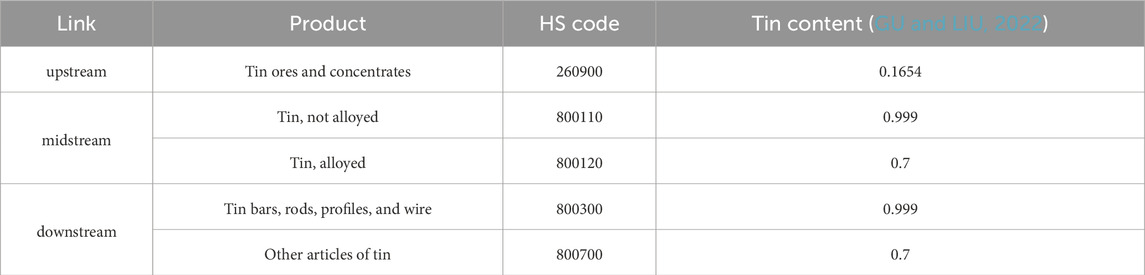
Table 1. HS coding, industrial chain tin-containing coefficient of tin-containing commodities.
The UN_COMTRADE database exhibits asymmetric import and export data due to slight differences in statistical caliber between countries’ trade data. Nonetheless, these disparities are typically minor when considered in the context of the overall trade volume. As a result, this study selects the dataset linked to the party with the greater import and export volume of tin products in each country as the basis for analysis.
2.2 Method
2.2.1 Complex network construction
International trade networks represent intricate systems of trade interactions among countries, serving as valuable tools for uncovering the underlying patterns and evolution of this system. These insights, in turn, offer a foundation for shaping pertinent governmental policies and decisions (Fan et al., 2014). In the complex network model, denoted as
The international trade network of tin products consists of nodes representing countries and edges representing trade relations between these nations. The weight of the edges corresponds to the trade volume of tin products, while the direction of the edges indicates the flow direction (Fagiolo et al., 2008).
The tin products import and export competition network emerges as a derived network from the tin products international trade network. Due to various factors like price disparities, international relations, and industry distribution, countries typically source tin products from multiple exporting nations, leading to intense import competition among tin product importing countries. Similarly, export competition arises among countries exporting tin products.
The model illustrating the import and export competition network for tin products is presented in Figure 1. When countries I and J both import tin products from country M within the same year (indicated by solid lines with arrows), it signifies that I and J are engaged in import competition. The import competition network features I and J as its nodes, and the corresponding connecting lines (dotted line 1) represent the edges within this network. Similarly, when countries M and N concurrently export tin products to country I in a given year (as shown by solid lines with arrows), it implies that M and N are in export competition. In this export competition network, M and N serve as the network’s nodes, while the connecting lines (dotted line 2) represent the network’s edges.
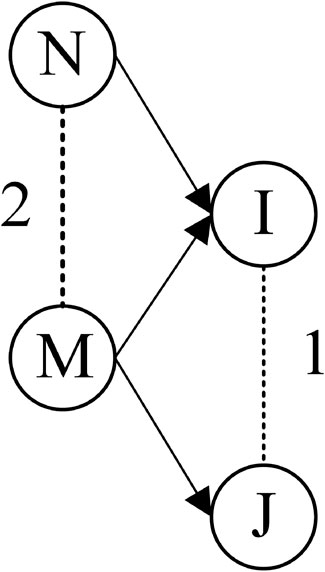
Figure 1. Schematic diagram of the competitive relationship.
This paper proposes a tin products competition network based on whether importers share the same tin products import source. The network is denoted as
Drawing from Glick and Rose’s indicators and incorporating a measure introduced by Wang et al. for gauging the degree of direct competitive intensity in graphite trade, we define the competitive intensity within the import and export network of tin products as follows in Equation 2 (Glick and Rose, 1999; Wang et al., 2019):
Where
The competition intensity indicator comprises two parts. The first part indicates the proportion of trade competition volume from the source country m to total world trade volume. The larger the proportion, the greater the competition pressure between importers i and j. The second part measures the import structure of importers I and j. The more similar the import structure, the more intense the competition. Table 2 and Table 3 shows the top five competition intensity values for 2002, 2012 and 2022.
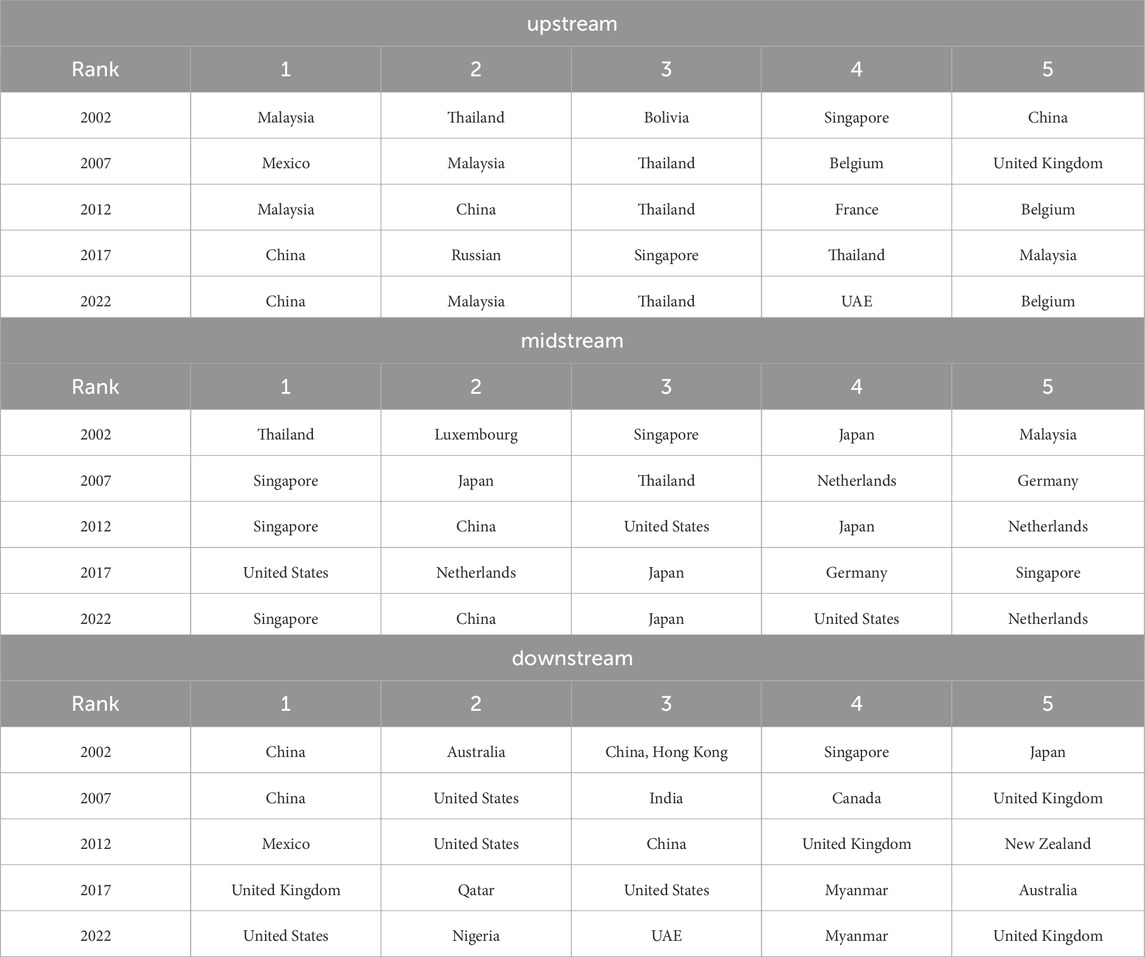
Table 2. The top 5 importers ranked by competitiveness.
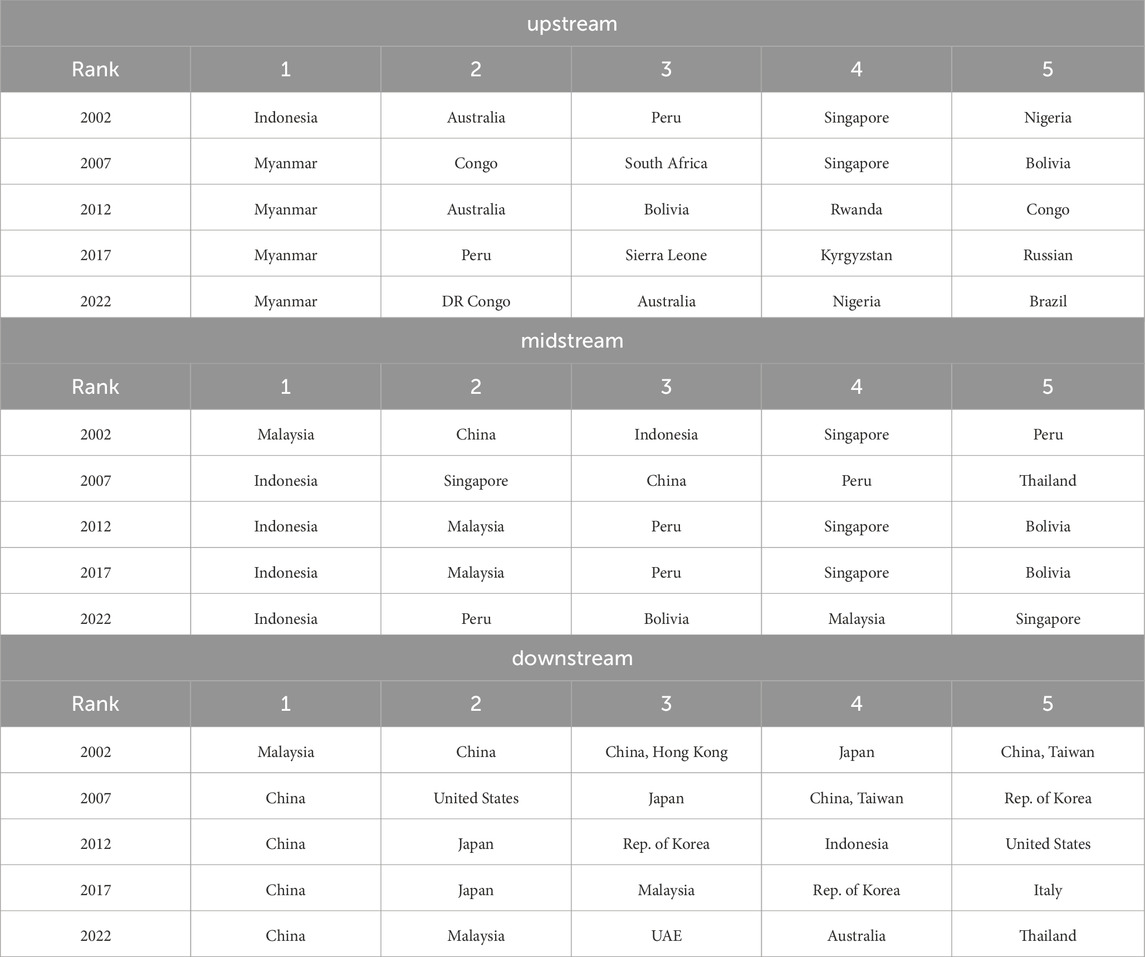
Table 3. The top 5 exporters ranked by competitiveness.
2.2.2 Network structural characteristics indicators
2.2.2.1 Degree
In a network, a node’s degree signifies the count of connections it has with other nodes in the network, serving as an indicator of the competitive relationships between countries in the context of tin products. A country with a higher number of competitive ties with other nations will exhibit a larger degree. The average degree is the average of all nodes’ degrees throughout the network (Barabási and Albert, 1999). The formula is as follows in Equations 3, 4:
Where
2.2.2.2 Weighted degree
The weighted degree
Where
2.2.2.3 Betweenness centrality
Betweenness centrality is a measure of the number of weighted shortest paths through nodes, reflecting a country’s resource control. It also symbolizes the state of a network’s connectedness and the importance of the node as a network bridge. A larger value of betweenness centrality implies greater resources control by a country (Freeman, 1977). The formula is as follows in Equation 7:
Where
2.2.2.4 Clustering coefficient
The clustering coefficient is used to measure the probability that any two countries that have competitive relationships with tin products importer or exporter
Where
2.2.2.5 Average shortest path length
The average shortest path length is the mean distance between two nodes, serving as an indicator of the efficiency and performance of information transmission within the competition network (Watts and Strogatz, 1998). The formula is as follows in Equation 10:
Where
2.2.2.6 Modularity
Due to differences in regional competition, certain communities may exist in the competitive network for the import and export of tin products. Therefore, we use the algorithm developed by Blondel et al. (2008) to divide the network into communities. Modularity serves as a metric for quantifying the extent of network community division. It falls within the range from −1 to 1. The higher modularity values indicate a more pronounced network division. The formula is as follows in Equations 11–13:
where
2.2.2.7 Normalized mutual information
Normalized Mutual Information (NMI) serves as a quantitative gauge of the information shared between two clustering outcomes, providing insight into the similarity between results generated by different algorithms. A higher NMI value indicates a greater similarity between these outcomes. NMI values fall within the range from 0 to 1, where a value of 1 denotes that the two clustering results are identical, and a value of 0 signifies complete dissimilarity (Cover, 1999; Zhong et al., 2014). The formula is as follows in Equation 14:
Where
The NMI research methodology employed in this paper can be outlined as follows:
If
2.2.2.8 Core–periphery model
Due to the different import volumes and sources of different importing countries, the importing countries may play different roles in the tin productions import competition network. Core–periphery model can be used to detect closely connected core nodes and sparsely connected peripheral nodes in the network, in which the core node often plays a more important role in the network (tin productions import competition network as above). The main idea of the core–periphery model is to test the adaptability of the core–periphery structure of the actual structure and the ideal structure, which can be realized by the unnormalized Pearson correlation coefficient. The formula is as follows in Equations 15, 16 (Borgatti and Everett, 2000; Li Y. et al., 2022):
Where ρis the unnormalized Pearson correlation coefficient;
3 Brief analysis of international trade networks
Using two key indicators, namely, the trading countries and the count of trade relations, we delved into the dynamics characterizing the evolution of the global tin trade pattern from an industrial chain perspective. Between 2002 and 2022, the international trade of upstream tin products engaged 69 to 96 countries, resulting in 138–255 trade relationships. Midstream tin products saw participation from 152 to 173 countries, yielding 1,107 to 1,430 trade relationships. As for downstream tin products, roughly 198 to 217 countries were involved, resulting in a substantial 2,145 to 2,732 trade relationships. Among these categories, the number of countries engaged in the international trade of downstream tin products, along with the number of countries conducting trade and the total trade relationships, took the lead. This was followed by the midstream tin products category in terms of the number of trading countries and trade relationships. Meanwhile, the upstream tin products category featured fewer countries involved and fewer trade relationships.
Utilizing complex network indicators, we conducted a deeper investigation into the evolving characteristics of the global tin trade network, with a specific focus on the industrial chain (as depicted in Figure 2, using the years 2002, 2012, and 2022 as illustrative examples). In a broad context, the international trade network associated with midstream and downstream tin products exhibits a higher degree of complexity compared to the network for upstream tin products. This paper contends that a country’s position within a trade network hinges on three essential factors, which are import capacity, export capacity, and intermediation capacity. Weighted indegree indicates a country’s import capacity, weighted outdegree indicates a country’s export capacity, and betweenness centrality indicates a country’s intermediation capacity.
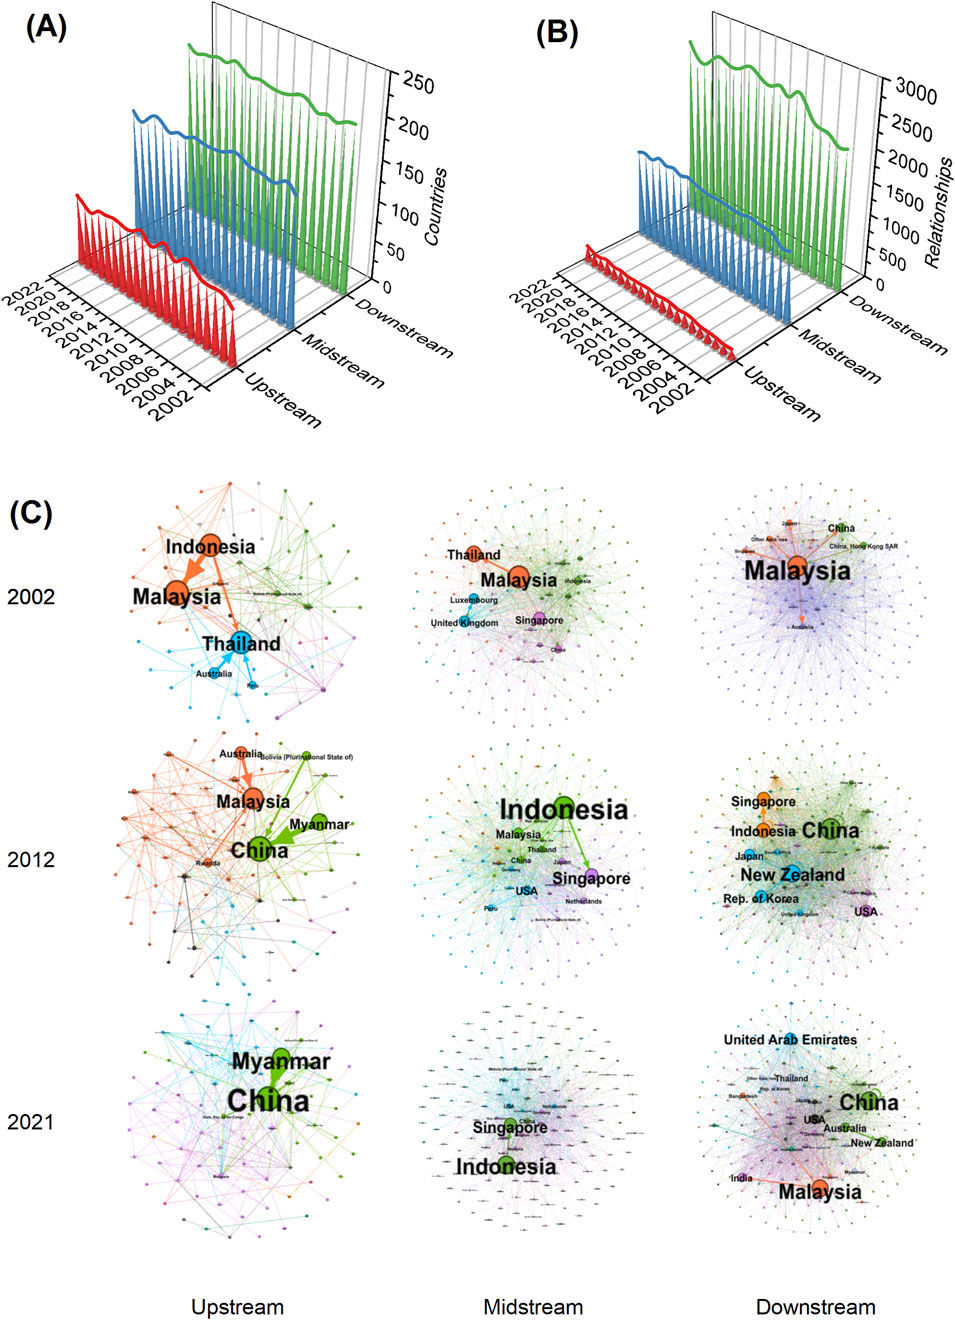
Figure 2. Trade countries and trade relations numbers of tin products and international trade network of tin products. (Note: (A) shows the number of trading countries, (B) shows the number of trading relationships and (C) shows international trade network of tin products).
Supplementary Material gives the top five countries in the tin products international trade network, ranked according to their performance in weighted degree, weighted indegree, weighted outdegree, and betweenness centrality from 2002 to 2022. This paper assesses each country’s standing in the international tin product trade network by referencing. From this analysis, several key conclusions emerge:
Between 2002 and 2022, a pronounced oligopoly emerged in the trade of upstream tin products, gradually consolidating itself within a trade network centered around China and Myanmar. Starting in 2011, China superseded Malaysia as the primary importer of upstream tin products, while Myanmar took the place of Australia as the principal exporter of these products. Noteworthy countries exhibiting substantial betweenness centrality within the upstream tin product trade network encompass China, Thailand, Malaysia, and the United States.
Indonesia has witnessed a notable decline in its position within the international trade network for upstream tin products, while concurrently experiencing a substantial increase in its position within the international trade network for midstream tin products. Currently, Indonesia holds the distinction of being the largest exporter of midstream tin products, with Singapore, the USA, and Japan serving as the primary importers of these products. Notably, Singapore held the title of largest importer of midstream tin products before 2015, a position that was later taken over by the United States. Countries exhibiting elevated betweenness centrality in midstream tin products encompass Germany, the United Kingdom, the United States, and China. It is worth highlighting that the betweenness centrality of the United States is on an upward trajectory.
Between 2002 and 2022, China has emerged as the paramount importer of downstream tin products. Beginning in 2010, China outpaced the United States and Japan, claiming the top position as the exporter of downstream tin products. Consequently, the core country within the international trade network for downstream tin products transitioned from Malaysia to China. Simultaneously, Middle Eastern countries are steadily augmenting their influence within the international trade network for downstream tin products. Noteworthy countries exhibiting substantial betweenness centrality in the downstream tin product trade network include the United States, China, Germany, and the UAE. Particularly, China’s betweenness centrality is on the ascent.
4 Analysis of competition networks
4.1 Analysis of overall characteristics
Importing countries typically do not rely on a single exporting country for their tin product needs, owing to a myriad of factors such as resource distribution, pricing, and international geopolitical dynamics. Similarly, exporting countries diversify their tin product exports across multiple importing countries. This diversification naturally gives rise to competition among importing and exporting nations. Competitiveness serves as a metric for gauging the level of competitive intensity, with higher competitiveness signifying fiercer competition between two countries. Consequently, this section involves the creation and analysis of both import competition networks and export competition networks for tin products.
In this paper, the weighted degree of tin products is used to indicate the competitive intensity of tin products. Figure 3 depict the characteristics of the import and export competition networks for upstream, midstream, and downstream tin products in 2002, 2012, and 2022. In these figures, the size of network nodes corresponds to the competitive intensity of a country’s tin products, with larger nodes indicating greater competitive intensity. The width of network edges represents the competitive intensity between two countries, with thicker edges signifying greater competitive intensity. Nodes of the same color denote membership in the same competitive group.

Figure 3. Global tin chain import competition network and global tin chain export competition network (Note: For the readability of the graphic, this paper filters the import competition network of the global tin industry chain. (A) shows the global tin chain import competition network and (B) shows global tin chain export competition network).
Figure 4 shows the evolving competition network and dynamics of tin products, revealing the changing number of countries and relationships. Competition networks are more intricate than native trade networks, involving intricate international competition in import and export.
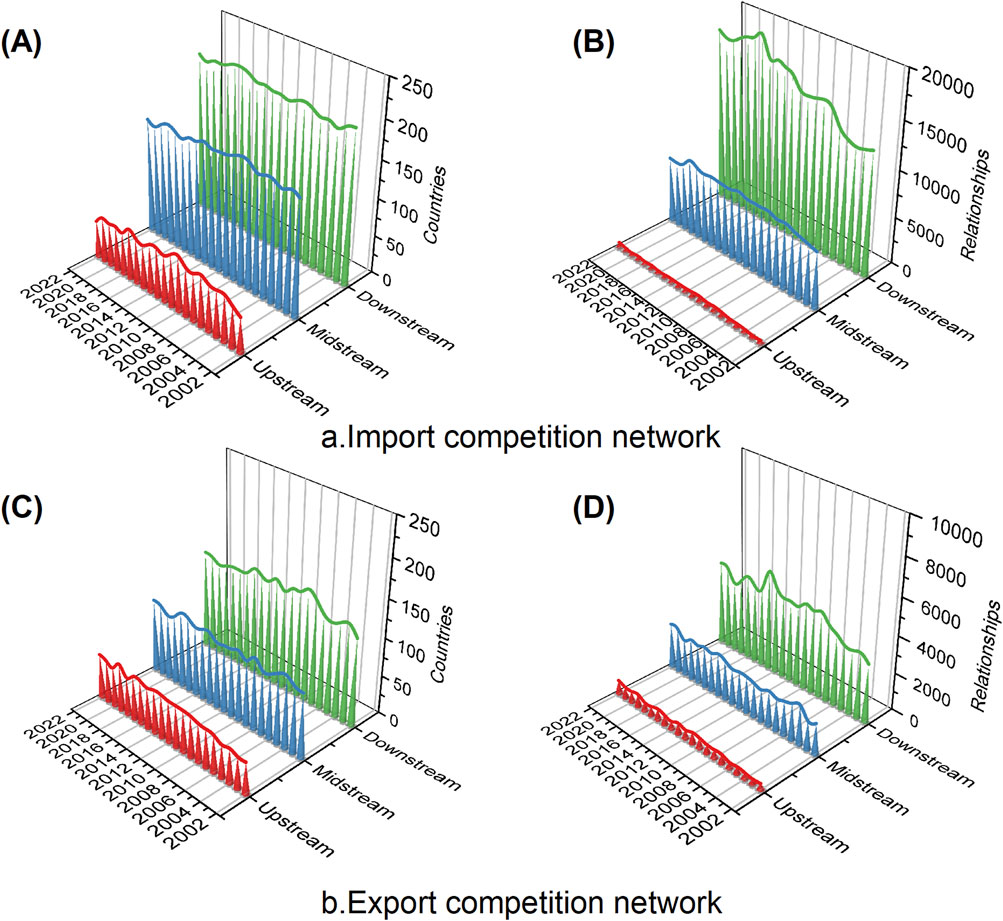
Figure 4. Total number of countries and relationships of competition networks. (Note: (A) shows the number of countries participating in the import competition network, (B) shows the number of competition relationships in the import competition network, (C) shows the number of participants in the export competition network, and (D) shows the number of competition relationships in the export competition network.).
When examining the import and export competition network of tin products from an industrial chain perspective, it becomes evident that downstream products exhibit the highest number of competing participating countries and competitive relationships. In the second position are midstream products, characterized by their number of competing participating countries and competitive relationships. Conversely, upstream products feature the smallest number of competing participating countries and competitive relationships within this context. Furthermore, within the same production chain, the import competition network is notably more intricate than the export competition network, both in terms of the number of competing participating countries and the intricateness of competitive relationships.
To gain a comprehensive understanding of the competitive landscape in the tin product industry, the cumulative distribution of direct rivalry intensity between importing countries and between exporting countries engaged in the trade of tin products is examined in this study. As depicted in Figure 5, the distribution of competitive intensity within the tin product sector is markedly uneven, with approximately 80% of competitive intensity stemming from roughly 10% of competitive relationships. This signifies that a select few countries wield significant influence in the realm of global tin import and export competition. In essence, these nations dominate the competitive dynamics among the world’s tin importers and exporters. It can be seen that with time, the imbalance in the distribution of competitive intensity in the import and export of upstream tin products and midstream tin products has gradually intensified, and the imbalance in the distribution of competitive intensity in the import and export of downstream tin products has gradually reduced.
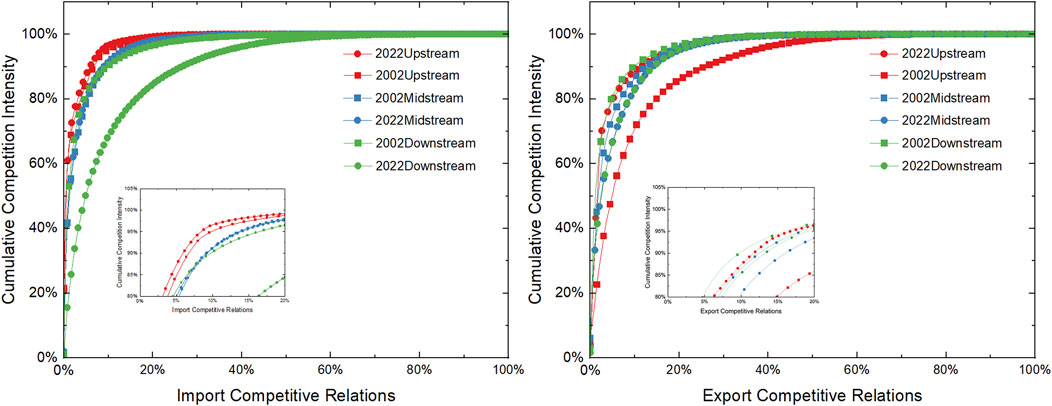
Figure 5. Cumulative distribution of the competition intensity between countries.
The average degree can reflect the evolutionary trend of the import and export competition network of tin products. The evolution trend of the tin products competition network from 2002 to 2022 is shown in Figure 6. In the competition network of tin products, it is notable that the average degree of downstream tin products surpasses that of midstream tin products and upstream tin products, which hold the largest average degree. In the import competition network of tin products, the average degree of upstream, midstream, and downstream tin products shows an increasing trend. From 2002 to 2022, the average degree of midstream tin products rose by 18%, and the average degree of downstream tin products rose by 35%. This implies that import competition for midstream and downstream tin products is steadily intensifying. During the period 2002–2022, in the export competition network of tin products, the average degree of export competition of upstream, midstream, and downstream tin products has increased by 62%, 29%, and 27%, respectively. This indicates a discernible uptick in export competition for tin products.
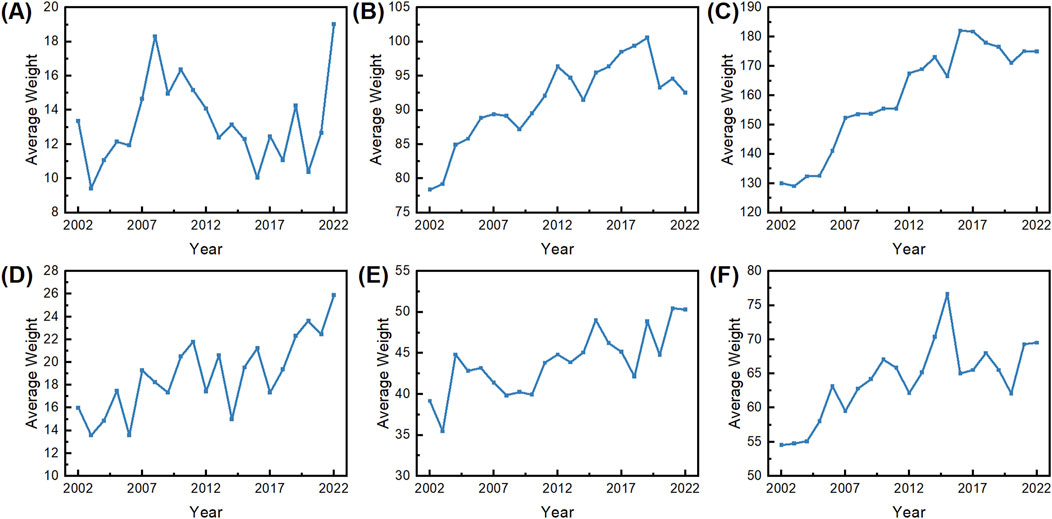
Figure 6. The evolution of the average degree of competition networks [(A–C) show the weighted import competition network for upstream, midstream, and downstream tin products, and (D–F) show the weighted export competition network for upstream, midstream and downstream tin products, respectively.].
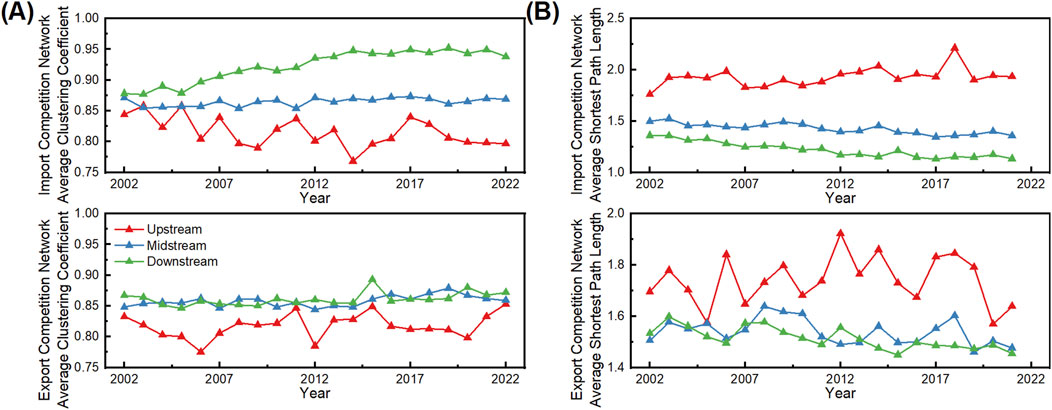
Figure 7. The evolution of the Clustering coefficient and shortest path length of the network.
The average clustering coefficients and average path lengths of the competitive networks serve as metrics for assessing the tightness of competitive relationships. Notably, the average clustering coefficients for the import and export competitive networks of tin products from 2002 to 2022 range from 0.775 to 0.952, approaching the maximum of 1. This suggests that competitive relationships among competitors within the same importing or exporting country remain highly tight. The highest average clustering coefficient is found in the downstream products, indicating the most competitive relationships among competitors within the same importing or exporting country. However, it is important to note that the average clustering coefficient in the export competition network is relatively smaller than that in the import competition network, signifying that the competitive relationships in the import competition network for tin products are notably more tightly knit.
From 2002 to 2022, the average shortest path lengths within the import and export competition networks for tin products were approximately 1.103–2.212. This implies that two importing or exporting countries involved in tin product trade can establish a competitive relationship by eliminating just one intermediary. This observation underscores the ease with which competition can develop among competitors within the importing or exporting country as well. The downstream product has the shortest average path length, indicating that the downstream product is most competitive with competitors from the same importing or exporting country.
4.2 Analysis of typical competitive countries
In order to understand the spatial distribution and pattern evolution of the main competition relations, this paper uses the core-periphery structure to divide the core tin productions importing and exporting countries and the periphery tin productions importing and exporting countries, and draws the core-periphery map as shown in Figure 8.
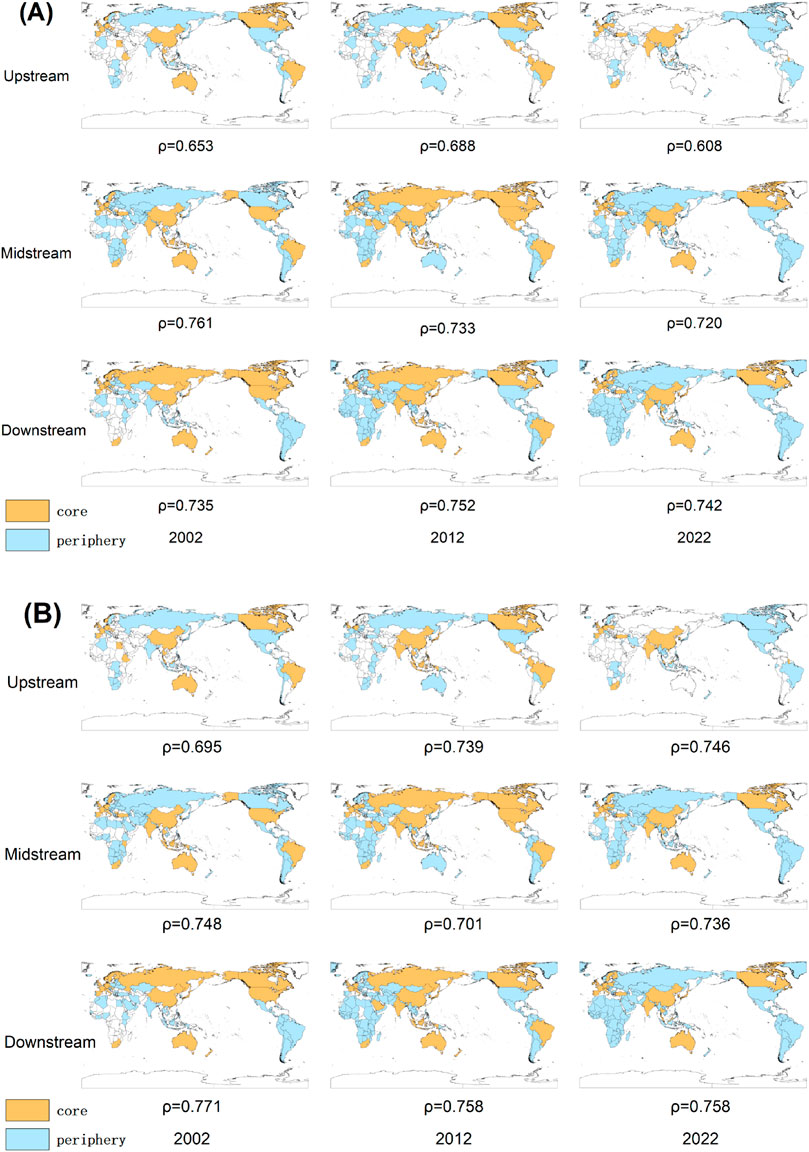
Figure 8. The evolution of the Clustering coefficient and shortest path length of the network (Note: (A) shows the global tin chain import competition network and (B) shows global tin chain export competition network).
In 2002, 2012, and 2022, due to the high correlation coefficient between the ideal structure and the data, the core-periphery structure of tin product import competition was formed. As shown in Figure 8, The core countries in the competition for upstream tin products have not undergone significant changes, remaining primarily concentrated in Asia and Oceania. However, a few African countries have gradually entered the competition for upstream tin product exports and have become core countries in this export competition. The core countries in the competition for midstream tin products are primarily concentrated in Asia and the Americas. In the downstream tin product trade, the core countries are mainly China and Western countries, with China’s core position becoming increasingly prominent over time.
Meanwhile, there are differences in the ρ values for different types of tin products. As shown in Figure 8, the ρ value for downstream tin products is the highest, followed by midstream tin products, with upstream tin products having the relatively lowest ρ value. This indicates that the core-periphery structure is most distinct for downstream tin products, while the core-periphery structure for upstream tin products is relatively less distinct.
As the competitive pattern of tin products evolves, specific countries gradually establish dominance in the import and export competition network of tin products. In this paper, the total competition intensity (weighted degree) of all tin productions importing and exporting countries is ranked, and Table 2 and Table 3 list the top 5 countries with total competition intensity in 2002, 2007, 2012, 2017 and 2022.
The following results can be obtained from Figure 4 and Table 2:
(1) The focal point of import competition concerning upstream tin products has consistently resided in Asia and has undergone a transition from Malaysia to China. Since 2013, China has consistently held a central position in the import competition for upstream tin products, both within Asia and globally. Being the world’s largest producer of tin solder, China’s demand for upstream tin products has displayed consistent growth, rendering it the foremost importer in the global trade of upstream tin products. According to the United Nations Commodity Trade Statistics, China’s tin ore imports constituted 80% of the global tin ore imports in 2022. China, Malaysia, and Thailand emerge as the primary import competitors for upstream tin products, and these three countries collectively dominate nearly the entirety of upstream tin imports.
(2) The focal point of import competition concerning midstream tin products has transitioned from Thailand to Singapore and the United States. Situated at the gateway of the Malacca Strait, Singapore serves as a pivotal maritime transport hub connecting Asia, Australia, Europe, and Africa. It handles substantial quantities of midstream tin products, functions as a prominent intermediary nation, re-exports goods, plays a significant role in transit, and closely collaborates with neighboring countries. In alignment with its “Industrial Internet” strategy, the United States has deepened its involvement in the industrial chain’s downstream sectors, stimulating the demand for midstream tin products and consequently increasing its competitiveness over the years. While Singapore operates as a transit point for midstream tin products, the United States stands as a major consumer. Moreover, developed countries, including Japan, the Netherlands, and Germany, occupy central positions in the import competition for midstream tin products.
(3) The main regions of import competition for downstream tin products are North America, Europe, and Asia. From 2002 to 2009, China occupied a central position in the competitive import network for downstream tin products. Following China’s accession to the World Trade Organization (WTO), its industry underwent a transformation, transitioning from being the largest importer to becoming the largest exporter of downstream tin products. Consequently, China’s prominence in the competitive import network for downstream tin products saw a substantial decline after 2009. In contrast, the United States, the United Kingdom, New Zealand, the UAE, and Saudi Arabia experienced significant increases in their positions within the competitive network of downstream tin product imports.
The following results can be derived from Figure 4 and Table 3:
(1) The focal point of export competition for upstream tin products has consistently resided in Asia, with a notable shift from Indonesia to Myanmar. Since 2011, Myanmar has established its dominance in the export competition network for upstream tin products. This shift is attributed to the stabilization of the political landscape in Myanmar’s Wa Special. Myanmar’s rapid ascent as the world’s third-largest tin miner and leading exporter. In 2022, Myanmar accounted for 63% of the world’s upstream tin product exports, with the majority directed to China. Myanmar has emerged as a significant and somewhat unexpected player in the tin market, often referred to as a “Black Swan” in recent analyses (Gardiner et al., 2015). Additionally, countries with substantial tin reserves, such as Australia, Bolivia, Rwanda, and the DR Congo, have become noteworthy exporters of upstream tin products. They exhibit robust competitiveness in the import network for upstream tin products (USGS, 2023).
(2) The core of export competition for midstream tin products has consistently been in Asia and has shifted from Malaysia to Indonesia. In the early 21st century, Malaysia primarily dominated the export of midstream tin products. However, as its tin reserves began to dwindle, Malaysia’s exports of midstream tin products experienced a gradual decline. However, as its tin reserves began to dwindle, Malaysia’s exports of midstream tin products experienced a gradual decline (Li et al., 2021b). Notably, Indonesia possesses the world’s second-largest tin reserves. In 2014, the Indonesian Ministry of Trade implemented Trade Regulation No. 44, prohibiting the export of raw tin. This decision aimed to combat the substantial loss of tin resources at low prices and foster the development of the midstream downstream tin industry (Chatchawanchanchanakij et al., 2019). Consequently, Indonesia’s standing in the export competition network for upstream tin products saw a significant decrease, while its position in the export competition network for midstream tin products witnessed substantial growth. Singapore, functioning as a transshipment hub for midstream tin products, has demonstrated remarkable competitiveness in the export competition for this product.
(3) The central hub of export competition for downstream tin products has traditionally been situated in Asia and has transitioned from Malaysia to China. Before 2010, Malaysia consistently held the position of the largest importer of upstream tin products nearly every year. These upstream tin products were subsequently processed to manufacture midstream and downstream tin products for export. In 2010, China surpassed the United States, Japan, and South Korea to emerge as the primary exporters of downstream tin products, establishing itself as the core of export competition for these products. This transformation is primarily attributed to Chinese accounts for approximately 65% of global tin solder production. The diverse forms of tin solder, including tin wire, tin bars, and tin paste, are all classified as downstream tin products. Concurrently, the Middle Eastern countries have been steadily increasing their influence on the import competition network for downstream tin products. Presently, the export competition for downstream tin products is predominantly concentrated in East Asia, with China, Japan, and Rep. of Korea playing significant roles.
4.3 Analysis of typical competitive relationships
This section analyzes the typical competitive relationships in the import and export competition of the global tin products industry chain, focusing on the intensity of competition between countries, with different colors representing competition between different continents, as shown in Tables 4, 5.
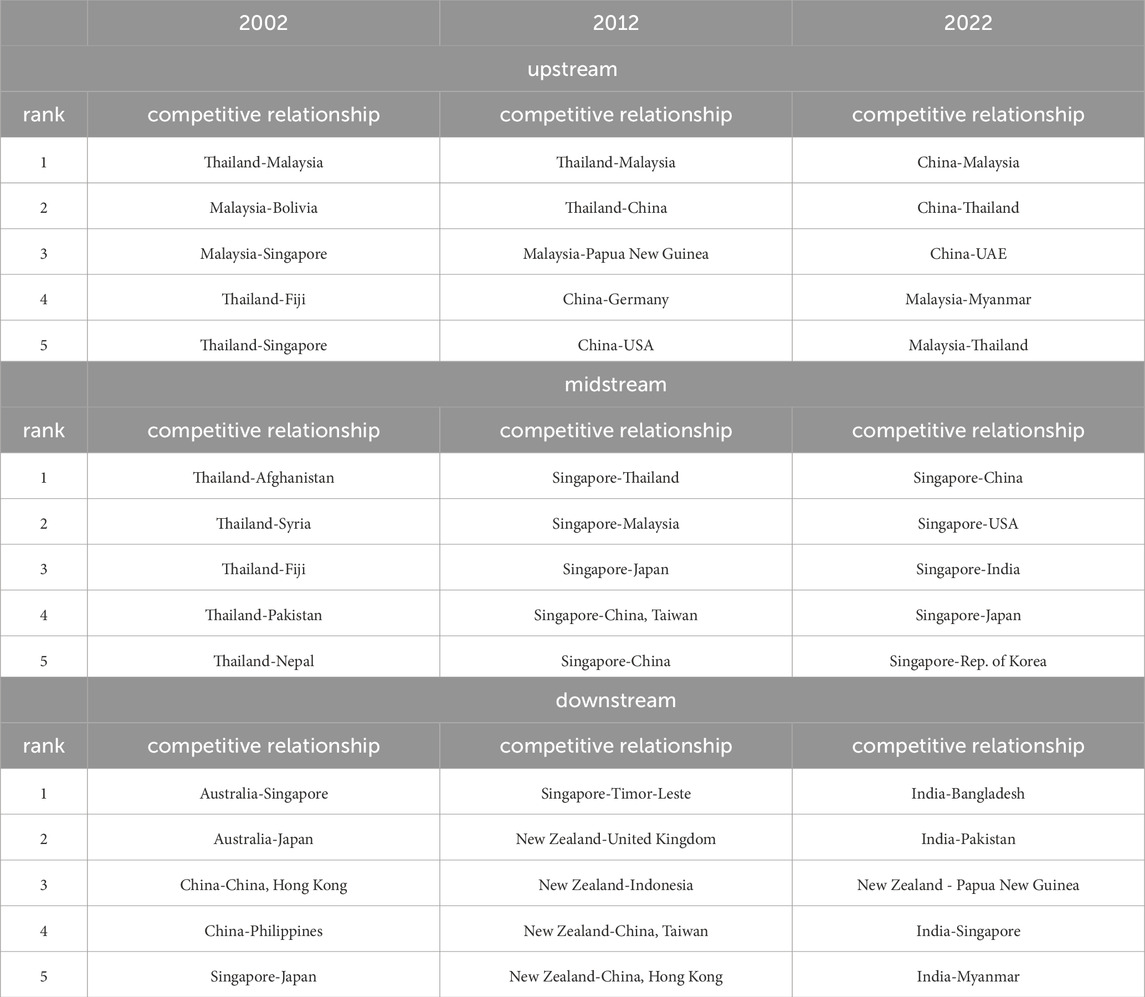
Table 4. Top 4 import competition links.
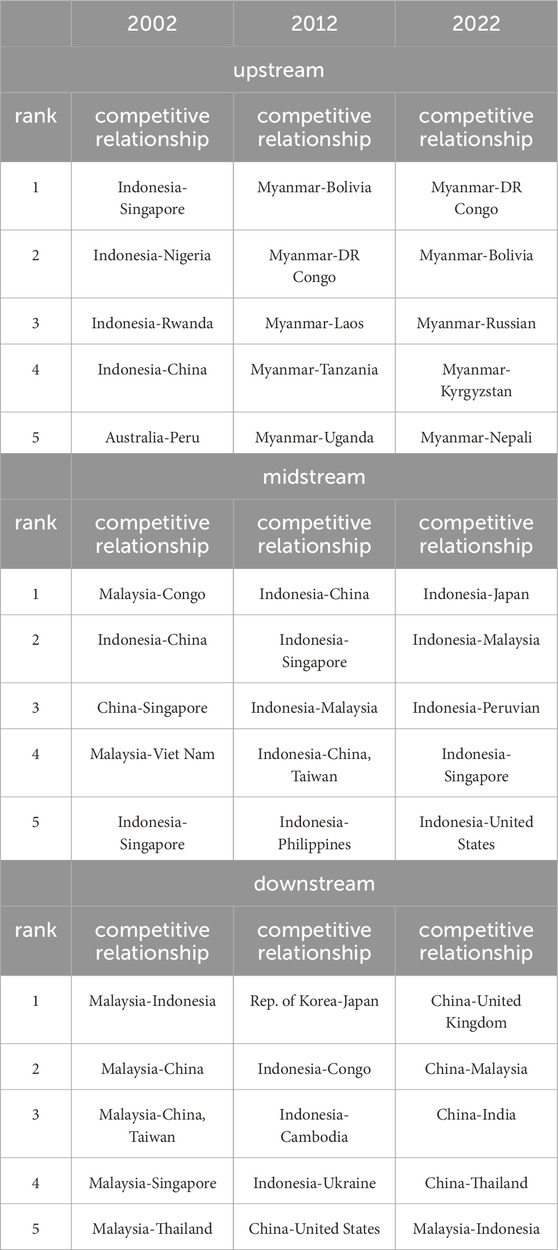
Table 5. Top 5 export competition links. (Different colors represent the competition between different regions).
Table 4 lists the top 5 import competition relationships in 2002, 2012, and 2022. This study scrutinizes the fundamental import competition relationships aspects of tin products, yielding the following key findings:
(1) Upstream tin product import competition is predominantly concentrated among Asian nations. Notably, the “Thailand-Malaysia” relationship stood out as the most competitive in 2002 and 2012. In 2022 China exhibits heightened competition with Malaysia and Thailand. The competition for the import of upstream tin products is primarily concentrated among China, Malaysia, and Thailand. Despite possessing the world’s largest tin reserves, China continues substantial imports of upstream tin products to meet its industrial demands. China’s increasing industrialization, particularly since joining the WTO in 2001, has led to a surge in upstream tin product imports, amplifying import competition.
(2) The competition for the import of midstream tin products is predominantly concentrated in Asia. In 2002, the top 5 import competitive relationships for midstream tin products included Thailand, while in 2012 and 2022, Singapore played a prominent role. Singapore, as a transshipment hub for midstream tin products, imports a significant quantity of midstream tin products and engages in re-export trade. Import competition for midstream tin products in 2022 is mainly centered on “Singapore-China” and “Singapore-United States”. China and the United States, as the world’s superpower and economic powerhouse, consistently perceive manufacturing as a driver of economic robustness and national security. Against this background, China and the United States, being an industrial juggernaut, has increasingly imported substantial quantities of midstream tin products for the production of electronic components, where tin serves as solder in electronic components.
(3) Import competition for downstream tin products has shifted from competition among developed countries to competition among developing countries. In 2002 and 2012, the import competition for downstream tin products predominantly revolved around developed countries like Australia, Singapore, and Japan. Fast forward to 2022, and developing nations such as India, Pakistan, and Bangladesh are entangled in intense import competition. Constrained by their own industrial capacities, these developing countries face challenges in producing downstream tin products efficiently, leading them to import substantial quantities due to the associated high production cost.
Table 5 outlines the leading 5 export competition relationships for 2002, 2012, and 2022. This study delves into the fundamental export competition relationships of tin products, yielding the following key findings:
(1) In 2002, all of the top 5 export competitiveness relationships for upstream tin products included Indonesia, and in 2012 and 2022, all of the top 5 export competitiveness relationships for upstream tin products included Myanmar. Export competition for upstream tin products is primarily centered on Asia, Africa, and South America. Myanmar in Asia, Nigeria, Rwanda, and the DR Congo in Africa, as well as Bolivia and Brazil in South America, boast substantial tin ore resources. Due to their limited industrialization, these countries predominantly export tin ore, sparking intense export competition among them.
(2) All of the top 5 export competitive relationships for midstream tin products in 2012 and 2022 include Indonesia. The competition between Indonesia and China, ranking second in 2002 and first in 2012 and 2022, reveals the most pronounced export competition between these two nations. China and Indonesia account for 15% and 17% of the world’s tin reserves, respectively. Export competition for midstream tin products is concentrated among Asian countries. With a high level of industrialization, these nations process tin ore into midstream tin products for export, intensifying the competition in the global market.
(3) In the export competition of downstream tin products, China’s export competitiveness has experienced a notable upswing. Almost all of the top 5 export competitive relationships of downstream tin products in 2022 include China. The export rivalry between “China-Germany” and “China-Japan” stands out for its intensity. China, Germany, and Japan are all large industrial countries that export a large number of downstream tin products and have strong competitiveness in the export competition of downstream tin products.
4.4 Analysis of community in competition networks
Community indicators play an important role in comprehending the competitive landscape of tin products within the global industrial chain. Communities exhibit stronger relationships within the same group compared to those between countries in different communities. The higher the value of modularity, the better the partition effect and the more significant the community effect. Figure 9 illustrates the changes in modularity values in the tin products import and export competition network from 2002 to 2022. Notably, the modularity of upstream tin products surpasses that of midstream and downstream products, signifying a significant grouping effect for upstream products. Conversely, midstream and downstream tin products display a less prominent grouping effect. The decreasing trend in the modularity of upstream tin products suggests that as trade in upstream tin products becomes more globalized, trade community barriers are fading, leading to increased integration among importing and exporting countries. Two notable declines in 2008 and 2020 coincide with the global financial crisis and the COVID-19 pandemic, prompting tin-exporting countries to seek additional consumers and mitigate the impact of these crises through market diversification to safeguard their economic interests.
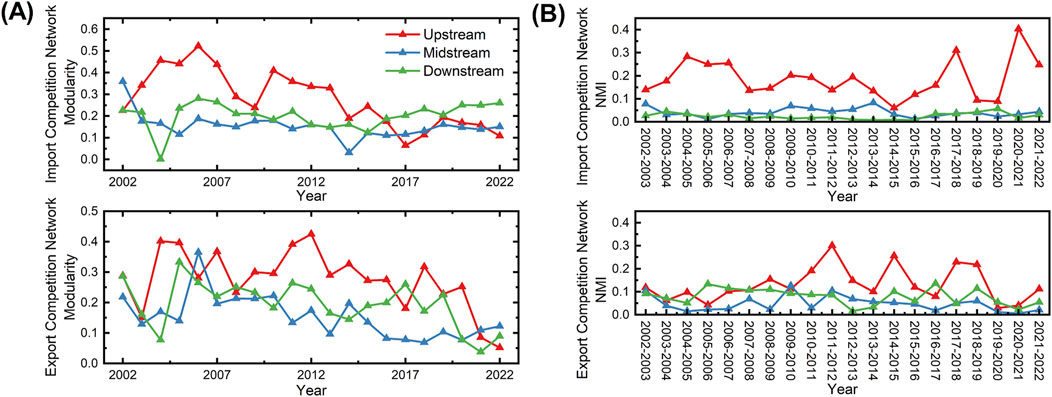
Figure 9. The evolution of modularity and NMI of competition network.
The Normalized Mutual Information (NMI) between year t and year t+1 serves as an indicator of the temporal stability in the group differentiation of the tin products competition network. This metric gauges the similarity degree among group members from year t to year t+1, and the NMI calculation results are depicted in Figure 9. In the import or export competition network of tin products, the stability of the upstream products of tin is higher than that of the midstream products and downstream products of tin. The stability gap between the respective import and export competitions of upstream and midstream tin products is narrower, while the stability of export competitions for downstream tin products exceeds that of import competitions. Therefore, it is necessary to further analyze the changes in the pattern of country communities in the international import and export network of tin products, and for this purpose, we analyze the country members in the community. The evolution of competitive groups among nations is not solely influenced by policies but is also intertwined with the international market and global economy. The 2008 economic crisis triggered a sequence of fluctuations in the global economic landscape, significantly influencing the international competitive dynamics of tin products. The ensuing global economic slowdown and the escalation of the sovereign debt crisis in Europe and the USA, coupled with insufficient international market demand, led to substantial changes in the competitive groups. Similarly, the 2020 COVID-19 pandemic exerted a profound impact on the international competitive dynamics of tin products.
Figure 10 depicts the evolution of competition network communities in the import and export of tin products. Different colors signify distinct communities, with countries (regions) within the same community represented by the same color. The countries (regions) in the white region do not compete for tin products, so there are no communities of them. Combining the competitiveness of the different countries (regions) in the import and export competitive network of tin products, this paper has the following findings:
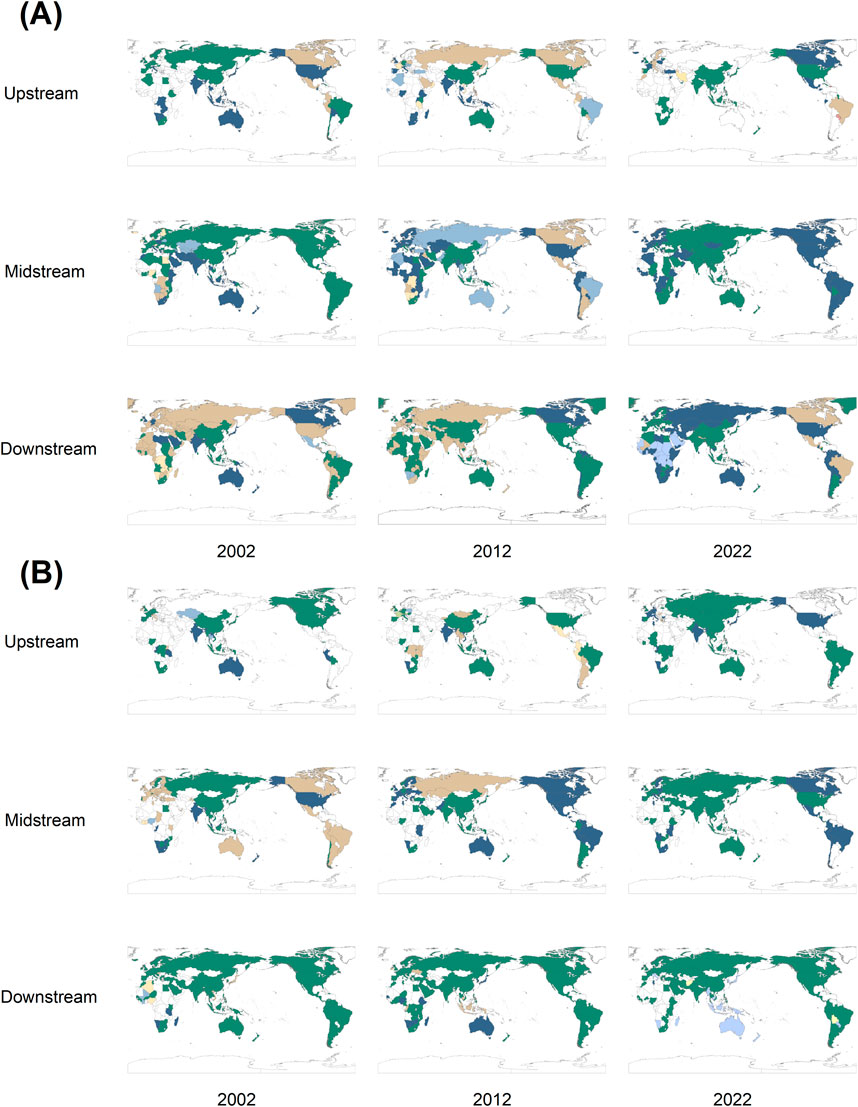
Figure 10. The evolution of competition networks communities. (Note: Different colors signify distinct communities, with countries (regions) within the same community represented by the same color.).
The import competition network of upstream tin products is divided into 3–9 communities. Import competition for upstream tin products is mainly in Asia, where the intra-Asian community is divided into the “Thailand-Malaysia” community and the “China” community. The competitiveness of the “Thailand-Malaysia” community is gradually declining, while that of the “China” community is gradually rising. The import competition for midstream tin products is divided into two to six communities. The competitiveness of the “USA” community is on the ascent, while the “Singapore-Thailand” community witnesses a gradual decline. For downstream tin products, the import competition is divided into 3–6 communities. The “USA-United Kingdom” community exhibits increasing competitiveness, while the competitiveness of the “China” community experiences a gradual decrease.
In the export competition network of tin products, the evolutionary diagram indicates the presence of 3–7 communities for upstream tin products. Export competition for upstream tin products is predominantly situated in Asia, Oceania, Africa, and South America. Notably, the competitiveness of the Asian “Myanmar-Indonesia” community is progressively rising, while that of the Oceania “Australia” community is on the decline. For midstream tin products, the export competition is segmented into 2–6 communities. The competitiveness of the “Indonesia” community is steadily increasing, while the competitiveness of the “Malaysia” and “Bolivia-Peru” communities is gradually diminishing. The export competition for downstream tin products is divided into 2–10 communities. The competitiveness of the “China” community is progressively growing, while that of the “Malaysia” community is gradually declining.
5 Conclusions and policy recommendations
5.1 Conclusions
This paper applies the international trade data of tin products from 2002 to 2022 and applies the complex network method to construct the international trade network of tin products and its derived import competition network and export competition network. The general characteristics of the import competition network and export competition network of tin products, the main competing countries (regions), the main competitive relationships, and the group evolution were analyzed. Based on the above analysis, the conclusions are as follows:
(1) The competitive network of trade in tin products is extremely heterogeneous. In the network of import and export competition, countries involved in downstream products and competitive relationships are the most numerous, followed by midstream products, and upstream products are the least numerous. The distribution of the competitive intensity of tin products is very uneven, with about 80% of the competitive intensity coming from about 10% of the competitive relationships and a few countries dominating the competition among the global tin product import and export countries. The range of tin applications has been expanding from traditional uses, such as soldering, to emerging high-tech fields, including batteries and solar photovoltaics. The average degree of import competition between importing countries of tin midstream and downstream products has increased year by year, and the competition between importing countries is getting more and more intense; the average degree of export competition of tin products has increased in all, and the export competition of tin products is strengthening. In addition, the average clustering coefficient of the competitive network is high, and the average shortest path length is approximately shorter, which implies that there is very close competition for the import and export of tin products.
(2) In the tin industry chain, importing countries compete strongly with one another, creating a tripartite import competition between Asia, Europe, and North America. Competition among developed countries mainly centers around midstream tin products, while competition among developing countries is dominated by imports of upstream and downstream tin products. As the world’s largest producer of tin solder, China’s demand for upstream tin products is growing steadily. These upstream tin products are utilized in the production of midstream and downstream tin products, which are subsequently employed in exports or further industrial processes. Developed countries such as the United States, Japan, Germany, Rep. of Korea, and the Netherlands are the main importers of midstream tin products, and these countries rely heavily on the import of midstream tin products to meet their own tin consumption and production of tin downstream industrial products. At the same time, developing countries such as Pakistan and the Philippines, which are constrained by their own industrial capacity and are unable to produce downstream tin products or have high costs of producing downstream tin products, import large quantities of downstream tin products and face fierce import competition.
(3) The primary focus of the export competition for tin products is primarily situated in Asia. The centrality of Malaysia is gradually lost, and the centrality of other countries such as Myanmar, Indonesia, and China is gradually coming to the fore. After Malaysia’s tin reserves declined significantly, it not only lost its position in the competition for upstream tin exports, but also in the competition for midstream and downstream tin exports. The national policies significantly influence the export competition for tin products. In 2011, after the political stability of Wa State, Myanmar became the core of the global export competition for upstream tin products. In 2014, Indonesia became the core of the export competition for midstream tin products after the Ministry of Trade of Indonesia enacted Trade Regulation No. 44, which banned the export of crude tin. The history of China’s midstream and downstream tin exports can be divided into two stages. In the first phase, from 2002 to 2010, the largest share of midstream tin products was exported, and after 2010, midstream tin products were no longer exported and downstream products began to be exported.
(4) There are typical competitive relationships in the competitive network of trade in tin products. The import competition of upstream tin products is mainly concentrated among Thailand, Malaysia, and China; the export competition of upstream tin products is concentrated between countries such as Myanmar and Bolivia. The import competition of midstream tin products has shifted from competition among Asian countries to competition among developed countries in Europe and the United States. In the export competition of midstream tin products, the competition between “Indonesia and China” is the most fierce. The import competition for downstream tin products is concentrated among developing countries such as Pakistan and the Philippines, and the export competition between “China-Germany” and “China-Japan” is very fierce.
(5) There is a clear community effect on the competitive network of trade in tin products. The effect of competitive grouping of upstream tin products is significant, and the effect of competitive grouping of midstream and downstream tin products is not significant. Moreover, the stability of upstream tin product competition is higher than that of midstream and downstream tin products. We also find that the group stability of each competing network is low. This result means that competition between countries for tin products is very active.
5.2 Policy recommendations
Considering the conclusions above, we propose the subsequent recommendations:
(1) Countries that rely heavily on upstream tin product imports should diversify their import channels. The high concentration of imports means that tin resources are less secure due to the risk of depletion of natural resources in supplying countries, such as Peru and Malaysia, where tin reserves are in steep decline. Policies in supplying countries can also lead to supply risks. The Myanmar government’s Notice of Suspension of All Mineral Resource Mining on 15 April 2023, could significantly impact China’s upstream tin product imports. As a major importer, China’s 90% of imported tin products come from Myanmar. To mitigate risks, importing countries should focus on real-time upstream tin product capacity movement, seek alternative importers, strengthen attention to intermediate countries, and increase risk prediction to cope with future emergencies.
(2) Countries with abundant tin resources should foster the development of the tin industry downstream. A country rich in upstream tin products, such as Myanmar, possesses a competitive edge in the global market due to its abundant tin resources. Improving the import and export frameworks and modernizing the industrial structure should be the government’s main priorities. This will encourage foreign investment to establish factories in places with abundant mineral resources and help to broaden resource advantages. They can boost domestic capacity, raise the value of exported goods, raise their economic income, and provide security by using local labor and cutting-edge machinery and technology from foreign producers.
Data availability statement
The original contributions presented in the study are included in the article/Supplementary Material, further inquiries can be directed to the corresponding author.
Author contributions
YJ: Conceptualization, Data curation, Formal Analysis, Methodology, Project administration, Resources, Software, Validation, Visualization, Writing–original draft, Writing–review and editing. TD: Funding acquisition, Project administration, Supervision, Writing–review and editing.
Funding
The author(s) declare that financial support was received for the research and/or publication of this article. The Integrated Project of the Major Research Plan of the National Natural Science Foundation of China (No. 92162321); Basic Science Center Project for National Natural Science Foundation of China (No. 72088101, the Theory and Application of Resource and Environment Management in the Digital Economy Era); the Geological Survey (DD20243234).
Conflict of interest
The authors declare that the research was conducted in the absence of any commercial or financial relationships that could be construed as a potential conflict of interest.
Generative AI statement
The author(s) declare that no Generative AI was used in the creation of this manuscript.
Publisher’s note
All claims expressed in this article are solely those of the authors and do not necessarily represent those of their affiliated organizations, or those of the publisher, the editors and the reviewers. Any product that may be evaluated in this article, or claim that may be made by its manufacturer, is not guaranteed or endorsed by the publisher.
Supplementary material
The Supplementary Material for this article can be found online at: https://www.frontiersin.org/articles/10.3389/feart.2024.1501816/full#supplementary-material
References
An, H., Zhong, W., Chen, Y., Li, H., and Gao, X. (2014). Features and evolution of international crude oil trade relationships: a trading-based network analysis. Energy 74, 254–259. doi:10.1016/j.energy.2014.06.095
BarabáSI, A.-L. (2013). Network science. Philosophical Trans. R. Soc. A Math. Phys. Eng. Sci. 371, 20120375. doi:10.1098/rsta.2012.0375
BarabáSI, A.-L., and Albert, R. (1999). Emergence of scaling in random networks. science 286, 509–512. doi:10.1126/science.286.5439.509
Blondel, V. D., Guillaume, J.-L., Lambiotte, R., and Lefebvre, E. (2008). Fast unfolding of communities in large networks. J. Stat. Mech. theory Exp. 2008, P10008. doi:10.1088/1742-5468/2008/10/p10008
Borgatti, S. P., and Everett, M. G. (2000). Models of core/periphery structures. Soc. Netw. 21, 375–395. doi:10.1016/s0378-8733(99)00019-2
Bradley, J. E., Auping, W. L., Kleijn, R., Kwakkel, J. H., and Sprecher, B. (2024). Reassessing tin circularity and criticality. J. Industrial Ecol. 28, 232–246. doi:10.1111/jiec.13459
Cao, Y., Wang, G., Jiang, Q., and Han, Z. (2006). A neighbourhood evolving network model. Phys. Lett. A 349, 462–466. doi:10.1016/j.physleta.2005.09.047
Chatchawanchanchanakij, P., Arpornpisal, C., and Jermsittiparsert, K. (2019). The role of corporate governance in creating a capable supply chain: a case of Indonesian Tin industry. Int. J. Supply Chain Manag. 8, 854–864. doi:10.59160/ijscm.v8i3.2996
Diprose, R., Kurniawan, N., Macdonald, K., and Winanti, P. (2022). Regulating sustainable minerals in electronics supply chains: local power struggles and the “hidden costs” of global tin supply chain governance. Rev. Int. Political Econ. 29, 792–817. doi:10.1080/09692290.2020.1814844
Fagiolo, G., Reyes, J., and Schiavo, S. (2008). On the topological properties of the world trade web: a weighted network analysis. Phys. A Stat. Mech. its Appl. 387, 3868–3873. doi:10.1016/j.physa.2008.01.050
Fan, Y., Ren, S., Cai, H., and Cui, X. (2014). The state’s role and position in international trade: a complex network perspective. Econ. Model. 39, 71–81. doi:10.1016/j.econmod.2014.02.027
Freeman, L. (1977). A set of measures of centrality based on betweenness. Sociometry 40, 35. doi:10.2307/3033543
Gardiner, N. J., Sykes, J. P., Trench, A., and Robb, L. J. (2015). Tin mining in Myanmar: production and potential. Resour. Policy 46, 219–233. doi:10.1016/j.resourpol.2015.10.002
Garlaschelli, D., and Loffredo, M. I. (2005). Structure and evolution of the world trade network. Phys. A Stat. Mech. its Appl. 355, 138–144. doi:10.1016/j.physa.2005.02.075
Geng, J.-B., Ji, Q., and Fan, Y. (2014). A dynamic analysis on global natural gas trade network. Appl. Energy 132, 23–33. doi:10.1016/j.apenergy.2014.06.064
Glick, R., and Rose, A. K. (1999). Contagion and trade: why are currency crises regional? J. Int. Money Finance 18, 603–617. doi:10.1016/s0261-5606(99)00023-6
Gu, G., and Liu, J. (2022). Analysis of the global trade network of the tin metal resource industry chain. CHINA Min. Mag. 31, 32–40. doi:10.12075/j.issn.1004-4051.2022.01.022
Howe, P., and Watts, P. (2005). Tin and inorganic tin compounds. Geneva, Switzerland: World health organization.
Izard, C. F., and Muller, D. B. (2010). Tracking the devil's metal: historical global and contemporary US tin cycles. Resour. Conservation Recycl. 54, 1436–1441. doi:10.1016/j.resconrec.2010.06.008
Ji, Q., Zhang, H.-Y., and Fan, Y. (2014). Identification of global oil trade patterns: an empirical research based on complex network theory. Energy Convers. Manag. 85, 856–865. doi:10.1016/j.enconman.2013.12.072
Li, B., Li, H., Dong, Z., Lu, Y., Liu, N., and Hao, X. (2021a). The global copper material trade network and risk evaluation: a industry chain perspective. Resour. Policy 74, 102275. doi:10.1016/j.resourpol.2021.102275
Li, H., Qin, W., Li, J., Tian, Z., Jiao, F., and Yang, C. (2021b). Tracing the global tin flow network: highly concentrated production and consumption. Resour. Conservation Recycl. 169, 105495. doi:10.1016/j.resconrec.2021.105495
Li, X., Zhang, H., Zhou, X., and Zhong, W. (2022). Research on the evolution of the global import and export competition network of chromium resources from the perspective of the whole industrial chain. Resour. Policy 79, 102987. doi:10.1016/j.resourpol.2022.102987
Li, Y., Huang, J., and Zhang, H. (2022). The impact of country risks on cobalt trade patterns from the perspective of the industrial chain. Resour. Policy 77, 102641. doi:10.1016/j.resourpol.2022.102641
Robertson, W. (2024). Tin: its production and marketing. Milton Park, Abingdon-on-Thames, Oxfordshire, United Kingdom: Taylor and Francis.
Schutte, P. (2019). International mineral trade on the background of due diligence regulation: a case study of tantalum and tin supply chains from East and Central Africa. Resour. Policy 62, 674–689. doi:10.1016/j.resourpol.2018.11.017
Shao, L., Hu, J., and Zhang, H. (2021). Evolution of global lithium competition network pattern and its influence factors. Resour. Policy 74, 102353. doi:10.1016/j.resourpol.2021.102353
Shao, L., Kou, W., and Zhang, H. (2022). The evolution of the global cobalt and lithium trade pattern and the impacts of the low-cobalt technology of lithium batteries based on multiplex network. Resour. Policy 76, 102550. doi:10.1016/j.resourpol.2022.102550
Tian, X., Geng, Y., Sarkis, J., Gao, C., Sun, X., Micic, T., et al. (2021). Features of critical resource trade networks of lithium-ion batteries. Resour. Policy 73, 102177. doi:10.1016/j.resourpol.2021.102177
USGS. (2023). TIN Available at: https://www.usgs.gov/centers/national-minerals-information-center/tin-statistics-and-information.
Wang, X., Li, H., Yao, H., Chen, Z., and Guan, Q. (2019). Network feature and influence factors of global nature graphite trade competition. Resour. Policy 60, 153–161. doi:10.1016/j.resourpol.2018.12.012
Watts, D. J., and Strogatz, S. H. (1998). Collective dynamics of ‘small-world’networks. nature 393, 440–442. doi:10.1038/30918
Zeng, T., Liu, C., and Liu, Q. (2019). Tin resources supply and consumption pattern and trend in the Belt and Road region. China Min. Mag. 28, 1–9. doi:10.12075/jissn.1004-4051.2019.08.027
Zhang, H.-Y., Ji, Q., and Fan, Y. (2014). Competition, transmission and pattern evolution: a network analysis of global oil trade. Energy Policy 73, 312–322. doi:10.1016/j.enpol.2014.06.020
Zhang, H., Wang, X., Tang, J., and Guo, Y. (2022). The impact of international rare earth trade competition on global value chain upgrading from the industrial chain perspective. Ecol. Econ. 198, 107472. doi:10.1016/j.ecolecon.2022.107472
Zhong, W., An, H., Gao, X., and Sun, X. (2014). The evolution of communities in the international oil trade network. Phys. A Stat. Mech. its Appl. 413, 42–52. doi:10.1016/j.physa.2014.06.055
Keywords: tin products, industry chain, complex network, tin trade, competition pattern
Citation: Jin Y and Dai T (2025) Competitive pattern of global tin products trade from the perspective of industry chain. Front. Earth Sci. 12:1501816. doi: 10.3389/feart.2024.1501816
Received: 25 September 2024; Accepted: 09 December 2024;
Published: 07 January 2025.
Edited by:
Hongjian Zhu, Yanshan University, ChinaReviewed by:
Alex Oriel Godoy, University for Development, ChileYinghui Ding, Hebei University, China
Copyright © 2025 Jin and Dai. This is an open-access article distributed under the terms of the Creative Commons Attribution License (CC BY). The use, distribution or reproduction in other forums is permitted, provided the original author(s) and the copyright owner(s) are credited and that the original publication in this journal is cited, in accordance with accepted academic practice. No use, distribution or reproduction is permitted which does not comply with these terms.
*Correspondence: Tao Dai, YWdsZWRhaUAxMjYuY29t