
94% of researchers rate our articles as excellent or good
Learn more about the work of our research integrity team to safeguard the quality of each article we publish.
Find out more
ORIGINAL RESEARCH article
Front. Earth Sci., 29 November 2024
Sec. Solid Earth Geophysics
Volume 12 - 2024 | https://doi.org/10.3389/feart.2024.1501183
This article is part of the Research TopicAdvanced Materials and Technologies for Sustainable Development of Underground ResourcesView all 44 articles
 Jihao Feng1
 Chuanxin Rong1*
 Hao Shi1
 Bin Wang1
 Zhi Wang2
 Longhui Guo1
 Zhuo Tu1
 Wei Long1
 Dong Wu1
 Xueyan Wang1
The investigation into the complex mechanical properties of frozen calcareous clay under multi-factor interaction holds significant importance for the reliability and durability of engineering in cold regions. This study investigates the strength properties of frozen calcareous clay under different interaction levels by designing a four-factor, four-level orthogonal test that incorporates temperature, confining pressure, dry density, and water content. The study aimed to assess the sensitivity of each factor to failure stress, and establish an intrinsic model based on the Duncan-Chang model considering temperature, confining pressure, and water content. The results indicated that the stress-strain curves exhibit strain-hardening characteristics across various interaction levels. These curves can be divided into elastic and elastic-plastic phases, with the slope of the elastic phase and the stress value at the inflection point increasing with decreasing temperature and increasing confining pressure. When the confining pressure is maintained constant, the failure stress is negatively correlated with temperature. When the temperature is maintained constant, the failure stress is positively correlated with confining pressure. Sensitivity analysis shows that the influence of each factor on failure stress is as follows: temperature > confining pressure > dry density > water content. Additionally, the influence of temperature and confining pressure on failure stress is markedly greater than that of water content and dry density. The evolution of unfrozen water content follows three stages: sharp reduction, rapid reduction, and slow reduction. Verification against experimental data confirmed that the modified constitutive model effectively reflects the stress-strain relationship of frozen calcareous clay under the interaction of multiple factors.
The strength and deformation of permafrost are critical mechanical characteristics of soil that significantly affect engineering designs in cold regions (Shi et al., 2024; Long et al., 2024; Hai et al., 2024). Permafrost is a four-phase system comprising solid mineral particles, ice crystals, liquid water, and gas. Its strength is influenced by factors such as temperature, soil type, and stress state (Hu and Wang, 2013; Xu et al., 2020). It is worth noting that the deformation of permafrost directly impacts the stability and safety of engineering structures subjected to freeze-thaw cycles (Xu et al., 2017; Kong et al., 2017). Therefore, in the engineering design of cold regions, it is crucial to accurately evaluate the strength and deformation of frozen soil to ensure the reliability and durability of the project (Bai et al., 2018; Tatsuoka et al., 2008; Lu et al., 2019). This evaluation holds significant engineering importance for the design and construction of projects in these regions (Duriez and Vincens, 2015; Ni et al., 2018; Hoyos et al., 2014).
The mechanical properties of permafrost are influenced by various factors (Horpibulsuk et al., 2007; Ma et al., 2021; Liu and Carter, 2003), prompting extensive research under different conditions. Temperature, a crucial factor in the formation and stability of permafrost, significantly impacts its mechanical properties (Cudmani et al., 2022). As temperature decreases, water within the soil body freezes into ice, reconstructing the soil’s microstructure and markedly increasing its strength and stiffness. Confining pressure is another critical factor affecting the mechanical properties of permafrost (Sun et al., 2022). Increased confining pressure enhances particle contact and alters the pore structure within the soil, influencing its mechanical response. Under high confining pressures, permafrost exhibits more complex non-linear strength and deformation characteristics. Additionally, dry density, an indicator of soil compactness, directly affects the contact area and force between soil particles, thereby determining the mechanical properties of permafrost (Li et al., 2023). Water content also plays a significant role in the mechanical behavior of frozen soils (Wu et al., 2021). Adequate water content can form an effective ice cementation network during freezing, enhancing the strength and stability of permafrost. Conversely, excessive water content can increase pore water pressure and diminish the mechanical properties of permafrost. These factors not only act independently but also interact synergistically to determine the mechanical behavior of permafrost.
With the rapid advancements in measurement and analysis methods, substantial improvements have been made in understanding the mechanical properties of cryogenic soil under various environmental conditions. Researchers have focused on detailing the complex deformation and failure mechanisms of these soils. Despite these efforts, achieving a comprehensive and predictive model for the deformation, strength, and failure behaviors of cryogenic soil remains a critical challenge. Formulating a precise constitutive relation equation and failure criterion is essential for this task. Suebsuk et al. (2010) developed a generalized constitutive model that can be applied to disturbed clay, natural state clay, and artificially reshaped clay. This model integrates plastic behavior to clarify how structural factors influence the direction of plastic strain during both hardening and softening phases. Yang et al. (2010) carried out triaxial compression tests on frozen sand, examining the mechanical properties of soil under various confining pressures and water contents. They introduced a nonlinear Mohr-Coulomb criterion to analyze the strength of frozen sand and derived generalized values for the internal friction angle and cohesion based on experimental data. Liao et al. (2016) revealed the significant impact of soil composition, particularly salt content, on its mechanical properties. By applying a generalized nonlinear strength theory, Liao developed a strength criterion for frozen soil layers that accounts for variations in salt content. Through conventional triaxial testing, Liao proposed a modified hydrostatic pressure expression using the critical strength function from the modified Cam clay model’s meridian plane.
In summary, previous studies have explored the mechanical properties of frozen clays under variations in single or limited independent variables, establishing constitutive relationship equations and damage criteria. However, there is a notable lack of research on frozen calcareous clay under multifactor interactions. Given the complexity of the mechanical properties of frozen soils in diverse and variable natural environments, the current practice of analyzing each factor in isolation using the control variable method is limited. This approach provides a relatively one-sided understanding of the mechanical properties of permafrost under multifactor interactions and fails to meet the stringent requirements for material durability in the extreme and variable conditions of cold region projects.
The purpose of this study is to elucidate the complex mechanical properties of frozen calcareous clay under multifactor interactions to provide a robust theoretical foundation and technical support for the safety and durability of engineering projects in cold regions. Consequently, a four-factor, four-level orthogonal test was designed to investigate calcareous clay under the interaction of temperature, confining pressure, water content, and dry density. This test aims to examine the evolution of failure stress and the influence of each factor under different interaction levels. Additionally, an ontological model of frozen calcareous clay based on the Duncan-Chang model, incorporating temperature, confining pressure, and water content, is proposed to predict its stress-strain relationship under multifactor interactions.
The calcareous clay (CC) used in the test was sourced from a deep layer (420–430 m) of a coal mine in the Lianghuai mining area, northern Anhui Province, China. It was transported to the laboratory in sealed packaging. The basic physical and mechanical properties of the undisturbed soil samples are shown in Table 1. Following standard provisions (China Planning Press, 2019), the undisturbed soil was dried naturally. After drying, the soil was placed in an oven at 105° C for 12 h A crusher. The dried and processed lumpy soil is crushed once by a crusher. However, the particle size of the crushed soil did not meet the test requirements, necessitating secondary crushing. After the second crushing, the soil was sieved through a 0.5 mm sieve to obtain the desired particle size for the experiment. The crushing process is shown in Figure 1. The particle size distribution was measured using a laser particle size analyser (BT-2001) (He et al., 2024), with results presented in Figure 2. The analysis revealed that the particle size distribution of the calcareous clay primarily ranged from 0.5 to 450 microns, with a significant concentration between 25 and 180 microns. The cumulative content curve of the particle size distribution indicates a relatively stable slope, demonstrating a uniform texture and consistent particle size range within the calcareous clay. This uniformity is beneficial to ensure that the prepared sample has a consistent texture and is isotropic.
This study employed an orthogonal experimental design method to investigate the influence of temperature, pressure, moisture content, and dry density on calcareous clay. Each factor was set at four different levels, resulting in a total of 16 experimental groups, as outlined in Table 2. Each group of samples is configured with four influencing factors, which we denominate as ‘multi-factor interaction’. In each group of samples, one factor is maintained constant, while the remaining factors are varied. The term ‘interaction level’ is employed to designate any set of experimental conditions. The dry density for each sample was calculated using the following expression (Wu et al., 2023):
where
The mass of dry soil and water required for each group of samples was calculated using Equations 1, 2. The dry soil and water were mixed evenly and placed in a sealed bag for 24 h to ensure uniform moisture content throughout the soil samples. Subsequently, the wet soil is filled into the 50 mm × 100 mm internal mold in five increments and compacted. During the first four compacting processes, complete compaction is not required. Instead, it is only necessary to ensure that sufficient space is left for the inclusion of subsequent layers of soil. Simultaneously, the surface of each layer of soil is scarified to enhance the bonding between the layers. The objective is to physically facilitate the interlocking of soil particles, thereby enhancing the overall structural stability (Zhang et al., 2021). Prior to the preparation of the samples, the molds were cleaned and an even layer of petroleum jelly was applied to their inner surfaces. This was done in order to facilitate the removal of the specimens from the molds during the demolding process. Post-compaction, the specimens and molds were sealed with cling film and placed in a cryostat at −20°C for 1 hour before demolding. Once demolded, the specimens were further sealed with cling film and frozen in the cryostat at −20°C for 24 h, followed by placement in a cryostat at the target temperature for an additional 24 h.
Figure 3 illustrates the microstructural characteristics of the calcareous clay post-sampling. Scanning electron microscope (SEM) analyses revealed no significant differences under varying conditions; hence, only the results for a sample with a dry density of 1.86 g/cm³ and a moisture content of 20% were analyzed. The texture of the unfrozen calcareous clay after preparation was uniform, with tightly bound soil particles and small pores, indicating high-quality sample preparation. In contrast, the frozen calcareous clay appeared relatively loose with tiny cracks, likely caused by the expansion force during the freezing of pore water into ice. Given that the SEM scans at 500 µm represent a magnification by a factor of 1,000, and the locations of the photographs were selectively chosen to highlight the most significant changes, the specimens were kept at negative temperatures during the test, and the ice filled these cracks. Therefore, the effects produced by the cracks after freezing can be considered negligible.
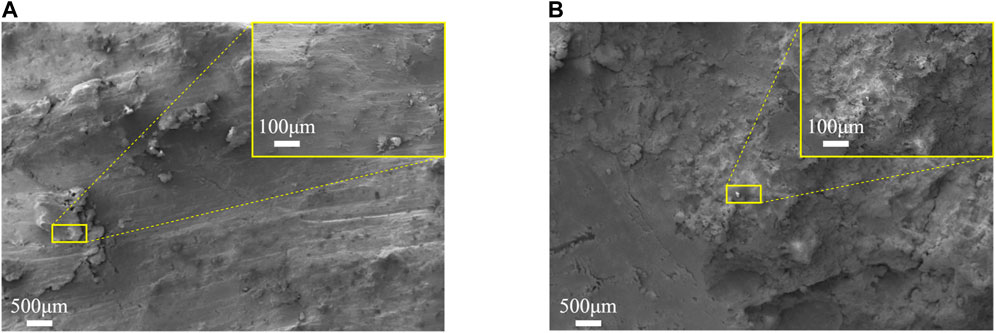
Figure 3. Scanning electron microscopy of calcareous clay samples after drying. (A) Unfrozen calcareous clay samples. (B) Frozen calcareous clay samples.
Figure 4A illustrates the configuration of the low-temperature rock (soil) triaxial test system (ZTCR-2000, Changchun Development Test Instrument Co., Ltd., China), indicating that the test setup comprises a computer processing system, a low-temperature geotechnical triaxial test control system, a low-temperature geotechnical triaxial test machine, a hydraulic oil circulating pump, and an alcohol refrigerant circulating pump. A schematic diagram of the triaxial test system is presented in Figure 4B. It can be noted that the computer processing system is utilized to regulate the control system of triaxial test for low-temperature rock and soil. This system has the capability to control the hydraulic oil circulating pump, which can provide the necessary axial and confining pressures for the low temperature rock and soil triaxial testing machine. Additionally, the alcohol refrigerant circulating pump is employed. The pump is furnished with an independent control switch, enabling the operator to decide whether to activate it flexibly in accordance with the actual requirements. The low temperature rock and soil triaxial testing machine is provided with axial and circumferential strain gauges and a geotechnical sensor located above the chamber for measuring the axial pressure. During the test, the axial pressure and the resulting axial and circumferential strain data of the specimen will be transmitted to the computer processing system in real time and displayed in the form of stress-strain curves. This greatly facilitates the testers’ monitoring and analysis of the specimen’s current status.
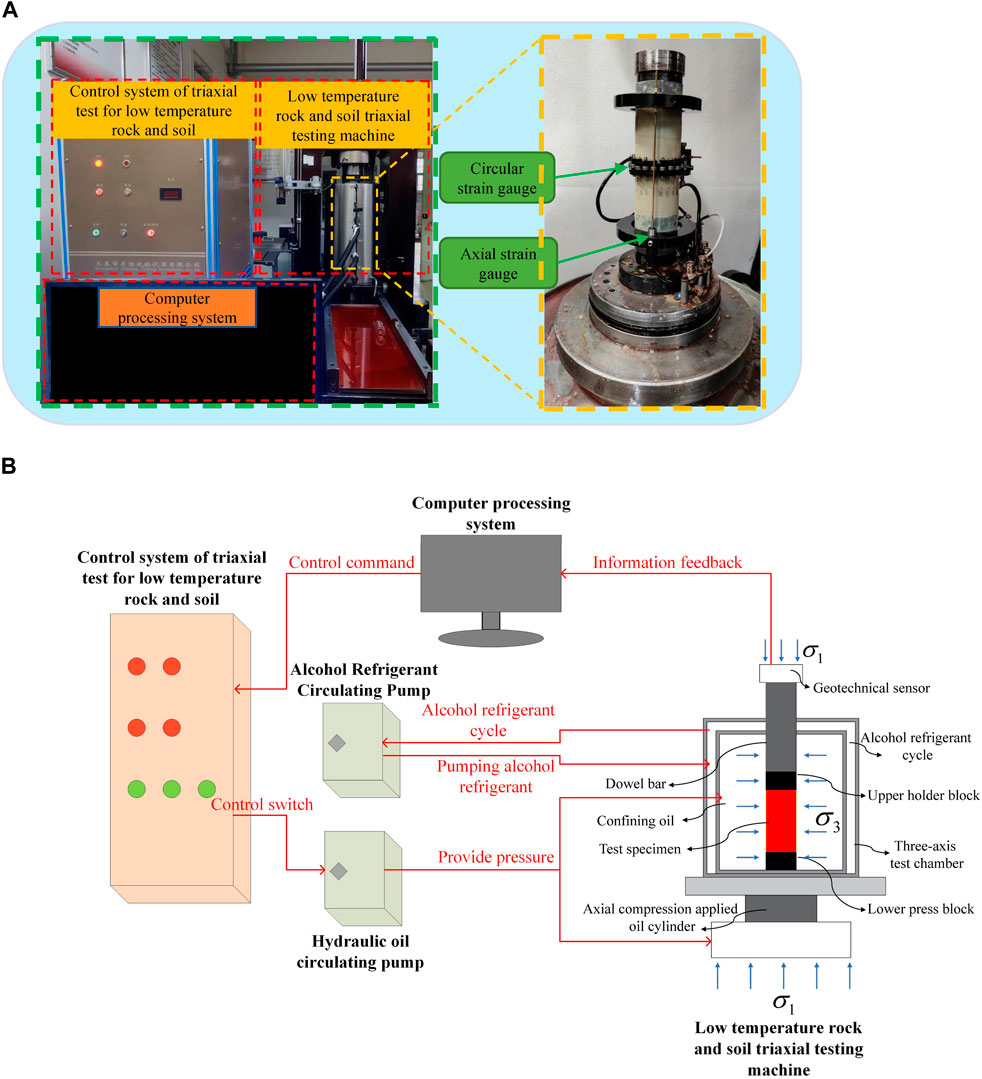
Figure 4. Low Temperature Geotechnical Triaxial Test System. (A) Configuration of low temperature geotechnical triaxial test system. (B) The schematic diagram of the working principle of low temperature geotechnical triaxial test system.
Before initiating the test, the temperature in the test chamber was adjusted to the target level, and the sample underwent a 2-h pre-cooling period. Following this, the sample was loaded into the chamber, and a prestress of 100 N was applied to secure it. The sample was then frozen for an additional 6 h to ensure it reached the target temperature at the commencement of the test. The stress path diagram for the triaxial test is presented in Figure 5, with preloading as the initial point. During both the preloading and freezing stages, only the 100 N prestress was applied to the specimen. Subsequent to the freezing stage, hydrostatic pressure was increased to achieve the target confining pressure, maintaining equal axial and confining pressures, thus ensuring a deviatoric stress of 0 MPa. After reaching the target pressure, it was stabilized for 30 min. Finally, axial loading was applied at a rate of 0.3 mm/min until the specimen failed (Coal Industry Press, 2011). Figure 6 illustrates the comparison of specimens before and after the test. It can be observed that the specimen experienced significant axial compression, resulting in a radial deformation characterized by an “hourglass” shape, with pronounced wrinkles appearing at both ends.
The stress-strain curves of frozen calcareous clays at various temperatures are depicted in Figure 7 (In the figure
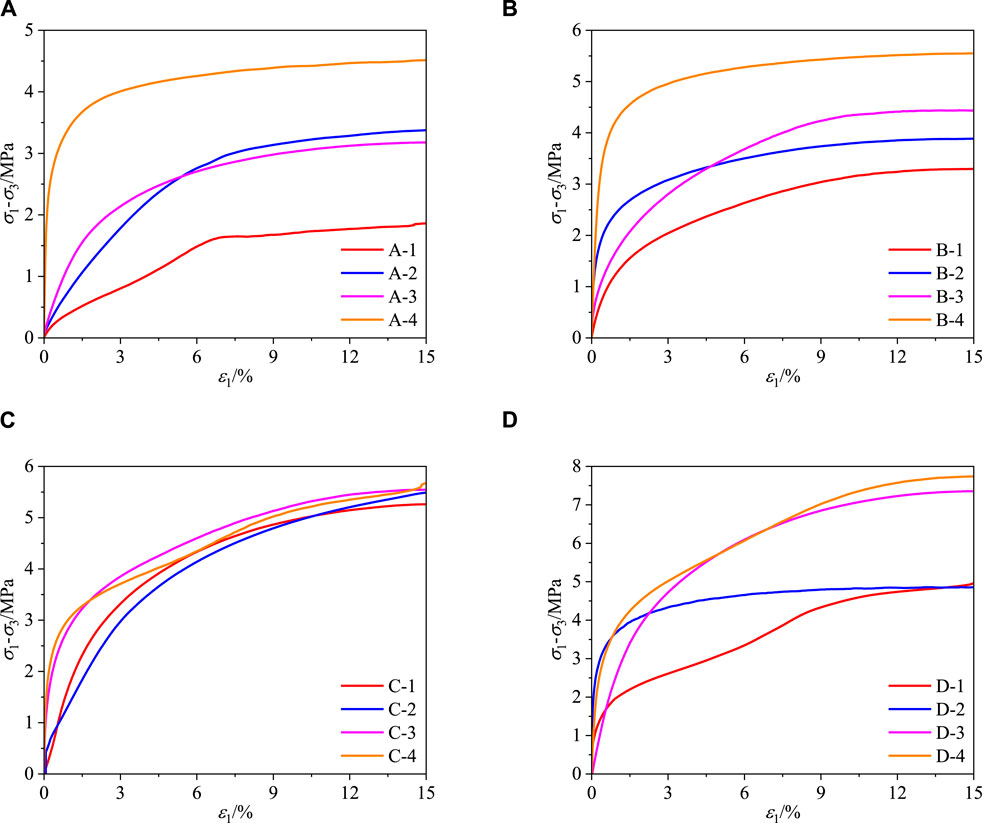
Figure 7. The deviatoric stress-axial strain curves of frozen calcareous clay at different temperatures. (A) T=−5°C. (B) T=−10°C. (C) T=−15°C. (D) T=−20°C.
Figure 8 schematically illustrates the microstructure and mechanical behavior of frozen calcareous clay (In the figure
The deviatoric stress-axial strain curves of frozen calcareous clay exhibit distinct elastic and elastoplastic phases, which can be elucidated through the following analysis: Initially, under the applied hydrostatic pressure for 30 min, the pore space within the sample undergoes compaction. Concurrently, the presence of cemented ice fosters a dense structure among soil particles. During this phase, the specimen’s deformation modulus is substantial, leading to a rapid increase in preload with axial strain, characterized by a linear relationship. This behavior, which may originate from the presence of intact cemented ice and pore ice, reflects elastic properties. As axial strain continues to increase, the preload and axial strain exhibit non-linear growth. The slope of the curve, representing the deformation modulus, gradually diminishes and stabilizes, without exhibiting a distinct peak throughout the curve. At this stage, the internal cemented ice and pore ice within the specimen undergo compression or even disintegrate, leading to the gradual formation and expansion of internal cracks (Wu et al., 2020). Consequently, the specimen becomes damaged, the deformation modulus gradually decreases, and its resistance to deformation weakens (Zhang et al., 2024).
Figure 7 reveals that during the elastic phase, both the slope (modulus of elasticity) and stress value at the inflection point (Junction of elastic and elastoplastic phases) demonstrate an increasing trend with decreasing temperature and increasing confining pressure. This phenomenon may be attributed to several factors: Firstly, the decrease in temperature reduces the content of unfrozen water, thereby increasing the presence of cemented ice and pore ice. Consequently, the effects of cementation and “replacement” are amplified, leading to an augmentation in the specimen’s deformation modulus. Secondly, the rise in confining pressure intensifies the external load on the specimen (Zhang et al., 2023). Microscopically, the pore space experiences further compaction due to the elevated confining pressure, resulting in closer contact between soil particles and increased compression and friction. Macroscopically, the specimens endure greater confining pressures, enhancing confinement and thereby augmenting their ability to resist deformation.
Considering the strain-hardening nature of the stress-strain curves in this test, the deviator stress at an axial strain of 15% serves as the failure stress for analysis (China Planning Press, 2019). Figure 9A compares the results at different temperatures, indicating a gradual increase in the specimen’s failure stress as temperature decreases, a trend that is pronounced. Under identical temperature conditions, the failure stress of the specimen exhibits a positive correlation with confining pressure. Notably, at 5°C, the peak deviatoric stress of A-2 surpasses that of A-3. Analyzing A-2 and A-3 specimens reveals that A-2 has a dry density of 1.86g/cm3 and a moisture content of 17.5%, while A-3 has a dry density of 1.76g/cm3 and a moisture content of 20%. Although A-2 exhibits higher dry density compared to A-3, its moisture content is lower. The discrepancy in failure stress between A-2 and A-3 may originate from the fact that at 5°C, some free water within the specimen remains in liquid form despite freezing. It should be indicated that liquid water, while possessing a lubricating effect, weakens the cementation and “replacement” effect of ice, consequently diminishing the specimen’s strength. However, the increase in dry density increases the number of soil particles in the specimen, reduces porosity, enhances effective contact area between particles, and intensifies extrusion and friction, thereby significantly improving compressive strength. Hence, at this temperature, the impact of water content on sample compressive strength is minimal compared to dry density.
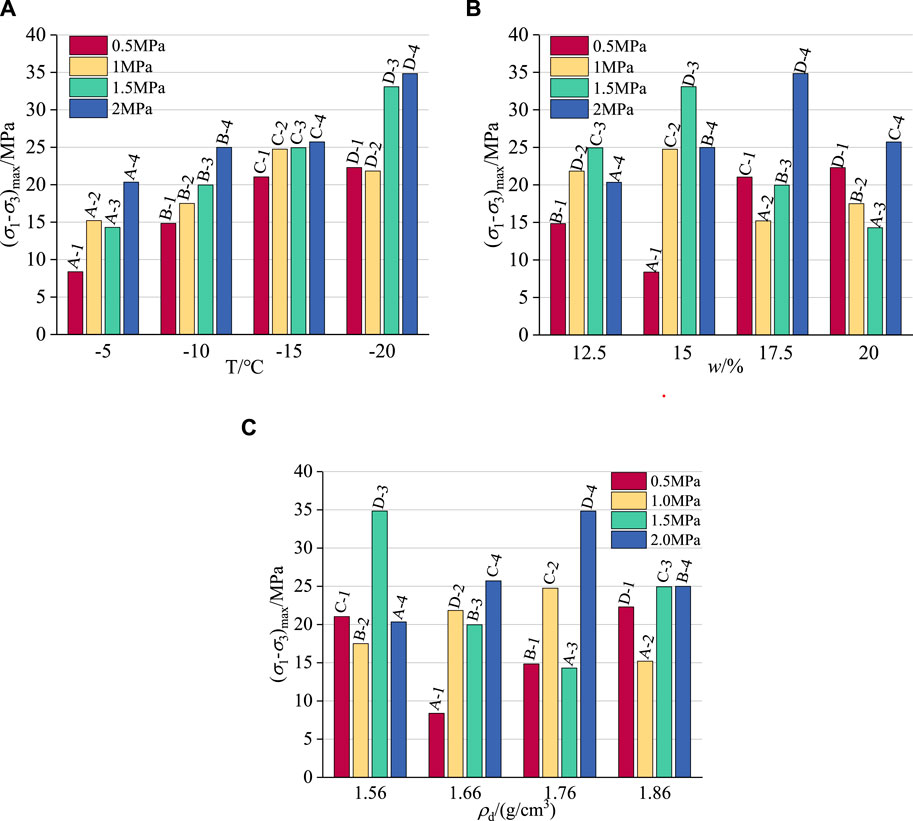
Figure 9. The failure stress histogram of frozen calcareous clay under various factors. (A) Temperature. (B) Moisture content. (C) Dry density.
In Figure 9B, at a moisture content of 17.5%, the failure stress of C-1 surpasses that of B-3, despite B-3 having higher confining pressure and dry density. This may be attributed to C-1 being at −15°C, where nearly all free water freezes and the process of bonded water freezing initiates. At this temperature, the lubricating effect of liquid water diminishes significantly, while the cementation and “replacement” effects of ice are greatly enhanced. This substantial enhancement in ice cementation and “replacement” significantly increases the compressive strength of the specimen. This observation aligns with the general hardening nature of the stress-strain curve at −15°C, underscoring the significant impact of temperature on failure stress magnitude.
Analysis of Figures 9B,C reveals a disordered distribution of failure stress under constant dry density and moisture content conditions. This suggests that while dry density and moisture content exert some influence on failure stress, their impact is almost negligible compared to temperature and confining pressure.
The test data acquired from orthogonal experiments (Jiang et al., 2021) are typically subjected to sensitivity analysis for data processing. This involves averaging the extreme differences in the target value influenced by each factor, thereby identifying the primary factors affecting the target value through the difference between the maximum and minimum test values (Deng et al., 2023). The sensitivity analysis results, presented in Table 3, indicate that temperature exhibits the most substantial effect on failure stress, with an extreme difference value of 2.99 MPa, while moisture content has the least impact, registering an extreme difference value of 0.78 MPa. The sensitivity ranking of each influencing factor on failure stress is as follows: temperature > pressure > dry density > moisture content. This hierarchy underscores that the influence of temperature and pressure on failure stress far surpasses that of moisture content and dry density. Thus, the pronounced effect of temperature and pressure on failure stress aligns with the earlier analysis.
Alterations in the unfrozen water content of permafrost, representing the phase transition between solid and liquid water directly affect the soil’s mechanical properties (Pardo Lara et al., 2021; Wen et al., 2012). To investigate this phenomenon, an NMR test system was employed in this study to measure the unfrozen water content of the samples under the specified orthogonal test conditions. It was ensured that the temperature had reached the designated level and had stabilized for a minimum of 2 hours before conducting the measurements. The NMR test system setup is illustrated in Figure 10.
Figure 11 depicts the evolution of unfrozen water content concerning temperature, delineated into three distinct phases: (1) From 0°C to −2.7°C: Sharp Decrease Phase - As the temperature drops below the freezing point of the calcareous clay, the free water within the soil undergoes a rapid phase transition and rapid freezing. This abrupt change manifests as a sharp decline in unfrozen water content. (2) From −2.7°C to −11.5°C: Rapid Decrease Phase - Within this temperature range, any remaining free water in the soil continues its freezing process, leading to a significant reduction in unfrozen water content. (3) From −11.5°C to −25°C: Slow Reduction Stage - At this juncture, the free water in the soil is predominantly frozen, while the phase transition of bound water commences. Bound water, tightly adhering to soil particles due to capillary action, electrostatic adsorption, and surface tension, encounters difficulty in freezing (Wen et al., 2012). Consequently, the unfrozen water content diminishes gradually at a slower pace. In summary, the progressive decrease in temperature prompts the gradual freezing of free water within the soil, while the freezing of bound water occurs with greater resistance, resulting in the observed evolution of unfrozen water content across the described phases.
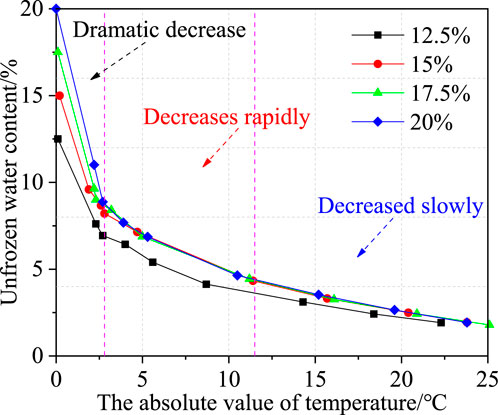
Figure 11. The evolution law of unfrozen water content of frozen calcareous clay with temperature under different water contents.
The quantity of unfrozen water content within permafrost significantly influences its strength, making the investigation of unfrozen water content essential (Chen et al., 2021; Zhang et al., 2020). To estimate the unfrozen water content, this study employs the empirical formula introduced by Xu et al. (2001). The amount of unfrozen water content can be calculated using the Equation 3:
where
According to the NMR test results, the starting freezing temperature of calcareous clay was identified as −0.8°C. The measured data were subjected to fitting, and the fit is illustrated in Figure 12. The fit appears to be satisfactory, with a correlation coefficient of R2 = 0.97687. This high value suggests that the formula can effectively depict the relationship between the unfrozen water content of calcareous clay and the temperature and initial water content. Consequently, it can provide more accurate predictions of the unfrozen water content of calcareous clay.
The Duncan-Chang model (Dong et al., 2023) employs hyperbolic equations to describe the stress-strain behavior of soil. The model can be mathematically expressed as follows:
where
Equation 6 can be considered the primary function of
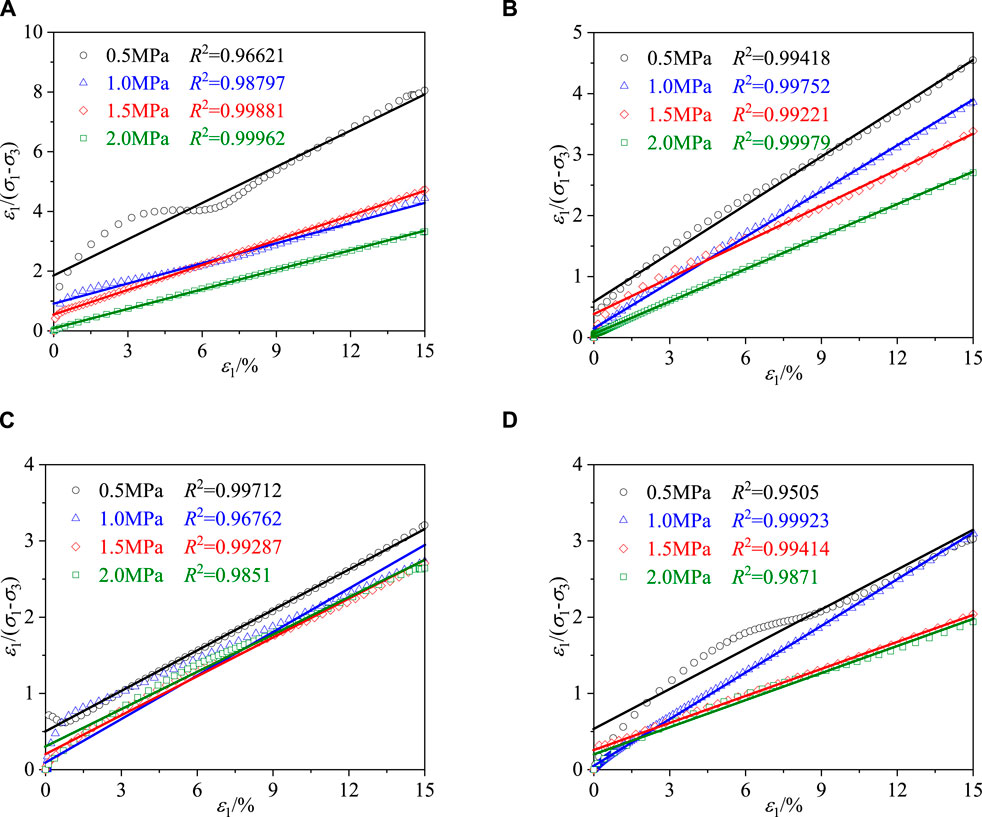
Figure 13. Parameter fitting of Duncan-Chang model at different temperatures. (A) T=−5°C. (B) T=−10°C. (C) T=−15°C. (D) T=−20°C.
Figure 13 reveals that the parameters’ linear fit correlation coefficients R2 exceed 0.9, indicating a significant linear fit correlation. In Equation 6, the parameter
Table 4 indicates that the parameters
where
The specific values of the unfrozen water content of the samples at four temperatures were calculated using Equation 4. These values were then fitted to the parameters
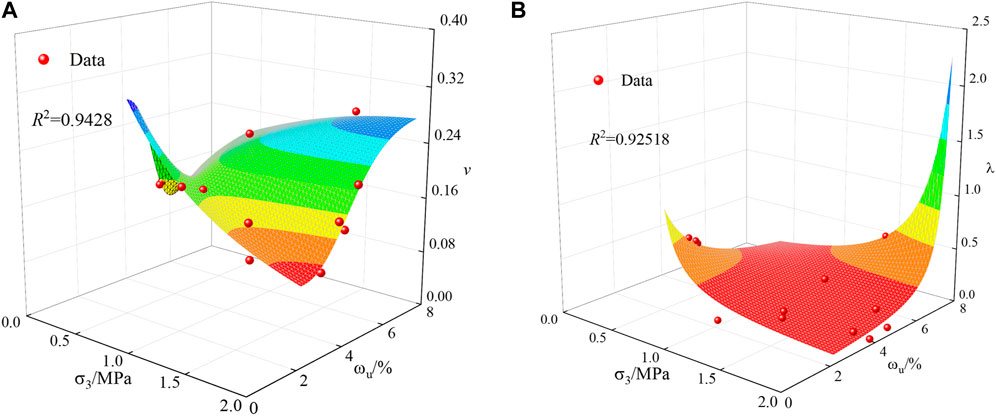
Figure 14. Parametric equation fitting of the Duncan-Chang model. (A) Fitting formula of parameter
It is observed that the binary nonlinear fitting correlation coefficients of parameters
According to Equation 4,
where
Introducing Equation 4 into Equation 9 and Equation 10, yields the following expression:
The relationship between the parameters (
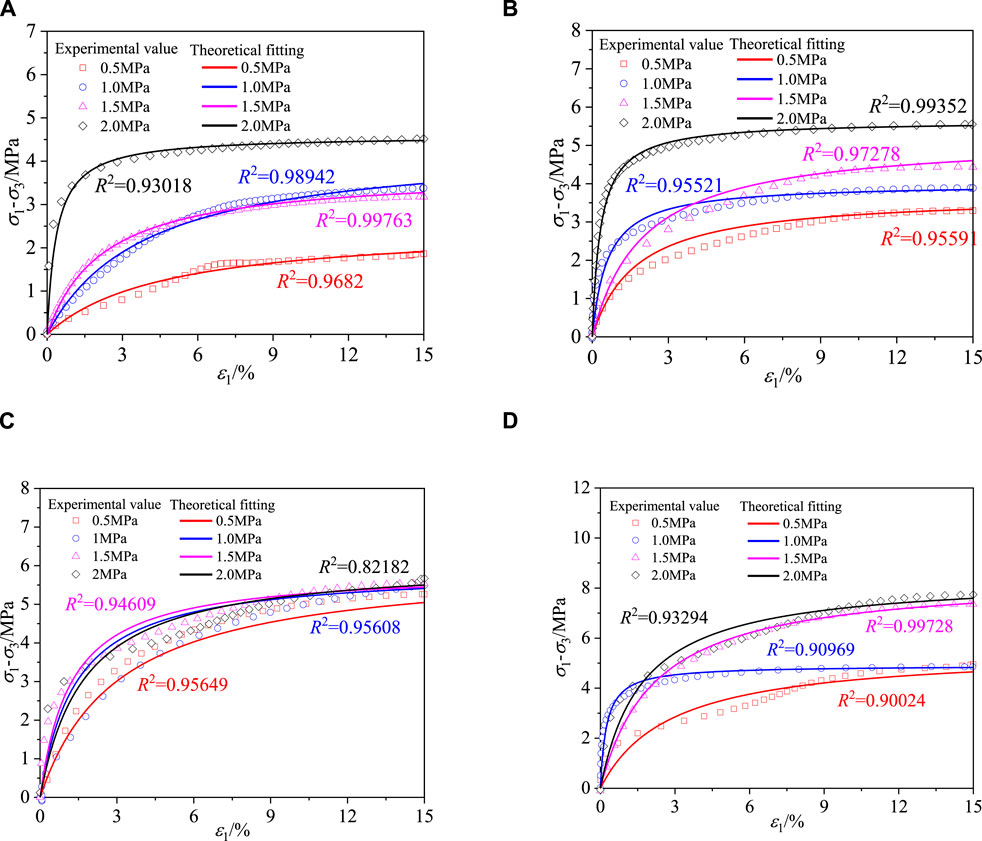
Figure 15. Comparison between theoretical curve and experimental data. (A) T=−5°C. (B) T=−10°C. (C) T=−15°C. (D) T=−20°C.
In previous research, the control variable method has usually been adopted for the analysis of this problem. The method of separately analyzing each factor by controlling variables one by one is inadequate for comprehensively understanding the strength characteristics of frozen calcareous clay under the interaction of multiple factors (Wang et al., 2017; Li et al., 2019; Fan et al., 2021).
Accordingly, this paper utilizes the design method of the orthogonal test to establish 16 groups of test conditions that represent multi - factor interaction levels, aiming to conduct a comprehensive exploration of the strength characteristics of frozen calcareous clay under different interaction levels. The utilization of this research method has significantly enhanced our understanding of the strength characteristics of frozen calcareous clay, thereby laying a solid foundation for the construction of strength prediction models. The strength prediction model established in this study is of great significance in terms of the scientific rigour and accuracy of engineering design in cold regions.
However, due to time limitations, the range of factors investigated in this study is relatively narrow. We intend to expand the scope of the research in the future to include a larger number of factors that may affect the strength of frozen soil. The objective of this expanded research is to identify the key factors with the most significant impact and to modify and optimize the existing prediction models accordingly, aiming at achieving higher accuracy in predicting the strength of frozen soil in the natural environment.
This study employed a four-factor, four-level orthogonal test design to conduct conventional triaxial tests on calcareous clays, considering variables such as temperature, confining pressure, water content, and dry density. The research focused on the non-linear relationship between deviatoric stress and axial strain under different interaction levels and assessed the sensitivity of each factor to failure stress. From the experimental data, a theoretical formula for unfrozen water content was derived, leading to the development of a constitutive model for frozen calcareous clay based on the Duncan-Chang model. The main achievements of this article can be summarized as follows:
(1) The deviatoric stress-axial strain curves at different interaction levels all display strain-hardening characteristics. As the temperature decreases, the curves gradually shift from a weakly hardening type to a generally hardening type. The curves can be divided into elastic and elastic-plastic phases. Moreover, the slope of the elastic phase and the stress value at the inflection point show an increasing tendency with decreasing temperature and increasing confining pressure.
(2) When the confining pressure is maintained constant, the failure stress is negatively correlated with temperature. When the temperature is maintained constant, the failure stress is positively correlated with confining pressure. Sensitivity analysis shows that the influence of each factor on failure stress is as follows: temperature > confining pressure > dry density > water content. Additionally, the influence of temperature and confining pressure on failure stress is markedly greater than that of water content and dry density.
(3) The evolution law curve of unfrozen water content can be divided into three phases: a sharp reduction phase, a rapid reduction phase, and a slow reduction phase. An intrinsic model of frozen calcareous clay considering temperature, confining pressure, and water content was constructed based on the Duncan-Chang model, with the unfrozen water content calculation formula acting as a link. The established modified constitutive model was verified by experimental data, showing its effectiveness in reflecting the stress-strain relationship of frozen calcareous clay under the influence of multiple factors.
The datasets presented in this study can be found in online repositories. The names of the repository/repositories and accession number(s) can be found in the article/supplementary material.
JF: Data curation, Formal Analysis, Investigation, Methodology, Software, Validation, Writing–original draft. CR: Funding acquisition, Supervision, Writing–review and editing. HS: Funding acquisition, Supervision, Writing–review and editing. BW: Supervision, Writing–review and editing. ZW: Data curation, Investigation, Writing–review and editing. LG: Supervision, Writing–review and editing. ZT: Data curation, Investigation, Writing–review and editing. WL: Conceptualization, Methodology, Supervision, Writing–review and editing. DW: Data curation, Investigation, Writing–review and editing. XW: Data curation, Investigation, Writing–review and editing.
The author(s) declare that financial support was received for the research, authorship, and/or publication of this article. This work is financially supported by the National Natural Science Foundation of China (52404108), the National Natural Science Foundation of China (No. 51878005), the Research Activity Funding Project for Postdoctoral Researchers in Anhui Province (2023B726), the State Key Laboratory of Mining Disaster Prevention and Control, Shandong University of Science and Technology (JMDPC202403). The authors gratefully acknowledge financial support of the abovementioned agencies.
The authors declare that the research was conducted in the absence of any commercial or financial relationships that could be construed as a potential conflict of interest.
The author(s) declare that no Generative AI was used in the creation of this manuscript.
All claims expressed in this article are solely those of the authors and do not necessarily represent those of their affiliated organizations, or those of the publisher, the editors and the reviewers. Any product that may be evaluated in this article, or claim that may be made by its manufacturer, is not guaranteed or endorsed by the publisher.
Bai, R., Lai, Y., Zhang, M., and Yu, F. (2018). Theory and application of a novel soil freezing characteristic curve. Appl. Ther. Eng. 129, 1106–1114. doi:10.1016/j.applthermaleng.2017.10.121
Chen, Y., Zhou, Z., Wang, J., Zhao, Y., and Dou, Z. (2021). Quantification and division of unfrozen water content during the freezing process and the influence of soil properties by low-field nuclear magnetic resonance. J. Hydro. 602, 126719. doi:10.1016/j.jhydrol.2021.126719
China Planning Press (2019). The national standards compilation group of people’s Republic of China. GB/T 50123—2019 standard for soil test method. Beijing: China Planning Press.
Coal Industry Press (2011). State administration of work safety.MT/T 593.1-2011 physical and mechanical properties test of artificial frozen soil. Beijing: Coal Industry Press.
Cudmani, R., Yan, W., and Schindler, U. (2022). A constitutive model for the simulation of temperature-stress-and rate-dependent behaviour of frozen granular soils. Géotechnique 73 (12), 1043–1055. doi:10.1680/jgeot.21.00012
Deng, L. C., Li, X. Z., Chen, Y. W., Zhuang, Q. W., Zhu, L. H., and Zhang, C. (2023). Investigations on cutting force and temperature field of pick cutter based on single factor and orthogonal test methods. Rock Mech. Rock Eng. 56 (1), 619–645. doi:10.1007/s00603-022-03099-w
Dong, L., Wu, N., Zhang, Y., Liao, H., Hu, G., and Li, Y. (2023). Improved Duncan-Chang model for reconstituted hydrate-bearing clayey silt from the South China Sea. Adv. Geo-Ene. Res. 8 (2), 136–140. doi:10.46690/ager.2023.05.07
Duriez, J., and Vincens, É. (2015). Constitutive modelling of cohesionless soils and interfaces with various internal states: an elasto-plastic approach. Comp. Geotech. 63, 33–45. doi:10.1016/j.compgeo.2014.08.001
Fan, C., Zhang, W., Lai, Y., and Wang, B. (2021). Mechanical behaviors of frozen clay under dynamic cyclic loadings with freeze-thaw cycles. Cold Reg. Sci. Tech. 181, 103184. doi:10.1016/j.coldregions.2020.103184
Hai, M., Wang, M., Meng, S., Liu, Y., Ji, Y., Zhu, W., et al. (2024). Research on hydro-thermal coupling model of canal foundation soil based on particle grading curve predicting soil-water characteristic curve. Case Stud. Ther. Eng. 56, 104270. doi:10.1016/j.csite.2024.104270
He, P., Cao, H., Dong, J., Hou, G., Mu, Y., and Zhang, J. (2024). Experimental study on the effect of freeze-thaw cycles on the shear characteristics of frozen soil-composite geotextile interface. Case Stud. Ther. Eng. 54, 104011. doi:10.1016/j.csite.2024.104011
Hoyos, L. R., Velosa, C. L., and Puppala, A. J. (2014). Residual shear strength of unsaturated soils via suction-controlled ring shear testing. Eng. Geol. 172, 1–11. doi:10.1016/j.enggeo.2014.01.001
Horpibulsuk, S., Shibuya, S., Fuenkajorn, K., and Katkan, W. (2007). Assessment of engineering properties of Bangkok clay[J]. Can. Geotech. J. 44 (2), 173–187. doi:10.1139/t06-101
Hu, X. D., and Wang, J. T. (2013). The triaxial shear test of artificially frozen soils in tunnel construction of Hong Kong. Appl. Mech. Mater. 353, 1653–1656. doi:10.4028/www.scientific.net/AMM.353-356.1653
Jiang, B., Xia, W., Wu, T., and Liang, J. (2021). The optimum proportion of hygroscopic properties of modified soil composites based on orthogonal test method. J. Clea. Prod. 278, 123828. doi:10.1016/j.jclepro.2020.123828
Kong, Y., Xu, M., and Song, E. (2017). An elastic-viscoplastic double-yield-surface model for coarse-grained soils considering particle breakage. Comp. Geotech. 85, 59–70. doi:10.1016/j.compgeo.2016.12.014
Li, Q., Zhang, D., Li, P., Cui, K., and Jing, X. (2023). The small-strain stiffness of frozen clay soils at different temperatures and initial water contents: experimental study and predicted model. Cold Reg. Sci. Tech. 215, 103986. doi:10.1016/j.coldregions.2023.103986
Li, S., Wang, C., Xu, X., Shi, L., and Yin, N. (2019). Experimental and statistical studies on the thermal properties of frozen clay in Qinghai-Tibet Plateau. Appl. Clay Sci. 177, 1–11. doi:10.1016/j.clay.2019.05.002
Liao, M., Lai, Y., and Wang, C. (2016). A strength criterion for frozen sodium sulfate saline soil. Canad. Geotech. J. 53 (7), 1176–1185. doi:10.1139/cgj-2015-0569
Liu, M. D., and Carter, J. P. (2003). Volumetric deformation of natural clays. Inter. J. Geomech. 3 (2), 236–252. doi:10.1061/(ASCE)1532-3641(2003)3:2(236)
Long, H., Zhai, J., Zhang, Z., Zhao, Y., Zhang, K., and Zhang, A. (2024). Study on the effect of step ratio to temperature field of cut-fill transition in deep seasonal frozen soil region. Case Stud. Ther. Eng. 54, 104051. doi:10.1016/j.csite.2024.104051
Lu, D., Liang, J., Du, X., Ma, C., and Gao, Z. (2019). Fractional elastoplastic constitutive model for soils based on a novel 3D fractional plastic flow rule. Comp. Geotech. 105, 277–290. doi:10.1016/j.compgeo.2018.10.004
Ma, Q., Huang, K., and Ma, D. (2021). Energy absorption characteristics and theoretical analysis of frozen clay with pre-existing cracks under uniaxial compressive impact load. Cold Reg. Sci. Tech. 182, 103206. doi:10.1016/j.coldregions.2020.103206
Ni, P., Mei, G., Zhao, Y., and Chen, H. (2018). Plane strain evaluation of stress paths for supported excavations under lateral loading and unloading. Soils Found. 58 (1), 146–159. doi:10.1016/j.sandf.2017.12.003
Pardo Lara, R., Berg, A. A., Warland, J., and Parkin, G. (2021). Implications of measurement metrics on soil freezing curves: a simulation of freeze–thaw hysteresis. Hydro. Proc. 35 (7), e14269. doi:10.1002/hyp.14269
Shi, S., Zhang, F., Feng, D., and Xu, X. (2020). Experimental investigation on shear characteristics of ice–frozen clay interface. Cold Reg. Sci. Tech. 176, 103090. doi:10.1016/j.coldregions.2020.103090
Shi, Y., Kong, X., Ma, W., Zhang, L., Yang, C., and Mu, Y. (2024). Experimental study on the water and heat dynamic characteristics of silty clay at different depths under temperature gradient. Case Stud. Ther. Eng. 57, 104366. doi:10.1016/j.csite.2024.104366
Suebsuk, J., Horpibulsuk, S., and Liu, M. D. (2010). Modified Structured Cam Clay: a generalised critical state model for destructured, naturally structured and artificially structured clays. Comp. Geotech. 37 (7-8), 956–968. doi:10.1016/j.compgeo.2010.08.002
Sun, Z., Zhang, S., Wang, Y., Bai, R., and Li, S. (2022). Mechanical behavior and microstructural evolution of frozen soils under the combination of confining pressure and water content. Eng. Geol. 308, 106819. doi:10.1016/j.enggeo.2022.106819
Tatsuoka, F., Di Benedetto, H., Enomoto, T., Kawabe, S., and Kongkitkul, W. (2008). Various viscosity types of geomaterials in shear and their mathematical expression. Soils Found. 48 (1), 41–60. doi:10.3208/sandf.48.41
Wang, J., Nishimura, S., and Tokoro, T. (2017). Laboratory study and interpretation of mechanical behavior of frozen clay through state concept. Soils Found. 57 (2), 194–210. doi:10.1016/j.sandf.2017.03.003
Wen, Z., Ma, W., Feng, W., Deng, Y., Wang, D., Fan, Z., et al. (2012). Experimental study on unfrozen water content and soil matric potential of Qinghai-Tibetan silty clay[J]. Environ. Earth Sci. 66, 1467–1476. doi:10.1007/s12665-011-1386-0
Wu, H., Li, Z., Song, W., and Bai, S. (2021). Effects of superabsorbent polymers on moisture migration and accumulation behaviors in soil. J. Clean. Prod. 279, 123841. doi:10.1016/j.jclepro.2020.123841
Wu, J., Jing, H., Gao, Y., Meng, Q., Yin, Q., and Du, Y. (2022). Effects of carbon nanotube dosage and aggregate size distribution on mechanical property and microstructure of cemented rockfill. Cem. Concr. Compos. 127, 104408. doi:10.1016/j.cemconcomp.2022.104408
Wu, J., Jing, H., Yin, Q., Yu, L., Meng, B., and Li, S. (2020). Strength prediction model considering material, ultrasonic and stress of cemented waste rock backfill for recycling gangue. J. Clean. Prod. 276, 123189. doi:10.1016/j.jclepro.2020.123189
Wu, J., Wong, H. S., Zhang, H., Yin, Q., Jing, H., and Ma, D. (2024). Improvement of cemented rockfill by premixing low-alkalinity activator and fly ash for recycling gangue and partially replacing cement. Cem. Concr. Compos. 145, 105345. doi:10.1016/j.cemconcomp.2023.105345
Wu, J., Yang, N., Li, P., and Yang, C. (2023). Influence of moisture content and dry density on the compressibility of disturbed loess: a case study in Yan’an City, China. Sustainability 15 (7), 6212. doi:10.3390/su15076212
Wu, X. Y., Liang, Q. G., Niu, F. J., and Li, C. Q. (2017). Experimental study on shear strain hardening-softening classification of loess. Chine J. Undergr. Space Eng. 13 (06), 1457–1466.
Xu, X., Wang, B., Fan, C., and Zhang, W. (2020). Strength and deformation characteristics of silty clay under frozen and unfrozen states. Cold Reg. Sci. Tech. 172, 102982. doi:10.1016/j.coldregions.2019.102982
Xu, X., Wang, Y., Yin, Z., and Zhang, H. (2017). Effect of temperature and strain rate on mechanical characteristics and constitutive model of frozen Helin loess. Cold Reg. Sci. Tech. 136, 44–51. doi:10.1016/j.coldregions.2017.01.010
Xu, X. Z., Wang, J. C., and Zhang, L. X. (2001). Frozen soil physics. Editor X. Z. Xu (Beijing: Science Press), 105–107.
Yang, Y., Lai, Y., and Chang, X. (2010). Laboratory and theoretical investigations on the deformation and strength behaviors of artificial frozen soil. Cold Reg. Sci. Tech. 64 (1), 39–45. doi:10.1016/j.coldregions.2010.07.003
Zhang, M., Zhang, X., Lai, Y., Lu, J., and Wang, C. (2020). Variations of the temperatures and volumetric unfrozen water contents of fine-grained soils during a freezing–thawing process. Acta Geotech. 15, 595–601. doi:10.1007/s11440-018-0720-z
Zhang, T., Gao, Y., Liu, S., Yu, J., and Zhang, C. (2024). Experimental and numerical studies of breakage and fractal characteristics of silica sands in high-pressure triaxial tests. Adv. Powder Technol. 35 (7), 104548. doi:10.1016/j.apt.2024.104548
Zhang, T., Zhang, C., Song, F., Zou, J., Gao, Y., and Yang, W. (2023). Breakage behavior of silica sands during high-pressure triaxial loading using X-ray microtomography. Acta Geotech. 18 (10), 5195–5211. doi:10.1007/s11440-023-01866-9
Keywords: frozen calcareous clay, interaction, strength characteristics, unfrozen water content, modified duncan-chang constitutive model
Citation: Feng J, Rong C, Shi H, Wang B, Wang Z, Guo L, Tu Z, Long W, Wu D and Wang X (2024) Study on strength and constitutive model of frozen calcareous clay under multi-factor interaction. Front. Earth Sci. 12:1501183. doi: 10.3389/feart.2024.1501183
Received: 24 September 2024; Accepted: 04 November 2024;
Published: 29 November 2024.
Edited by:
Jiangyu Wu, China University of Mining and Technology, ChinaReviewed by:
Xiao Wang, Shandong University of Science and Technology, ChinaCopyright © 2024 Feng, Rong, Shi, Wang, Wang, Guo, Tu, Long, Wu and Wang. This is an open-access article distributed under the terms of the Creative Commons Attribution License (CC BY). The use, distribution or reproduction in other forums is permitted, provided the original author(s) and the copyright owner(s) are credited and that the original publication in this journal is cited, in accordance with accepted academic practice. No use, distribution or reproduction is permitted which does not comply with these terms.
*Correspondence: Chuanxin Rong, Y2h4cm9uZ0BhdXN0LmVkdS5jbg==
Disclaimer: All claims expressed in this article are solely those of the authors and do not necessarily represent those of their affiliated organizations, or those of the publisher, the editors and the reviewers. Any product that may be evaluated in this article or claim that may be made by its manufacturer is not guaranteed or endorsed by the publisher.
Research integrity at Frontiers

Learn more about the work of our research integrity team to safeguard the quality of each article we publish.