- 1College of Geography and Remote Sensing, Hohai University, Nanjing, China
- 2Engineering Digital Research Center, Gansu Water Resources and Hydropower Survey and Design Research Institute, Lanzhou, Gansu, China
Glacier surge represents a special glacier behavior with abnormally high flow speeds, which can trigger catastrophic events, such as high-speed ice avalanches and glacial lake outburst floods, transforming landforms in the mountain cryosphere and impacting downstream communities. Glacier surges have been frequently observed in High Mountain Asia (HMA) in the past decades. Previous studies have been devoted to detecting and monitoring surge-type glaciers in HMA. Here we provide an updated inventory of surge-type glaciers from the literature and further extract key parameters of surge activities in HMA (active period, advance distance/rate of terminus, surging pattern, mass balance) based on time-series Landsat images and glacier surface elevation change datasets. Our inventory includes a total of 652 surge-type glaciers that surged at least once during 2000 and 2020. Surge-type glaciers exhibiting obvious spatial clustering are featured by long glacier tongues and gentle slopes. Mapping of terminus changes of 328 surge-type glaciers with clean or partly moraine-covered tongues reveal 337 surge events that occurred during the period. There are 9 glaciers exhibiting surge events twice, each lasting 2–5 years with a reoccurrence interval of ∼10 years. The length of the active period and advancing distance show a heavy-tailed distribution, with the advance rate exponentially decreasing with the extension of the active period. We identified 178 Alaska-type and 159 Svalbard-type glacier surges in HMA during the early 21st century. Glaciers in HMA are generally in a state of mass loss, but slight positive mass balance were observed in the northwestern regions where glacier surging concentrates. The differences in glacier-wide mass balance between surge-type and non-surge-type glaciers were not consistent in different subregions. Obvious glacier mass loss was observed in the post-surging period due to the transfer of glacier mass downstream with surging. The updated information on glacier surges in the HMA in the past two decades provides a basis for future glacier-related hazard monitoring and further understanding of glacier surge mechanisms in the region.
1 Introduction
Glaciers, as vital components of the cryosphere, are closely linked to regional water resources and climate (Qin et al., 2020). Glacier surge, referring to a sudden abnormally rapid ice flow that occurs periodically on certain glaciers, has gained wide attention in recent decades as the most dramatic phenomenon in the mountainous cryosphere (Kääb et al., 2018). The state of surge-type glaciers can be divided into two stages: quiescent and active periods (Raymond, 1987; Meier and Post, 2011). During the active period, the glacier velocity suddenly elevates at least 10 to 100 times faster than that during the quiescent period, accompanied by a significant transfer of ice mass downstream, and noticeable surface features such as irregular crevasses, circular moraines, extensive layer deposits, and advances of the glacier terminus (Barrand and Murray, 2006; Hewitt, 2011; Rankl et al., 2014; Round et al., 2017). The occurrence of surging events reflects the instability within glaciers and can lead to extreme glacier hazard events, such as glacial lake outburst floods, ice avalanches, and glacier debris flows, posing significant threats to downstream communities (Zhang et al., 2018; Bhambri et al., 2020). Many large-scale glacial lake outburst disasters in the Karakoram Mountains can be traced back to areas where glacier surging occurred (Hewitt and Liu, 2010; Bhambri et al., 2019). Therefore, understanding the process and characteristics of glacier surges is not only essential for understanding the mechanisms of glacier behavior but also of practical significance for glacier hazard prevention and control.
Glacier surges have been observed a long time ago but remain poorly understood. In recent years, the development of remote sensing technology has advanced glacier surge monitoring and promoted an understanding of this unusual behavior. It has been found and the High Mountain Asia (HMA) region (including Karakoram Mountains, Western Kunlun Mountains, and Pamirs) is one of the concentrations of surge-type glaciers (Jiskoot et al., 2000; Sevestre and Benn, 2015). In addition, compared to the widespread glacier melting globally during the early 21st century (Zemp et al., 2015; Hugonnet et al., 2021), certain regions in HMA have maintained a relatively stable or slightly positive glacier mass balance (Hewitt, 2005; Brun et al., 2017; Berthier and Brun, 2019; Yao et al., 2019). The concentration of surge-type glaciers and the relatively positive glacier mass balance in the HMA stands out as an anomaly which has attracted widespread attention. A few studies have examined the difference in glacier-wide mass balance between surge-type and non-surge-type glaciers (Gardelle et al., 2013; Guillet et al., 2022) and concluded no significant differences between the two types in a long-term period. Due to the limited temporal resolution of elevation change datasets, the dynamics of surging processes in terms of mass transport and melting remain not well understood.
Prior studies have monitored and cataloged individual or regional glacier surging events, based on surface features and morphological changes at glacier termini related to surging (Grant et al., 2009; Jamieson et al., 2015; Yan et al., 2019; Vale et al., 2021; Zhou et al., 2021), glacier surface velocities (Paul, 2015; Quincey et al., 2015; Paul et al., 2017; King et al., 2021), elevation changes (Goerlich et al., 2020; Jiang et al., 2020; Guo et al., 2023), surface cover changes on glacier terminus (Ke et al., 2022) using optical images, radar images, Digital Elevation Models (DEMs). Recent regional surge-type inventories (e.g., Guo et al., 2023; Guillet et al., 2022) applied multiple criteria and methods for determining surge-type glaciers. Guillet et al. (2022) presented a by-far most complete inventory of the surge-type glaciers across HMA between 2000 and 2018 and analyzed their distribution and geometrical features. Among the methods of identifying surge-type glaciers, direct evidence can be obtained by capturing the active phase of surge such as acceleration of velocities, front advance, and abnormal elevation change patterns from multi-temporal DEMs; whereas other methods such as morphological features (e.g., presence of looped moraines and extensive crevassing) may be subject to a certain level of uncertainties and mostly characterized as surge-like glaciers. Additionally, detailed information about the surge characteristics, such as the active phase and the magnitude of surges, can be obtained from methods such as analyzing velocity or terminus changes, but is hard to determine and generally not complete in current regional inventories. The completeness of surge-type glaciers and characteristics of glacier surging events need updating and validation. Particularly, details of glacier surging events (e.g., advance rate, magnitude, active period, mass balance) are insufficient in the HMA, which hinders the comprehensive monitoring and prevention of glacier surging-related hazards and a clear understanding of the glacier surge mechanisms.
In this study, we first compiled an inventory of glacier surging events in HMA during the 21st century based on existing literature and remote sensing observations. The inventoried surge-type glaciers were verified with surface elevation change data and animated Landsat image series. Then we mapped each surging event over glacier tongues with clean-ice cover or partly moraine cover based on the long-term Landsat imagery. The mapping enables the extraction of key parameters of surging events including the advance distance/rate of the terminus, the active period and the classification of the surging pattern (e.g., the Alaska-type or the Svalbard-type), for improved characterization of surge dynamics in the region. Furthermore, the glacier mass balance of surge-type and non-surge-type glaciers was analyzed based on surface elevation change data (dh/dt maps). With the updated information, we provide an inventory of surge-type glaciers and surging activities in the HMA region in the 21st century, with special attention on glacier mass balance. This dataset allows a systemic analysis of the spatial and temporal distribution of surge-type glaciers and glacier surge activities, which helps future monitoring of glacier-related hazards advance and understanding of glacier surges in the HMA region.
2 Study area
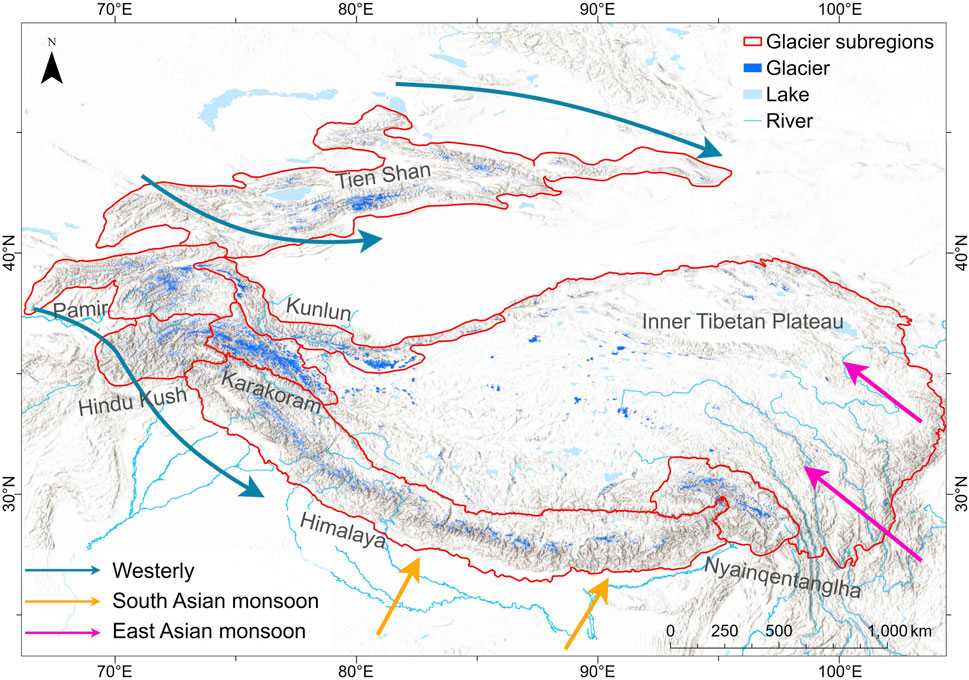
The HMA region encompasses the Tibetan Plateau and surrounding high-altitude areas with elevations ranging from 3,000 m to over 6,000 m in central Asia (25°N - 46°N latitude, 65°E − 105°E longitude) (Figure 1). HMA region is characterized by diverse topographies and landscapes and is the headwaters of major river systems in Asia including the Yangtze, Yellow and Indus rivers (Yao et al., 2023). The climate over HMA is influenced by the westerlies, the South Asian Monsoon, and the East Asian Monsoon, resulting in complex climatic conditions (Yao et al., 2022). The high altitude and cold climate in HMA foster the widespread of contemporary glaciers at middle to low latitudes. According to version 7.0 of Randolph Glacier Inventory (RGI) (RGI 7.0 Consortium, 2023), there are a total of 131,696 glaciers in HMA covering an area of 99,463 km2, with an average glacier elevation of 6,000 m. Additionally, some glaciers in HMA are heavily covered by moraines at their termini, making it difficult to accurately assess terminal changes and mass transfer (Molg et al., 2018; Scherler et al., 2018).
The HMA region can be divided into eight glacier subregions, including the Tien Shan Mountains, Pamir Plateau, Hindu Kush Region, Karakoram Mountains, Himalaya Region, Nyainqentanglha Mountains, Inner Tibetan Plateau, and Kunlun Mountains (Lv et al., 2022). Global warming has induced significant glacier retreat in the southern and eastern margins of the HMA, particularly those in the Himalaya Region, Nyainqentanglha Mountains, and Tien Shan Mountains. The on-going trend has significant impacts on river runoff, landscape morphology, and human livelihoods in the region (Yao et al., 2012; Kraaijenbrink et al., 2017; Dehecq et al., 2019; Hugonnet et al., 2021). In contrast, the northwestern region, including the Pamir, Karakoram, and Kunlun Mountains, where a large number of long and large-size glaciers concentrate, exhibit slight mass gain, termed as the “Karakoram Anomaly” (Gardelle et al., 2013; Farinotti et al., 2020; Hugonnet et al., 2021). A large number of surge-type glaciers are found in these regions, which complexifies understanding of the glacier response to climate change in these regions (Guillet et al., 2022; Guo et al., 2023; Yao et al., 2023).
3 Data and methods
3.1 Data
3.1.1 Landsat data
The Landsat missions with TM (Landsat 5), ETM+ (Landsat 7), and OLI (Landsat 8) sensors provide long-term surface observation data at a spatial resolution of 30 m. We explored these images to map the extent of glacier tongues and extract key parameters of glacier surges (active period, advance distance of terminus, advance rate of terminus, and surging pattern). The Landsat 5/7/8 images with radiometric and geometric correction are available at the Google Earth Engine (GEE) platform. Data gaps in the Landsat 7 imagery due to scan line failure since 2003 were filled based on the principle of spatial continuity (Heid and Kääb, 2012). Additionally, to limit the impact of seasonal snow cover on glacier extent identification, we only used Landsat images obtained from June to October during 2000 and 2021.
3.1.2 Auxiliary datasets
The glacier inventory data (RGI version 7.0) was released by GLIMS in 2023 and can be obtained from the GLIMS website (https://www.glims.org/) (RGI 7.0 Consortium, 2023). This data provides basic attributes for each glacier, including area, length, average elevation, average slope, and aspect (Pfeffer et al., 2014). We used this data to assist in the detection of surge-type glaciers and the analysis of glacier geometric topographic features. We also used the glacier centerline product provided by RGI version 7.0 for the calculation of glacier length from the glacier area mapping results.
Hugonnet et al. (2021) provided estimates of surface elevation changes (dh/dt) for global glaciers by fitting elevation time series constructed from ASTER, Arctic DEM (Arctic Digital Elevation Model), and REMA (Reference Elevation Model of Antarctica) data (available at http://maps.theia-land.fr/theia-cartographic-layers.html) (Hugonnet et al., 2021). Their estimation of dh/dt covers different periods, including 2000–2004, 2005–2009, 2010–2014, 2015–2019, 2000–2009, 2010–2019, and 2000–2019. We used the dh/dt maps to estimate region-wide mean mass balances and glacier-wide mass balances, including the surge-type and non-surge-type over different periods.
3.2 Methods
3.2.1 Compilation of surge-type glaciers
An inventory of surge-type glaciers provides a foundational reference for studying the spatiotemporal extent as well as key characteristics of glacier surging activities. Previous studies have conducted the identification of surge-type glaciers and the detection of surging activities in different parts of HMA based on different methods and datasets. Due to limitations of observations in spatial and temporal coverage, as well as uncertainties in different methods, the derived results could be inconsistent (Table 1). We integrated all reported surge-type glaciers from the listed literature and linked them to the RGI database based on spatial location. The occurrence and the coarse location of the surge were validated and recorded using animated time-series Landsat images (Paul, 2015) and the dh/dt maps at a 5-year temporal resolution (Hugonnet et al., 2021). The animated time-series Landsat data can reveal abrupt velocity changes and front advance, whereas the dh/dt maps show abnormal elevation change patterns related to surge such as substantial thickening over lower receiving zones and thinning over higher reservoir zones. We removed duplicates and some dubious cases when neither the Landsat image series nor the dh/dt maps showed clear evidence of surging occurrences during the study period. As a result, a total of 652 surge-type glaciers in the region from 2000 to 2020 were confirmed.
3.2.2 Detection of glacier surging activities and extraction of key parameters
By examining the surface moraine coverage of 652 surge-type glaciers in HMA (Scherler et al., 2018), we identified a total of 328 surge-type glaciers with clean or partially moraine-covered tongues, which means the extent of glacier tongues can be accurately identified from optical images. For these 328 glaciers, we mapped the changes of glacier tongues using time-series Landsat imagery. The mapping results were then used to extract the key parameters of glacier surges including the start and end year of surges, advance distance and rate of the terminus, and the pattern of surge. The detailed process is elaborated below.
To map the extent of glacier tongues, we created vectors of regions of interest by buffering the glacier outlines (∼600 m) around the glacier tongues. Considering the glacier terminus advances caused by surge, the region of interest for each glacier was manually extended toward the terminus direction. For each region of interest, all available Landsat images were filtered based on date (June to October) and cloud coverage (<30%) to reduce the influence of thin clouds and seasonal snow cover. The Glacier Band Ratio (GBR), which has been widely used for glacier extraction in mountainous areas (Ji et al., 2018; Bevington and Menounos, 2022) was computed for segmentation with Equation 1:
where
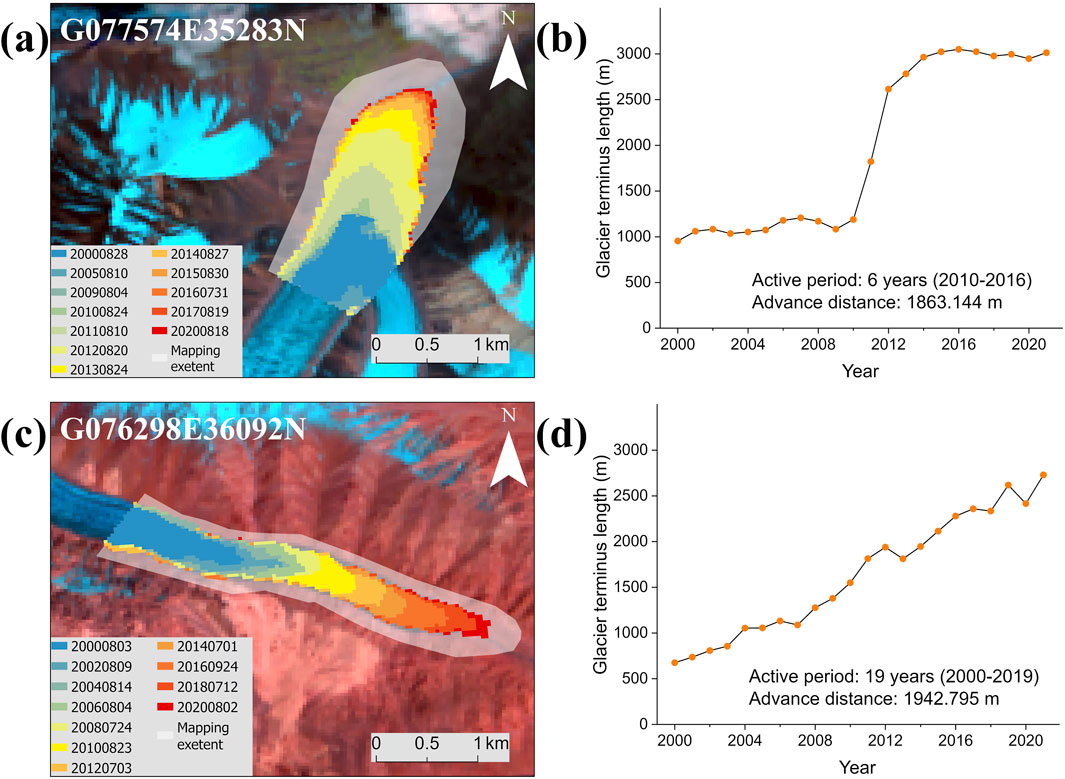
Figure 2. Detection of two types of glacier surge by mapping glacier terminus from the Landsat imagery. (A) Glacier terminus change for a typical Alaska-type surging (GLIMS ID: G077574E35283N). The background image is a false-color composite (band 6—SWIR1, 5—NIR, 4—Red as RGB) from Landsat 8 OLI acquired on 26 July 2020. (B) The time series of the terminus length for the glacier in a. (C) Glacier terminus change for a typical Svalbard-type surging (GLIMS ID: G076298E36092N). The background image is a false-color composite (band 6—SWIR1, 5—NIR, 4—Red as RGB) from Landsat 8 OLI acquired on 12 July 2018. (D) The time series of the terminus length for the glacier in c.
Based on the glacier terminus length change, two types of surging patterns (Alaska-type and Svalbard-type) were manually determined by plotting the glacier terminus versus date (Figures 2B, D). The Alaska-type surging exhibits a sudden increase in the glacier terminus length within a short period of about several years (Figures 2A, B). The plot of glacier terminus length versus time shows obvious abrupt changes when the surge starts, and then sudden deceleration when the surge ends. The Svalbard-type shows a prolonged and stable increase in the glacier terminus length over a long period (≥10 years) (Figures 2C, D). Generally, the Alaska-type of surge is typically associated with a steep slope with varying but high steps of terminus advance while the Svalbard-type is characterized by a gentle and stable slope of length changes. Note that we identified different surging patterns based on glacier terminus length changes which are associated with velocity changes, rather than classifications (hydrological or thermal controls) of the mechanisms.
3.2.3 Estimation of glacier mass balance
Glacier mass balance reflects the total mass change of a glacier over a certain period. Based on the surface elevation data (dh/dt maps) (Hugonnet et al., 2021), we computed mass balance for different subregions and individual glaciers with size larger than 0.25 km2 and data coverage higher than 30%, considering the spatial resolution (100 m) and coverage of the dh/dt data. To mitigate the influences of glacier size on the comparison of surge-type and non-surge-type glacier mass balance, we only included the individual mass balance of non-surge-type glaciers that are in the surroundings of surge-type glaciers with comparable size (generally >1 km2, except a small fraction surrounding the small surge-type glaciers). This means that many small-size non-surge-type glaciers were included in the regional mean computation but excluded in the individual glacier mass balance. For each region/glacier, the entire elevation range of the glacier was divided into different elevation bins with a 100 m interval, and the average elevation change value for each elevation bin was calculated. The average elevation change within the glacier was calculated by summing the mean elevation change values weighted by the glacier area of each elevation bin (Ke et al., 2020), according to Equation 2:
where i represents the ith elevation bin, n represents the total number of elevation bins, Ri denotes the ratio of glacier area within the elevation bin to total glacier area, and the
We calculated the error of glacier mass balance estimation based on errors in glacier surface elevation change and density conversion with Equation 3 (Ke et al., 2020). The error in glacier surface elevation change (
where
Finally, based on the errors in glacier surface elevation change and density conversion, the error in mass balance estimation (
where
4 Results
4.1 The distribution of surge-type glaciers
In HMA, we recorded and confirmed a total of 652 surge-type glaciers between 2000 and 2020, covering a total area of 17,688.79 km2, which accounts for 17.8% of the total glacier area in the region (Figure 3). The number of surge-type glaciers in subregions varies from the most to the least as follows: Karakoram (209 glaciers), Pamir Plateau (164 glaciers), Kunlun Mountains (112 glaciers), Tien Shan Mountains (74 glaciers), Inner Tibetan Plateau (58 glaciers), Hindu Kush (18 glaciers), Himalaya region (15 glaciers), and Nyainqentanglha Mountains (2 glaciers). Surge-type glaciers show an obvious spatial clustering, primarily concentrating in the northwest mountains of the HMA (Karakoram, Pamir Plateau, and Kunlun Mountains). A similar spatial clustering in the northwest and inner areas is also shown within the Tien Shan Mountains, Pamir Plateau, Karakoram, Kunlun Mountains, and Hindu Kush subregions. Surge-type glaciers in HMA are predominantly medium to large size, with the majority (520 glaciers, 80% by count) falling within the range of 2–50 km2 in area (Figure 3 in the upper right corner). Most of the surge-type glaciers belong to the size class of 10∼50 km2. The smallest size of surge-type glaciers is 0.04 km2, and there are 59 surge-type glaciers smaller than 2 km2.
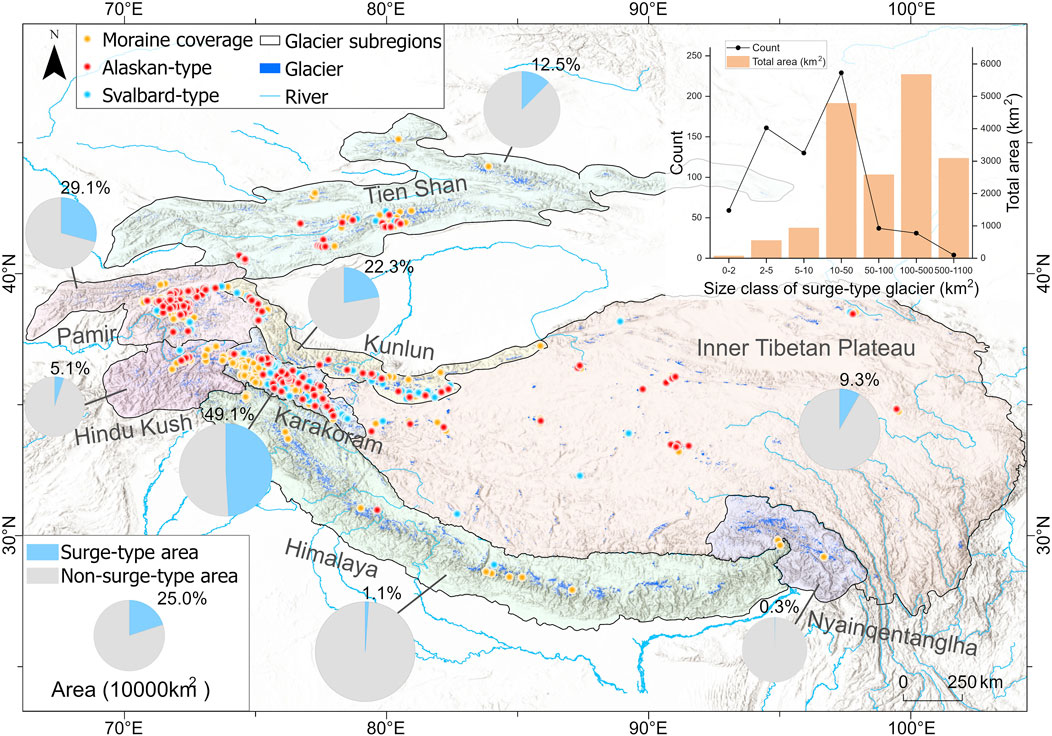
Figure 3. The spatial distribution of surge-type glaciers in HMA. The percentage of surge-type glaciers (by area) is shown in the pie chart with the area proportional to the total glacierized area in the region. “Moraine coverage” means the glacier terminus is fully covered by moraines and cannot be directly mapped from optical imagery.
The comparison of the surge-type glaciers (652) and non-surge-type glaciers (131,044) in HMA in terms of mean elevation, aspect, slope, and length is shown in Figure 4. The statistics reveal that compared to non-surge-type glaciers, surge-type glaciers predominantly occur at relatively higher elevations ranging from 4,000 to 6,000 m, with an average elevation of 5,098 m (Figure 4A). Surge-type glaciers cover a large elevation range, with 83% of them having elevation range exceeding 1,000 m (Figure 4B). Both the surge-type and non-surge-type glaciers favor the north and northeast aspect (40% of the total facing the north (Figure 4C)). Particularly, surge-type glaciers tend to have gentler slopes and longer glacier tongues (Figures 4D–F) than the non-surge-type glaciers. The median slope of surge-type glaciers is 21°, considerably lower than that of non-surge glaciers (29°). The average area and length of surge-type glaciers are 27.17 km2 and 9.26 km. Additionally, the analysis of geometric and topographic features of surge-type glaciers aligns with global surge-type glacier characteristics, supporting that longer glaciers with gentler slopes are more likely to undergo surge, and consistent with the enthalpy balance theory in predicting surge-type glacier formation (Sevestre and Benn, 2015; Benn et al., 2019).
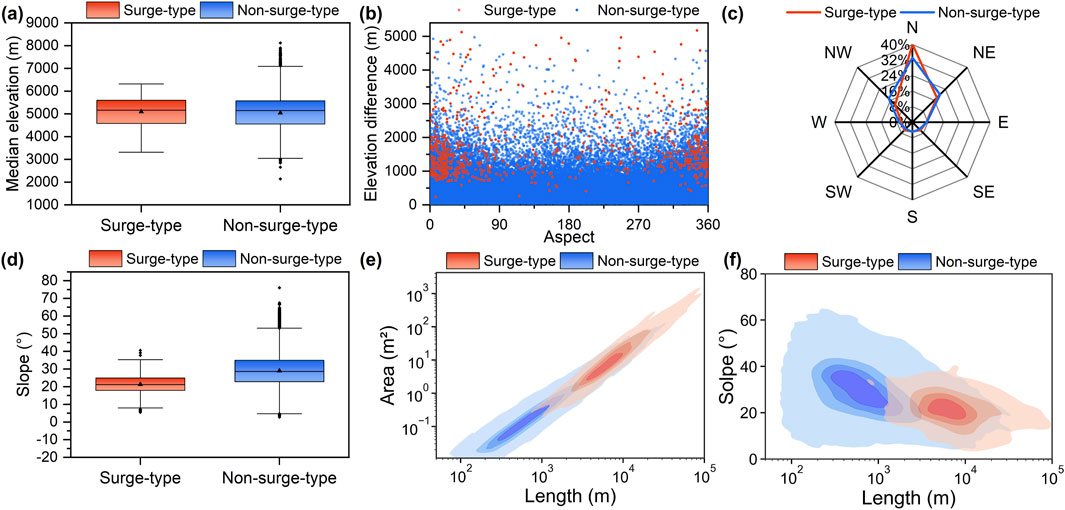
Figure 4. Comparison of surge-type and non-surge-type glaciers in HMA. (A) Median elevation, (B) elevation range, (C) aspect, (D) slope and (E, F) size features.
4.2 The characteristics of glacier surge
We mapped the terminus changes of 328 surge-type glaciers with clean or partial moraine coverage and extracted relevant key surge parameters (active period, terminus advance distance, terminus advance rate, and surging pattern). From these 328-time series of terminus changes, we determined 337 occurrences of surge events, which means 9 glaciers experienced two surge events during the study period. This enables the determination of the reoccurrence interval for the 9 glaciers which are mostly distributed in Pamir and Kunlun. The surges over the 9 glaciers are typical Alaska-type surges lasting 2–5 years with a reoccurrence interval of ∼10 years. Examples of multiple surge events are shown in Figure 5.

Figure 5. Multiple surging events during 2000 and 2020 on the same glacier. For these glaciers, the reoccurrence period seems to be ∼10 years. (Active phase information: Left: 2006–2009, 2016–2018; Middle: 2003–2005, 2013–2015; Right: 2000–2005, 2015–2017).
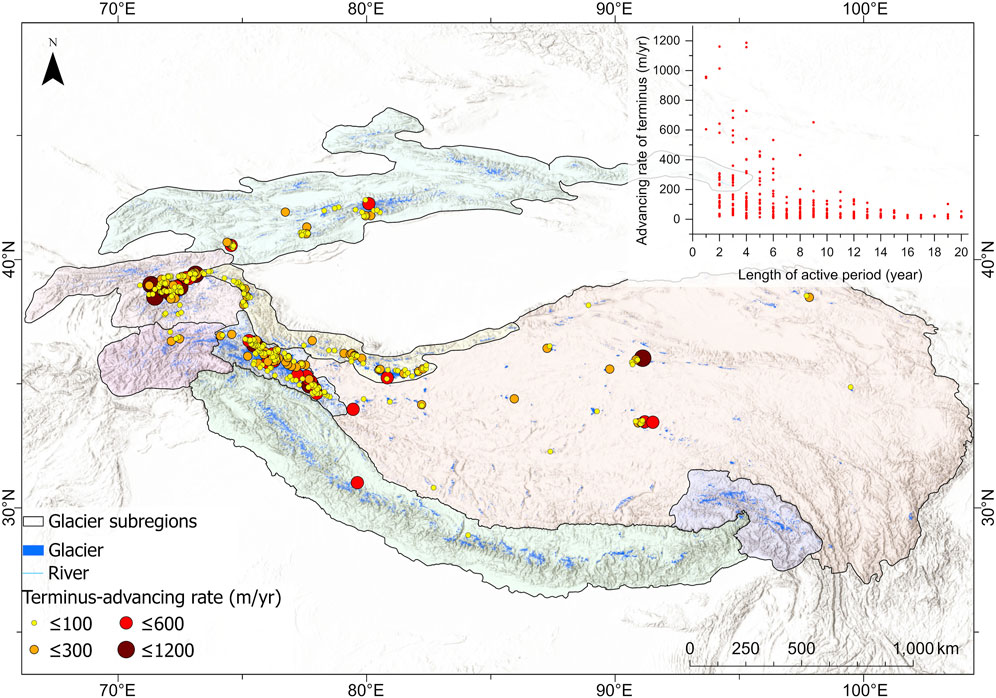
The distribution of surge-type glaciers in the study region shows a heavy-tailed pattern for both the length of the active period and the advance distance of the terminus (Figure 6). Note that there are 46 surges with end years later than 2020 and 66 surges with onset years likely before 2000 (Figure 6A). We marked these special cases in the datasets. The start years of glacier surges concentrate between 2000 and 2008 while most glacier surges terminated between 2008 and 2016 (Figure 6A). Excluding the 111 events with uncertain start/end year, the length of the active phase ranges from 1 to 20 years, with peaks around 3 years and a median value of 6 years (Figure 6B). Particularly, one glacier (GLIMS ID: G079438E35908N) kept advance at 14.5 m/a during the study period, demonstrating an active period of longer than 20 years. Most of the long-lasting surges (≥10 years) concentrate in the Karakoram and Kunlun regions, while surges in other regions mostly lasted around 1–4 years. The terminus advance distances (excluding the 111 cases) were mostly below 1,000 m, with a median value of 387 m and a maximum of 5,864 m. Fast glacier surge (terminus advance rates ≥600 m/a) activities were mainly distributed in the Karakoram, Pamir, and the Inner Tibetan Plateau (Figure 7). Overall, the advancing rates exhibit a power-law distribution with the length of active period, exponential decreasing with lasting active period (Figure 7).

Figure 6. The length of the active periods and terminus-advancing distances of surge-type glaciers in HMA. (A) Statistics of the surge start and end time, (B) distribution of the length of the active periods, (C) distribution of the terminus-advancing distance. Glacier surges with the start year before 2000 or the end year later than 2020 were excluded in the statistics of (B, C).
A total of 178 Alaska-type surges and 159 Svalbard-type surges were identified in HMA in recent decades (Figure 3). Significant differences were observed in the length of active periods, terminus-advancing distance, and terminus-advancing rate between different surging patterns (Figure 8, excluding the 111 cases with uncertain start/end year in the study period). The average length of the active period of Alaska-type glaciers (4 years) is markedly shorter than that of Svalbard-type glaciers (10 years). The active periods of Alaska-type glaciers mainly lasted between 2 and 6 years, while the majority of Svalbard surge-type glaciers surged over 7 years. The Alaska-type surges show a median advancing distance of 531 m and a median rate of 117 m/a, higher than that of Svalbard-type surges (197 m, and 23 m/a, respectively). Compared with Svalbard-type surges, Alaska-type surges exhibited faster terminus advances over shorter periods.

Figure 8. Comparison of the length of active period, terminus-advancing distances and terminus-advancing rates between the two types of surging. (A) The distribution of the length of the active period; (B) The distribution of the terminus-advancing distance.
4.3 The mass balance of surge-type and non-surge-type glaciers
During 2000–2019, glaciers in HMA generally experienced mass loss, with a mean mass balance of −0.18 ± 0.05 m w.e.a−1. There is significant spatial heterogeneity in the mass balance across different subregions. Specifically, the most negative mass balances were observed in the Nyainqentanglha Mountains (−0.57 ± 0.08 m w.e.a−1), followed by the Himalaya region (−0.30 ± 0.05 m w.e.a−1), Tien Shan Mountains (−0.27 ± 0.06 m w.e.a−1), and Inner Tibetan Plateau (−0.22 ± 0.05 m w.e.a−1). Mild mass loss was observed in Pamir (−0.09 ± 0.05 m w.e.a−1) and Hindu Kush (−0.11 ± 0.06 m w.e.a−1). The Karakoram and Kunlun Mountains, however, exhibit ‘anomalous’ mass balances, with slightly negative (−0.04 ± 0.06 m w.e.a−1) and positive (0.09 ± 0.05 m w.e.a−1) balance, respectively. The two regions coincide with the relatively high concentration of surge-type glaciers. There is a significant difference in glacier mass balance between the two periods of 2000–2009 and 2010–2019, with a notable increase in mass loss rate in the latter decade (2010–2019), indicating accelerated glacier melting across all regions (Table 2). Regions including the Kunlun Mountains, Pamir, and Karakoram had ceased glacier mass gain or even showed mild mass loss during 2010–2019.
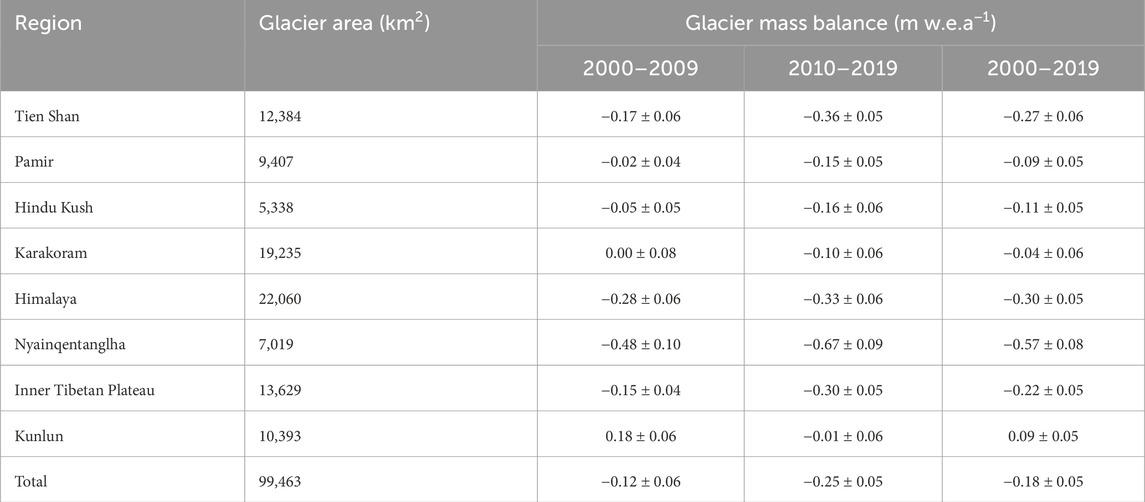
Table 2. Region-wide mean glacier mass balance in HMA. The glacierized areas are calculated from the RGI 7.0 glacier inventory. All glaciers are included in the estimation.
The mass balance of surge-type and non-surge-type glaciers in HMA are statistically different during the study period (2000–2019) (Figure 9). For the whole region, surge-type glaciers exhibited slight mass gain (0.04 m w.e.a−1) on average and mainly less than 0.2 m w.e.a−1, whereas non-surge-type glaciers were in a deficit state (−0.18 m w.e.a−1), mostly lower than −0.2 m w.e.a−1. However, this contrast is not consistent within different subregions (Figure 10). In the northwest and inner regions such as Karakoram, Pamir and Kunlun Mountains where surge-type glaciers concentrate and glacier mass loss was not intense, surge-type glaciers show comparable or slightly higher loss or less mass gain compared to non-surge-type glaciers. In contrast, in the peripheral mountains including the Tien Shan Mountains and Himalaya region where glacier mass loss was mild to moderate, surge-type glaciers exhibited lower loss than non-surge-type glaciers. However, the number of surge-type samples is very limited in these regions.
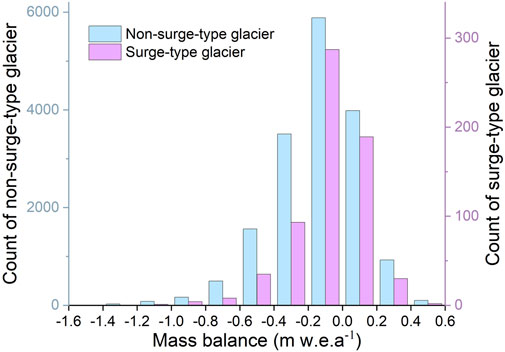
Figure 9. The distribution of glacier-wide mass balance (2000–2019) of surge-type and non-surge-type glaciers in HMA.
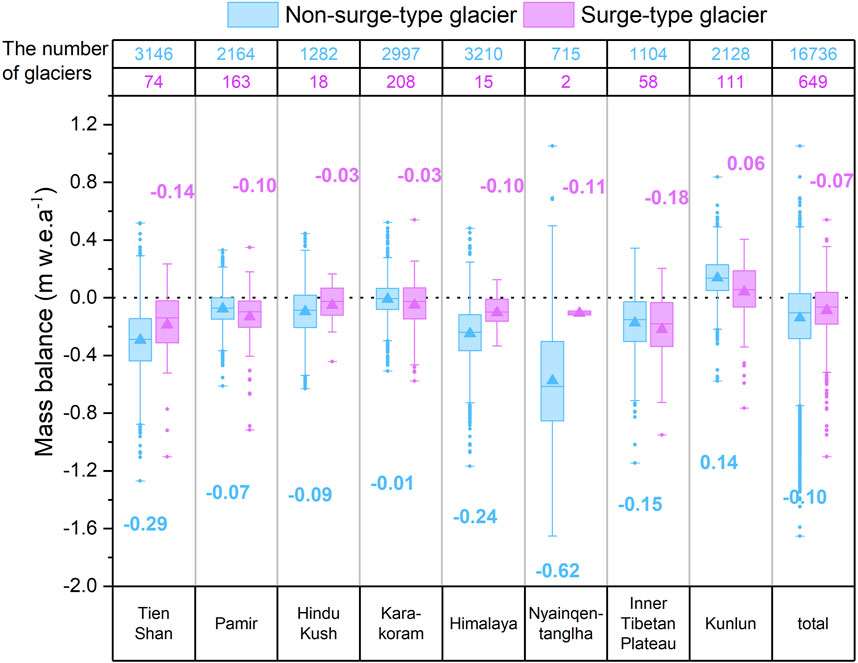
Figure 10. Mass balance (2000–2019) of surge-type and non-surge-type glaciers in different regions of HMA (mean value is marked with triangles and the median values are noted with texts).
Compared to non-surge-type glaciers, the mass balance of surge-type glaciers before and after surges reflects the impact of glacier surging on glacier melting. We computed the mass balance of 44 surge-type glaciers with a complete surging phase in the observation period of the dh/dt datasets, namely the surging events that occurred between 2005 and 2015. For most surge-type glaciers (29 out of 44), the mass balances during the post-surge period were more negative than that in the active period or the pre-surge period, which means surging activities accelerated glacier melting, resulting in faster mass loss or less mass gain (Figure 11). This is probably because when glaciers surge occurs, a large amount of glacier mass was transferred from the upper or middle reaches to the lower reaches (glacier terminus), leading to faster glacier melting at these lower altitudes. However, there are surge-type glaciers (15) where the mass balance increases or tends to stabilize after the surge. In other words, accelerated glacier mass loss was not observed over these glaciers after surging (Figure 12). By analyzing the terminus changes of these glaciers, we found different behavior in the length/area changes after the surge. For glaciers where the surge accelerated melting, the length of the glacier gradually decreases after the surge. In contrast, for glaciers that surge with no significant impact on mass loss, the location of the terminus remains stable after the surge. The positive glacier mass balance in the post-surge period indicates that there was probably ice accumulation in the high-altitude upper stream which sustained stable downstream. Such phenomenon is possibly due to glacier internal structure, and special climate conditions. The ongoing glacier mass gain may also imply another surge activity may follow.
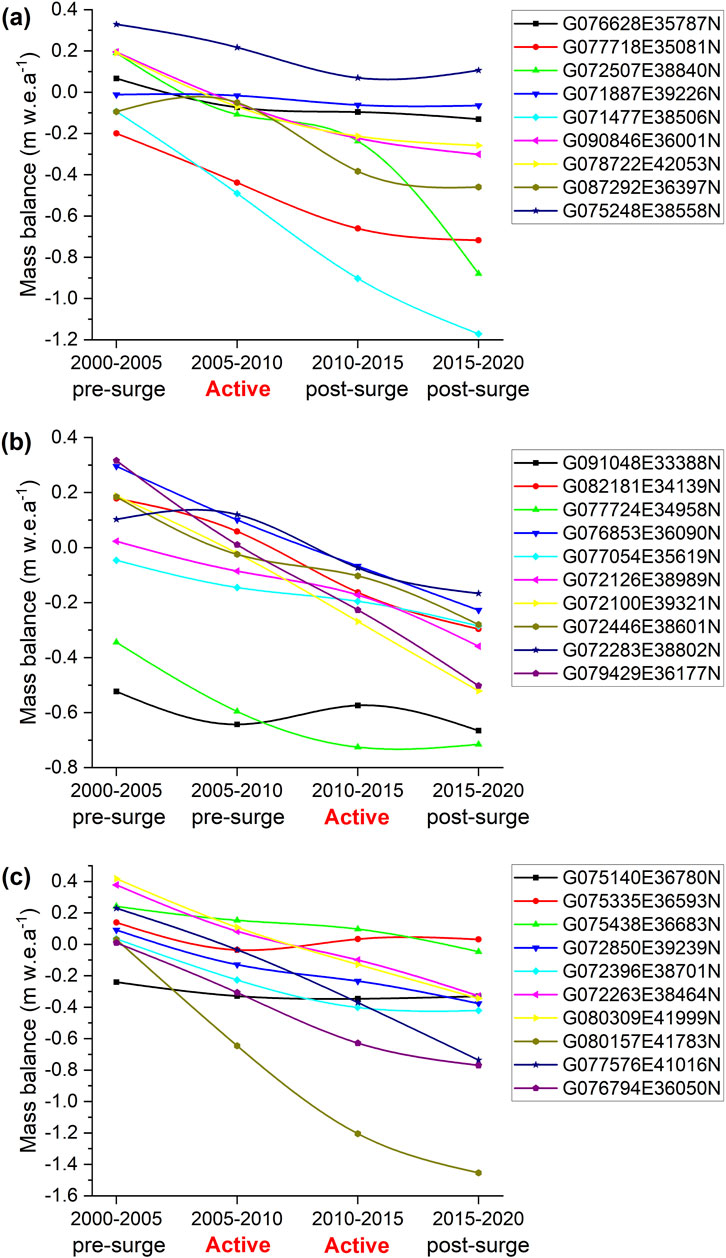
Figure 11. Mass balance of surge-type glaciers during different periods. All glaciers in this group show more negative glacier mass balance in the post-surge period than that in the pre-surge or active period. (A) Glacier surges with active period between 2005 and 2010; (B) Glacier surges with active period between 2010 and 2015; (C) Glacier surges with active period between 2005 and 2015.
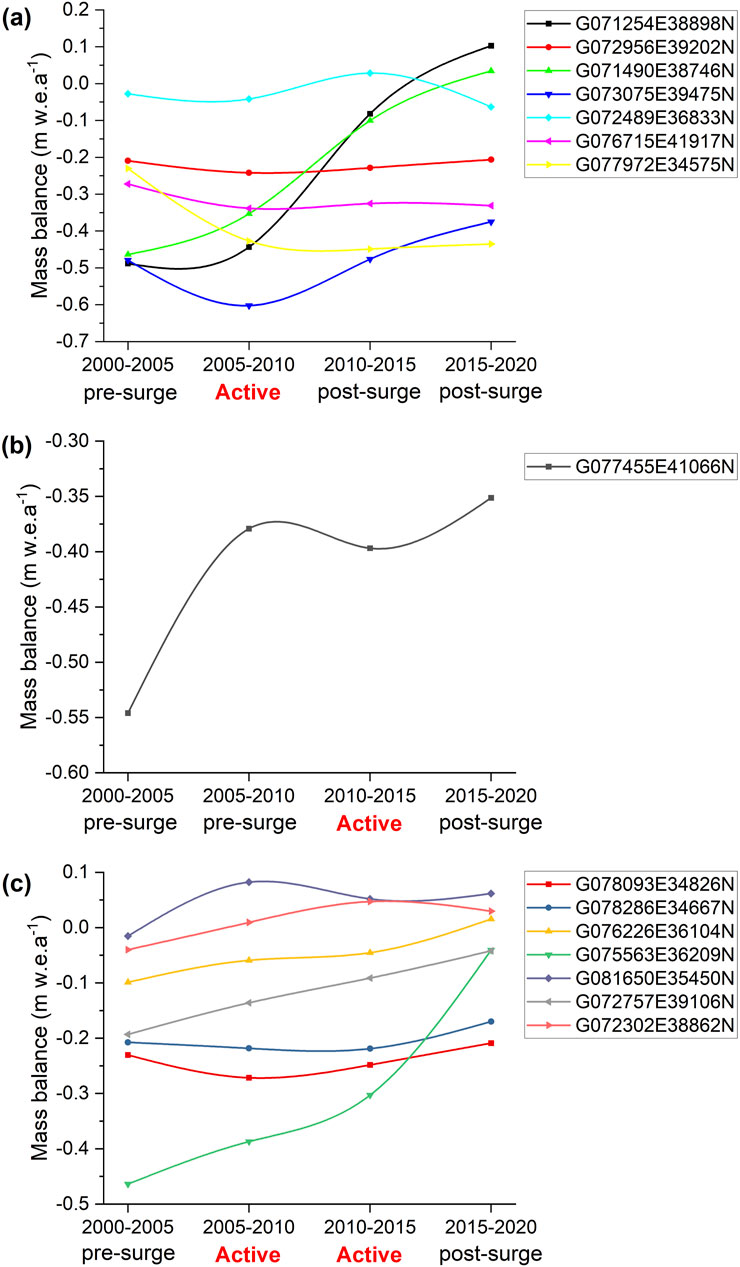
Figure 12. Mass balance of surge-type glaciers during different periods. (A) Glacier surges with active period between 2005 and 2010; (B) Glacier surges with active period between 2010 and 2015; (C) Glacier surges with active period between 2005 and 2015.
5 Discussion
Compared to the inventory of Guillet et al. (2022) in RGI 6.0, our inventory includes 21 new surge-type glaciers. The occurrence of surging of these glaciers was confirmed from the dh/dt maps and partly from the terminus changes mapped from Landsat imagery, as exemplified in Figure 13. The glacier (GLIMS ID: G076262E35930N) showed a 5-year (2004–2008) terminus advance (Figure 13B), with obvious thickening on the tongue (Figures 13A, B). On the other hand, there are 29 surge-type glaciers in Guillet et al. (2022) that are not included in our inventory, as we were not able to confirm the occurrences of surging between 2000 and 2020. Note that these glaciers can be surge-type glaciers that were in the quiescence phase during the study period. Different from the previous inventory of surge-type glaciers that consider all signs of surging, we only included surge glaciers that likely show active phases during the study period. Due to cloud cover, seasonal snow cover, and the temporal resolution of Landsat imagery, our determination of the active phase for clean or partly moraine-covered glacier tongues only reaches the yearly scale. High-resolution velocity mapping from radar or multi-source images is needed to confirm the exact initiation and termination dates of glacier surges. Another limitation of the terminus change method lies in the detection of internal surges that occurred in the tributaries of the glacier and led to no front advance (e.g., Bhambri et al., 2017; Shangguan et al., 2016). Additionally, small surge-type glaciers are not well represented in current glacier inventories, which requires fine-resolution images for velocity or thickness change mapping.
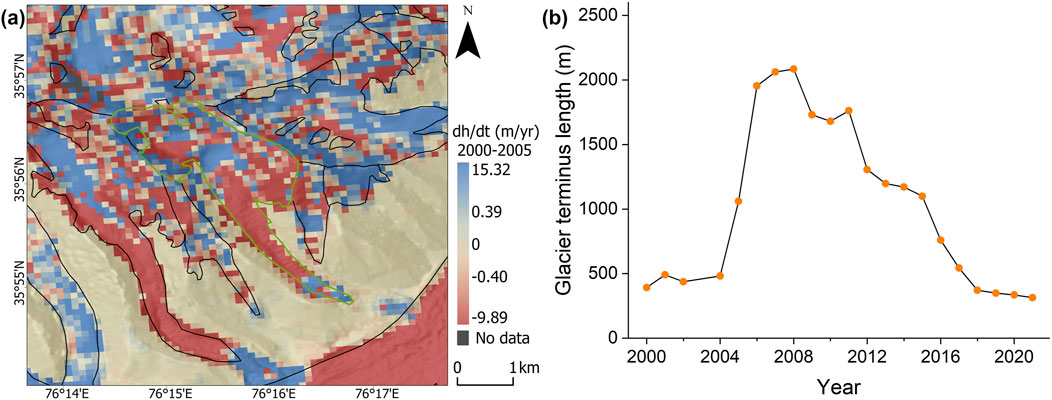
Figure 13. Glacier surge (GLIMS ID: G076262E35930N, outlined in green) confirmed from the dh/dt map (A) and the time series of terminus change (B).
Previous studies of glacier-wide mass balance of surge-type and non-surge-type glaciers reported no major difference between the two types (Gardelle et al., 2013) and surge-type glaciers were concentrated towards more negative mass balance compared to that of non-surge-type (Guillet et al., 2022). In this comparison, we excluded small-size non-surge-type glaciers to mitigate the size effect and found likely different tendencies in the peripheral mountains where mass loss has been relatively faster. Additionally, accelerated melting in the post-surge period was found over a large proportion of investigated surge-type glaciers. Note that the elevation change data provided by Hugonnet et al. (2021) applied the Gaussian Process Regression for smoothing, which could distort surge signals and result in uncertainties in the estimated individual glacier mass budget for surge-type glaciers. Additionally, the multi-temporal DEMs datasets we applied here have a temporal resolution of several years, which limited the quantification of surge events and the impact on glacier mass budgets. To better capture the mass transfer in the active phase and mass melting in the post-surge period, high temporal resolution DEMs such as those from the Pléiades optical satellites and ASTER offer the potential to enrich the understanding of surging processes and the dynamics at fine temporal resolutions (Béraud et al., 2023; Béraud et al., 2024).
The binary classification of the Alaska-type and Svalbard-type glaciers here is used to represent distinct types of surging behaviors rather than the underlying mechanisms. The Alaska-type is relatively more abrupt, drastic and short-lived than the Svalbard-type surge. Our classification is therefore not the same as previous studies (Quincey et al., 2011; 2015; Yasuda and Furuya, 2015) in which different classifications are proposed to examine the thermal or surge control theory. Recent studies propose universal models for explaining the glacier surging behavior (Terleth et al., 2021; Benn et al., 2019; Benn et al., 2022). According to these theories, glacier surges are essentially velocity dynamics determined by basal conditions and hydrological and thermal subglacial processes modulated with the measure of enthalpy. Previous studies (Bhambri et al., 2017; Guillet et al., 2022; Quincey et al., 2015) and our results confirm obvious spatial clustering but high variability (heavy-tailed distributions) of surge-type glaciers in terms of geometrical features, and surge dynamics including the length of the active period and the magnitudes of the surging, which is in line with the implications of the enthalpy-balance theory. We confirm the high concentration of surging events in the past decades in the northwest HMA and likely different surge behaviors between different regions. With the ongoing acceleration of mass loss associated with climate change, the behavior of surge-type glaciers and surge events need to be traced for an in-depth perspective of the relationship between surge and climate.
6 Conclusion
This study provides a systemic analysis of surge-type glaciers and glacier surging activities in HMA between 2000 and 2020 based on an updated inventory of surge-type glaciers, the time-series Landsat images, and glacier surface elevation change data, thereby supplementing and improving the current understanding of glacier surges in HMA. We conducted exploratory analyses on the spatiotemporal distribution, geometric and topographic characteristics, details of the surging activities, and mass balance of these glaciers. Between 2000 and 2020, a total of 652 surge-type glaciers were identified in the region, mainly concentrated in the Karakoram, Kunlun Mountains, and Pamir Plateau. These glaciers are mostly of medium to large size, with long glacier tongues and gentle slopes. We mapped the terminus changes of 328 surge-type glaciers with clean or partial moraine coverage, revealing the occurrence of 337 glacier surges between 2000 and 2020. Both the active period and advance distance of the terminus exhibit heavy-tailed distribution, with a median value of 6 years and 387 m respectively. A total of 178 Alaska-type surges and 159 Svalbard-type surges were identified in HMA in the study period. During the 21st century, the overall glacier mass balance in HMA has been generally negative and accelerated. Whereas the northwestern areas where surge-type glaciers mostly concentrate (e.g., the Karakoram and western Kunlun) experienced a balanced or slightly positive glacier mass budget. Glacier-wide mass balance of surge-type glaciers tends to be biased toward more negative in these northwest regions, whereas the situation seems to be on the contrary in peripheral mountains (e.g., Tien Shan) where mass loss has been faster than in other regions. However, the number of surge-type glaciers in these peripheral mountains is very limited. The updated surge-type glacier inventory and related glacier surge information in this study provide a basis for future surge-related hazard monitoring as well as detailed studies of the surging mechanism and its relation to climate change. The evolution of glacier mass transfer and the effect of surges on glacier mass budgets require further examination with high spatial and temporal DEM datasets.
Data availability statement
The raw data supporting the conclusions of this article will be made available by the authors, without undue reservation.
Author contributions
LK: Conceptualization, Funding acquisition, Investigation, Project administration, Supervision, Validation, Writing–original draft, Writing–review and editing. RW: Data curation, Formal Analysis, Investigation, Validation, Visualization, Writing–original draft, Writing–review and editing. JZ: Data curation, Formal Analysis, Methodology, Visualization, Writing–original draft. XD: Validation, Visualization, Writing–review and editing.
Funding
The author(s) declare that financial support was received for the research, authorship, and/or publication of this article. This research was funded by the National Natural Science Foundation of China (Grant No. 42371394) and the Fundamental Research Funds for the Central Universities (B230201031).
Acknowledgments
The authors are grateful to the National Aeronautics and Space Administration (NASA)/the U.S. Geological Survey (USGS) for the free access to Landsat imagery, and the RGI for the glacier inventory.
Conflict of interest
The authors declare that the research was conducted in the absence of any commercial or financial relationships that could be construed as a potential conflict of interest.
Publisher’s note
All claims expressed in this article are solely those of the authors and do not necessarily represent those of their affiliated organizations, or those of the publisher, the editors and the reviewers. Any product that may be evaluated in this article, or claim that may be made by its manufacturer, is not guaranteed or endorsed by the publisher.
References
Barrand, N. E., and Murray, T. (2006). Multivariate controls on the incidence of glacier surging in the Karakoram Himalaya. Arct. Antarct. Alp. Res. 38 (4), 489–498. doi:10.1657/1523-0430(2006)38[489:mcotio]2.0.co;2
Benn, D. I., Fowler, A. C., Hewitt, I., and Sevestre, H. (2019). A general theory of glacier surges. J. Glaciol. 65 (253), 701–716. doi:10.1017/jog.2019.62
Benn, D. I., Hewitt, I. J., and Luckman, A. J. (2022). Enthalpy balance theory unifies diverse glacier surge behaviour. Ann. Glaciol. 63, 88–94. doi:10.1017/aog.2023.23
Béraud, L., Brun, F., Dehecq, A., Charrier, L., and Hugonnet, R. (2024). An improved dataset of ASTER elevation time series in High Mountain Asia to study surge dynamics. EGU General Assem., EGU24–19324. doi:10.5194/egusphere-egu24-19324
Béraud, L., Cusicanqui, D., Rabatel, A., Brun, F., Vincent, C., and Six, D. (2023). Glacier-wide seasonal and annual geodetic mass balances from Pléiades stereo images: application to the Glacier d'Argentière, French Alps. Alps. J. Glaciol. 69, 525–537. doi:10.1017/jog.2022.79
Berthier, E., and Brun, F. (2019). Karakoram geodetic glacier mass balances between 2008 and 2016: persistence of the anomaly and influence of a large rock avalanche on Siachen Glacier. J. Glaciol. 65 (251), 494–507. doi:10.1017/jog.2019.32
Bevington, A. R., and Menounos, B. (2022). Accelerated change in the glaciated environments of western Canada revealed through trend analysis of optical satellite imagery. Remote Sens. Environ. 270, 112862. doi:10.1016/j.rse.2021.112862
Bhambri, R., Hewitt, K., Kawishwar, P., Kumar, A., Verma, A., Snehmani, , et al. (2019). Ice-dams, outburst floods, and movement heterogeneity of glaciers, Karakoram. Glob. Planet. Change 180, 100–116. doi:10.1016/j.gloplacha.2019.05.004
Bhambri, R., Hewitt, K., Kawishwar, P., and Pratap, B. (2017). Surge-type and surge-modified glaciers in the Karakoram. Sci. Rep. 7, 15391. doi:10.1038/s41598-017-15473-8
Bhambri, R., Watson, C. S., Hewitt, K., Haritashya, U. K., Kargel, J. S., Shahi, A. P., et al. (2020). The hazardous 2017-2019 surge and river damming by Shispare Glacier, Karakoram. Sci. Rep. 10 (1), 4685. doi:10.1038/s41598-020-61277-8
Brun, F., Berthier, E., Wagnon, P., Kaab, A., and Treichler, D. (2017). A spatially resolved estimate of High Mountain Asia glacier mass balances from 2000 to 2016. Nat. Geosci. 10 (9), 668–673. doi:10.1038/NGEO2999
Dehecq, A., Gourmelen, N., Gardner, A. S., Brun, F., Goldberg, D., Nienow, P. W., et al. (2019). Twenty-first century glacier slowdown driven by mass loss in High Mountain Asia. Nat. Geosci. 12 (1), 22–27. doi:10.1038/s41561-018-0271-9
Farinotti, D., Immerzeel, W. W., de Kok, R. J., Quincey, D. J., and Dehecq, A. (2020). Manifestations and mechanisms of the Karakoram glacier anomaly. Nat. Geosci. 13 (1), 8–16. doi:10.1038/s41561-019-0513-5
Gardelle, J., Berthier, E., Arnaud, Y., and Kaab, A. (2013). Region-wide glacier mass balances over the Pamir-Karakoram-Himalaya during 1999-2011. Cryosphere 7 (4), 1263–1286. doi:10.5194/tc-7-1263-2013
Goerlich, F., Bolch, T., and Paul, F. (2020). More dynamic than expected: an updated survey of surging glaciers in the Pamir. Earth Syst. Sci. Data 12 (4), 3161–3176. doi:10.5194/essd-12-3161-2020
Grant, K. L., Stokes, C. R., and Evans, I. S. (2009). Identification and characteristics of surge-type glaciers on novaya zemlya, Russian arctic. J. Glaciol. 55 (194), 960–972. doi:10.3189/002214309790794940
Guillet, G., King, O., Lv, M., Ghuffar, S., Benn, D., Quincey, D., et al. (2022). A regionally resolved inventory of High Mountain Asia surge-type glaciers, derived from a multi-factor remote sensing approach. Cryosphere 16 (2), 603–623. doi:10.5194/tc-16-603-2022
Guo, L., Li, J., Dehecq, A., Li, Z., Li, X., and Zhu, J. (2023). A new inventory of High Mountain Asia surging glaciers derived from multiple elevation datasets since the 1970s. Earth Syst. Sci. Data 15 (7), 2841–2861. doi:10.5194/essd-15-2841-2023
Heid, T., and Kääb, A. (2012). Repeat optical satellite images reveal widespread and long term decrease in land-terminating glacier speeds. CRYOSPHERE 6 (2), 467–478. doi:10.5194/tc-6-467-2012
Hewitt, K. (2005). The Karakoram anomaly? Glacier expansion and the ‘elevation effect,’ Karakoram Himalaya. Mt. Res. Dev. 25 (4), 332–340. doi:10.1659/0276-4741(2005)025[0332:TKAGEA]2.0.CO;2
Hewitt, K. (2011). Glacier surges in the Karakoram Himalaya (central Asia). Can. J. Earth Sci. 6, 1009–1018. doi:10.1139/e69-106
Hewitt, K., and Liu, J. (2010). Ice-dammed lakes and outburst floods, Karakoram Himalaya: historical perspectives on emerging threats. Phys. Geogr. 31 (6), 528–551. doi:10.2747/0272-3646.31.6.528
Hugonnet, R., McNabb, R., Berthier, E., Menounos, B., Nuth, C., Girod, L., et al. (2021). Accelerated global glacier mass loss in the early twenty-first century. Nature 592 (7856), 726–731. doi:10.1038/s41586-021-03436-z
Huss, M. (2013). Density assumptions for converting geodetic glacier volume change to mass change. CRYOSPHERE 7 (3), 877–887. doi:10.5194/tc-7-877-2013
Jamieson, S. S. R., Ewertowski, M. W., and Evans, D. J. A. (2015). Rapid advance of two mountain glaciers in response to mine-related debris loading. J. Geophys. Res. Earth Surf. 120 (7), 1418–1435. doi:10.1002/2015JF003504
Ji, X., Chen, Y.-f., Luo, X., and Li, Y.-g. (2018). Study on the identification method of glacier in mountain shadows based on Landsat 8 OLI image. Spectrosc. Spectr. Analysis 38 (12), 3857–3863. doi:10.3964/j.issn.1000-0593(2018)12-3857-07
Jiang, Z., Wang, L., Zhang, Z., Liu, S., Zhang, Y., Tang, Z., et al. (2020). Surface elevation changes of yengisogat glacier between 2000 and 2014. Arid. Land Geogr. 43 (1), 12–19. doi:10.12118/j.issn.1000-6060.2020.01.02
Jiskoot, H., Murray, T., and Boyle, P. (2000). Controls on the distribution of surge-type glaciers in Svalbard. J. Glaciol. 46 (154), 412–422. doi:10.3189/172756500781833115
Kääb, A., Leinss, S., Gilbert, A., Buhler, Y., Gascoin, S., Evans, S. G., et al. (2018). Massive collapse of two glaciers in western Tibet in 2016 after surge-like instability. Nat. Geosci. 11 (2), 114–120. doi:10.1038/s41561-017-0039-7
Ke, L., Song, C., Yong, B., Lei, Y., and Ding, X. (2020). Which heterogeneous glacier melting patterns can be robustly observed from space? A multi-scale assessment in southeastern Tibetan Plateau. Remote Sens. Environ. 242, 111777. doi:10.1016/j.rse.2020.111777
Ke, L., Zhang, J., Fan, C., Zhou, J., and Song, C. (2022). Large-scale monitoring of Glacier Surges by integrating high-temporal- and -Spatial-Resolution satellite observations: a case study in the Karakoram. Remote Sens. 14 (18), 4668. doi:10.3390/rs14184668
King, O., Bhattacharya, A., and Bolch, T. (2021). The presence and influence of glacier surging around the Geladandong ice caps, North East Tibetan Plateau. Adv. Clim. Change Res. 12 (3), 299–312. doi:10.1016/j.accre.2021.05.001
Kraaijenbrink, P. D. A., Bierkens, M. F. P., Lutz, A. F., and Immerzeel, W. W. (2017). Impact of a global temperature rise of 1.5 degrees Celsius on Asia’s glaciers. Nature 549 (7671), 257–260. doi:10.1038/nature23878
Lv, M., Guo, H., Yan, S., Li, G., Jiang, D., Zhang, H., et al. (2022). A dataset of surge-type glaciers in the High Mountain Asia based on elevation change and satellite imagery. China Sci. Data 7 (2). doi:10.11922/11-6035.ncdc.2021.0006.zh
Meier, M., and Post, A. (2011). What are glacier surges? Can. J. Earth Sci. 6, 807–817. doi:10.1139/e69-081
Molg, N., Bolch, T., Rastner, P., Strozzi, T., and Paul, F. (2018). A consistent glacier inventory for Karakoram and Pamir derived from Landsat data: distribution of debris cover and mapping challenges. Earth Syst. Sci. Data 10 (4), 1807–1827. doi:10.5194/essd-10-1807-2018
Nuth, C., Kohler, J., König, M., von Deschwanden, A., Hagen, J. O., Kääb, A., et al. (2013). Decadal changes from a multi-temporal glacier inventory of Svalbard. CRYOSPHERE 7 (5), 1603–1621. doi:10.5194/tc-7-1603-2013
Paul, F. (2015). Revealing glacier flow and surge dynamics from animated satellite image sequences: examples from the Karakoram. Cryosphere 9 (6), 2201–2214. doi:10.5194/tc-9-2201-2015
Paul, F., Strozzi, T., Schellenberger, T., and Kaab, A. (2017). The 2015 surge of hispar glacier in the Karakoram. Remote Sens. 9 (9), 888. doi:10.3390/rs9090888
Pfeffer, W. T., Arendt, A. A., Bliss, A., Bolch, T., Cogley, J. G., Gardner, A. S., et al. (2014). The Randolph Glacier Inventory: a globally complete inventory of glaciers. J. Glaciol. 60 (221), 537–552. doi:10.3189/2014JoG13J176
Qin, D., Yao, T., Ding, Y., and Ren, J. (2020). Establishment and significance of the scientific system of cryospheric science. Bull. Chin. Acad. Sci. 35 (4), 394–406. doi:10.16418/j.issn.1000-3045.20200331001
Quincey, D., Braun, M., Glasser, N., Bishop, M., Hewitt, K., and Luckman, A. (2011). Karakoram glacier surge dynamics. Geophys. Res. Lett. 38. doi:10.1029/2011gl049004
Quincey, D. J., Glasser, N. F., Cook, S. J., and Luckman, A. (2015). Heterogeneity in Karakoram glacier surges. J. Geophys. Res. Earth Surf. 120 (7), 1288–1300. doi:10.1002/2015JF003515
Rankl, M., Kienholz, C., and Braun, M. (2014). Glacier changes in the Karakoram region mapped by multimission satellite imagery. Cryosphere 8, 977–989. doi:10.5194/tc-8-977-2014
Raymond, C. F. (1987). How do glaciers surge? A review. J. Geophys. Res. Solid Earth 92 (B9), 9121–9134. doi:10.1029/JB092iB09p09121
RGI 7.0 Consortium (2023). “Randolph Glacier inventory - a dataset of global glacier outlines, version 7.0. Boulder, Colorado USA. NSIDC: National Snow and Ice Data Center. doi:10.5067/f6jmovy5navz
Round, V., Leinss, S., Huss, M., Haemmig, C., and Hajnsek, I. (2017). Surge dynamics and lake outbursts of kyagar glacier, Karakoram. Cryosphere 11 (2), 723–739. doi:10.5194/tc-11-723-2017
Scherler, D., Wulf, H., and Gorelick, N. (2018). Global assessment of supraglacial debris-cover extents. Geophys. Res. Lett. 45 (21), 11798–11805. doi:10.1029/2018GL080158
Sevestre, H., and Benn, D. I. (2015). Climatic and geometric controls on the global distribution of surge-type glaciers: implications for a unifying model of surging. J. Glaciol. 61 (228), 646–662. doi:10.3189/2015JoG14J136
Shangguan, D., Liu, S., Ding, Y., Guo, W., Xu, B., Xu, J., et al. (2016). Characterizing the may 2015 karayaylak Glacier surge in the eastern Pamir Plateau using remote sensing. J. Glaciol. 62, 944–953. doi:10.1017/jog.2016.81
Terleth, Y., Pelt, W. J. J. V., Pohjola, V. A., and Pettersson, R. (2021). Complementary approaches towards a universal model of Glacier Surges. Front. Earth Sci. 9, 732962. doi:10.3389/feart.2021.732962
Vale, A. B., Arnold, N. S., Rees, W. G., and Lea, J. M. (2021). Remote detection of surge-related Glacier Terminus change across High Mountain Asia. Remote Sens. 13 (7), 1309. doi:10.3390/rs13071309
Yan, J., Lv, M., Ruan, Z., Yan, S., and Liu, G. (2019). Evolution of surge-type glaciers in the Yangtze river headwater using multi-source remote sensing data. Remote Sens. 11 (24), 2991. doi:10.3390/rs11242991
Yao, T., Bolch, T., Chen, D., Gao, J., Immerzeel, W., Piao, S., et al. (2022). The imbalance of the Asian water tower. Nat. Rev. Earth & Environ. 3 (10), 618–632. doi:10.1038/s43017-022-00299-4
Yao, T., Thompson, L., Yang, W., Yu, W., Gao, Y., Guo, X., et al. (2012). Different glacier status with atmospheric circulations in Tibetan Plateau and surroundings. Nat. Clim. Change 2 (9), 663–667. doi:10.1038/NCLIMATE1580
Yao, T., Yu, W., Wu, G., Xu, B., Yang, W., Zhao, H., et al. (2019). Glacier anomalies and relevant disaster risks on the Tibetan Plateau and surroundings. Chin. Sci. Bull. 64 (27), 2770–2782. doi:10.1360/tb-2019-0246
Yao, X., Zhou, S., Sun, M., Duan, H., and Zhang, Y. (2023). Surging glaciers in High Mountain Asia between 1986 and 2021. Remote Sens. 15 (18), 4595. doi:10.3390/rs15184595
Yasuda, T., and Furuya, M. (2015). Dynamics of surge-type glaciers in west Kunlun Shan, northwestern tibet. J. Geophys. Res. Earth Surf. 120 (11), 2393–2405. doi:10.1002/2015JF003511
Zemp, M., Frey, H., Gaertner-Roer, I., Nussbaumer, S. U., Hoelzle, M., Paul, F., et al. (2015). Historically unprecedented global glacier decline in the early 21st century. J. Glaciol. 61 (228), 745–762. doi:10.3189/2015JoG15J017
Zhang, Z., Liu, S., Wei, J., and Jiang, Z. (2018). Monitoring a glacier surge in the Kungey Mountain, eastern Pamir Plateau using remote sensing. Prog. Geogr. 37 (11), 1545–1554. doi:10.18306/dlkxjz.2018.11.010
Keywords: glacier surge, High Mountain Asia, glacier mass balance, Landsat, glacier hazards
Citation: Ke L, Wang R, Zhang J and Ding X (2024) Remote-sensing characterization of surging glaciers in High Mountain Asia in the past two decades. Front. Earth Sci. 12:1499882. doi: 10.3389/feart.2024.1499882
Received: 22 September 2024; Accepted: 06 December 2024;
Published: 19 December 2024.
Edited by:
Tobias Conradt, Potsdam Institute for Climate Impact Research (PIK), GermanyReviewed by:
Donghui Shangguan, Chinese Academy of Sciences (CAS), ChinaLuc Beraud, UMR5001 Institut des Géosciences de l’Environnement (IGE), France
Copyright © 2024 Ke, Wang, Zhang and Ding. This is an open-access article distributed under the terms of the Creative Commons Attribution License (CC BY). The use, distribution or reproduction in other forums is permitted, provided the original author(s) and the copyright owner(s) are credited and that the original publication in this journal is cited, in accordance with accepted academic practice. No use, distribution or reproduction is permitted which does not comply with these terms.
*Correspondence: Linghong Ke, a2VsaW5naG9uZ0BoaHUuZWR1LmNu
 Linghong Ke
 Ruizhe Wang
 Jinshan Zhang1,2
 Xin Ding