- 1Wuhan Center, China Geological Survey (Geosciences Innovation Center of Central South China), Wuhan, Hubei, China
- 2College of Civil Engineering and Architecture, China Three Gorges University, Yichang, Hubei, China
- 3Hubei Key Laboratory of Operation Safety of High Dam and Large Reservoir, Yichang, Hubei, China
- 4Faculty of Earth Resources, China University of Geosciences, Wuhan, China
- 5China Geological Environment Monitoring Institute, Beijing, China
- 6No. 208 Hydrogeology and Engineering Geology Team of Chongqing Bureau of Geology and Minerals Exploration, Chongqing, China
On 8 October 2017, persistent heavy rainfall triggered a rock collapse on Fenghuang Mountain in Wuxi Town, located within the Three Gorges Reservoir region of China. Subsequent field investigations and monitoring identified several potentially unstable rock masses in the area, posing a significant threat to the safety of nearby residents and their property. In this study,the Rapid Mass Movement Simulation (RAMMS) numerical tool was used to perform a back analysis of the rock collapse event. The well calibrated numerical model was then used to assess the risk of the potential unstable rock masses in the study area. The rock collapse on Fenghuang Mountain descended rapidly along the slope, with the dislodged material accumulating at the base and obstructing the road at the foot of the slope. Some debris breached the embankment and entered the Daning River. The computed maximum velocity during the rock collapse event was approximately 9.14 m/s, with an average maximum deposit thickness of around 4.48 m. The back-analysis of the rock collapse event closely aligns with the observed failure process and deposit morphology documented through field investigation. Using the well calibrated numerical model, a dynamic analysis was conducted on the potential unstable rock mass. The risk assessment indicates that the potential unstable rock mass is prone to instability, with a high likelihood of a subsequent rockfall under extreme rainfall conditions. The computed average maximum velocity for the potential rockfall is 33.83 m/s, with an average maximum deposit thickness of 2.20 m. The computed maximum impact pressure is about 164 kPa, which would result in significant damage to the road below. Additionally, a maximum wave height of 1.38 m from the surge caused by potential rockfall entering the Daning River was calculated by a semi-empirical model. This research offers a novel approach and methodology for assessing the risk of such hazardous events in similar geological setting globally.
1 Introduction
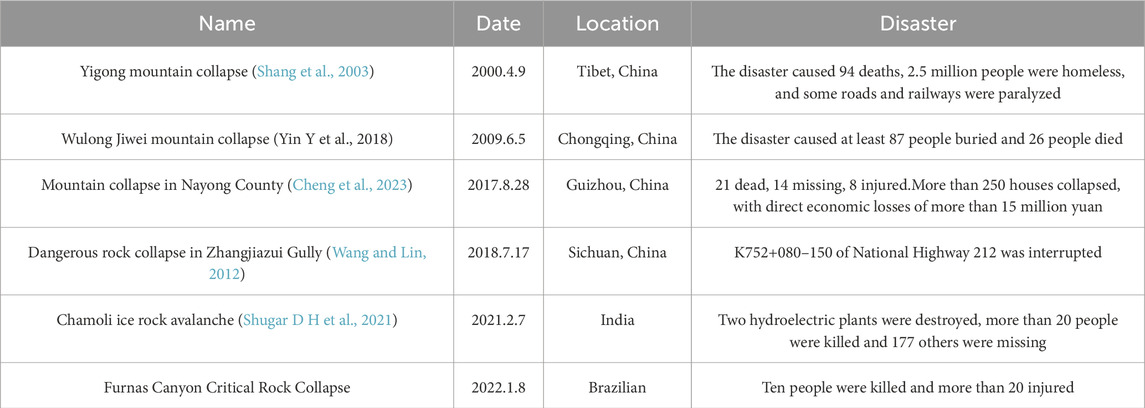
The collapse of dangerous rock masses is a common geological hazards in the mountainous areas of southwest China (Zhang et al., 2021a; Cheng et al., 2023). These events are characterized by sudden onset, high impact energy, and frequent occurrences, posing serious threats to the safety of residents’ lives and property (He, 2015). The Three Gorges Reservoir area in China exhibits complex and variable geological conditions, strong tectonic activity, intricate geomorphological evolution, sensitive climate changes, and the development of high and steep terrain (Zhang et al., 2024). These factors collectively create favorable conditions for hazardous rock collapses (Zhang Q. et al., 2021). During such events, the collapsed debris move along the slope surface, erodes sliding bed along its path. The volume of the debris accumulates, causing severe damage to everything it encounters and generating a series of cascading hazards. Table 1 lists catastrophic rock collapse events worldwide in recent years, which have resulted in significant losses for local populations.
Due to the complexity of the movement of the unstable mass and the limitations of research methods, these phenomena are primarily studied through field surveys and remote sensing imagery. The duration of rock collapse events is brief, making it challenging to observe the entire movement process comprehensively. To analyze rock collapse movements, many scholars predominantly employ physical models and numerical simulation methods. (Hunger and Morgenstern, 1984; Liu et al., 2023; Xiao et al., 2023). Several scholars have investigated the dynamic characteristics of particle flow during rock collapse events using open channel flow experiments (Pollet and Schneider, 2004; McClung, 2001; Friedmann et al., 2006). Zeng (2022) studied the dynamic response characteristics and stability of typical dangerous rock masses in the Three Gorges Reservoir area through shaking table model tests. Wang et al. (2020) focused on columnar dangerous rock masses along the banks of the Three Gorges Reservoir, conducting experiments with a generalized physical model at a 1:300 scale to determine the failure mode, deposits characteristics, and surge height. Zhang et al. (2021b) performed physical tests on surges caused by the collapse of particle columns, finding that the failure mode of dangerous rock masses is similar to the composite collapse-sliding movement observed in the physical models. Saghir (2021) analyzed the geometry, collapse points, and collapse range of Chalk cliffs based on field investigations, and then predicting the size and endpoint of rockfalls under extreme conditions using the Dips program. Hungr and Evans, (2004) established a scale and frequency curve as a theoretical basis for risk assessment. Pradhan, 2010 selected ten influencing factors, such as slope, aspect, rainfall, and proximity to rivers, to evaluate the risk of collapse. Zhang XL. et al. (2023) used RAMMS Rockfall software to conduct three-dimensional numerical simulations of the collapse movement process of high-level dangerous rock masses, assessing the risk of geological disasters in the collapse area. Zhang YG. et al. (2023) analyzed the catastrophic characteristics and movement laws of ultra-high dangerous rock masses using RocPro3D. Huang et al. (2024a) studied the selection and optimal combination of conditional factors and the influence of random errors on the prediction of sliding bodies.
Existing numerical simulation research primarily focuses on the back analysis of specific cases, with limited studies addressing the prediction of dynamic processes in recurrent disasters and dangerous rock surges in similar areas. When an unstable rock mass collapses, continuous deformation may occur in multiple adjacent deformation zones, posing serious threats to the safety of lives and property in the vicinity. For instance, following two dangerous rock collapses on the Fenghuangshan mountain in Wuxi, numerous unstable rock masses remain on the slope. If these rock masses were to collapse, they would once again endanger the lives and property of nearby residents. This paper takes the collapse of dangerous rock in Fenghuang Mountain, Wuxi County, Chongqing as an example. Firstly, the back analysis of the rock collapse event in Fenghuang Mountain, Wuxi, Three Gorges Reservoir area in 2017 was carried out by numerical modeling Then, the well calibrated model were used to assess the whole failure characteristics and dynamic processesof potential rock collapses. Lastly, the wave height from the surge caused by potential rockfall entering the Daning River was calculated by a semi-empirical model. This research offers a novel approach and methodology for assessing the risk of such hazardous events in similar geological setting globally.
2 Analysis of deformation and failure mechanism
2.1 Engineering geological conditions of the study area
Fenghuang Mountain dangerous rock belt is located in Wuxi County, Chongqing (Figure 1). It is located on the left bank of the Daning River and features a low-mountain canyon landform shaped by structural dissolution erosion. The elevation ranges from 197.23 to 452.46 m, with a relative height difference of 255.23 m. The study area is characterized by a developed syncline structure, which strikes approximately 102°. The rock formation surfaces on the north wing of the syncline have orientations of 190°–230° with dips ranging from 35° to 60°, while those on the south wing have orientations of 350°–30° with dips ranging from 22° to 50°. The overall slope exhibits a combination of steep and moderately steep sections, forming an ‘L' shape in the plane view.
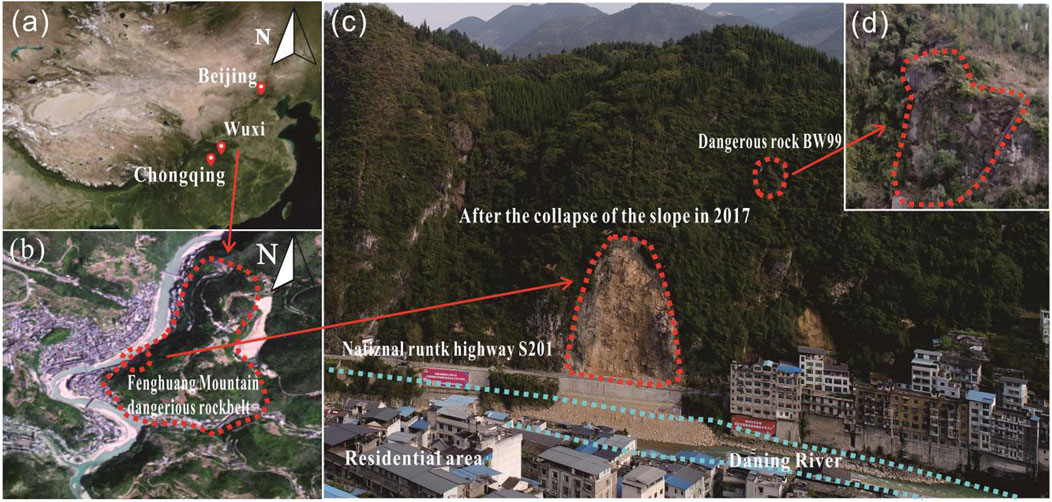
Figure 1. General map of dangerous rock mass in Fenghuang Mountain: (A) Geographical position, (B) General situation of dangerous rock engineering geology, (C) Location of dangerous rock zone, (D) Physical picture of BW99.
The exposed strata in the study area are Quaternary Holocene artificial miscellaneous fill layer (Q4ml), alluvial-diluvial layer (Q4al+pl), residual slope layer (Q4el+dl), colluvial layer (Q4col+dl), Triassic Jialingjiang Formation (T1j), and the exposed bedrock is mainly limestone. The karst development in the study area is evidently influenced by lithology, geological structure, and topography. Fenghuang Mountain has undergone extensive dissolution and erosion over time, resulting in a diverse array of surface and subsurface karst features. These features primarily include karst ditches, troughs, holes, caves, and vertical pipelines. Such formations create conditions conducive to the deformation and failure of hazardous rock.
2.2 Deformation and failure mechanism
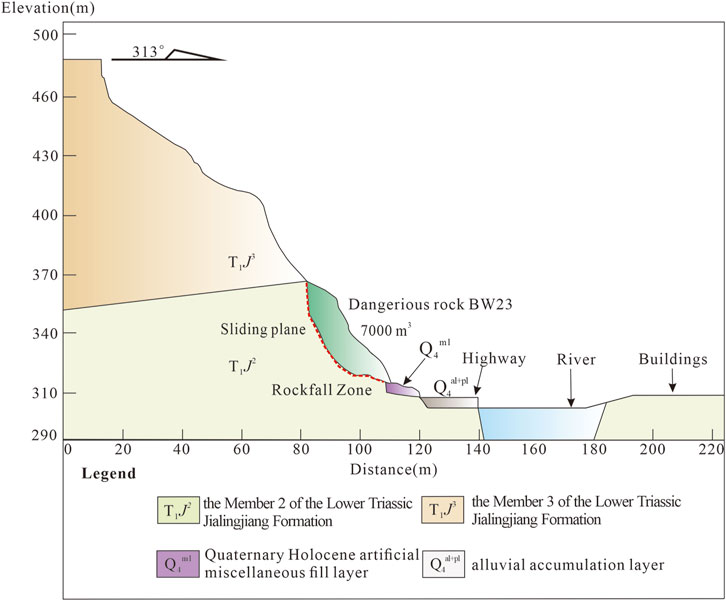
From October 7 to 8, 2017, Wuxi County experienced continuous rainfall. The infiltration and erosion caused by the rainfall increased both hydrostatic and hydrodynamic pressures within the dangerous rock mass, leading to the formation of instantaneous high-pressure heads in the developed fractures. This process resulted in wedge splitting, accelerated fracture expansion, and ultimately compromised the stability of the rock mass. Rainwater infiltration softened the filler material within the structural planes, reduced the normal stress on these weak planes, and decreased the shear strength of the rock mass. When the water pressure within the fractures exceeded the normal stress, the rock mass failed. In the BW23 dangerous rock mass, clay filling was present in the cracks of the back wall and bottom surface. The swelling force generated by the liquefaction of this clay further destabilized the rock mass, promoting collapse and instability. The engineering geological profile of the BW23 dangerous rock mass is shown in Figure 2.
Investigations of the study area revealed that the slope structure type in the collapse and landslide zones is tangential. The trend of the dangerous rock mass intersects the slope direction, and there is a free surface in both the apparent and true dip directions of the slope. Due to the unloading effect, redistributed stress formed tensile cracks in the unloading area of the slope, which combined with other cracks and the main control surface of the rock mass. Under the influence of overlying gravity, a layered fracture surface gradually formed. Once the vertical fractures penetrated the layer, shear failure occurred at the base of the rock mass. Additional vibrations or external forces could then cause the rock mass to separate from the parent body and either slide or collapse.
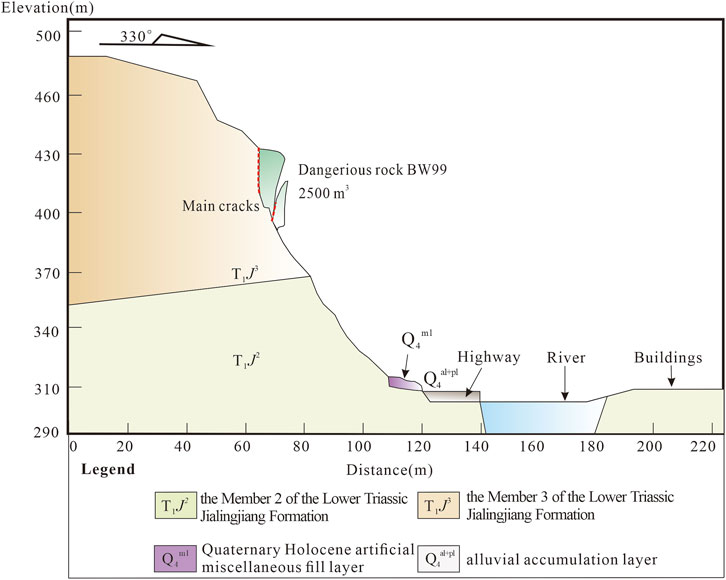
Following the 2017 collapse of the dangerous rock in Fenghuang Mountain, the surrounding area of the slip zone continued to deform, with some rock masses showing a tendency to collapse. The BW99 dangerous rock mass, located above the sliding area, has a total volume of approximately 2,500 m³. There are roads and numerous residential buildings below, posing potential hazards. Field investigations revealed that the BW99 rock mass has a polyhedral shape, with rock occurrence at 30°∠40°, slope inclination at 313°, leading edge inclination of the dangerous rock at 80°, and a collapse direction of 330° (Figure 3). The rock mass is cut into polyhedrons by extroverted structural fractures, with free sides and gully terrain on both sides. During rainfall, surface and subsurface water easily accumulate and scour, driving debris to slide. The trailing edge fractures are rough, generally flat, and wide, controlled by two sets of structural planes. The cracks in the perilous rock are well-developed, with plant roots further exacerbating the situation. Under the influence of precipitation, weathering, earthquakes, gravity, and human activities, these cracks can gradually expand until they penetrate the weak basement, leading to deformation and instability failure.
3 Back analysis of the rock collapse event
3.1 Introduction to RAMMS software
The RAMMS software, developed by the Swiss Federal Institute for Snow and Avalanche, is designed to simulate the entire evolution of geological events such as avalanches, rock avalanches, debris flows and shallow landslides (Christen M et al., 2010). The software‘s three-dimensional terrain simulation function covers the whole process from initial rupture to final deposition. The DEBRIS-FLOW module has the ability to predict the spatial distribution characteristics of the movement path, velocity, depth and pressure of the collapse debris flow, which provides a powerful tool for the numerical simulation of the dynamic state of the debris flow and significantly promotes the development of the field of geological disaster analysis.
The RAMMS model regards the debris flow as a fluid with rheological properties. The Voellmy-Salm rheological continuum model is used to deal with its rheological behavior. The movement and accumulation process of the debris flow are simulated by the principle of motion conversion between matter and energy. In addition, the model also introduces a stochastic kinetic energy model to adjust and analyze the dynamic changes of parameters to provide accurate simulation results.
The motion characteristics of debris flow are represented by two main parameters: debris flow depth H (x, y, t) and flow velocity V (x, y, t) (Dai Z et al., 2023).
The flow depth expression is as follows:
In the formula: H represents the height of the fluid; Q is the mass source. When Q = 0, there is no material deposition.
The flow velocity expression is as follows:
In the formula:
The frictional resistance of the Voellmy-Salm rheological model is determined by the following formula:
In each formula: x, y, z are the plane coordinates x, y and elevation z in the Cartesian coordinate system; h is the depth of debris flow; v is the average velocity of debris flow;
The RKE model can adjust and correct the simulation process of debris flow in real time with the change of time. Due to the disorder of fluid velocity direction, the RKE model divides the velocity V into average velocity and instantaneous velocity. The velocity in x and y directions is the vector sum of average velocity and instantaneous velocity, and the average velocity in z direction is set to 0, so as to better show the real-time motion characteristics of debris flow. The friction coefficient and turbulence coefficient play an important role in the RKE model (Bartelt P et al., 1999).
The expression of the friction coefficient
The expression of the turbulence coefficient
In the formula:
3.2 Back analysis of the rock collapse event in 2017
In order to accurately describe the collapse process of dangerous rock in Fenghuang Mountain, the numerical model method was used to invert the 2017 event and check the relevant calculation parameters and calculation model. Then, the same set of parameters and models are used to calculate the BW99 of the dangerous rock mass and predict its movement and failure process.
Based on UAV aerial image data, a digital elevation model (DEM) with a resolution of 0.98 m was established. After importing it into RAMMS software, the grid size was set to 5 m, and the watershed range and collapse area were delineated. According to the actual situation, the source thickness was assigned, the simulation parameters were adjusted, and the flow curve was generated by the three-point method.
According to the field investigation, after the instability of the dangerous rock, the extrusion collision with the lower rock mass leads to the disintegration of the dangerous rock to form a collapse debris flow. Under the action of gravity, the collapse debris flow moves downward along the slope, and the collapse debris flow slides to the highway, causing serious impact damage to the highway pavement. About 3,500 m3 collapse body is fan-shaped and accumulates on the road surface. About 3,500 m3 collapse body enters the Daning River at high speed. The maximum thickness of the simulated collapse accumulation is 4.48 m, which is basically consistent with the actual trajectory, accumulation range and accumulation thickness in 2017. Therefore, it is of high accuracy and reliability to use the calculation model and parameters (Table 2) to invert the dangerous rock collapse events that occurred in 2017.
3.3 Dynamic process of rock collapse
In the 2017 perilous rock collapse event, the depth of the collapse debris flow at t = 0 s, 2.5 s, 5 s, and 10 s is as shown in Figure 4. When t = 0 s, the collapse debris flow of perilous rock has not yet begun to slide, and the depth of the collapse debris flow at this time indicates the thickness of the rock and soil on the surface of the perilous rock. At the end of the start-up area, especially in the collapse area, the phenomenon of collapse and slope slip is particularly obvious, and a large amount of loose rock and soil accumulates, making the source thickness of this area larger. When t = 1.5 s, the front end of the collapse debris flow reaches the outlet position through the circulation area, and begins to drive a large amount of loose rock and soil materials in the collapse area to move downward, and forms a small amount of rock and soil accumulation in the narrow part of the accumulation area. When t = 2.5 s, the main body of the dangerous rock and the lower rock mass are squeezed and collided, resulting in the disintegration of the main body of the dangerous rock and the conversion of the debris flow. The generated debris flow rushes out of the circulation outlet to the highway pavement, resulting in damage to the highway pavement. When t = 5 s, the collapse debris flow continues to move along the slope. After being blocked by the road surface, the debris flow accumulates and diffuses around the highway in a fan shape. At this time, the highway traffic about 30 m below the collapse area has been completely paralyzed. When t = 8 s, the main body of the collapse has basically disintegrated, and a large amount of rock and soil debris is accumulated on the road surface, and some of the collapse debris flows out of the road into the Daning River. When t = 10 s, the collapse debris flow stops moving, and the depth formed at this time is the thickness of the debris accumulation. The maximum accumulation thickness reaches 2.36 m. About 50% of the total amount of collapse debris flows into the Daning River, which is basically consistent with the actual movement loss of the collapse body.
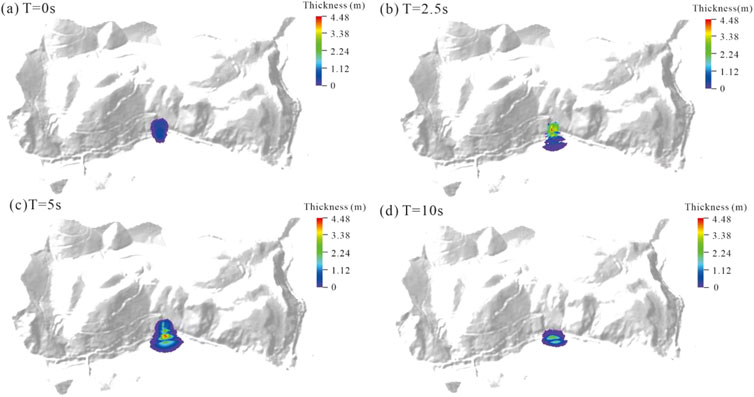
Figure 4. The computed thickness variation of debris accumulated from the rock collapse: (A) The collapse area began to collapse locally, (B) The collapse of dangerous rock produced debris flow out of the outlet, (C) The debris flow continues to move and accumulates along its path, (D) The debris flow front breaks off the road and enters the Daning River.
The 2017 perilous rock collapse event is about 10 s in the whole process of perilous rock collapse, and the farthest horizontal movement distance is about 85 m (Figure 5). It is assumed that the velocity at the beginning of the collapse is 0 m/s, and the front and rear edges of the collapse body begin to move at the same time. In the start-up stage, due to the extrusion of the middle part of the source and the friction of the slope surface, the velocity of the leading edge and the trailing edge increased sharply within 0–1 s, and the energy accumulation inside the dangerous rock was released in large quantities, with the maximum velocity of 9.14 m/s. When t = 2.5 s, the unstable rock collapses and produces debris flow, and the front edge rushes out of the slope toe. In the circulation stage, the average velocity is 7.42 m/s in 2.5 ∼ 8s. When t = 5 s, the front edge is smooth, the front edge velocity reaches 9.05 m/s, and the rear edge velocity reaches 7.31 m/s. When t = 8s, a large amount of debris flow accumulates on the road surface, and the movement speed slows down as a whole. The rear edge movement speed drops to 1.34 m/s, and the front edge speed drops to 2.47 m/s. In the accumulation stage, a large amount of rock and soil debris is accumulated on the road surface within 8–10 s, and the velocity of the trailing edge is attenuated to 0 m/s. Some rock and soil debris rushes out of the river embankment, and the leading edge debris enters the Daning River at an average speed of 4.80 m/s. When t = 10 s, the leading edge debris moves to the horizontal farthest distance of about 85m, and the collapse stops (Figure 6).
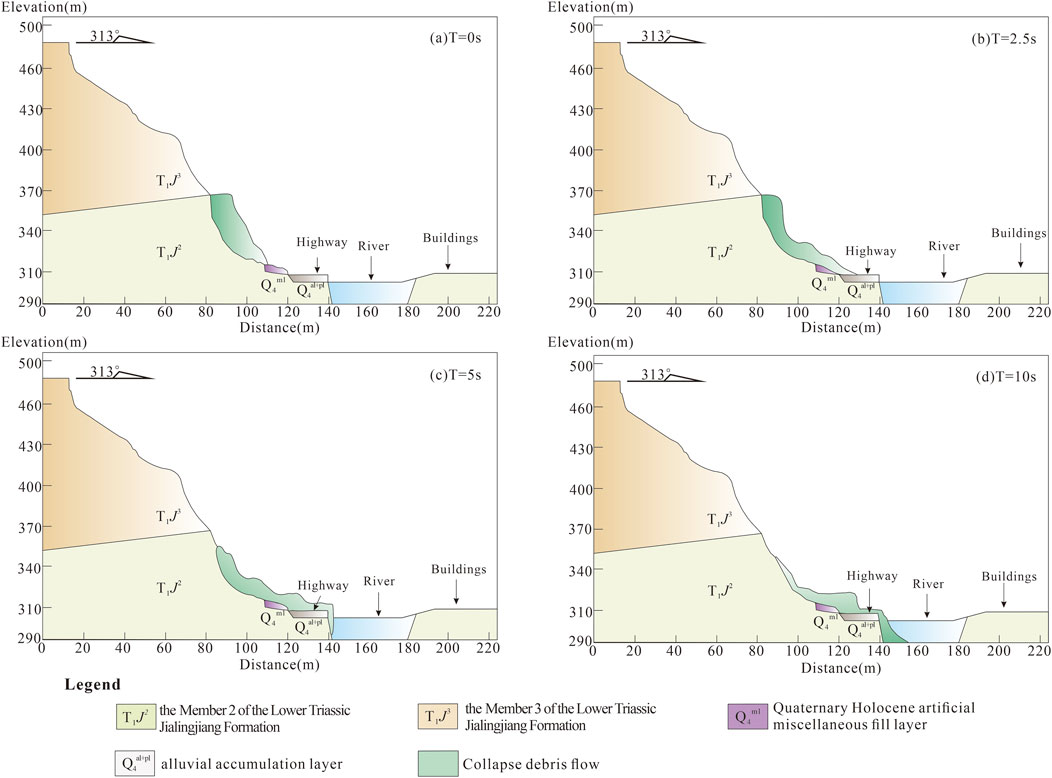
Figure 5. Profile of the rock collapse BW23: (A) The dangerous rock is in an unstable state, (B) The collapse debris flow moves rapidly along the slope, (C) The collapse debris flow is caused by the front of accumulation at the foot of slope breaking off the road surface, (D) The collapse debris flow accumulates in large quantities on the road surface and the front enters Daning River and accumulates.
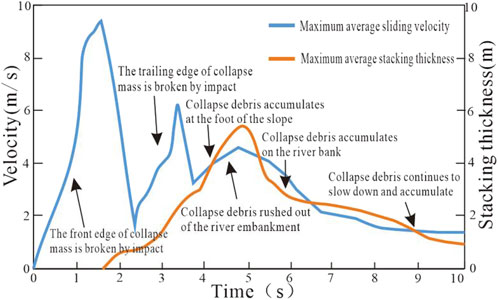
Figure 6. Curve of maximum average velocity and maximum average deposit thickness of the collapse in 2017.
4 Risk assessment of the potential dangerous rock mass
Using the well calibrated numerical model, risk assessment of the dangerous rock mass BW99 with the largest scale and the strongest deformation is carried out. The thickness of accumulated debris at each time of BW99 collapse is shown in Figure 7. The total time of collapse debris flow movement of BW99 dangerous rock mass is 15 s, and the total distance of movement level is 83 m (Figure 8). At the beginning of the collapse, due to the sudden fall of the rock mass instability, the initial velocity accelerated rapidly from zero. Due to the high altitude of the dangerous rock mass and the free space below, the velocity of the main body of the collapse increased sharply in 0–2.5 s. Under the action of gravity, the rockfall accelerates along the slope, and the slope gradually increases, and the acceleration of rockfall is more significant. When t=3 s, the rock and soil debris rushed out of the toe of the slope and entered a relatively flat accumulation section. At this time, the velocity reached a maximum of 33.83 m/s, and some rock and soil debris began to accumulate at the toe of the slope in a fan shape. In 3–5 s, the rockfall is blocked by the ground, and the resistance increases continuously, and the rock and soil avalanche speed decreases in fluctuation. When t=9 s, the rockfall rolls on the road, and the rolling deceleration is affected by the increase of friction force. Then the rock and soil rush out of the river embankment and rush out of the river embankment at a speed of about 10.05 m/s into the Daning River channel. When t=15 s, the maximum horizontal distance of the landslide body is 83 m, the maximum average accumulation thickness in the whole process of movement is 2.20 m, the front edge velocity is reduced to 0 m/s, and the collapse stops (Figure 9).
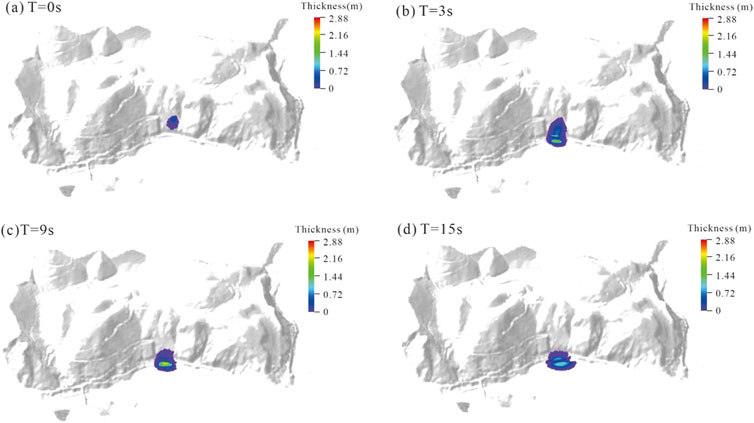
Figure 7. The thickness of the collapse accumulation debris of BW99 dangerous rock at each time point: (A) The dangerous rock is in an unstable state, (B) The dangerous rock mass breaks apart and generates debris flow down the slope, (C) Debris flow continues to accumulate on the road surface, (D) The accumulation area of debris flow at slope foot and road surface expands.
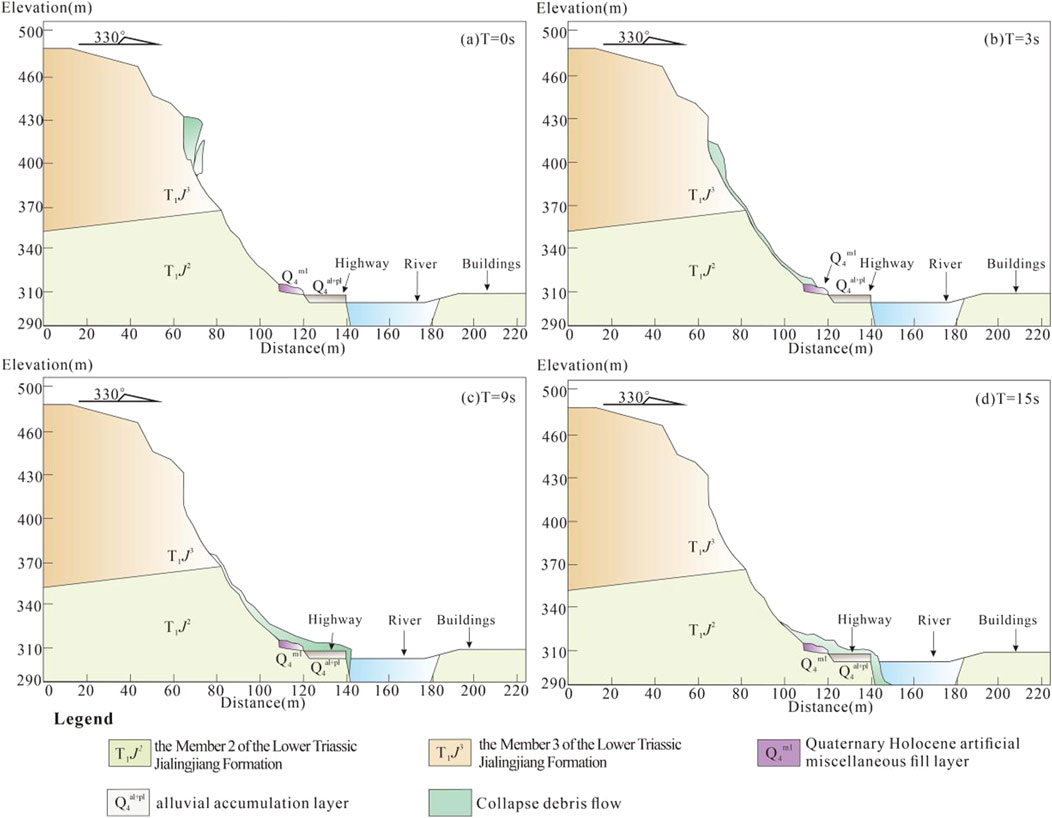
Figure 8. Profile of the rock collapse BW99: (A) The critical rock fissure runs through the foundation in an unstable state, (B) The debris flow travels rapidly along the slope, (C) The debris flow accumulates at the foot of slope and road surface and rushes into Daning River at the front, (D) The deposit thickness at the back margin of the collapse debris flow increased and the front accumulated at the bottom of Daning River.
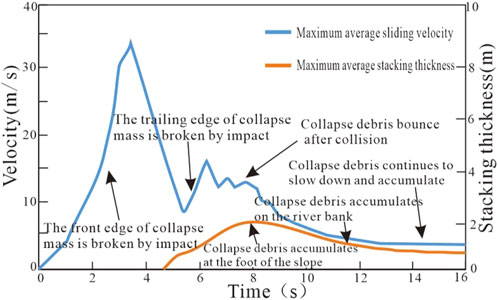
Figure 9. Curve of the maximum average collapse velocity and maximum average accumulation thickness of dangerous rock BW99.
From the accumulation of dangerous rock after collapse, after t=15 s, there are still high-density collapse debris left at the foot of the collapse area to form a fan-shaped accumulation area, and the maximum average accumulation thickness in the whole process of movement is 2.20 m. When t=15s, although the collapse debris has not completely stopped moving, the movement speed is basically lower than 0.4 m/s at this time, and the speed of the leading edge debris after entering the river channel is lower than 0.1 m/s. In the subsequent accumulation process, the shape of the accumulation body still has dynamic micro-adjustment, and the accumulation shape has been basically formed at this time. At this time, about 70% of the total collapse body and geotechnical debris accumulate at the foot of the slope, road surface and river bank. After the collapse of the main body and the road surface, the debris diverges 4∼5 m around the main body, and shows the characteristics of midpoint concentration and divergence around. A large number of rock and soil debris rushed out of the highway and gathered on the bank of the river. The accumulation body continued to accumulate and eventually showed a ladder shape. About 30% of the total amount of collapse entered the Daning River.
5 Discussion
5.1 Impact force from the potential rock collapse
From February 2017 to May 2018, there have been more than 40 collapse and falling block events in the dangerous rock zone of Fenghuang Mountain, resulting in different degrees of damage to residential buildings. The impact force of rockfall is an important index to evaluate the resistance of buildings to damage. The main factors affecting the impact force include the volume, mass, impact velocity and thickness of buffer soil layer of rock and soil mass. It is particularly important to determine the impact force of rockfall in the evaluation and treatment of dangerous rock mass collapse. In this paper, the impact force of rockfall is calculated by the Japanese road corporation method, which is recognized by the industry and is in good agreement with the field test value, and the damage degree of dangerous rock mass collapse to the road is predicted.
The Japanese road corporation method is a semi-empirical and semi-theoretical method based on the test data of rockfall impact force and Hertz elastic collision theory (Japan Road Association, 2000). The complete calculation of the maximum impact force of rockfall is as follows:
In the formula: P is the rockfall impact force (kN); m is the rockfall mass (t); λ is the Lame constant, and 1,000 kN/m2 is recommended for very soft objects and 3,000–5,000 kN/m2 for soft objects; hard objects take 10,000 kN/m2. H is the free falling height of rockfall (m).
According to the field investigation, the filling weight is 18.7 kN/m3, the elastic modulus is 35 MPa, the Lame constant is 1,000 kN/m2, the Poisson‘s ratio is 0.37, and the rockfall weight is 25 kN/m3. It is calculated by Formula 9 that the collapse of dangerous rock BW99 produces an impact force of 4724.2 KN, and the road will be seriously damaged and the road will be interrupted.
5.2 Risk assessment of potential wave surge
The prediction and analysis of the maximum amplitude of the first wave is one of the most critical parts in the study of the collapse surge. (Qin, 2023). The predicted value has important theoretical and guiding significance for the prediction and disaster prevention and mitigation of the collapse surge of the dangerous rock in the reservoir area. Huang Bolin et al.proposed the first wave eigenvalue calculation equation (Huang BL et al., 2012).
The calculation formula of surge amplitude generated by the whole water entry of dangerous rock mass is as follows:
In the formula: a is the amplitude; h is the water depth; v is the water entry speed of the slumped mass; b is the width of slumped mass; s is the thickness of slumped mass; l is the length of slumped mass.
In this paper, taking the instability and collapse of dangerous rock mass in Fenghuang Mountain of Wuxi as an example, the maximum amplitude of surge caused by the collapse of dangerous rock mass is calculated by Formula 10. The Fenghuang Mountain collapse body is located in the Wuxia section of the Three Gorges Reservoir area, and the rock mass is a fractured layered structure. After the collapse occurred, through on-site investigation, on 8 October2017, through the measurement of the total station on the water, the exposed fresh surface was nearly fan-shaped; the amount of unstable collapse is about 7,000 m3, the upper part is 13 m wide, the water surface is 22 m wide, and the longitudinal length of the collapse body is 24 m. The upper part of the slope is 64°, the lower part is 44°, and the impact angle of the landslide into the water is about 70°. After comparing and calculating the terrain before and after, the sliding direction is 313°, the average thickness is 2.2 m, and about 3,500 m3 landslide body enters the Daning River at a speed of 10.83 m/s, with a water depth of about 10 m.
The numerical simulation of the collapse movement in 2017 shows that about 50% of the total amount of collapse debris accumulates at the foot of the slope, the road surface and the river bank, and about 50% of the collapse debris pours into the Daning River, which is basically consistent with the actual situation. Considering the volume reduction, the surge amplitude of 2.38 m is calculated by Formula 10, which is basically consistent with the real situation. Similarly, the whole process of the collapse of the dangerous rock BW99 is broken and dispersed, and the accumulation volume is about 1750 m3, accounting for 70% of the total volume of the collapse. After considering the volume reduction in the process of the collapse of the dangerous rock, according to Formula 10, it is calculated and predicted that the rock and soil debris produced after the instability and collapse of the BW99 dangerous rock mass will enter the Daning River to produce a 1.38 m high surge.
6 Conclusion
(1) In 2017, the volume of the collapsed rock mass in Fenghuang Mountain was 7,000 m³, and the failure mode was toppling slip failure. Post-collapse, an unstable rock mass BW99 remains on the slope with a volume of approximately 2,500 m³. Field investigations and monitoring data indicate that BW99 is prone to collapse under heavy rainfall conditions, with a failure mode similar to that observed in 2017.
(2) The RAMMS software was utilized to back-analyze the 2017 rock collapse event in Fenghuang Mountain. The computed results were consistent with the observed. The back-analysis showed that the collapse process lasted approximately 10 s, with a total horizontal movement distance of about 85 m, a maximum movement speed of 9.14 m/s, and a maximum accumulation thickness of 4.53 m. Predictions for the BW99 rock mass indicate that the debris flow movement lasted 15 s, with a maximum horizontal movement distance of about 83 m, an average maximum speed of 33.83 m/s, and a maximum accumulation thickness of 2.20 m. Upon reaching the highway, the collapsing rock entered the Daning River at a speed of 10.05 m/s.
(3) The impact force from the potential rock collapse BW99 on the road has been calculated to be approximately 4724.2 kN using a semi-empirical model. It is anticipated that the road surface will be severely damaged, leading to traffic interruptions.
(4) Taking the 2017 collapse event in Fenghuang Mountain as a case study, this paper thoroughly considers the characteristics of fragmentation, dispersion, and accumulation throughout the movement process of the dangerous rock on the bank slope post-collapse. The debris flow generated from the unstable collapse of the BW99 rock mass is expected to breach the riverbank and enter the Daning River, potentially generating a maximum surge wave height of 1.38 m.
Data availability statement
The original contributions presented in the study are included in the article/supplementary material, further inquiries can be directed to the corresponding author.
Author contributions
SC: Data curation, Formal Analysis, Investigation, Methodology, Software, Validation, Visualization, Writing–original draft, Writing–review and editing, Conceptualization, Funding acquisition, Project administration, Resources, Supervision. ZD: Data curation, Investigation, Project administration, Resources, Supervision, Visualization, Writing–review and editing, Writing–original draft. AZ: Supervision, Validation, Writing–review and editing. JG: Resources, Supervision, Writing–review and editing. ZL: Data curation, Software, Visualization, Writing–review and editing. FW: Formal Analysis, Methodology, Software, Writing–review and editing. BH: Project administration, Supervision, Writing–review and editing. NZ: Methodology, Software, Writing–review and editing. XJ: Data curation, Investigation, Resources, Writing–review and editing.
Funding
The author(s) declare that financial support was received for the research, authorship, and/or publication of this article. The work was supported by a follow-up of the Geological Disaster Prevention and Control Project in the Three Gorges area (Grant Nos 0001212024CC60001 and 0001212023CC60001), Qianlong Plan Top Talent Project of Wuhan Center of China Geological Survey (Grant No. QL2022-06).
Acknowledgments
The author would like to thank Jiang Xiannian of Chongqing 2018 Survey and Design Institute for his geological survey report.
Conflict of interest
The authors declare that the research was conducted in the absence of any commercial or financial relationships that could be construed as a potential conflict of interest.
Publisher’s note
All claims expressed in this article are solely those of the authors and do not necessarily represent those of their affiliated organizations, or those of the publisher, the editors and the reviewers. Any product that may be evaluated in this article, or claim that may be made by its manufacturer, is not guaranteed or endorsed by the publisher.
References
Bartelt, P., Salm, L. B., and Gruberl, U. (1999). Calculating dense-snow avalanche runout using a Voellmyfluid model with active/passive longitudinal straining. J. Glaciol. 45, 242–254. doi:10.3189/002214399793377301
Chen, H. Q. (2018). Mountain collapse in pusa village. Zhangjiawan, Nayong, Guizhou 29 (01), 22. doi:10.16031/j.cnki.issn.1003-8035.2018.01.02
Cheng, S., Dai, Z. W., Fu, X. L., Zhang, A. L., Wang, L. Q., Zhang, C. Y., et al. (2023). Instability mechanism and debris flow dynamics of Fenghuang Mountain dangerous rock mass in Wuxi. Three gorges reservoir area. South China Geol. 39 (3), 470–481. (in Chinese). doi:10.3969/j.issn.2097-0013.2023.03.006
Dai, Z., Zhang, A., Wang, S., Fu, X., Yang, L., Jiang, X., et al. (2023). The development characteristics and mechanisms of the Xigou debris flow in the Three Gorges Reservoir Region. Front. Earth Sci. 11, 1122562. doi:10.3389/feart.2023.1122562
Friedmann, S. J., Taberlet, N., and Losert, W. (2006). Rock-avalanche dynamics: insights from granular physics experiments. Int. J. Earth Sci. 95 (5), 911–919. doi:10.1007/s00531-006-0067-9
Huang, B., Chen, X. T., Yin, Y., and Heng, Z. (2012). Study on calculation method of landslide collapse surge. J. Eng. Geol. doi:10.3969/j.issn.1004-9665.2012.06.002
Huang, F., Li, R., Catani, F., Zhou, X., Zeng, Z., and Huang, J. (2024b). Uncertainties in landslide susceptibility prediction: influence rule of different level of errors in landslide spatial position. J. Rock Mech. Geotechnical Eng. 16 (1), 213–230. doi:10.1016/j.jrmge.2024.02.001
Huang, F., Liu, K., Jiang, S.-hua, Catani, F., Liu, W., Fan, X., et al. (2024a). Optimization method of conditioning factors selection and combination for landslide susceptibility prediction. J. Rock Mech. Geotechnical Eng. 63 (1-2), 1–14. doi:10.1016/j.jrmge.2024.04.029
Hunger, O., and Morgenstern, N. R. (1984). Experiments on the flow behaviour of granular materials at high velocity in an open channel. Geotechnique 34 (3), 405–413. doi:10.1680/geot.1984.34.3.405
Hungr, S. G., and Evans, S. (2004). Entrainment of debris in rock avalanches: an analysis of a long run-out mechanism. Geol. Soc. Am. Bulletion 116 (9), 1240–1252. doi:10.1130/b25362.1
Japan Road Association (2000). Manual of the countermeasures against rockfall. Tokyo: Maruzen Publishing Co.,Ltd.
Liu, L., Xu, Y., Lian, Z. P., Pei, L. Z., Wu, J., and Li, Y. N. (2023). Study on landslides risk assessment of typical towns of southeast chongqing in wuling mountain area: a case of xialu town, shizhu county. South China Geol. 39 (3), 502–511. (in Chinese).
McClung, D. M. (2001). Extreme avalanche runout: a comparison of empirical models. Can. Geotechnical J. 38 (6), 1254–1265. (in Chinese). doi:10.1139/t01-041
Pollet, N., and Schneider, J. L. M. (2004). Dynamic disintegration processes accompanying transport of the Holocene Flims sturzstrom (Swiss Alps). Earth Planet. Sci. Lett. 221 (1-4), 433–448. doi:10.1016/s0012-821x(04)00071-8
Pradhan, B. (2010). Remote sensing and GIS-based landslide hazard analysis and cross-validation using multivariate logistic regression model on three test areas in Malaysia. Adv. Space Res. 45 (10), 1244–1256. doi:10.1016/j.asr.2010.01.006
Qin, P. (2023). Analysis of surge of Wangjiashan landslide in Baihetan Reservoir area and study on disaster reduction scheme. China Three Gorges University.
Saghir, R. (2021). ROCFALLAnalysis: the distance and size of rock fall from brighton to eastbourne. Open Access Libr. J. 1 (3). doi:10.4236/oalib.1100561
Shang, Y., Yang, Z., Li, L., Liu, D., Liao, Q., and Wang, Y. (2003). A super-large landslide in Tibet in 2000: background, occurrence, disaster, and origin. Geomorphology 54 (3-4), 225–243. doi:10.1016/s0169-555x(02)00358-6
Shugar, D. H., Jacquemart, M., Shean, D., Bhushan, S., Upadhyay, K., Sattar, A., et al. (2021). A massive rock and ice avalanche caused the 2021 disaster at Chamoli, Indian Himalaya. Science 373 (6552), 300–306. doi:10.1126/science.abh4455
Wang, J., Huang, B., Quan, Z., and Chen, X. T. (2020). Study on generalized model of collapse-accumulation characteristics of fragmented columnar dangerous rock mass. Water conservancy hydropower Technol. (2), 8. doi:10.13928/j.cnki.wrahe.2020.02.016
Wang, W., and Lin, S. (2012). Study on the variation law of dangerous rock cracks and the elimination of temperature interference in Zhangjiagou. J. Saf. Environ. 12 (03), 192–195. doi:10.3969/j.issn.1009-6094.2012.03.046
Xiao, Y. Y., Liu, J., Li, W. J., and Zhang, Y. (2023). 3D geological modeling based on multi-source data: taking binhai bay new area of dongguan city as an example. South China Geol. 39 (3), 548–557. doi:10.3969/j.issn.2097-0013.2023.03.013
Zeng, X. (2022). Study on dynamic response characteristics and stability of typical dangerous rock mass in Three Gorges Reservoir area. Chongqing University.
Zhang, C., Dai, Z., Tan, W., Yang, Y., and Zhang, L. (2021b). Multiscale study of the deterioration of sandstone in the three gorges reservoir area subjected to cyclic wetting–cooling and drying–heating. Rock Mech. Rock Eng. 55 (9), 5619–5637. doi:10.1007/s00603-022-02929-1
Zhang, C., Yin, Y., Dai, Z., Huang, B., Zhang, Z., Jiang, X., et al. (2021a). Reactivation mechanism of a large-scale ancient landslide. Landslides 18, 397–407. doi:10.1007/s10346-020-01538-9
Zhang, C., Yin, Y., Yan, H., Zhu, S., Zhang, M., and Wang, L. (2024). Centrifuge modeling of unreinforced and multi-row stabilizing piles reinforced landslides subjected to reservoir water level fluctuation. J. Rock Mech. Geotechnical Eng. 16 (5), 1600–1614. doi:10.1016/j.jrmge.2023.09.025
Zhang, Q., Huang, B., Zheng, J. H., Zhao, H. L., Feng, W. L., and Chen, X. T. (2021c). Prediction analysis of surge caused by crushing collapse of columnar dangerous rock mass. Geotech. Mech. 010, 042. doi:10.16285/j.rsm.2020.0464
Zhang, X. L., Zhang, J., Liu, T., and Li, J. (2023a). Risk assessment of single collapse based on three-dimensional numerical simulation-Taking the Zhameila Mountain in Zhangmu Port of Tibet as an example. J. Nat. Disasters. doi:10.13577/j.jnd.2023.0406
Zhang, Y. G., Yang, Y. X., Peng, X. Y., and Yu, R. (2023b). Analysis of catastrophic characteristics and motion law of ultra-high dangerous rock mass based on RocPro3D. Traffic Sci. Technol. 6, 91–96. doi:10.3963/j.issn.1671-7570.2023.06.017
Keywords: three gorges reservoir area, back analysis, ramms, dangerous rock collapse -surge, risk assessment
Citation: Cheng S, Dai Z, Zhang A, Geng J, Li Z, Wang F, Huang B, Zhang N and Jiang X (2024) Risk assessment of potential rock collapse in Fenghuang Mountain, three gorges reservoir area, China. Front. Earth Sci. 12:1497757. doi: 10.3389/feart.2024.1497757
Received: 17 September 2024; Accepted: 11 November 2024;
Published: 04 December 2024.
Edited by:
Faming Huang, Nanchang University, ChinaReviewed by:
Kun He, Southwest Jiaotong University, ChinaJiaqi Zhang, The University of Hong Kong, Hong Kong SAR, China
Copyright © 2024 Cheng, Dai, Zhang, Geng, Li, Wang, Huang, Zhang and Jiang. This is an open-access article distributed under the terms of the Creative Commons Attribution License (CC BY). The use, distribution or reproduction in other forums is permitted, provided the original author(s) and the copyright owner(s) are credited and that the original publication in this journal is cited, in accordance with accepted academic practice. No use, distribution or reproduction is permitted which does not comply with these terms.
*Correspondence: Zhenwei Dai, ZGFpemhlbndlaUBtYWlsLmNncy5nb3YuY24=
†ORCID: Zhenwei Dai, orcid.org/0000-0002-9238-9265
 Shi Cheng1,2
 Zhenwei Dai
 Anle Zhang